Meta-Research: Blinding reduces institutional prestige bias during initial review of applications for a young investigator award
- Arnold and Mabel Beckman Foundation, United States
- Health Research Alliance, United States
Figures
Figure 1 with 1 supplement
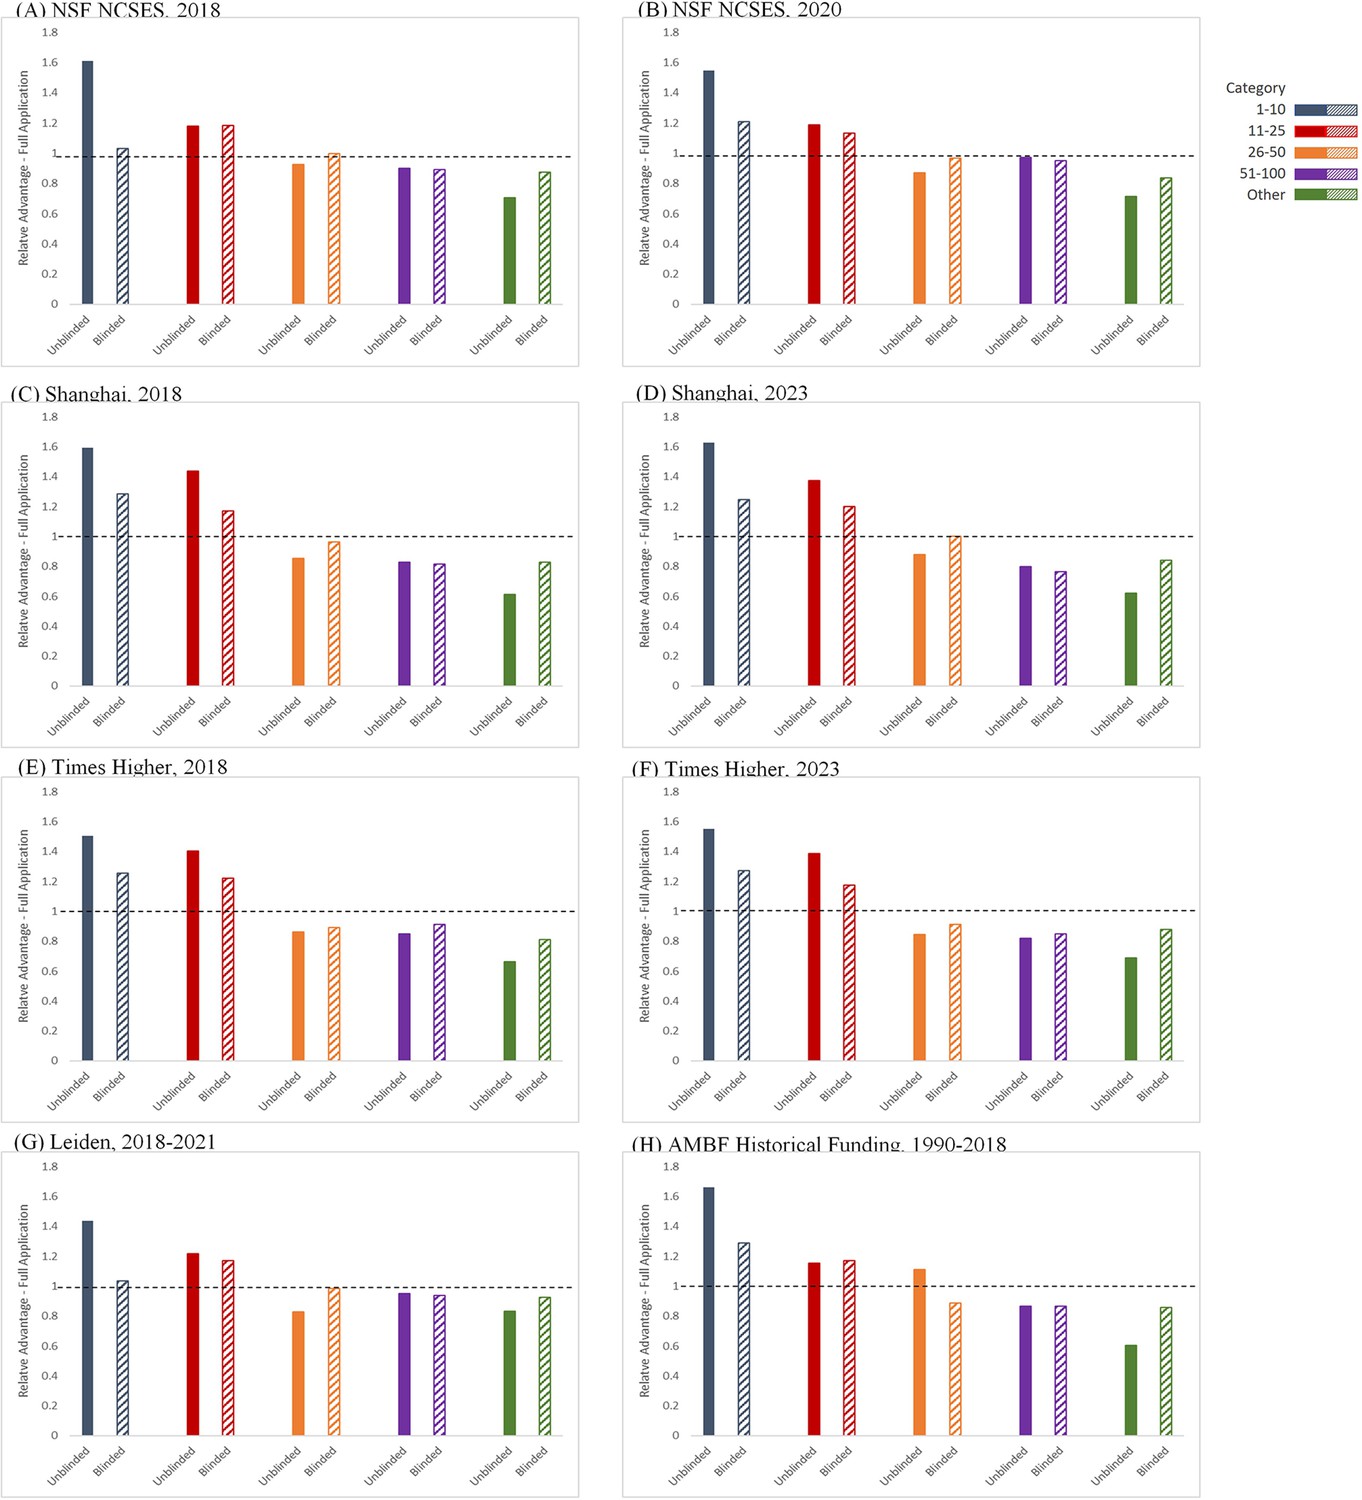
Relative Advantage–Full Application.
Ratio of the percentage of LOI applicants in different institutional categories receiving an invitation to submit a Full Application, compared to the percentage of any LOI applicant receiving an invitation to submit a Full Application during unblinded reviews (solid bars, left) and blinded reviews (hatched bars, right). The eight different institutional rankings used in the study were: (A) NCSES/NSF-2018; (B) NCSES/NSF-2020; (C) Shanghai Ranking-2018; (D) Shanghai Ranking-2023; (E) Times Higher-2018; (F) Times Higher-2023; (G) CWTS Leiden: 2018–2021; (H) AMBF historical funding: 1990–2018.
-
Figure 1—source data 1
BYI LOIs, Full Application Invitations, and Program Awards by institutional category.
All LOIs Received, Full Application Invitations, and Program Awards by institutional category from 2017 to 2020 (unblinded) and 2021–2024 (blinded).
- https://cdn.elifesciences.org/articles/92339/elife-92339-fig1-data1-v1.xlsx
Figure 1—figure supplement 1
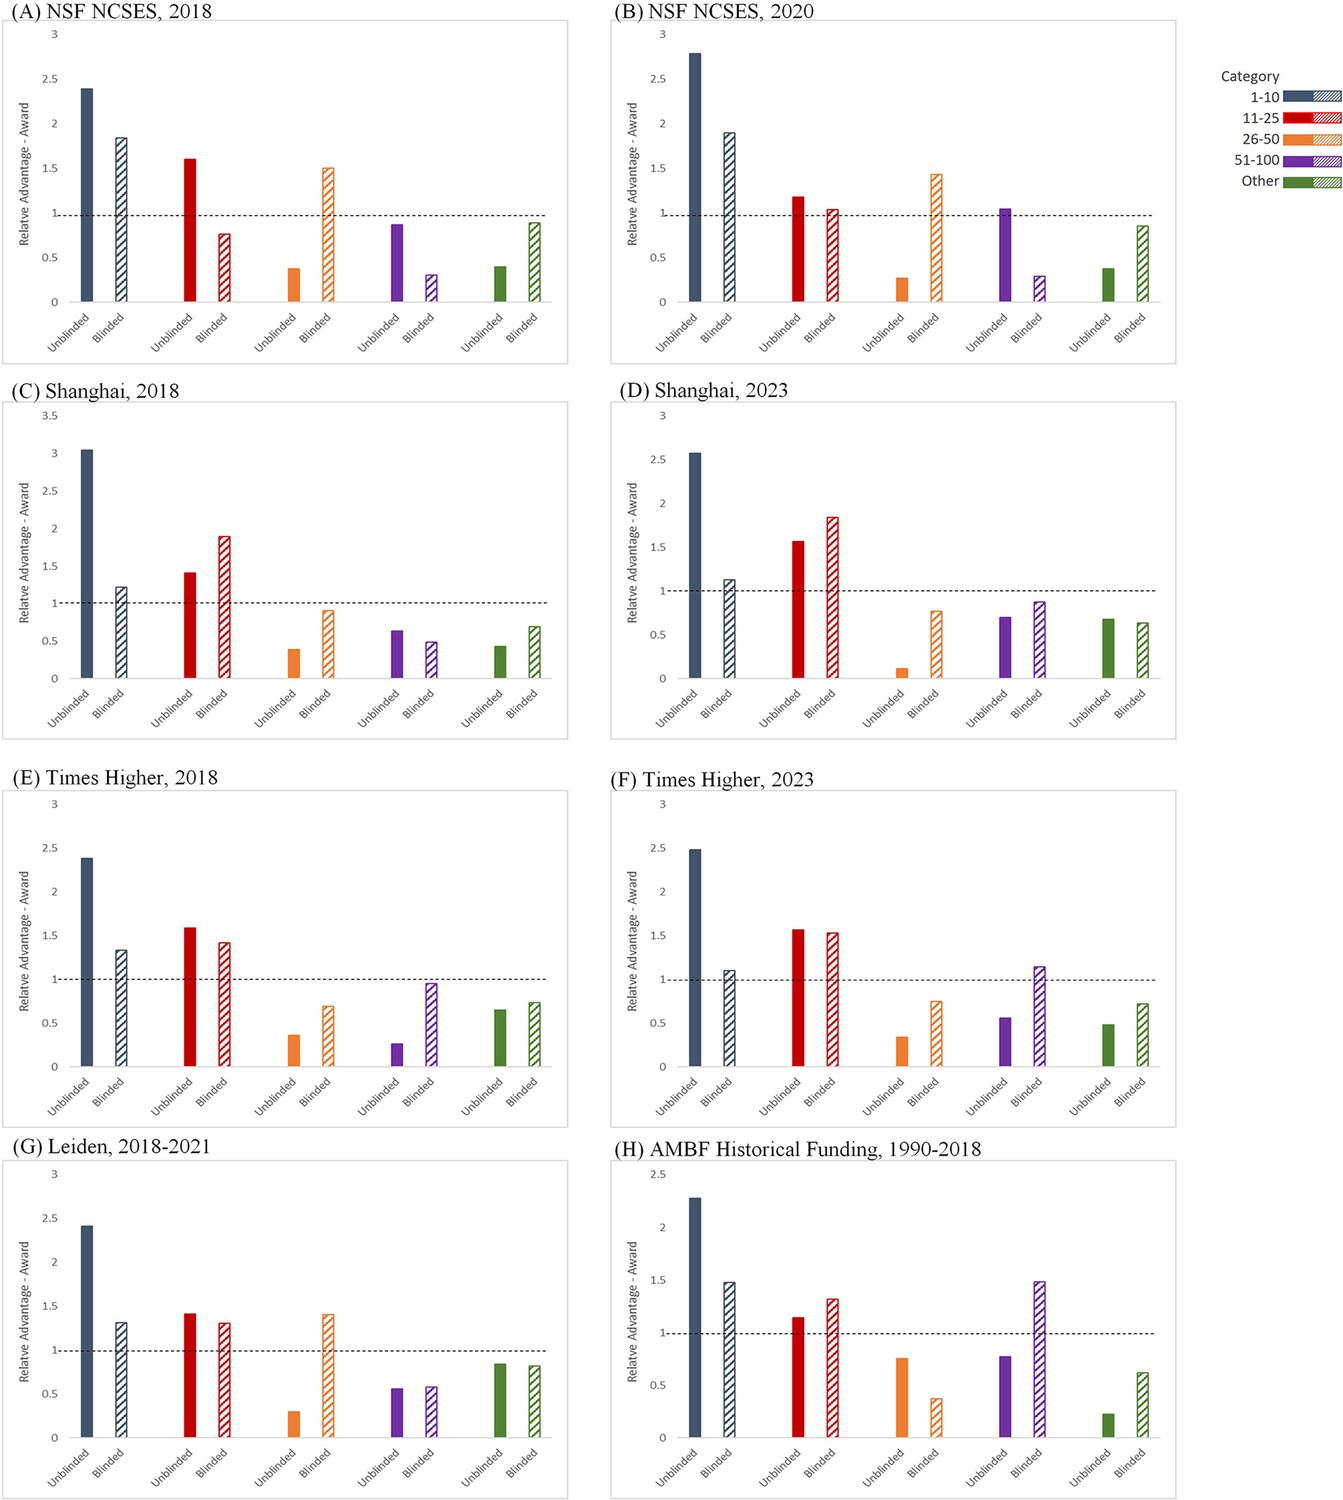
Relative Advantage–Award.
Ratio of the percentage of LOI applicants in each institutional category receiving a Program Award, compared to the percentage of any LOI applicant receiving a Program Award during unblinded reviews (solid bars, left) and blinded reviews (hatched bars, right; three years of data (2021–2023)). The eight different institutional rankings used in the study were: (A) NCSES/NSF-2018; (B) NCSES/NSF-2020; (C) Shanghai Ranking-2018; (D) Shanghai Ranking-2023; (E) Times Higher-2018; (F) Times Higher-2023; (G) CWTS Leiden: 2018–2021; (H) AMBF historical funding: 1990–2018.
Figure 2
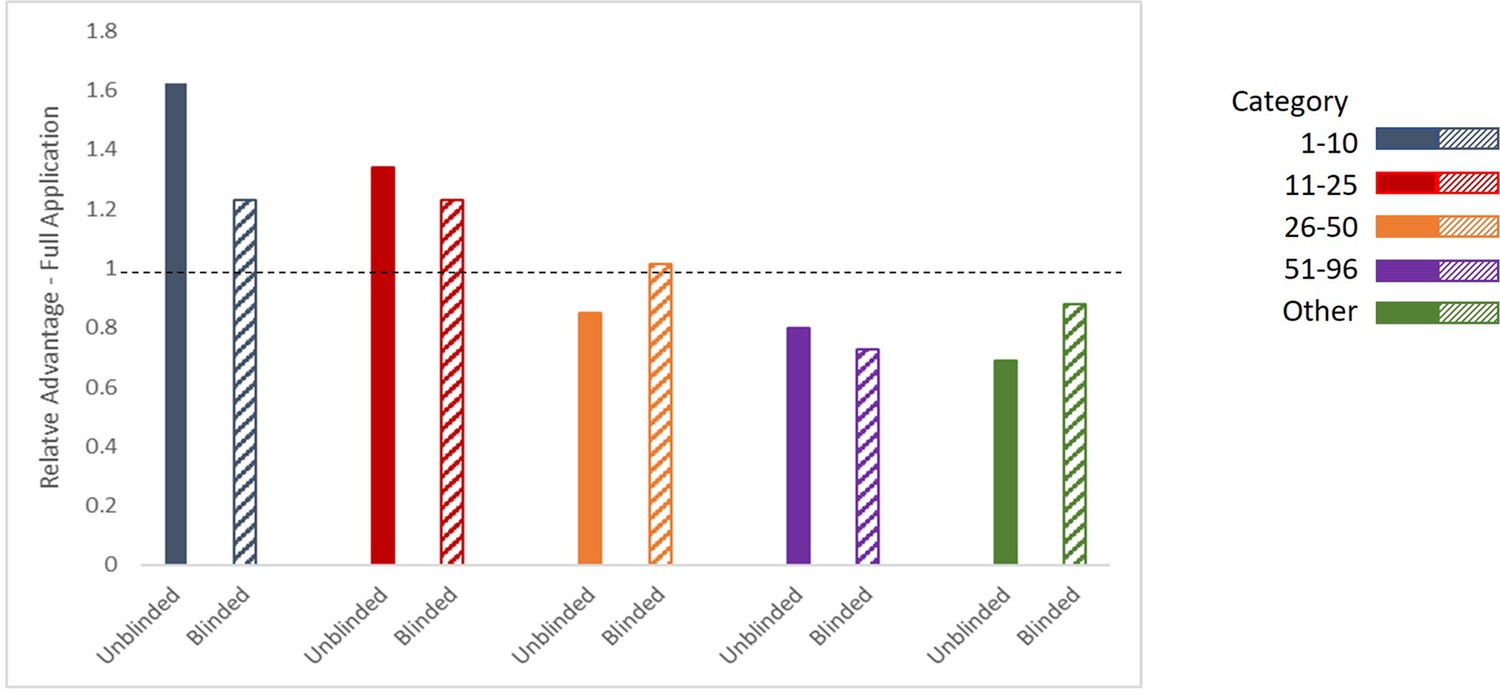
Relative Advantage–Full Application with Consensus Institutional Ranking.
Ratio of the percentage of LOI applicants in each category in the consensus listing receiving an invitation to submit a Full Application, relative to the percentage of any LOI applicant receiving an invitation to submit a Full Application during unblinded reviews (solid bars, left) and blinded reviews (hatched bars, right; three years of data (2021–2023)).
Figure 3
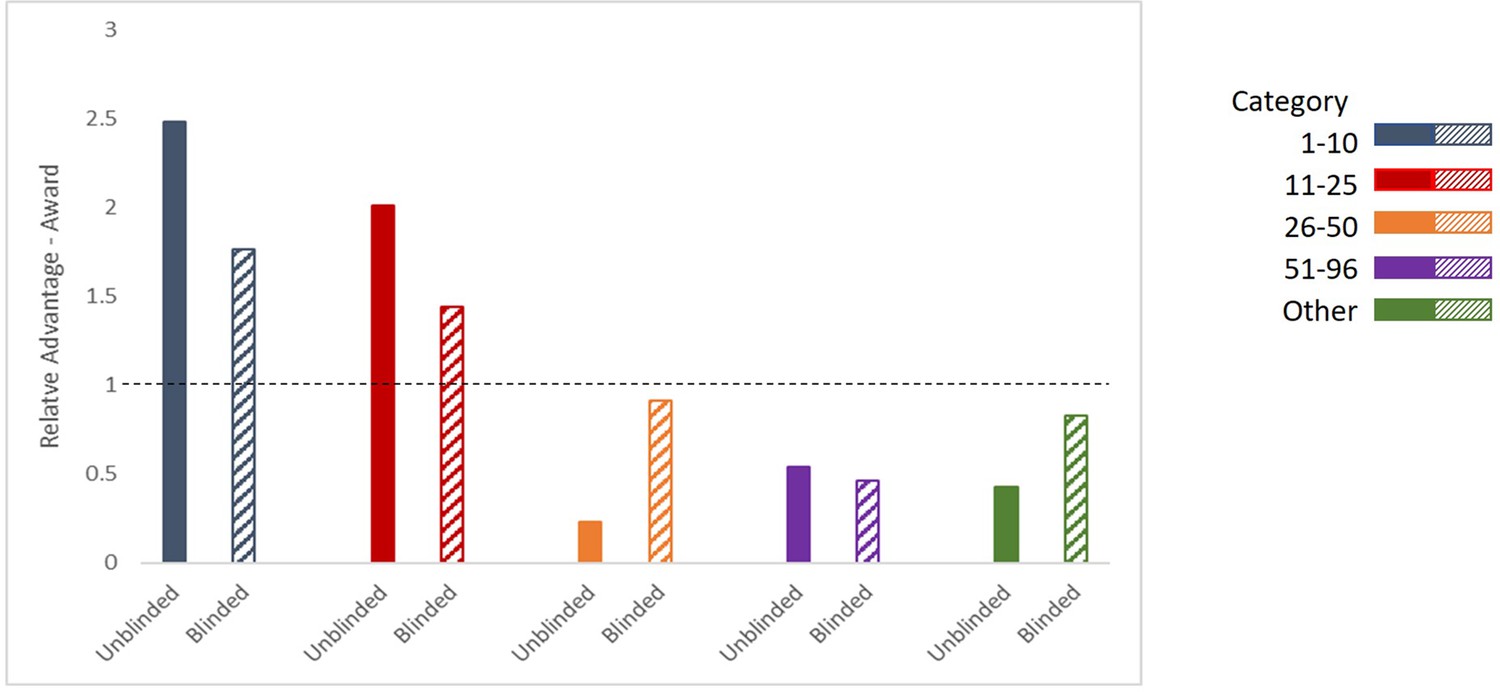
Relative Advantage–Awards with Consensus Institutional Ranking.
Ratio of the percentage of LOI applicants in each category in the consensus lisiting receiving a Program Award, compared to the percentage of any LOI applicant receiving a Program Award during unblinded reviews (solid bars, left) and blinded reviews (hatched bars, right; three years of data (2021–2023)).
Figure 4
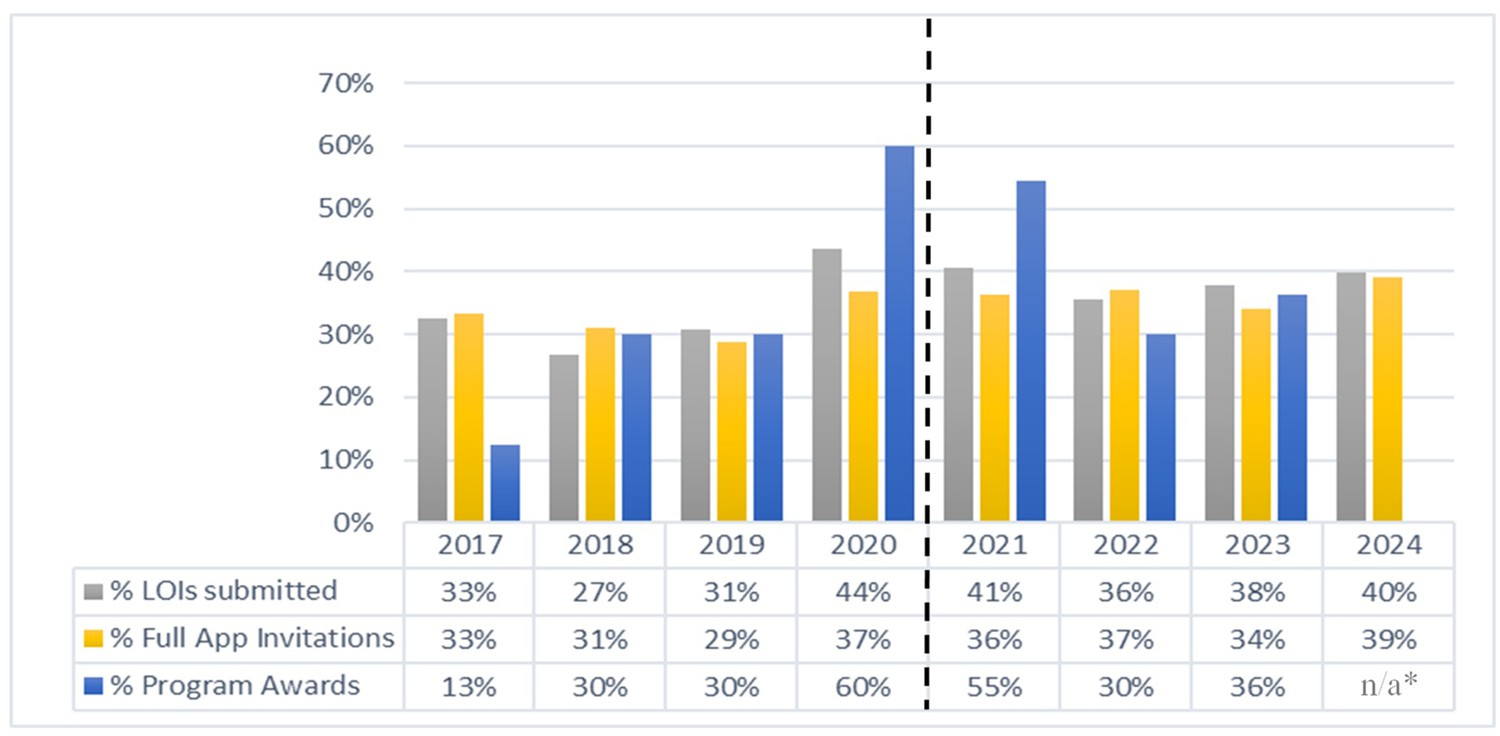
Outcomes for female applications.
Percentage of female LOI applicants to receive a Full Application invitation and Program Award by year. Between 2017 and 2020 the reviews of initial LOIs were not blinded; from 2021 onwards the reviews of initial LOIs were blinded; Program Awards for 2024 had not been finalized as of manuscript preparation.
-
Figure 4—source data 1
BYI Letters of Intent (LOIs), Full Application Invitations, and Program Awards by gender category.
All LOIs Received, Full Application Invitations, and Program Awards by gender category for 2017–2020 (unblinded) and 2021–2024 (blinded).
- https://cdn.elifesciences.org/articles/92339/elife-92339-fig4-data1-v1.xlsx
Figure 5
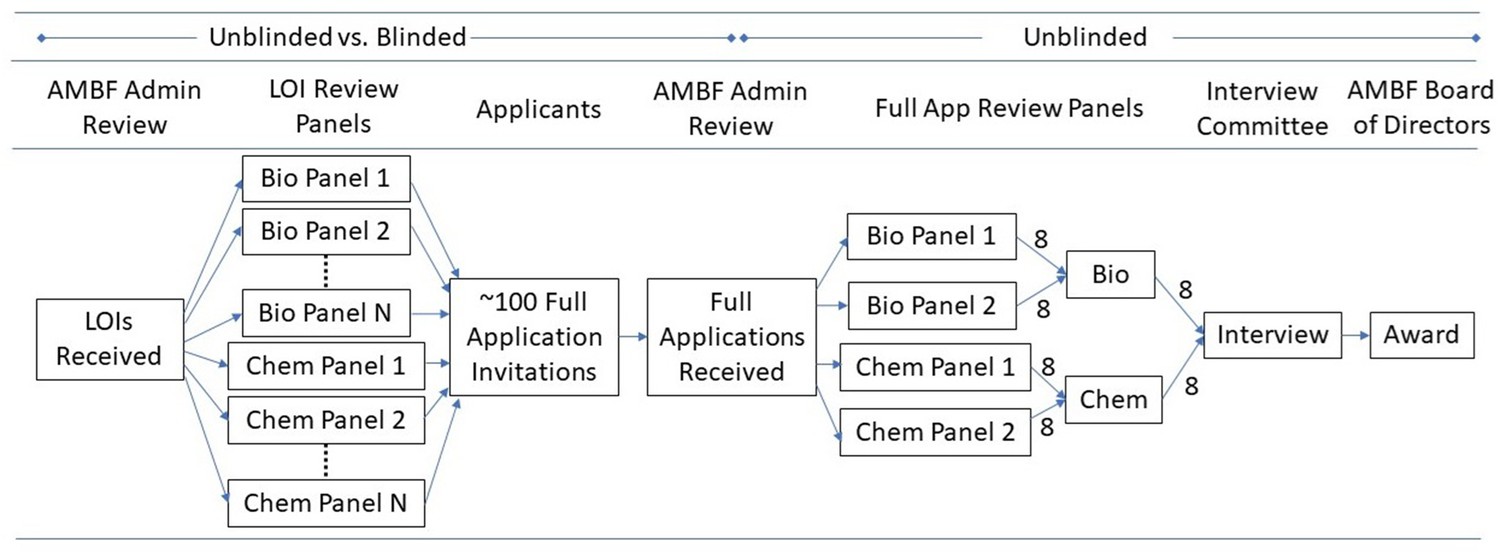
Schematic of the BYI Application Review Process.
Tables
Table 1
Numbers of Letters of Intent (LOIs), Full Application Invitations, and BYI Program Awards for 2017–2024.
| Unblinded (2017–2020) | Blinded (2021–2024) | |||||||
|---|---|---|---|---|---|---|---|---|
| Year | 2017 | 2018 | 2019 | 2020 | 2021 | 2022 | 2023 | 2024 |
| LOIs Reviewed | 316 | 351 | 405 | 293 | 256 | 230 | 194 | 246 |
| Full Application Invitations | 99 | 100 | 108 | 98 | 96 | 105 | 94 | 97 |
| Program Awards | 8 | 10 | 10 | 10 | 11 | 10 | 11 | -- |
Table 2
Relative Advantage–Full Application.
The average value and ranges by institutional category, with Chi-squared association test and Cramer’s V statistic of unblinded and blinded LOI reviews for full application invitations, for the eight institutional rankings used in the study.
| Ranked List: NCSES 2018 | Ranked List: NCSES 2020 | ||||||
|---|---|---|---|---|---|---|---|
| Category | Unblinded Average (Range) | Blinded Average (Range) | Unblinded - Blinded | Category | Unblinded Average (Range) | Blinded Average (Range) | Unblinded - Blinded |
| 1–10 | 1.6 (1.4–1.9) | 1.0 (1.0–1.1) | 0.6 | 1–10 | 1.5 (1.3–1.7) | 1.2 (1.1–1.3) | 0.3 |
| 11–25 | 1.2 (1.0–1.3) | 1.2 (1.0–1.4) | 0 | 11–25 | 1.2 (1.1–1.2) | 1.1 (0.9–1.3) | 0.1 |
| 26–50 | 0.93 (0.70–1.3) | 1.0 (0.86–1.1) | –0.07 | 26–50 | 0.87 (0.63–1.3) | 0.97 (0.86–1.1) | –0.1 |
| 51–100 | 0.90 (0.66–1.1) | 0.89 (0.79–0.95) | 0.01 | 51–100 | 0.97 (0.65–1.2) | 0.95 (0.89–1.0) | 0.02 |
| Other | 0.70 (0.60–0.82) | 0.87 (0.69–1.1) | –0.17 | Other | 0.71 (0.61–0.82) | 0.84 (0.65–0.99) | –0.13 |
| Analysis | Unblinded | Blinded | Unblinded - Blinded | Analysis | Unblinded | Blinded | Unblinded - Blinded |
| Chi-squared | 48.64 | 9.47 | 39.17 | Chi-squared | 44.9 | 10.35 | 34.55 |
| p (d.f.=4) | 6.95E-10 | 0.0503 | p (d.f.=4) | 4.17E-09 | 0.0349 | ||
| Cramer’s V | 0.19 | 0.1 | 0.09 | Cramer’s V | 0.18 | 0.11 | 0.07 |
| Effect Size | Medium | Small | Effect Size | Medium | Small | ||
| Ranked List: Shanghai Ranking 2018 | Ranked List: Shanghai Ranking 2023 | ||||||
| Category | Unblinded Average (Range) | Blinded Average (Range) | Unblinded - Blinded | Category | Unblinded Average (Range) | Blinded Average (Range) | Unblinded - Blinded |
| 1–10 | 1.6 (1.5–1.8) | 1.3 (1.0–1.7) | 0.3 | 1–10 | 1.6 (1.4–1.9) | 1.2 (1.1–1.4) | 0.4 |
| 11–25 | 1.4 (1.4–1.7) | 1.2 (1.0–1.3) | 0.2 | 11–25 | 1.4 (1.1–1.6) | 1.2 (1.1–1.3) | 0.2 |
| 26–50 | 0.85 (0.80–0.91) | 0.96 (0.82–1.1) | –0.11 | 26–50 | 0.88 (0.75–1.0) | 1.0 (0.92–1.1) | –0.12 |
| 51–100 | 0.83 (0.64–1.0) | 0.82 (0.69–0.91) | 0.01 | 51–100 | 0.80 (0.67–0.91) | 0.80 (0.62–0.86) | 0 |
| Other | 0.61 (0.38–0.80) | 0.83 (0.61–1.1) | –0.22 | Other | 0.62 (0.43–0.76) | 0.84 (0.61–1.2) | –0.22 |
| Analysis | Unblinded | Blinded | Unblinded - Blinded | Analysis | Unblinded | Blinded | Unblinded - Blinded |
| Chi-squared | 71.87 | 17.84 | 54.03 | Chi-squared | 70.85 | 21.94 | 48.91 |
| p (d.f.=4) | 9.14E-15 | 0.00133 | p (d.f.=4) | 1.50E-14 | 0.000206 | ||
| Cramer’s V | 0.23 | 0.14 | 0.09 | Cramer’s V | 0.23 | 0.15 | 0.08 |
| Effect Size | Medium | Small | Effect Size | Medium | Medium | ||
| Ranked List: Times Higher 2018 | Ranked List: Times Higher 2023 | ||||||
| Category | Unblinded Average (Range) | Blinded Average (Range) | Unblinded - Blinded | Category | Unblinded Average (Range) | Blinded Average (Range) | Unblinded - Blinded |
| 1–10 | 1.5 (1.3–1.6) | 1.3 (1.2–1.4) | 0.2 | 1–10 | 1.6 (1.4–1.6) | 1.3 (1.2–1.4) | 0.3 |
| 11–25 | 1.4 (1.2–1.7) | 1.2 (1.1–1.3) | 0.2 | 11–25 | 1.4 (1.2–1.6) | 1.2 (1.2–1.2) | 0.2 |
| 26–50 | 0.86 (0.76–1.1) | 0.89 (0.83–0.96) | –0.03 | 26–50 | 0.84 (0.63–0.98) | 0.91 (0.77–1.1) | –0.07 |
| 51–100 | 0.85 (0.67–1.1) | 0.91 (0.73–1.1) | –0.06 | 51–100 | 0.82 (0.56–1.1) | 0.83 (0.81–0.92) | –0.01 |
| Other | 0.66 (0.55–0.76) | 0.81 (0.53–1.2) | –0.15 | Other | 0.69 (0.62–0.75) | 0.88 (0.65–1.1) | –0.19 |
| Analysis | Unblinded | Blinded | Unblinded - Blinded | Analysis | Unblinded | Blinded | Unblinded - Blinded |
| Chi-squared | 60.03 | 19.5 | 40.53 | Chi-squared | 60.78 | 17.64 | 43.14 |
| p (d.f.=4) | 2.86E-12 | 0.000626 | p (d.f.=4) | 1.98E-12 | 0.00145 | ||
| Cramer’s V | 0.21 | 0.15 | 0.06 | Cramer’s V | 0.21 | 0.14 | 0.07 |
| Effect Size | Medium | Medium | Effect Size | Medium | Small | ||
| Ranked List: Leiden 2018–2021 | Ranked List: AMBF 1990–2018 | ||||||
| Category | Unblinded Average (Range) | Blinded Average (Range) | Unblinded - Blinded | Category | Unblinded Average (Range) | Blinded Average (Range) | Unblinded - Blinded |
| 1–10 | 1.4 (1.1–1.8) | 1.0 (0.88–1.2) | 0.4 | 1–10 | 1.7 (1.5–2.0) | 1.3 (1.2–1.3) | 0.4 |
| 11–25 | 1.2 (1.1–1.3) | 1.2 (1.1–1.2) | 0 | 11–25 | 1.2 (0.83–1.4) | 1.2 (1.1–1.2) | 0 |
| 26–50 | 0.83 (0.70–0.92) | 0.98 (0.89–1.1) | –0.15 | 26–50 | 1.1 (1.0–1.2) | 0.90 (0.70–1.1) | 0.2 |
| 51–100 | 0.95 (0.76–1.1) | 0.94 (0.78–1.3) | 0.01 | 51–100 | 0.86 (0.56–1.0) | 0.87 (0.70–1.0) | –0.01 |
| Other | 0.83 (0.65–1.0) | 0.93 (0.71–1.1) | –0.1 | Other | 0.60 (0.54–0.72) | 0.86 (0.70–1.2) | –0.26 |
| Analysis | Unblinded | Blinded | Unblinded - Blinded | Analysis | Unblinded | Blinded | Unblinded - Blinded |
| Chi-squared | 27.96 | 5.23 | 22.73 | Chi-squared | 74.22 | 20.34 | 53.88 |
| p (d.f.=4) | 1.27E-05 | 0.265 | p (d.f.=4) | 2.91E-15 | 0.000427 | ||
| Cramer’s V | 0.14 | 0.08 | 0.06 | Cramer’s V | 0.23 | 0.15 | 0.08 |
| Effect Size | Small | Small | Effect Size | Medium | Medium | ||
Table 3
Relative Advantage–Full Application with Consensus Institutional Ranking.
The average value and ranges by category in the consensus ranking, with Chi-squared association test with Cramer’s V statistic of unblinded and blinded LOI reviews for full application invitations.
| Ranked List: Consensus | |||
|---|---|---|---|
| Category | Unblinded Average (Range) | Blinded Average (Range) | Unblinded - Blinded |
| 1–10 | 1.6 (1.4–2.0) | 1.2 (1.1–1.4) | 0.4 |
| 11–25 | 1.3 (1.3–1.4) | 1.2 (1.1–1.6) | 0.1 |
| 26–50 | 0.85 (0.73–0.93) | 1.0 (0.90–1.1) | –0.15 |
| 51–100 | 0.80 (0.67–1.0) | 0.73 (0.45–1.0) | 0.07 |
| Other | 0.70 (0.53–0.80) | 0.88 (0.67–1.1) | –0.18 |
| Analysis | Unblinded | Blinded | Unblinded - Blinded |
| Chi-squared | 66.87 | 21.9 | 44.97 |
| p (d.f.=4) | 1.04E-13 | 0.00021 | |
| Cramer’s V | 0.22 | 0.15 | 0.07 |
| Effect Size | Medium | Medium | |
Table 4
Relative Advantage–Award with Consensus Institutional Ranking.
The average value and ranges for consensus categories, with Chi-squared association test and Cramer’s V statistic of unblinded and blinded LOI reviews through program awards. Analysis of blinded reviews relied on three years of data (2021–2023).
| Ranked List: Consensus | ||||
|---|---|---|---|---|
| Category | Unblinded Average (Range) | Blinded* Average (Range) | Unblinded - Blinded | |
| 1–10 | 2.5 (1.6–3.4) | 1.8 (0.63–2.6) | 0.7 | |
| 11–25 | 2.0 (0.61–3.3) | 1.4 (1.1–2.6) | 0.6 | |
| 26–50 | 0.23 (0.0–0.52) | 0.91 (0.70–1.1) | –0.68 | |
| 51–100 | 0.54 (0.0–1.0) | 0.46 (0.0–0.83) | 0.08 | |
| Other | 0.42 (0.33–0.68) | 0.83 (0.42–0.90) | –0.41 | |
| Analysis | Unblinded | Blinded* | Unblinded - Blinded | |
| Chi-squared | 30.62 | 5.18 | 25.44 | |
| p (d.f.=4) | 3.66E-06 | 0.269 | ||
| Cramer’s V | 0.15 | 0.09 | 0.06 | |
| Effect Size | Medium | Small | ||
Table 5
Relative Advantage–Gender.
The average value and ranges for gender categories, with Chi-squared association test and Cramer’s V statistic of unblinded and blinded LOI reviews in full application invitations and program awards. Analysis of blinded reviews relied on three years of data (2021–2023).
| Full Application Invitations | Program Awards | |||||||
|---|---|---|---|---|---|---|---|---|
| Category | Unblinded Average (Range) | Blinded Average (Range) | Unblinded - Blinded | Category | Unblinded Average (Range) | Blinded* Average (Range) | Unblinded - Blinded | |
| Male | 1.0 (0.94–1.1) | 1.0 (1.0–1.1) | 0 | Male | 0.99 (0.71–1.3) | 0.96 (0.77–1.1) | 0.03 | |
| Female | 0.99 (0.84–1.2) | 0.93 (0.90–0.98) | 0.06 | Female | 0.96 (0.38–1.4) | 1.0 (0.84–1.3) | –0.04 | |
| Analysis | Unblinded | Blinded | Unblinded - Blinded | Analysis | Unblinded | Blinded* | Unblinded - Blinded | |
| Chi-squared | 0.06 | 0.88 | –0.82 | Chi-squared | 0.0 | 0.01 | –0.01 | |
| p (d.f.=1) | 0.799 | 0.347 | p (d.f.=1) | 1.0 | 0.916 | |||
| Cramer’s V | 0.01 | 0.03 | –0.02 | Cramer’s V | 0.00 | 0.00 | 0.00 | |
| Effect Size | No effect | No effect | Effect Size | No effect | No effect | |||
Table 6
Percentage of LOIs Received per Institutional Category for the eight institutional ranking and the consensus ranking.
| Institutional Category | NSF NCSES 2018 | NSF NCSES 2020 | Times Higher 2018 | Times Higher 2023 | Shanghai Ranking 2018 | Shanghai Ranking 2023 | Leiden 2018–2021 | AMBF 1990–2018 | Consensus |
|---|---|---|---|---|---|---|---|---|---|
| 1–10 | 13% | 13% | 14% | 14% | 13% | 15% | 12% | 15% | 15% |
| 11–25 | 21% | 21% | 19% | 19% | 19% | 18% | 18% | 19% | 18% |
| 26–50 | 20% | 19% | 24% | 26% | 30% | 24% | 18% | 18% | 24% |
| 51–100 | 20% | 20% | 19% | 18% | 19% | 23% | 20% | 17% | 20% |
| Other | 25% | 27% | 23% | 23% | 18% | 20% | 32% | 30% | 23% |
Additional files
-
Supplementary file 1
Relative Advantage–Award.
The average value and ranges for institutional categories, with Chi-squared association test and Cramer’s V statistic for unblinded LOI reviews (2017–2020) and blinded LOI reviews (2021–2023) through program awards.
- https://cdn.elifesciences.org/articles/92339/elife-92339-supp1-v1.xlsx
-
Supplementary file 2
Ranked lists of institutions.
The top 100 Institutions in the eight ranked lists used in the study, plus the consensus ranking list.
- https://cdn.elifesciences.org/articles/92339/elife-92339-supp2-v1.xlsx
-
Supplementary file 3
BYI LOIs, Full Application invitations, and Program Awards by Institution.
All LOIs received, Full Application invitations, and Program Awards from 2017 to 2020 (unblinded) and 2021–2024 (blinded), sorted alphabetically by institution name.
- https://cdn.elifesciences.org/articles/92339/elife-92339-supp3-v1.xlsx
-
MDAR checklist
- https://cdn.elifesciences.org/articles/92339/elife-92339-mdarchecklist1-v1.pdf
-
Source code 1
R-notebook for Chi-squared analysis.
- https://cdn.elifesciences.org/articles/92339/elife-92339-code1-v1.zip
Download links
A two-part list of links to download the article, or parts of the article, in various formats.
Downloads (link to download the article as PDF)
Open citations (links to open the citations from this article in various online reference manager services)
Cite this article (links to download the citations from this article in formats compatible with various reference manager tools)
Meta-Research: Blinding reduces institutional prestige bias during initial review of applications for a young investigator award
eLife 13:e92339.
https://doi.org/10.7554/eLife.92339


