Meta-Research: International authorship and collaboration across bioRxiv preprints
- Department of Genetics, Cell Biology, and Development, University of Minnesota, United States
- Department of Ecology, Evolution and Behavior, University of Minnesota, United States
Figures
Figure 1 with 2 supplements
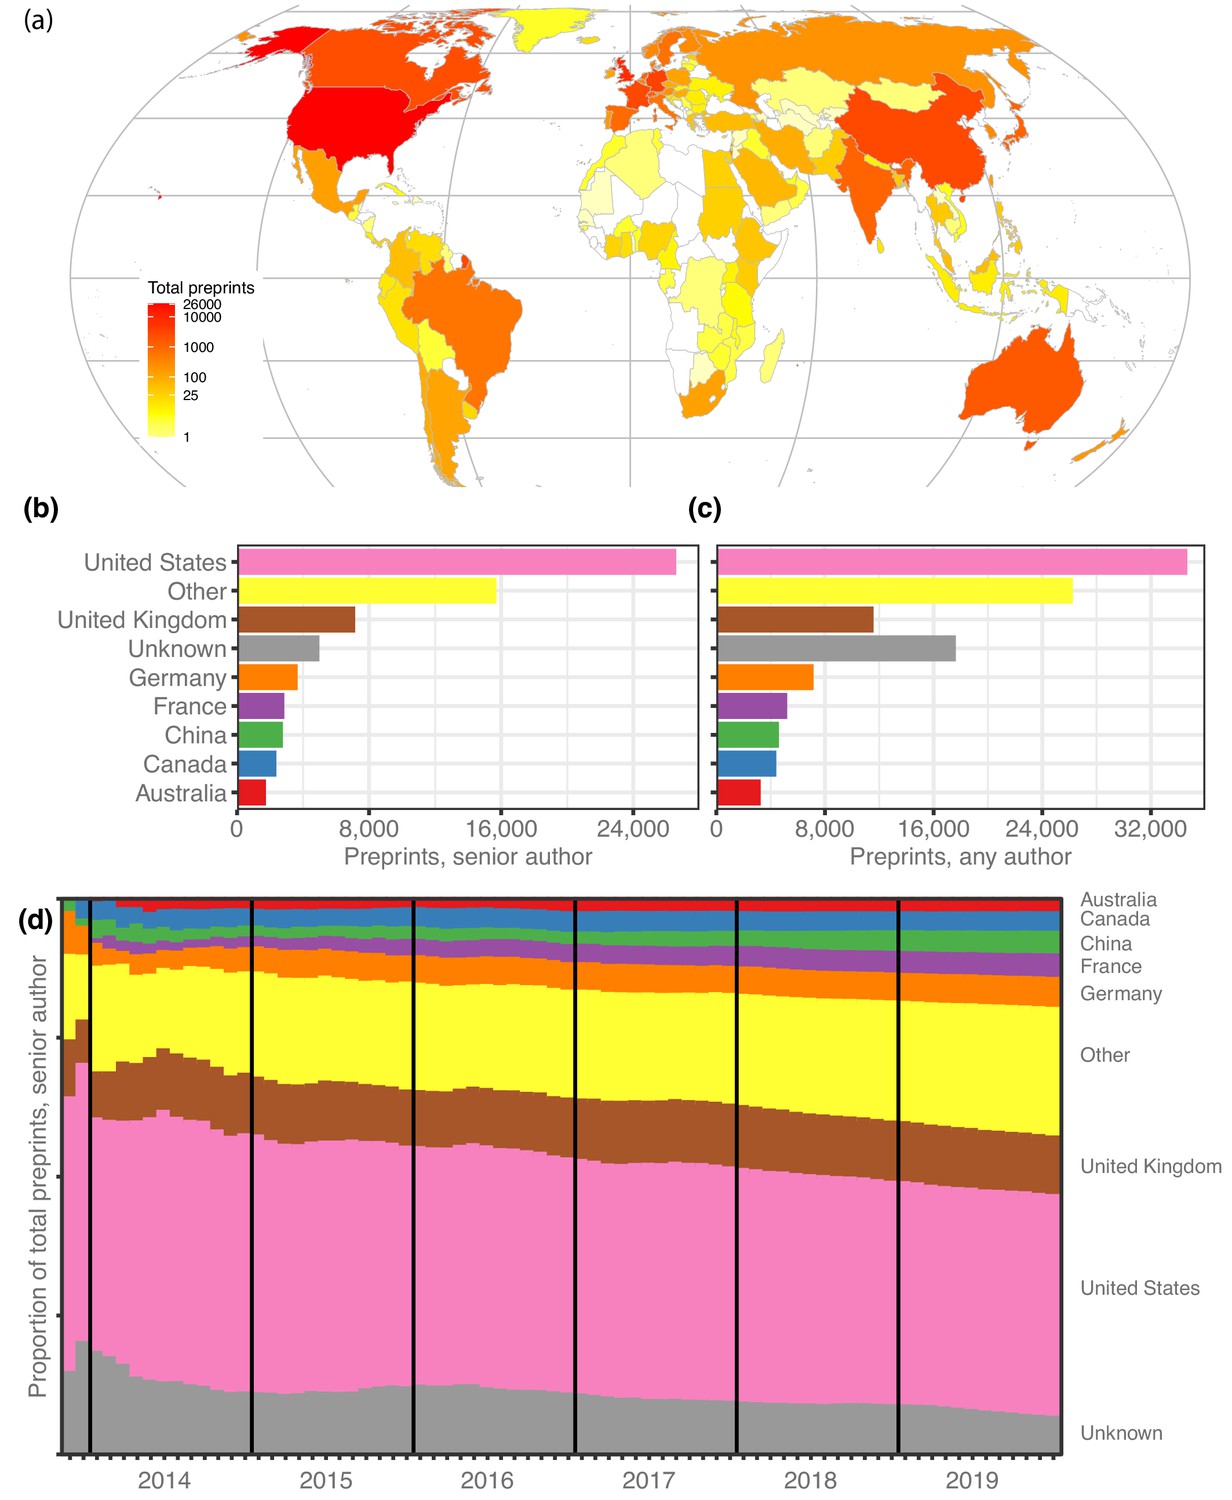
Preprints per country.
(a) A heat map indicating the number of preprints per country, based on the institutional affiliation of the senior author. The color coding uses a log scale. (b) The total preprints attributed to the seven most prolific countries. The x-axis indicates total preprints listing a senior author from a country; the y-axis indicates the country. The ‘Other’ category includes preprints from all countries not listed in the plot. (c) Similar to panel b, but showing the total preprints listing at least one author from the country in any position, not just the senior position. (d) Proportion of total senior-author preprints from each country (y-axis) over time (x-axis), starting in November 2013 and continuing through December 2019. Each colored segment indicates the proportion of total preprints attributed to a single country (using same color scheme as panels (b and c), as of the end of the month indicated on the x-axis.
-
Figure 1—source data 1
Preprints per country.
Each row represents a single country, sorted in descending order by the ‘senior_author’ and ‘any_author’ columns. The ‘alpha2’ column indicates the two-letter country code defined in ISO 3166–1. ‘country’ indicates the country name as recorded in the ROR dataset. ‘senior_author’ lists the number of bioRxiv preprints for which the final author in the author list specified an affiliation to an institution in that country. ‘any_author’ lists the number of bioRxiv preprints for which at least one author (in any position) specified an affiliation to an institution in that country.
- https://cdn.elifesciences.org/articles/58496/elife-58496-fig1-data1-v1.csv
-
Figure 1—source data 2
Preprint counting methods at the country level.
Each row represents a country, sorted in descending order using the ‘cn_total’ and ‘straight_count’ columns. The ‘country’ column is the country name as recorded in the ROR dataset. ‘cn_total’ lists the number of preprints attributed to that country using the complete-normalizing counting technique. ‘straight_count’ lists the number of preprints attributed to that country using the straight-counting technique.
- https://cdn.elifesciences.org/articles/58496/elife-58496-fig1-data2-v1.csv
Figure 1—figure supplement 1
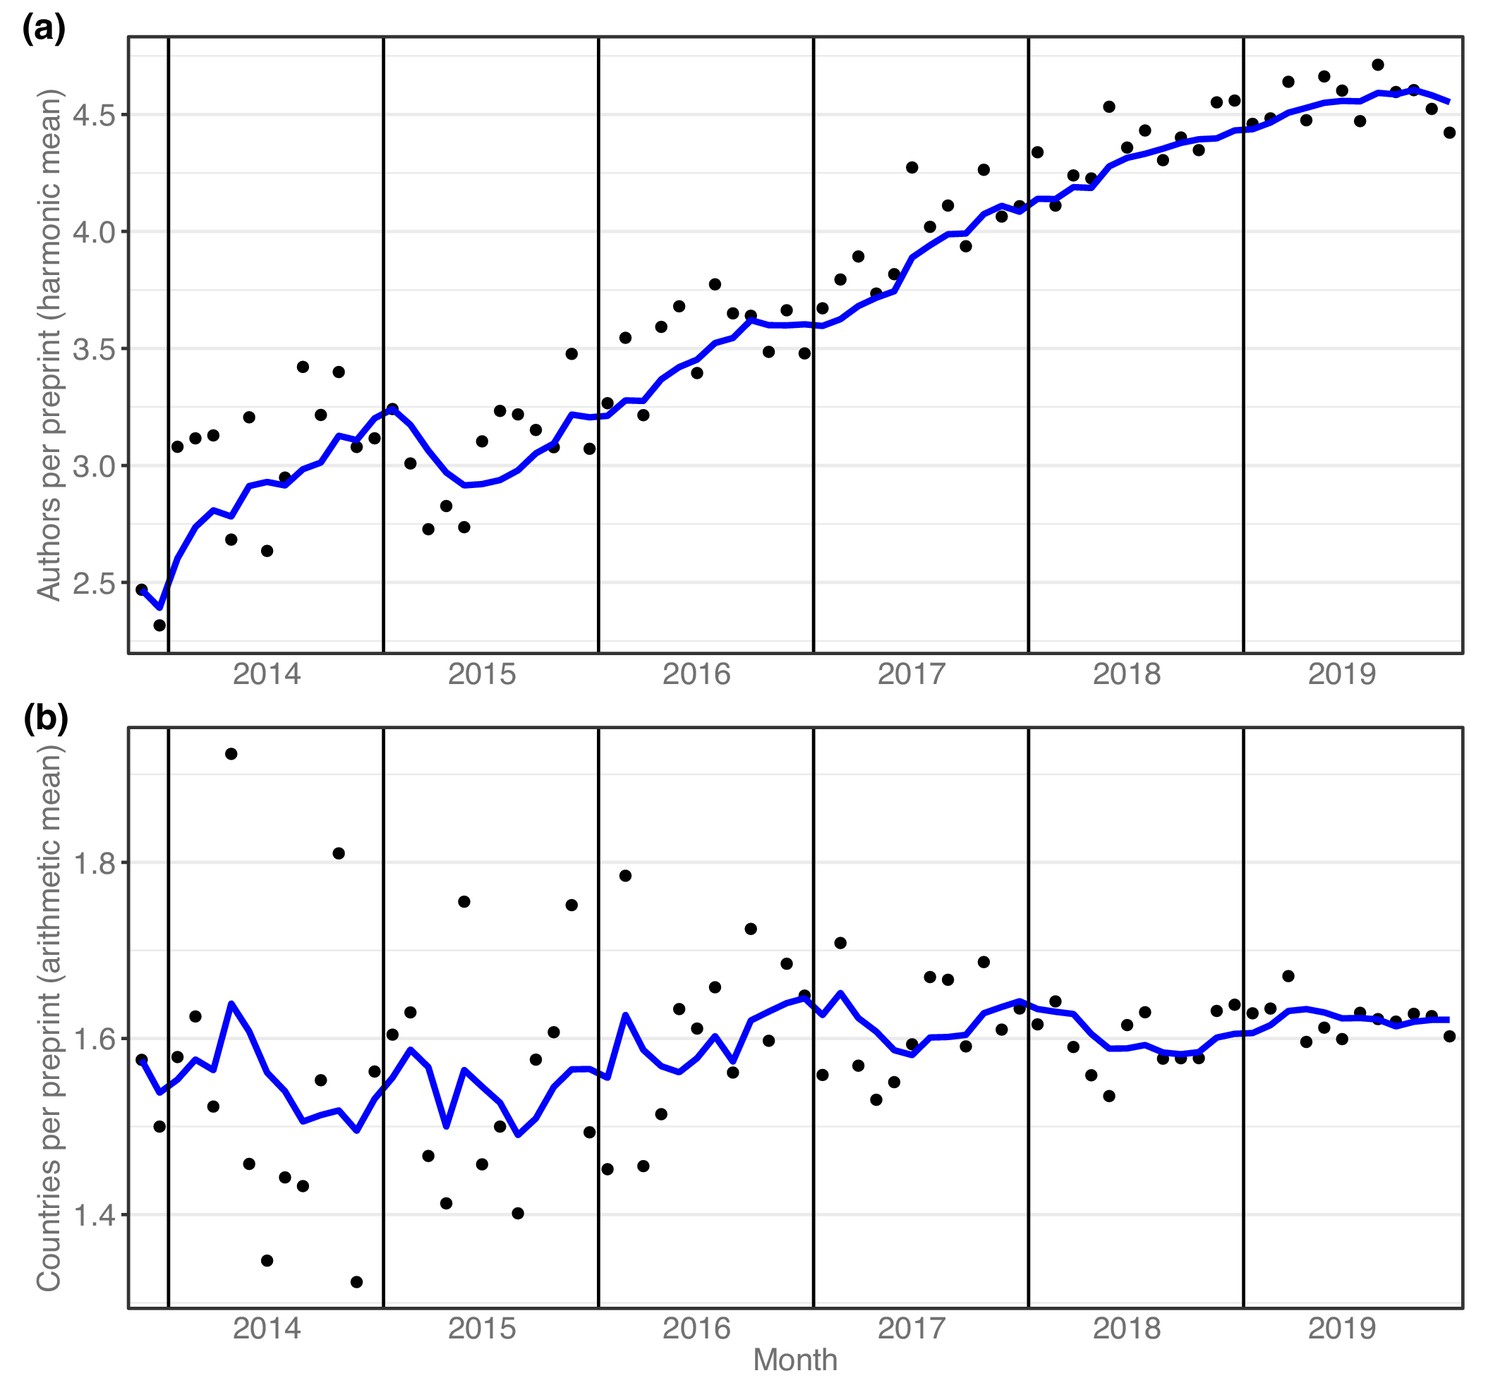
Preprint-level collaboration.
(a) shows the average number of authors per paper over time. The x-axis indicates the year; the y-axis indicates the harmonic mean authors per preprint. Each point indicates the average of papers posted in a single month; the blue line indicates the six-month moving average. (b) illustrates the number of countries per preprint, over time. The x-axis indicates time; the y-axis indicates the arithmetic mean countries per preprint. Each point indicates the average unique countries found in all preprints posted in a single month. The blue line indicates the six-month moving average.
Figure 1—figure supplement 2
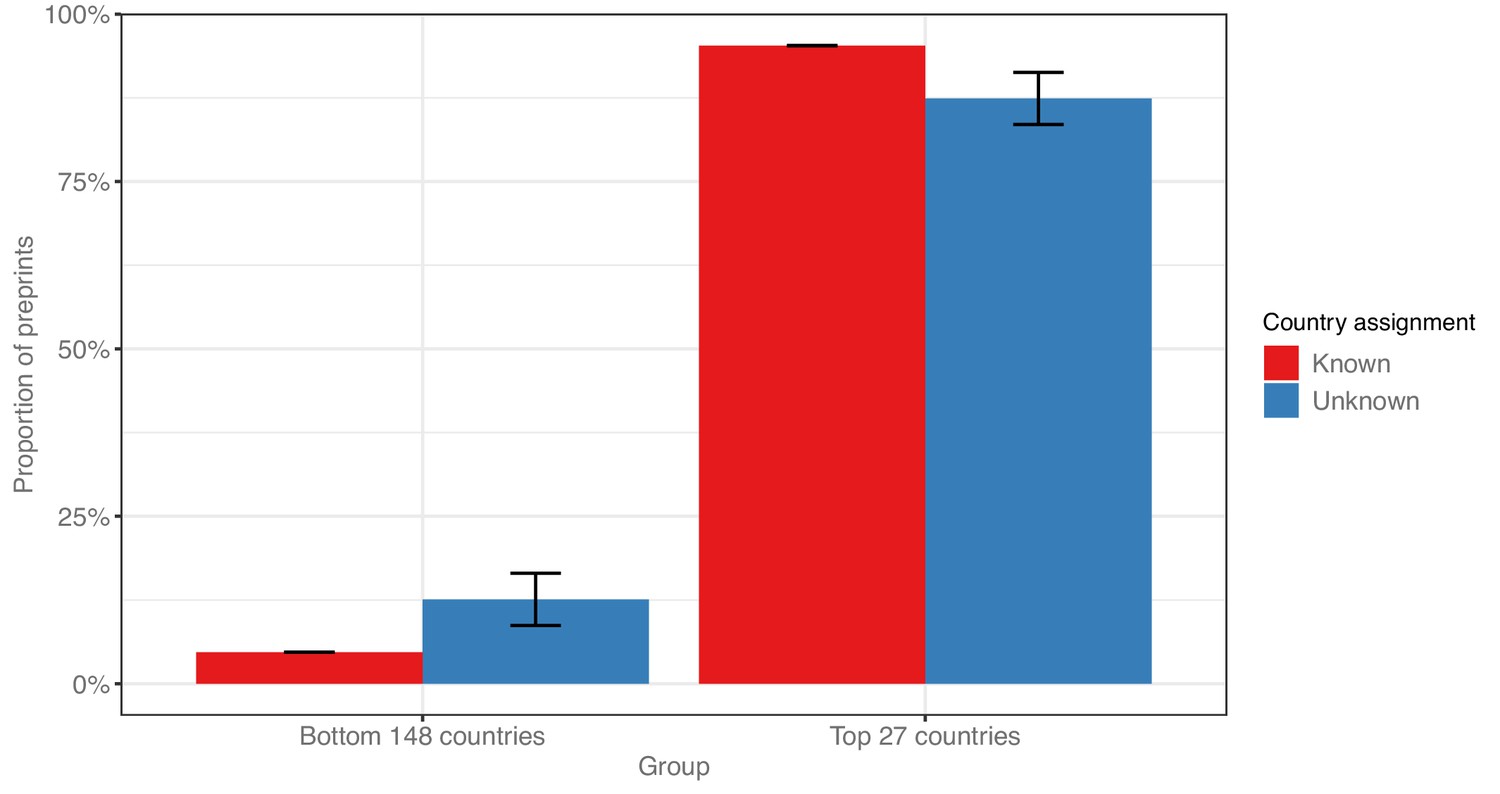
Preprints with no country assignment.
This bar plot compares the observed prevalence of preprints from countries split in two groups: the 27 most prolific countries, and the remaining 148 countries for which at least one bioRxiv author was observed. The red bars indicate the proportion of preprints from countries in each group, out of all preprints with a country assignment. The blue bars indicate the proportion of preprints from countries in each group, out of a random sample of 325 preprints with no country assignment. The error bars indicate the margin of error at a 95% confidence interval.
Figure 2

BioRxiv adoption per country.
(a) Correlation between two scientific output metrics. Each point is a country; the x-axis (log scale) indicates the total citable documents attributed to that country from 2014 to 2019, and the y-axis (also log scale) indicates total senior-author preprints attributed to that country overall. The red line demarcates a ‘bioRxiv adoption’ score of 1.0, which indicates that a country’s share of bioRxiv preprints is identical to its share of general scholarly outputs. Countries to the left of this line have a bioRxiv adoption score greater than 1.0. A score of 2.0 would indicate that its share of preprints is twice as high as its share of other scholarly outputs (See Discussion for more about this measurement.) (b) The countries with the 10 highest and 10 lowest bioRxiv adoption scores. The x-axis indicates each country’s adoption score, and the y-axis lists each country in order. All panels include only countries with at least 50 preprints.
-
Figure 2—source data 1
Country productivity and bioRxiv adoption.
Each row represents a single country, sorted in descending order by the ‘citable_total’ and ‘senior_author_preprints’ columns. The ‘alpha2’ column indicates the two-letter country code defined in ISO 3166–1. ‘country’ indicates the country name as recorded in the SCImago dataset. The ‘y2014’ through ‘y2018’ columns list the total number of citable documents attributed to that country in the SCImago dataset for the year specified. ‘citable_total’ indicates the sum of all citable documents from that country from 2014 through 2018. ‘senior_author_preprints’ lists the number of senior-author preprints attributed to that country from 2013 through 2019.
- https://cdn.elifesciences.org/articles/58496/elife-58496-fig2-data1-v1.csv
Figure 3 with 3 supplements
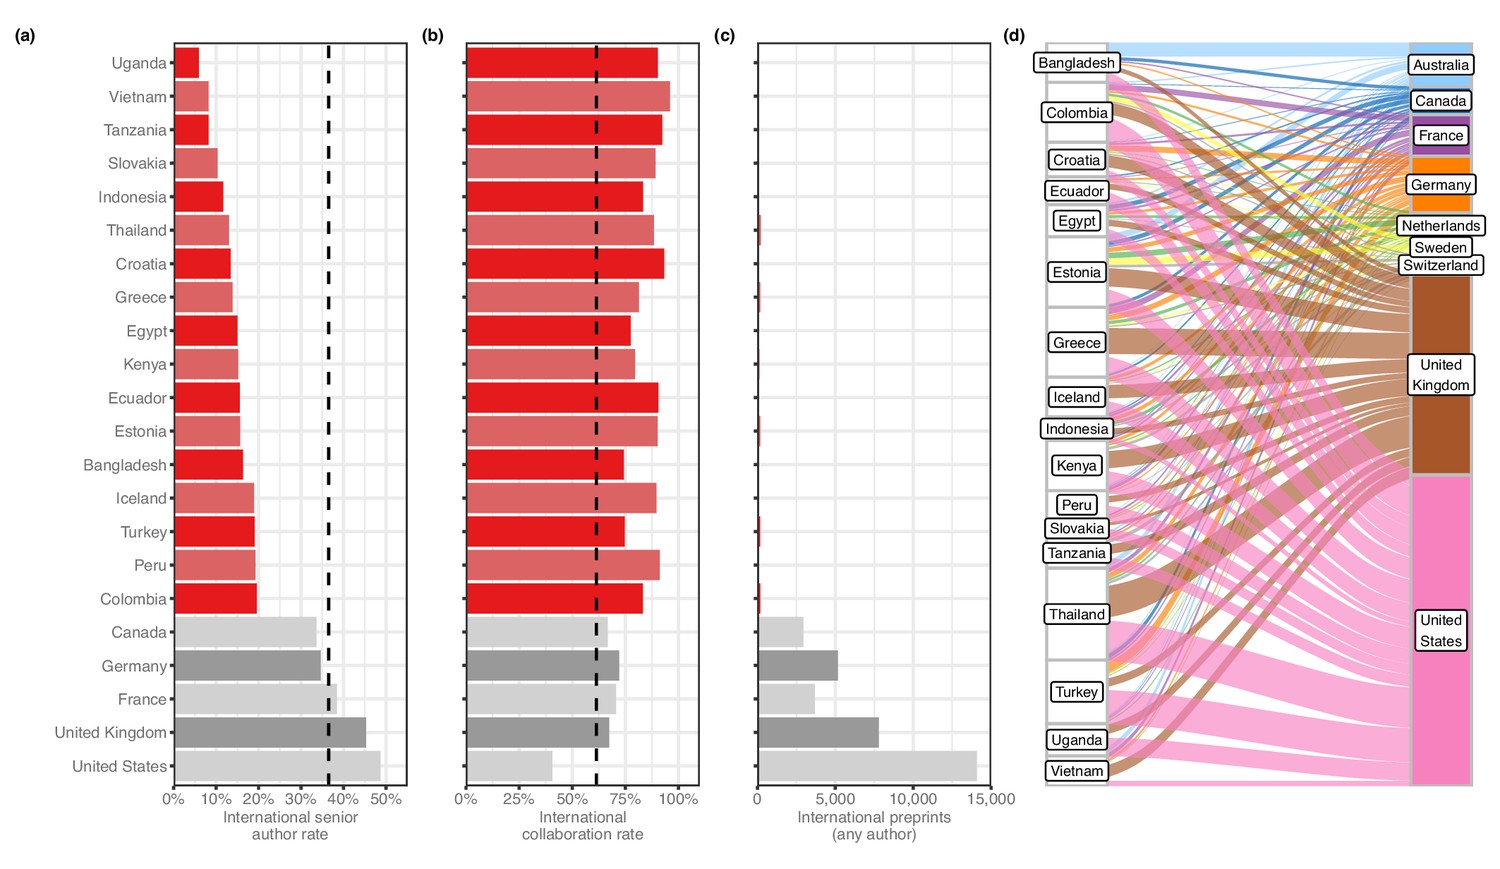
Contributor countries.
(a) Bar plot indicating the international senior author rate (y-axis) by country (x-axis) – that is, of all international preprints with a contributor from that country, the percentage of them that include a senior author from that country. All 17 contributor countries are listed in red, with the five countries with the highest senior-author rates (in grey) for comparison. (b) A bar plot with the same y-axis as panel (a). The x-axis indicates the international collaboration rate, or the proportion of preprints with a contributor from that country that also include at least one author from another country. (c) is a bar plot indicating the total international preprints featuring at least one author from that country (the median value per country is 19). (d) On the left are the 17 contributor countries. On the right are the countries that appear in the senior author position of preprints that were co-authored with contributor countries. (Supervising countries with 25 or fewer preprints with contributor countries were excluded from the figure.) The width of the ribbons connecting contributor countries to senior-author countries indicates the number of preprints supervised by the senior-author country that included at least one author from the contributor country. Statistically significant links were found between four combinations of supervising countries and contributors: Australia and Bangladesh (Fisher’s exact test, q = 1.01 × 10⁻¹¹); the UK and Thailand (q = 9.54 × 10⁻⁴); the UK and Greece (q = 6.85 × 10⁻³); and Australia and Vietnam (q = 0.049). All p-values reflect multiple-test correction using the Benjamini–Hochberg procedure.
-
Figure 3—source data 1
Combinations of senior authors with collaborator countries.
Each row represents a combination of two countries, sorted alphabetically by the ‘contributor’ and ‘senior’ columns. The ‘contributor’ column indicates the name of the contributor country. ‘senior’ indicates the name of the country that appears as a senior author. ‘count’ lists the number of preprints that include at least one author listing an affiliation from the country in the ‘contributor’ column and a senior author listing an affiliation from the country in the ‘senior’ column.
- https://cdn.elifesciences.org/articles/58496/elife-58496-fig3-data1-v1.csv
-
Figure 3—source data 2
Links between contributor countries and the senior-author countries they write with.
Each row represents a combination of two countries. The ‘contributor’ column indicates the name of the contributor country. ‘senior’ indicates the name of the country that appears as a senior author. ‘p’ lists the p-value of a Fisher’s exact test, as described in the ‘Methods’ section. ‘with’ lists the number of preprints that include an author from the ‘contributor’ country and a senior author from the ‘senior’ country. ‘without’ lists the number of preprints that include an author from the ‘contributor’ country but do not list a senior author from the ‘senior’ country. ‘seniortotal’ lists the total number of senior-author preprints attributed to the country in the ‘senior’ column. ‘padj’ lists the p-value from the ‘p’ column, adjusted to control the false-discovery rate using the Benjamini–Hochberg procedure.
- https://cdn.elifesciences.org/articles/58496/elife-58496-fig3-data2-v1.csv
-
Figure 3—source data 3
International collaboration.
Each row represents a country, in alphabetical order by the ‘country’ column. The ‘country’ column indicates the country name as recorded in the ROR dataset. ‘alpha2’ indicates the two-letter country code defined in ISO 3166–1. ‘intl_senior_author’ lists, of bioRxiv preprints that include authors from at least two countries, the number for which the final author in the author list specified an affiliation to an institution in the specified country. ‘intl_any_author’ lists, of bioRxiv preprints that include authors from at least two countries, the number for which at least one author (in any position) specified an affiliation to an institution in the specified country. ‘all_any_author’ lists the number of bioRxiv preprints—international or not—for which at least one author (in any position) specified an affiliation to an institution in that country. ‘intl_senior_rate’ is the ‘intl_senior_author’ column divided by the ‘intl_any_author’ column. ‘intl_collab_rate’ is the ‘intl_any_author’ column divided by ‘all_any_author’ column. The ‘contributor’ column lists a boolean value indicating whether the specified country meets the criteria of being a ‘contributor country’: a value of at least 50 in the ‘intl_any_author’ column and a value of less than 0.2 in the ‘intl_senior_rate’ column.
- https://cdn.elifesciences.org/articles/58496/elife-58496-fig3-data3-v1.csv
Figure 3—figure supplement 1
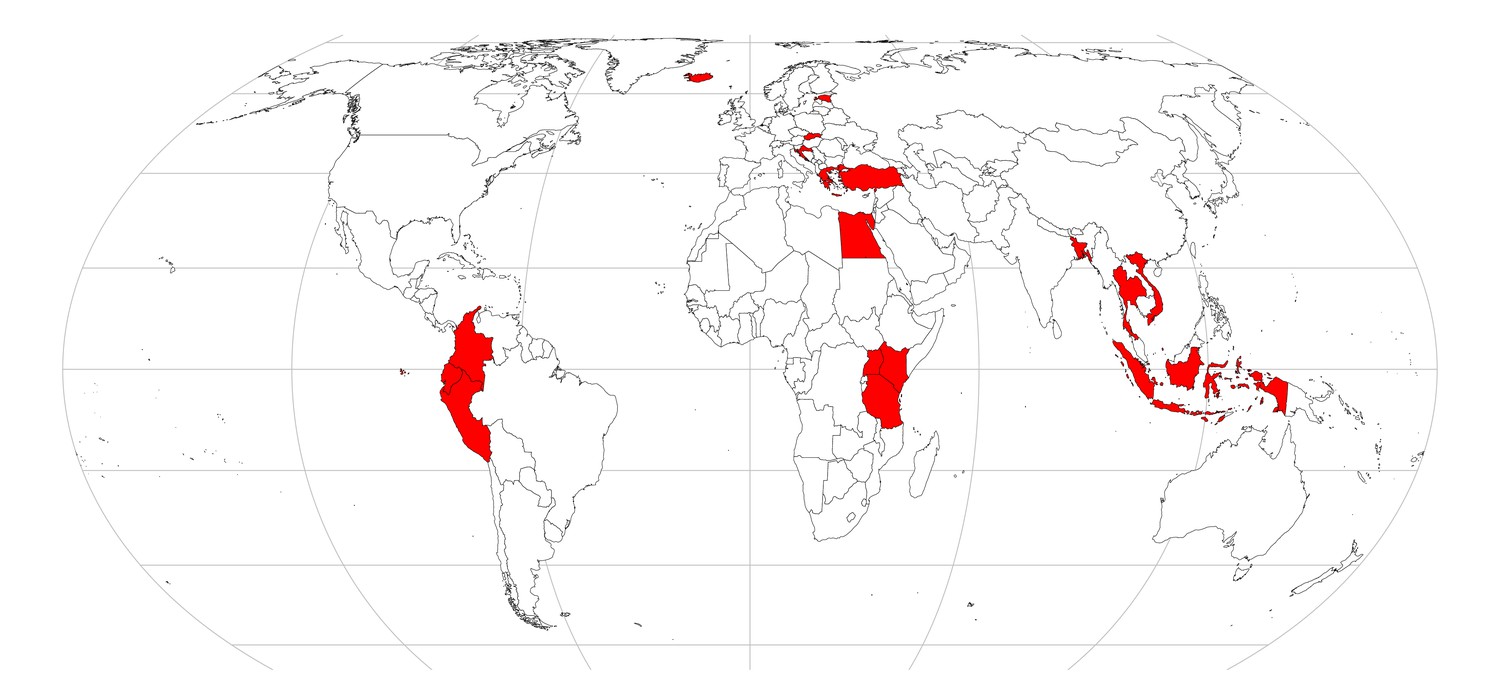
Map of contributor countries.
World map indicating (in red) the location of contributor countries, defined as all countries listed on at least 50 international preprints, but as senior author on less than 20% of them.
Figure 3—figure supplement 2
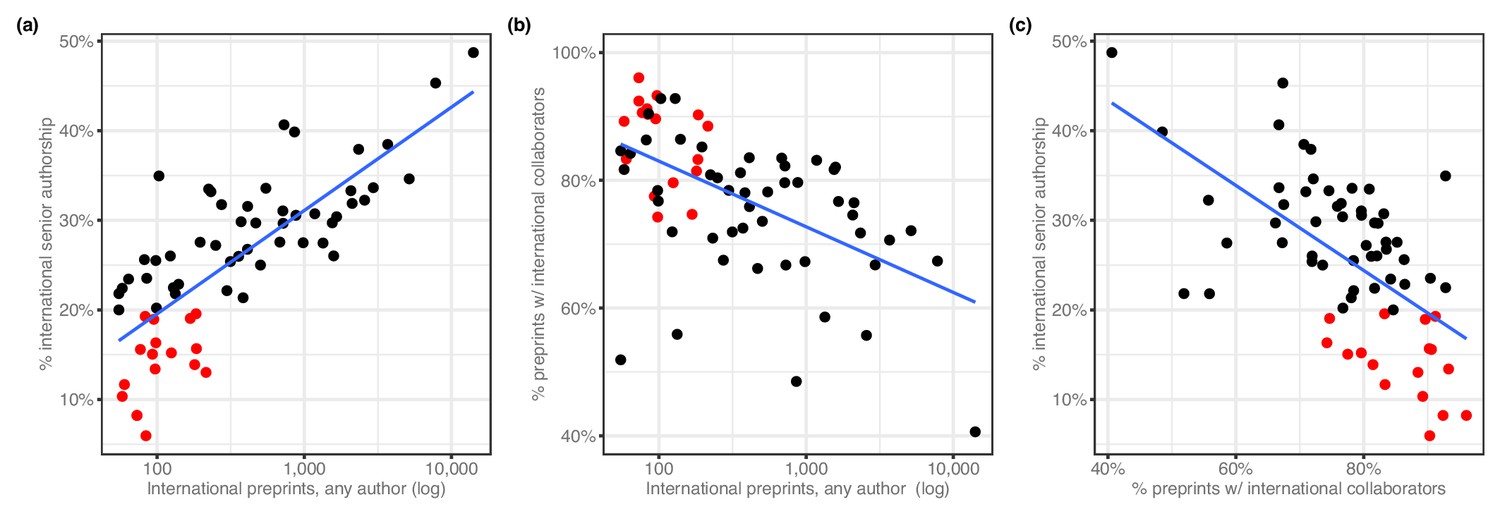
International collaboration correlations.
Each point represents a country; the red points indicate those in the ‘contributor country’ category. Blue lines indicate lines of best fit for each plot, though they are unrelated to the Spearman correlations reported for these relationships. (a) A scatter plot showing the relationship (Spearman’s ρ = 0.781, p=1.09 × 10⁻¹⁴) between a country’s total international preprints (x-axis; log scale) and the proportion of those preprints for which they are the senior author (y-axis). (b) A scatter plot showing the relationship (Spearman’s ρ = −0.578, p=3.68 × 10⁻⁷) between a country’s total international preprints (x-axis; log scale) and the proportion of preprints with a contributor from that country that also include at least one contributor from another country (y-axis). (c) A scatter plot showing the relationship (Spearman’s ρ = −0.572, p=5.32 × 10⁻⁷) between the proportion of preprints with a contributor from that country that also include at least one contributor from another country (x-axis) and the proportion of those preprints for which that country appears in the senior author position (y-axis).
Figure 3—figure supplement 3
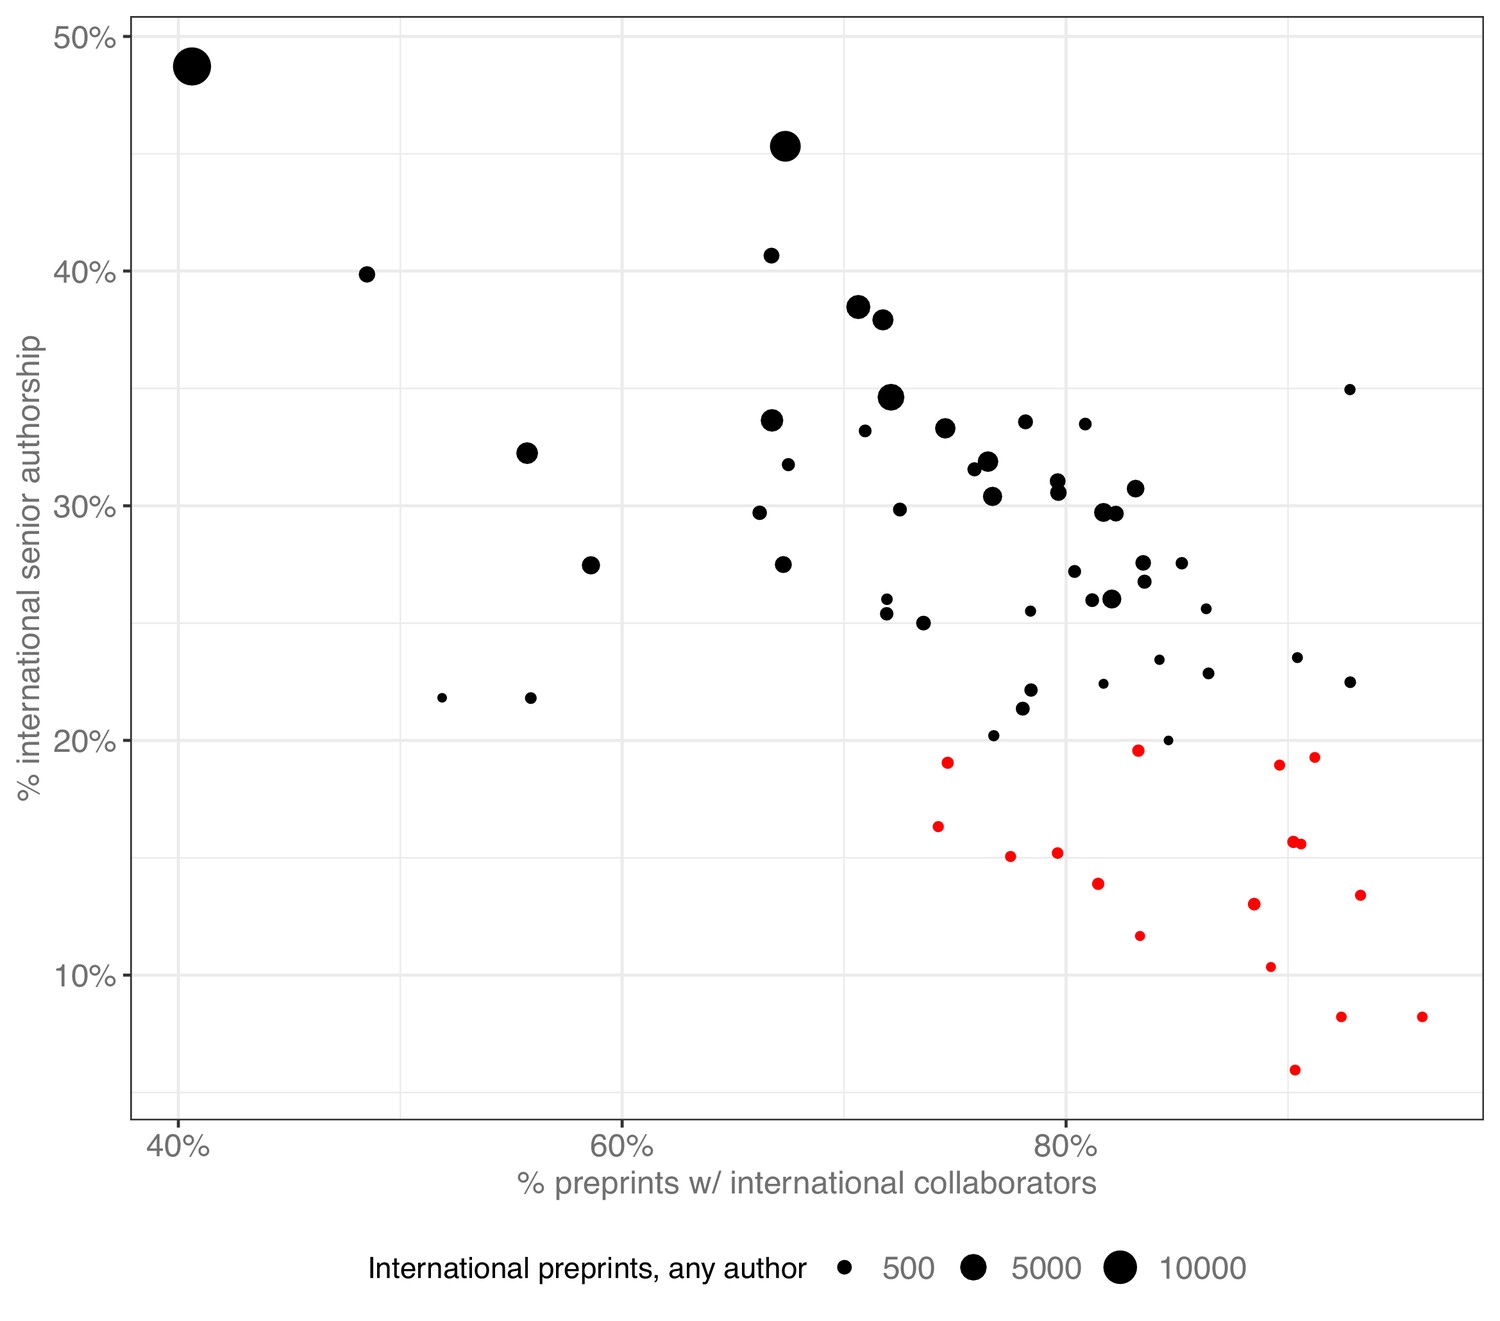
Correlation between three measurements of international collaboration.
This figure is an alternative presentation of the same data as the three panels in Figure 3—figure supplement 2. Each point represents a country, and the size of the point indicates the total international preprints associated with that country. The x-axis indicates the proportion of preprints with a contributor from that country that also include at least one contributor from another country. The y-axis indicates the proportion of those preprints for which that country appears in the senior author position.
Figure 4
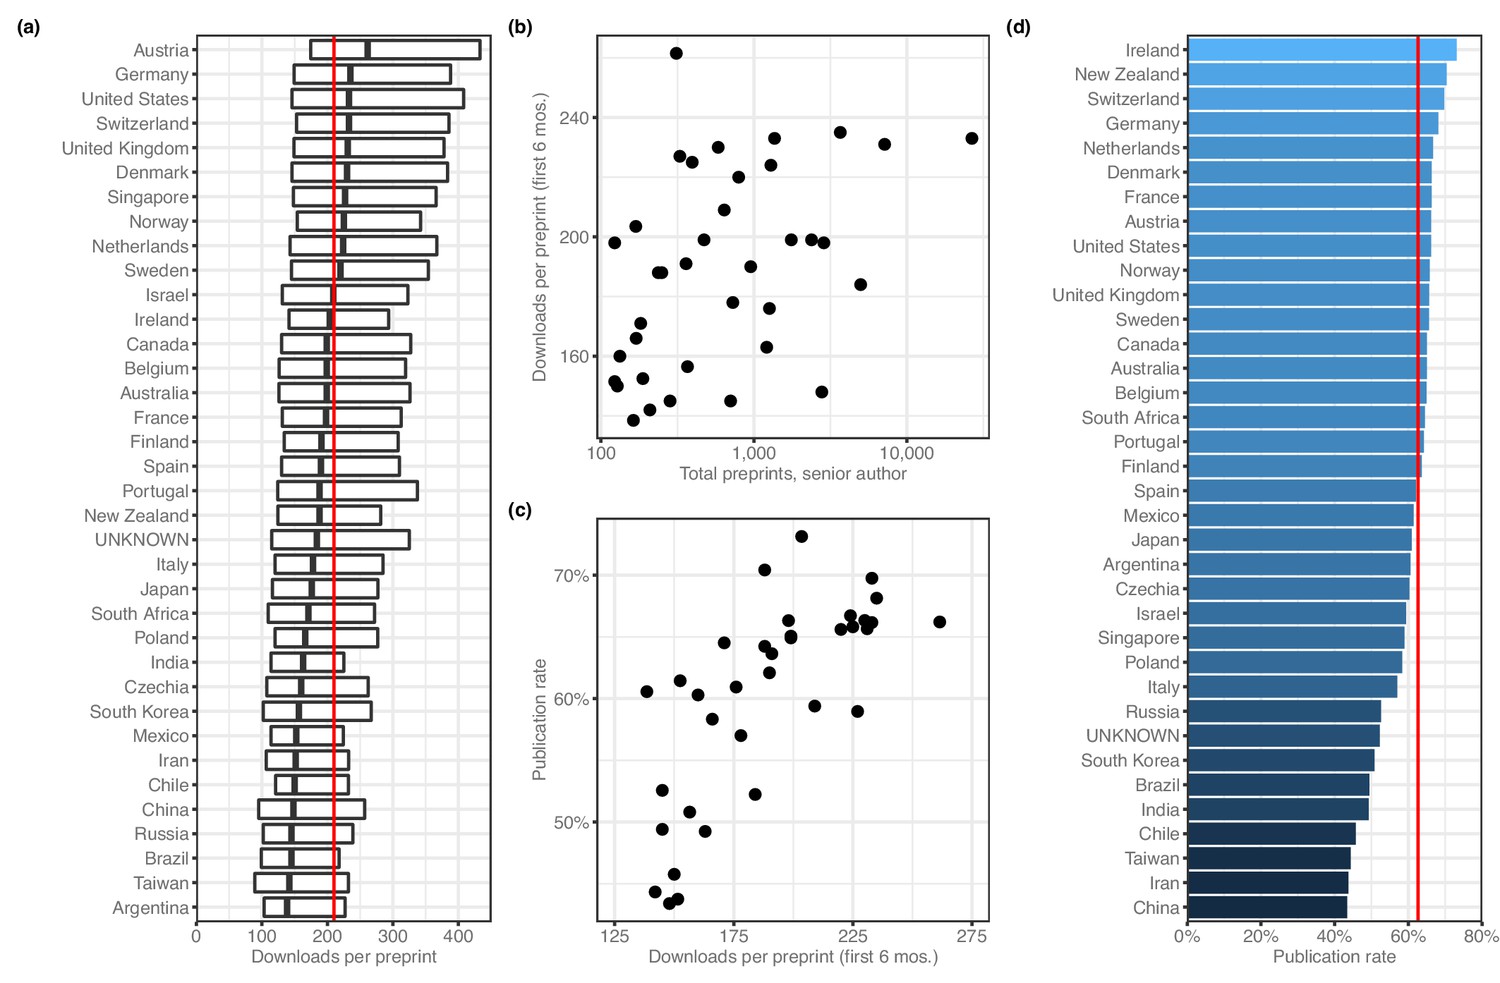
Preprint outcomes.
All panels include countries with at least 100 senior-author preprints. (a) A box plot indicating the number of downloads per preprint for each country. The dark line in the middle of the box indicates the median, and the ends of each box indicate the first and third quartiles, respectively. ‘Whiskers’ and outliers were omitted from this plot for clarity. The red line indicates the overall median. (b) A plot showing the relationship (Spearman’s ρ = 0.485, p=0.00274) between total preprints and downloads. Each point represents a single country. The x-axis indicates the total number of senior-author preprints attributed to the country. The y-axis indicates the median number of downloads for those preprints. (c) A plot showing the relationship (Spearman’s ρ = 0.777, p=2.442 × 10⁻⁸) between downloads and publication rate. Each point represents a single country. The x-axis indicates the median number of downloads for all preprints listing a senior author affiliated with that country. The y-axis indicates the proportion of preprints posted before 2019 that have been published. (d) A bar plot indicating the proportion of preprints posted before 2019 that are now flagged as ‘published’ on the bioRxiv website. The x-axis (and color scale) indicates the proportion, and the y-axis lists each country. The red line indicates the overall publication rate.
-
Figure 4—source data 1
Published pre-2019 preprints by country.
Each row represents a country, sorted in descending order by the ‘published’ and ‘total’ columns. The ‘country’ column indicates the country name as recorded in the ROR dataset. ‘total’ lists the number of preprints last updated prior to 2019 that list a senior author who declared an affiliation in the specified country. ‘published’ lists, of the preprints counted in the ‘total’ column, the number that are listed as published on the bioRxiv website.
- https://cdn.elifesciences.org/articles/58496/elife-58496-fig4-data1-v1.csv
-
Figure 4—source data 2
Publication rates and DOI usage.
Each row represents a country, sorted alphabetically. The ‘doi_rate’ field lists the percentage of published papers from that country issued a Digital Object Identifier (DOI), according to Boudry and Chartron, 2017. The ‘pub_rate’ field lists the proportion of preprints from that country posted before 2019 that have been published.
- https://cdn.elifesciences.org/articles/58496/elife-58496-fig4-data2-v1.csv
Figure 5
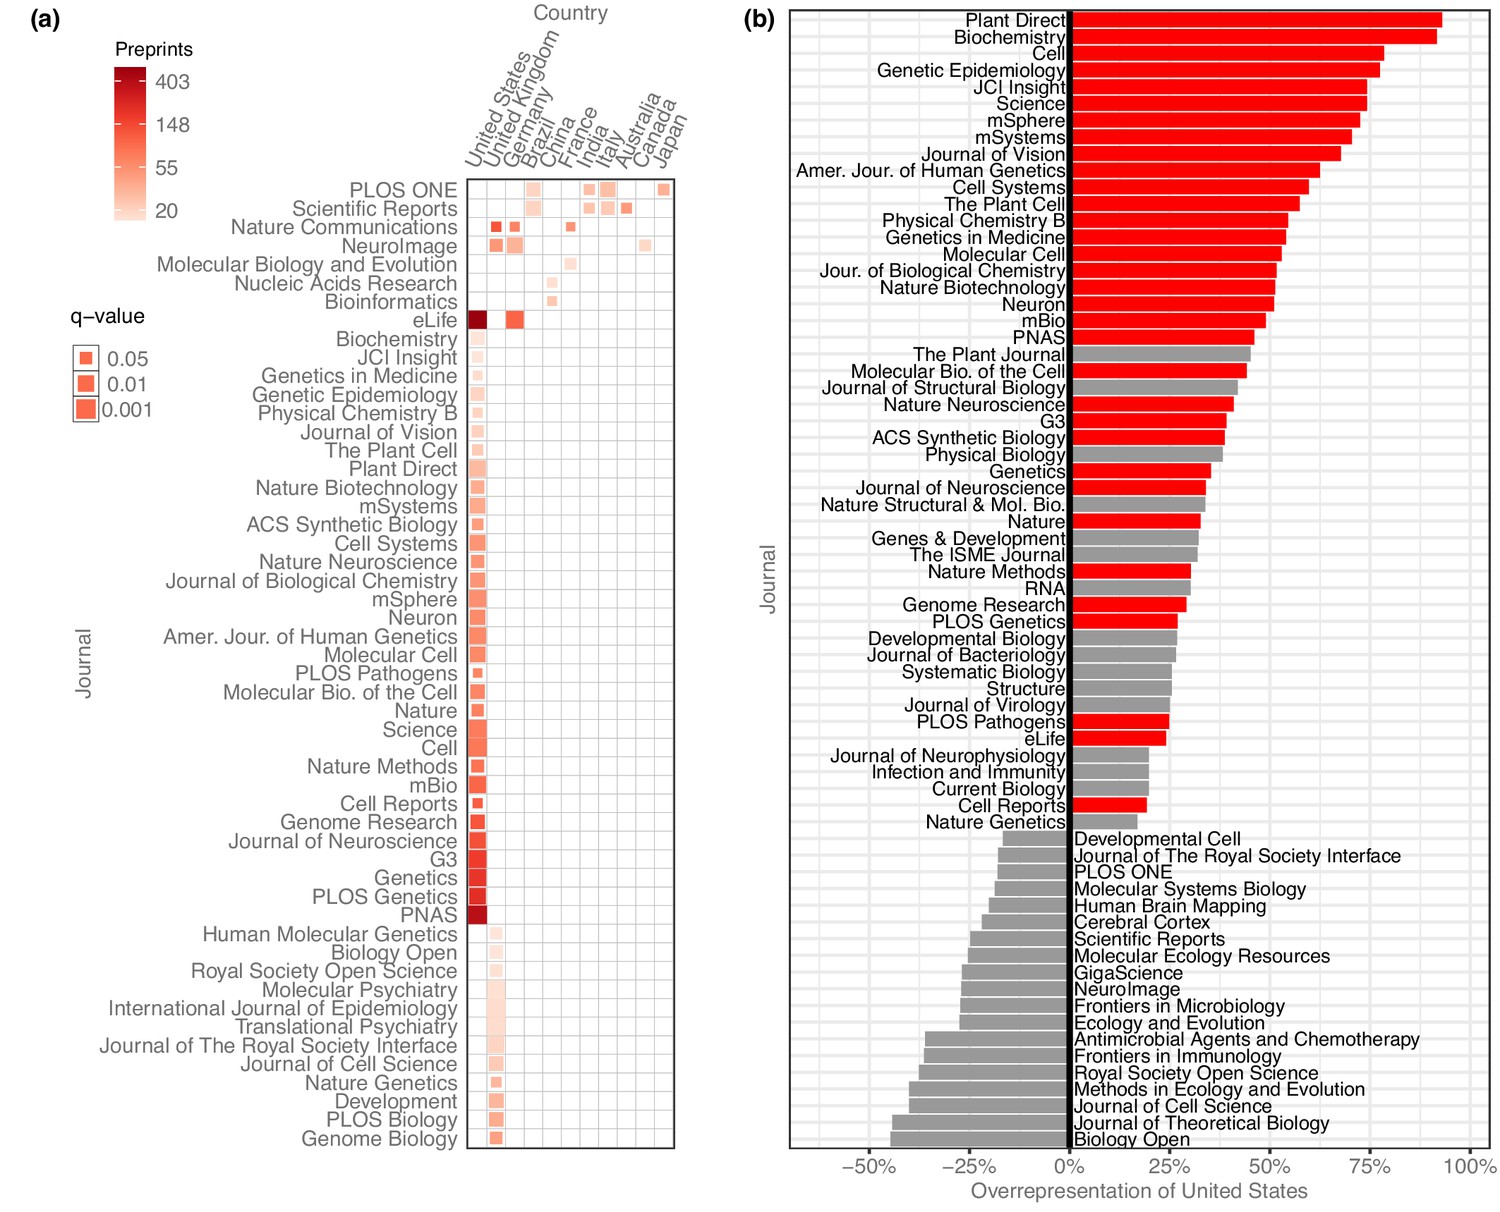
Overrepresentation of US preprints.
(a) A heat map indicating all disproportionately strong (q < 0.05) links between countries and journals, for journals that have published at least 15 preprints from that country. Columns each represent a single country, and rows each represent a single journal. Colors indicate the raw number of preprints published, and the size of each square indicates the statistical significance of that link—larger squares represent smaller q-values. See Figure 5—source data 1 for the results of each statistical test. (b) A bar plot indicating the degree to which US preprints are over- or under-represented in a journal’s published bioRxiv preprints. The y-axis lists all the journals that published at least 15 preprints with a US senior author. The x-axis indicates the overrepresentation of US preprints compared to the expected number: for example, a value of ‘0%’ would indicate the journal published the same proportion of US preprints as all journals combined. A value of ‘100%’ would indicate the journal published twice as many U. preprints as expected, based on the overall representation of the US among published preprints. Journals for which the difference in representation was less than 15% in either direction are not displayed. The red bars indicate which of these relationships were significant using the Benjamini–Hochberg-adjusted results from χ² tests shown in panel A.
-
Figure 5—source data 1
Journal–country links.
Each row represents a combination of country and journal, sorted in ascending order using the ‘padj’ column, then descending order using the ‘preprints’ column. ‘country’ indicates the name of a country as recorded in the ROR dataset. ‘journal’ indicates the name of a journal that has published preprints from the specified country. ‘preprints’ indicates the number of preprints last updated prior to 2019 that were published by the specified journal that list a senior author affiliated with the specified country. ‘expected’ indicates the number of preprints we would expect the specified journal to have published from the specified country, if the country and journal both published the same number of papers, but the journal’s publications mirrored the country-level proportions observed in published bioRxiv preprints overall. ‘p’ indicates the p-value of a chi-squared test as described in the ‘Methods’ section. ‘padj’ lists the p-value from the ‘p’ column, adjusted to control the false-discovery rate using the Benjamini–Hochberg procedure. ‘journaltotal’ lists the total preprints published by the specified journal that were last updated on bioRxiv prior to 2019. ‘countrytotal’ lists the total preprints posted to bioRxiv prior to 2019 that list a senior author affiliated with the specified country.
- https://cdn.elifesciences.org/articles/58496/elife-58496-fig5-data1-v1.csv
Tables
Table 1
Preprints per country.
| Country | Preprints, senior author (proportion) | Preprints, any author (proportion) |
|---|---|---|
| United States | 26,598 (39.2%) | 34,676 (51.1%) |
| United Kingdom | 7151 (10.5%) | 11,578 (17.1%) |
| (Unknown) | 4985 (7.3%) | 17,635 (26.0%) |
| Germany | 3668 (7.3%) | 7157 (10.5%) |
| France | 2863 (4.2%) | 5218 (7.7%) |
| China | 2778 (4.1%) | 4609 (6.8%) |
| Canada | 2380 (3.5%) | 4409 (6.5%) |
| Australia | 1755 (2.6%) | 3260 (4.8%) |
| Switzerland | 1364 (2.0%) | 2779 (4.1%) |
| Netherlands | 1291 (1.9%) | 2764 (4.1%) |
| Japan | 1263 (1.9%) | 2287 (3.4%) |
| India | 1212 (1.8%) | 1769 (2.6%) |
-
All 11 countries with more than 1000 preprints attributed to a senior author affiliated with that country. The percentages in the ‘Preprints, any author’ column sum to more than 100% because preprints may be counted for more than one country. A full list of countries is provided in Figure 1—source data 1.
Additional files
Download links
A two-part list of links to download the article, or parts of the article, in various formats.
Downloads (link to download the article as PDF)
Open citations (links to open the citations from this article in various online reference manager services)
Cite this article (links to download the citations from this article in formats compatible with various reference manager tools)
Meta-Research: International authorship and collaboration across bioRxiv preprints
eLife 9:e58496.
https://doi.org/10.7554/eLife.58496


