Meta-Research: The changing career paths of PhDs and postdocs trained at EMBL
- Genome Biology Unit, European Molecular Biology Laboratory, Germany
- EMBL International Centre for Advanced Training, European Molecular Biology Laboratory, Germany
Figures
Figure 1 with 3 supplements
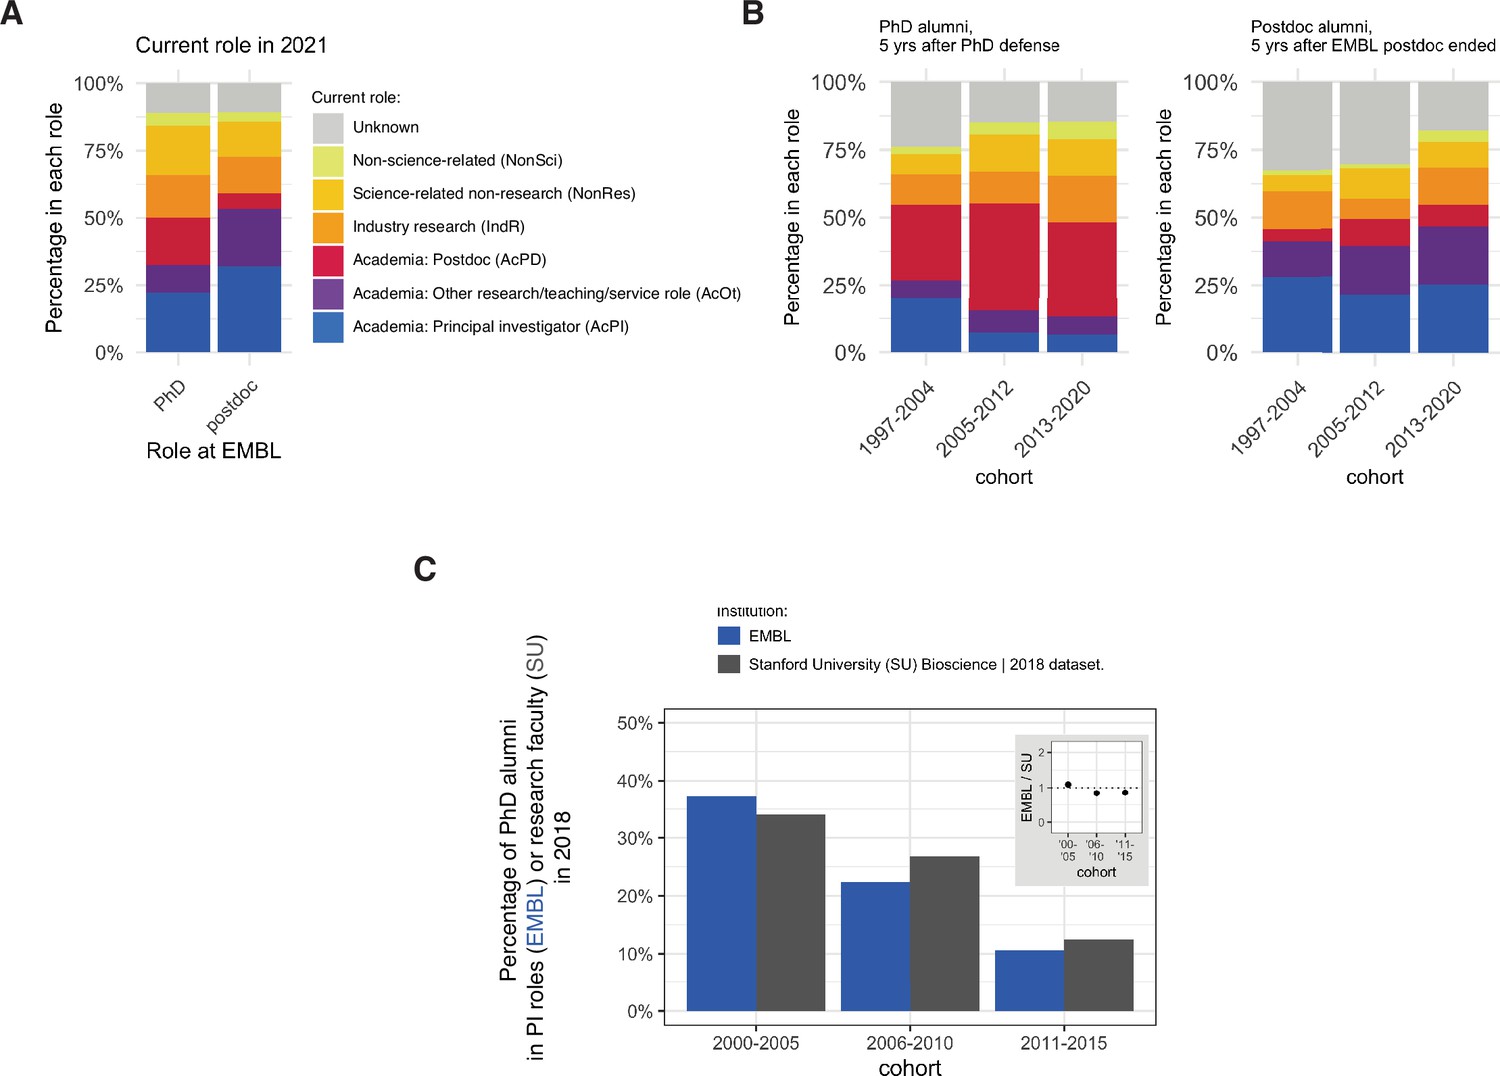
Career outcomes for EMBL alumni.
(A) Charts showing the percentage of PhD alumni (n=969) and postdoc alumni (n=1315) from EMBL in different careers in 2021 (see Table 1). (B) Charts showing percentage of PhD (left, n=800) and postdoc (right, n=1053) alumni in different careers five years after finishing their PhD or postdoc, for three different cohorts. Chart excludes 169 PhD students and 262 postdocs who have not yet reached the five-year time point. (C) Charts showing the percentage of PhD alumni from EMBL (blue column) in PI positions with the percentage of PhD alumni from Stanford University (grey column) in research-focused faculty positions (Stanford Biosciences, 2021). Detailed information about the comparison group can be found in Table S3 in Supplementary file 1.
-
Figure 1—source data 1
Summary data plotted in Figure 1A, B.
- https://cdn.elifesciences.org/articles/78706/elife-78706-fig1-data1-v1.xlsx
Figure 1—figure supplement 1
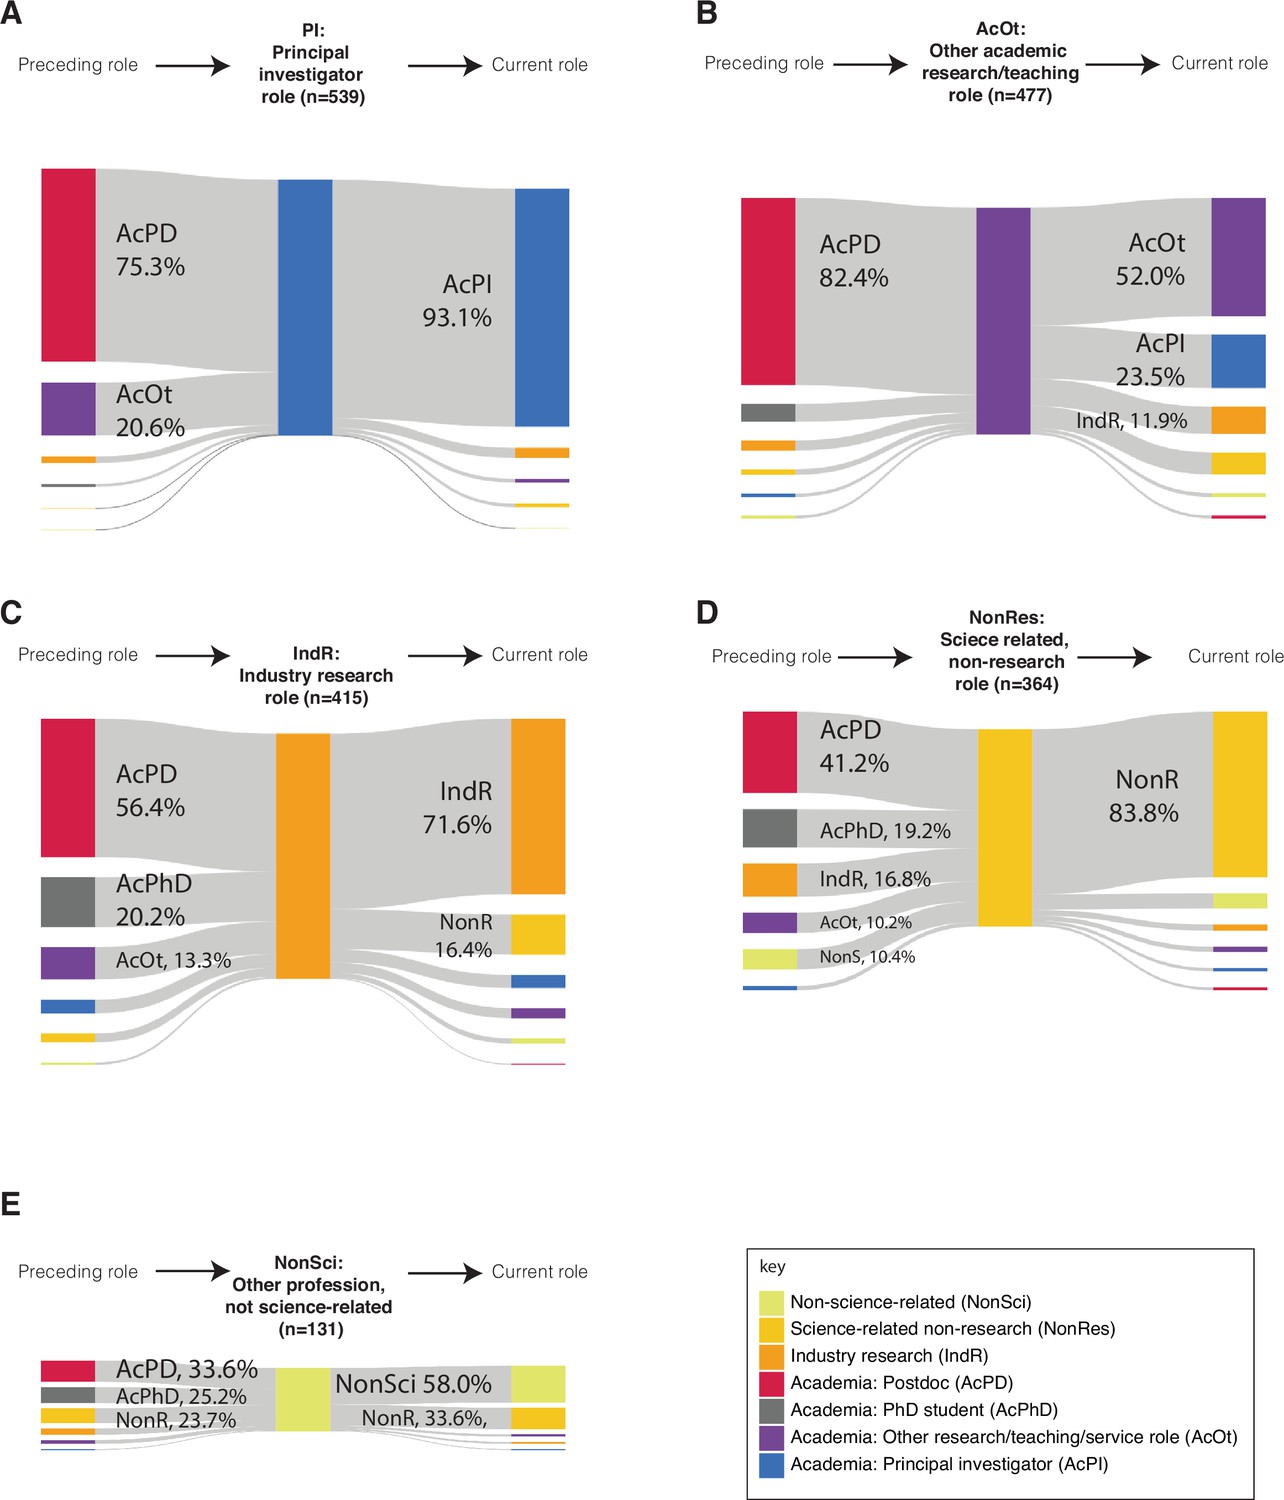
Sankey diagrams showing movement between different careers.
(A) Sankey diagram showing that of the 539 alumni who have held an Academia: PI (AcPI) position at some time, 75.3% moved into their first AcPI position from an Academia: Postdoc (AcPD) position, and 20.6% moved from an Academia: Other (AcOt) positon; 93.1% of these alumni are still in an AcPI position. Abbreviations and percentages for a position are only shown for values of 10% or higher. (B) Similar Sankey diagram for the 477 alumni who have held an AcOt position at some time. (C) Similar Sankey diagram for the 415 alumni who have held an Industry Research (IndR) position at some time. (D) Similar Sankey diagram for the 364 alumni who have held a Science-related Non-research (NonRes) position at some time. (E) Similar Sankey diagram for the 131 alumni who have held a Non-science-related (NonSci) position at some time. Data are shown only for alumni for whom a detailed career path is available (n=1626). A preceding AcPD position includes entry direct from an EMBL postdoc and entry via a postdoc position held after leaving EMBL. If an EMBL PhD student became a bridging postdoc in the same lab, this is included in the Academia: PhD category. Diagrams were created in R and scaled manually so that the height is proportional to the number of alumni in the role.
-
Figure 1—figure supplement 1—source data 1
Summary data plotted in the simplified Sankey plots in Figure 1—figure supplement 1.
- https://cdn.elifesciences.org/articles/78706/elife-78706-fig1-figsupp1-data1-v1.xlsx
Figure 1—figure supplement 2
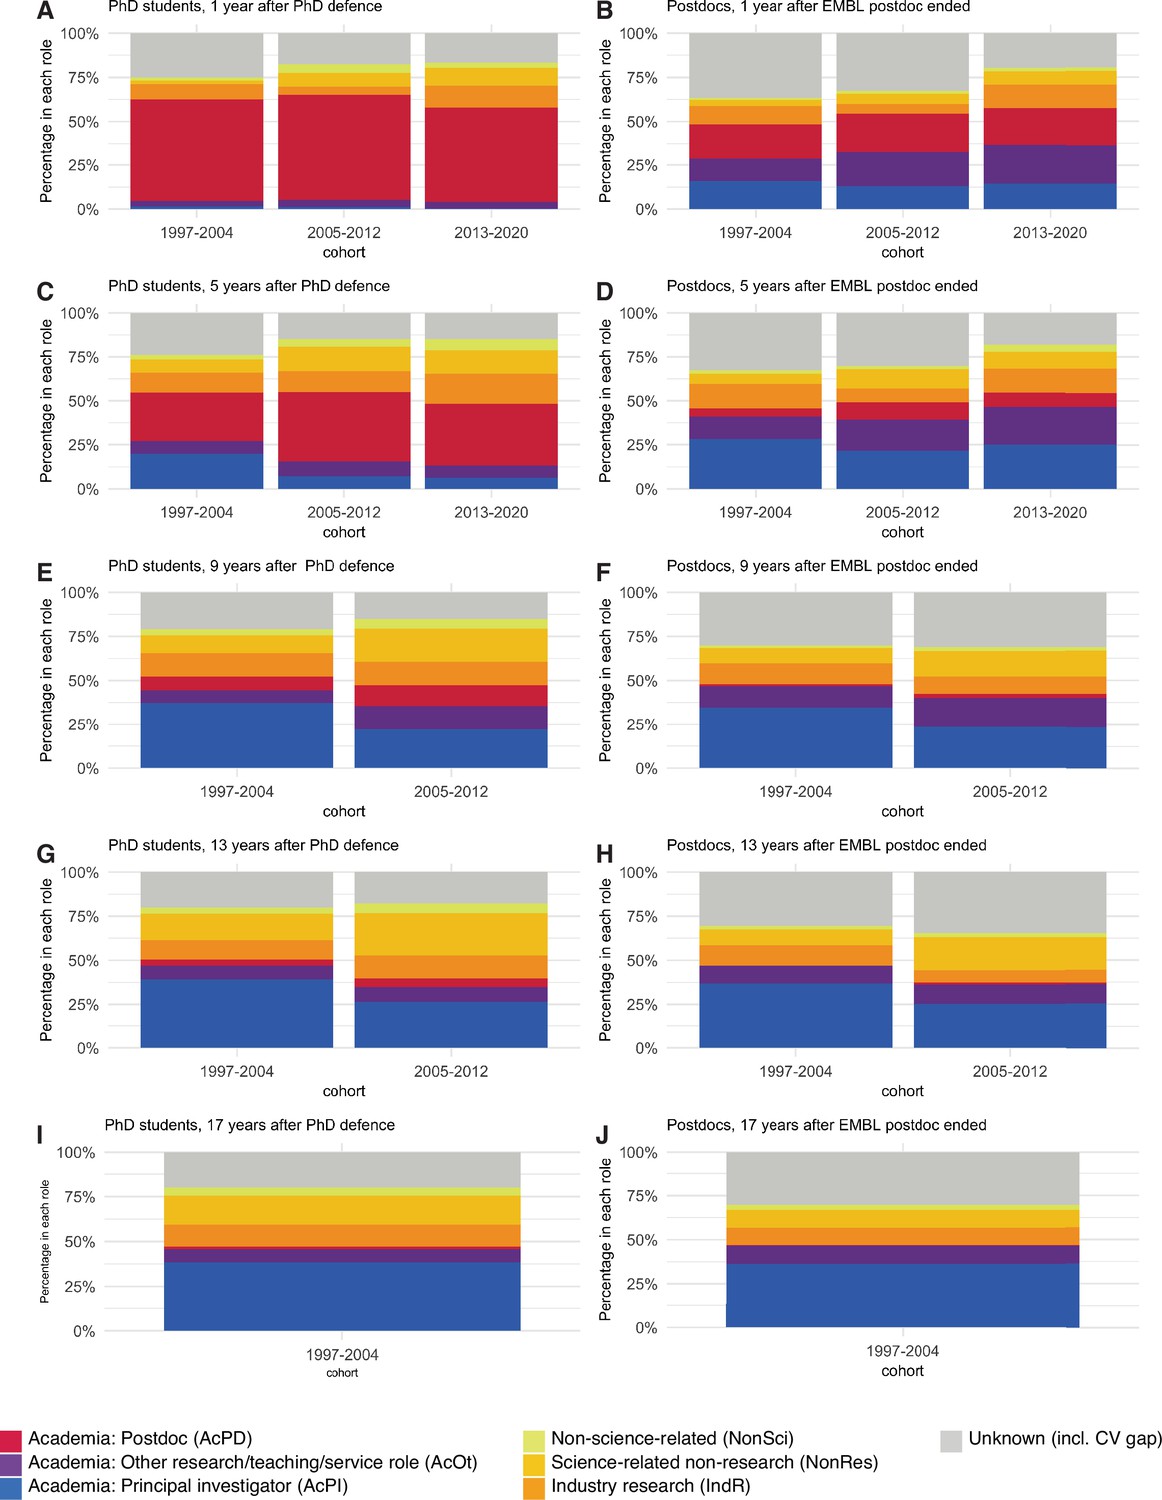
Career outcomes for EMBL alumni at five different time points for three different cohorts.
Charts showing the percentage of PhD and postdoc alumni in different roles at five different time points for three different cohorts. See Table 3 for cohort sizes; alumni who have not yet reached a given time point are not included. (A) PhD alumni 1 year after EMBL (n=969). (B) Postdoc alumni 1 year after EMBL (n=1315). (C) PhD alumni 5 years after EMBL (n=800). (D) Postdoc alumni 5 years after EMBL (n=1053). (E) PhD alumni 9 years after EMBL (n=597). (F) Postdoc alumni 9 years after EMBL (n=791). (G) PhD alumni 13 years after EMBL (n=419). (H) Postdoc alumni 13 years after EMBL (n=578). (I) PhD alumni 17 years after EMBL (n=256). (J) Postdoc alumni 17 years after EMBL (n=369).
-
Figure 1—figure supplement 2—source data 1
Summary data plotted in Figure 1—figure supplement 2.
- https://cdn.elifesciences.org/articles/78706/elife-78706-fig1-figsupp2-data1-v1.xlsx
Figure 1—figure supplement 3
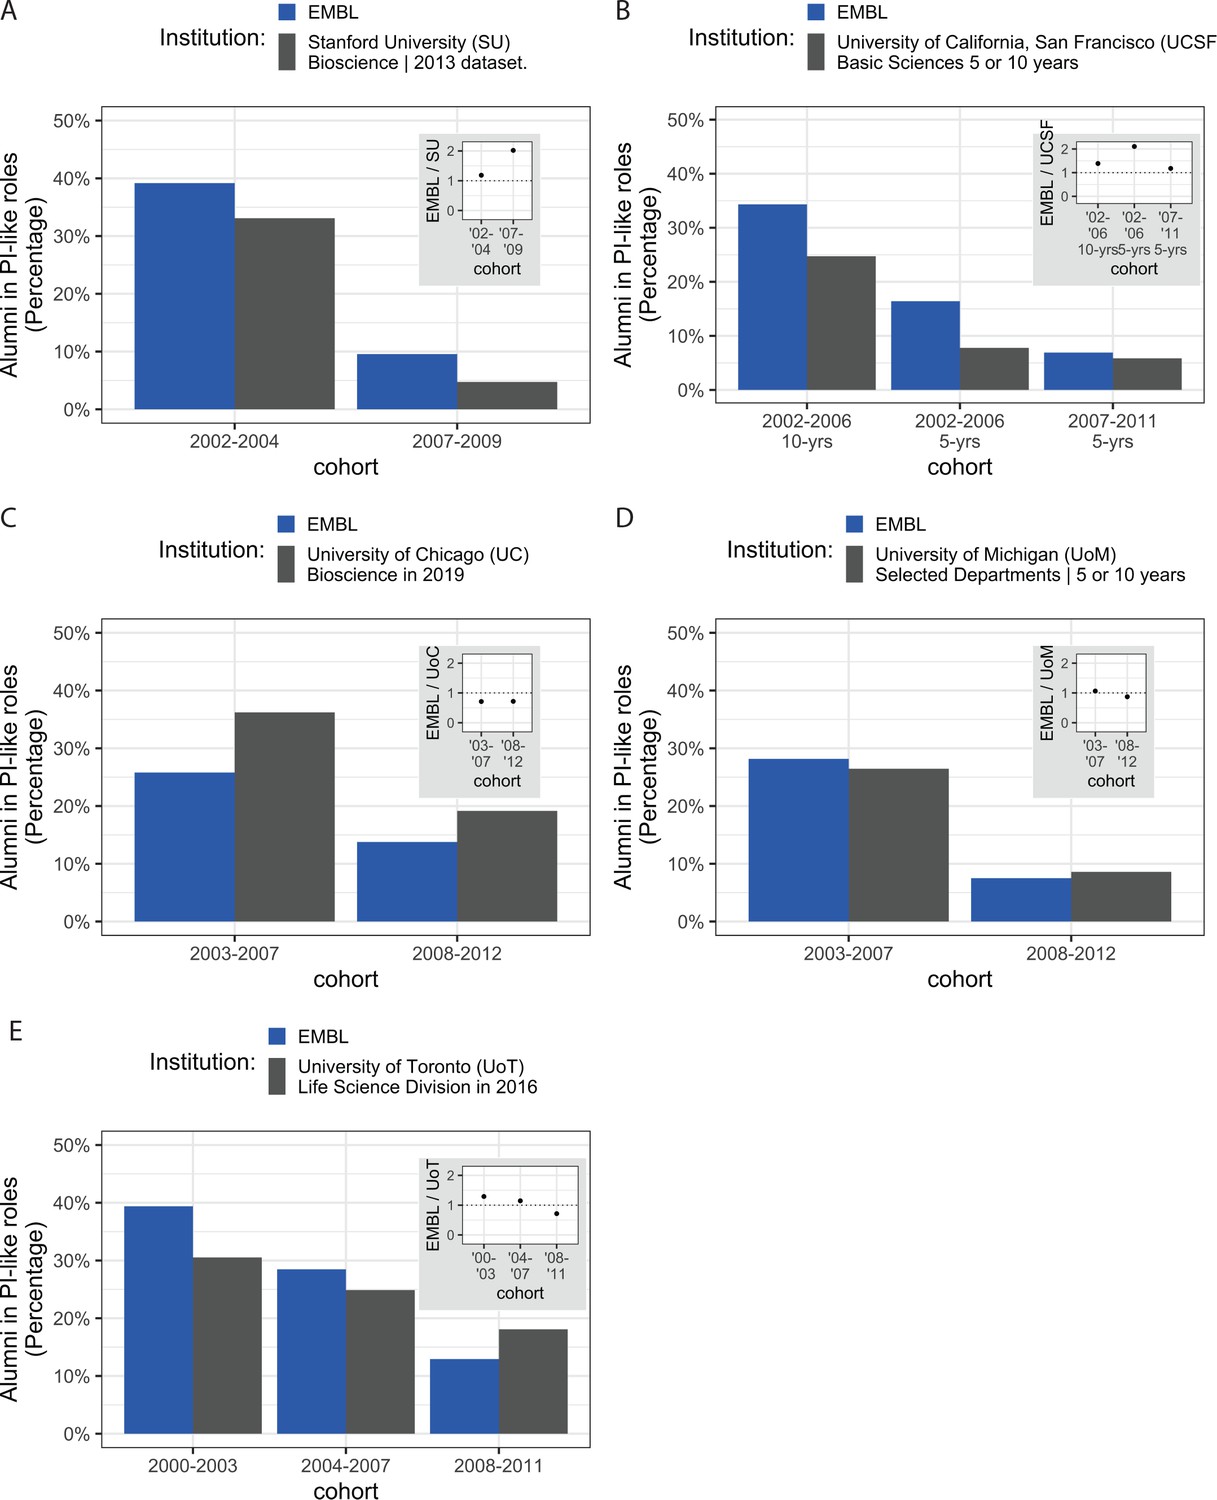
Comparing EMBL alumni with alumni from institutions in Canada and the United States.
Charts comparing percentage of PhD alumni in PI or PI-like positions for EMBL and Stanford University, the University of California San Francisco (UCSF), the University of Chicago (Bioscience Division), the University of Michigan, and the University of Toronto (Life Sciences Division) for different cohorts at various time points. (A) Chart comparing PhD alumni from EMBL in PI positions (blue) and Stanford in tenure-track faculty positions (grey) for two cohorts; the Stanford data were collated in 2013 (Stanford IT&DS, 2020). (B) Chart comparing PhD alumni from EMBL in PI positions (blue) and PhD alumni from UCSF in tenure-track faculty positions (grey) a 2002–2006 cohort after 10 years and 5 years, and a 2007–2011 cohort after 5 years (UCSF Graduate Division, 2021) (C) Chart comparing PhD alumni from EMBL in PI positions (blue) and PhD alumni from Chicago in tenure-track faculty positions (grey) for two cohorts (University of Chicago, 2021). (D) Chart comparing PhD alumni from EMBL in PI positions (blue) and PhD alumni from Michigan in tenure-track faculty positions (grey) for two cohorts. (University of Michigan, 2018) (E) Chart comparing PhD alumni from EMBL in PI positions (blue) and PhD alumni from Toronto in tenure-track faculty positions (grey) for three cohorts; the Torotono data were collated in 2016 (University of Toronto, no date). Detailed information about the comparison groups, including cohort sizes, can be found in Table S3 in Supplementary file 1; percentages are the number alumni known to be in a PI or PI-like position at the relevant time point as a percentage of all PhD students in that cohort (including students whose position was unknown at that time point).
Figure 2 with 1 supplement
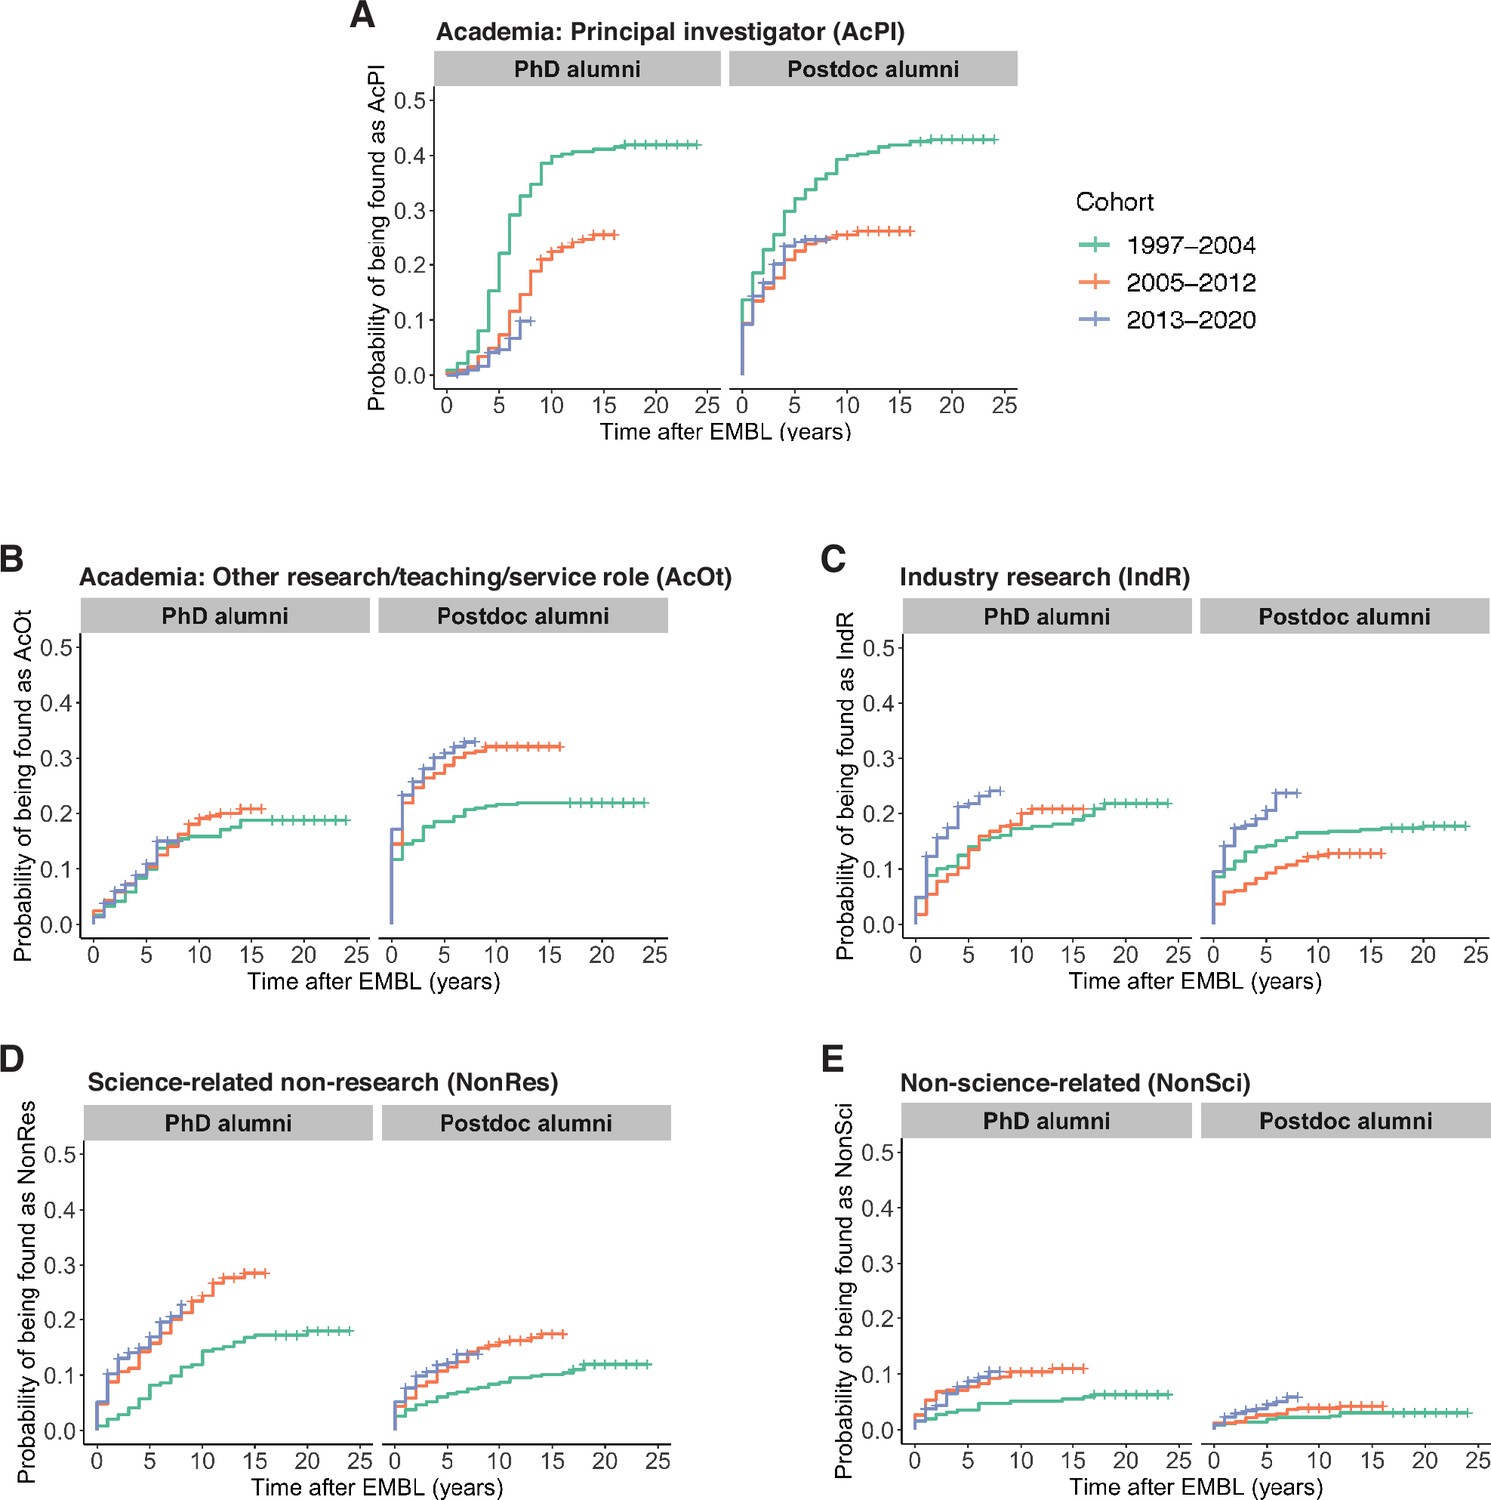
Changes in career outcomes for more recent cohorts.
(A) Kaplan–Meier plots showing the estimated probability of an individual being in a PI position (y-axis) as a function of time after EMBL (x-axis) for three cohorts of PhD alumni (left) and three cohorts of postdoc alumni (right). Time after EMBL refers to the number of calendar years between PhD defence or leaving the EMBL postdoc programme and first PI position. (B–E) Similar Kaplan–Meier plots for Academia: Other positions (B), Industry Research positions (C), Science-related Non-research positions (D), and Non-science-related professions (E). Hazard ratios calculated by a Cox regression model can be found in Table S4 in Supplementary file 1.
Figure 2—figure supplement 1
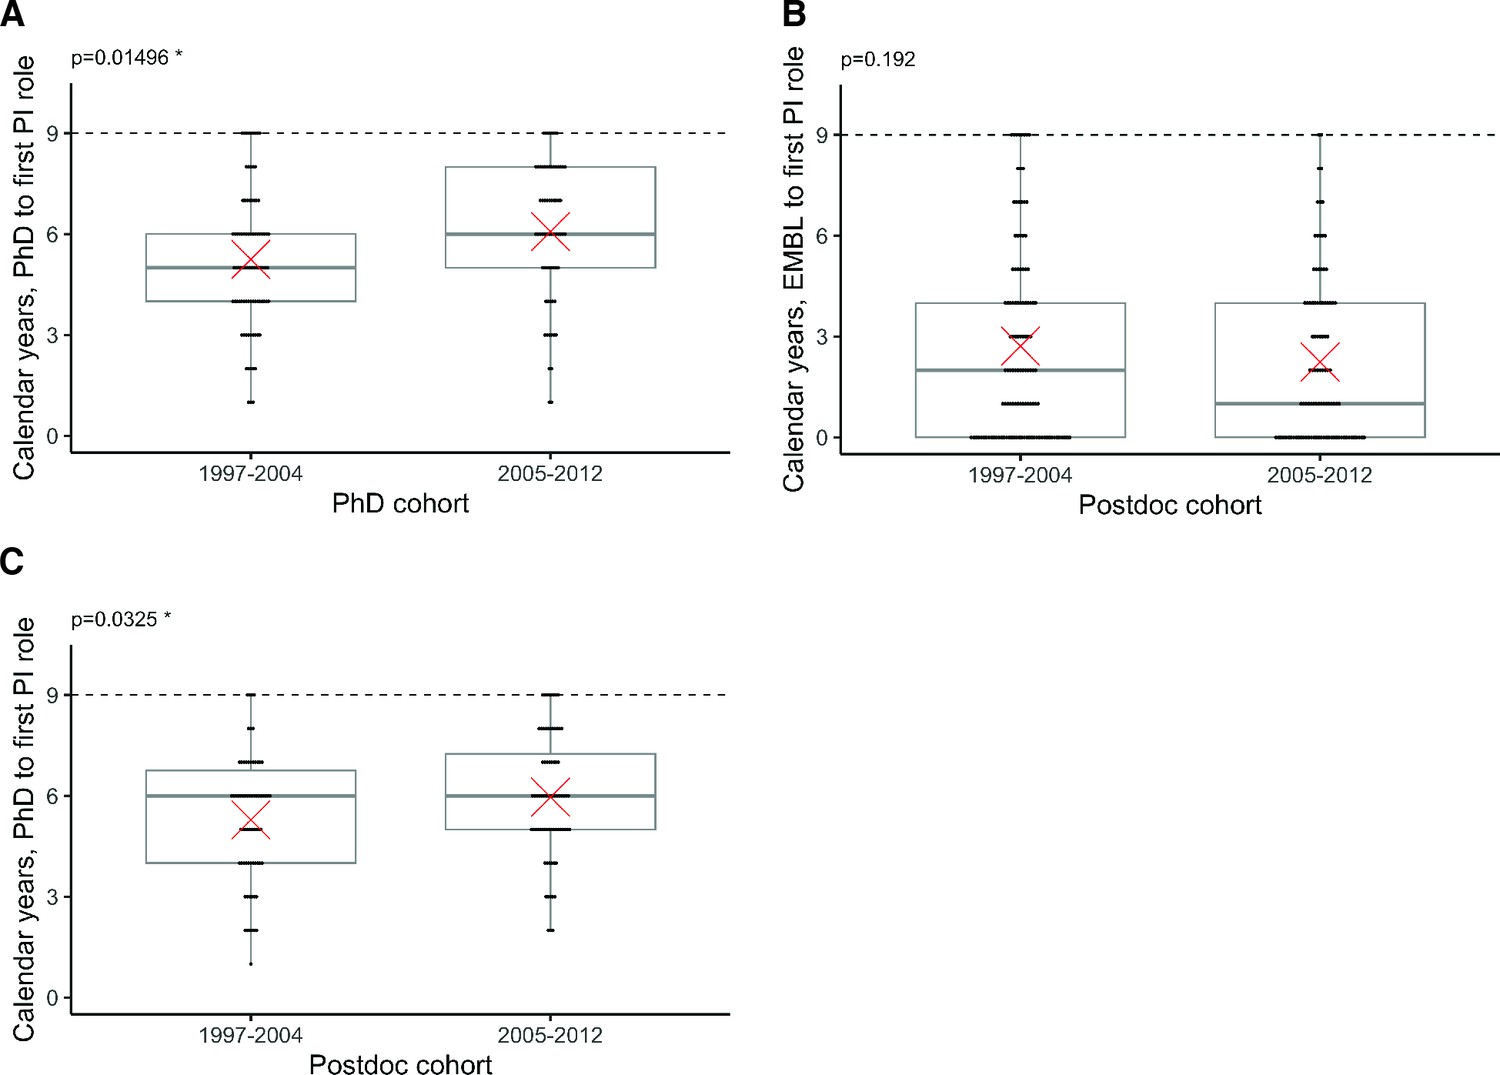
Length of time taken to become a PI.
(A) Box plot with overlaid dot plot showing the distribution of the length of time between PhD and first PI role for two cohorts of alumni who defended their PhD between 1997 and 2012 and became a PI within nine calendar years (and for whom we have a detailed career path; n=157). The mean value is indicated as a red cross and the p-values were calculated using Welch’s t-test. The difference between the mean for the two cohorts (5.2 years and 6.1 years) was statistically significant (P=0.01496). (B) Plots for length of time between completion of an EMBL postdoc and first PI role for two cohorts of alumni who completed their postdoc between 1997 and 2012 (n=218). The difference between the two cohorts was not statistically significant (P=0.192). (C) Plots for length of time between PhD and first PI role for the two cohorts of alumni who completed their EMBL postdoc between 1997 and 2012 (and for whom we know year of PhD and have a detailed career path; n=146; note these alumni completed their PhD somewhere else before starting a postdoc at EMBL). The difference between the mean for the two cohorts (5.3 years and 6.0 years) was statistically significant (P=0.0325).
-
Figure 2—figure supplement 1—source data 1
Summary data plotted in Figure 2—figure supplement 1.
- https://cdn.elifesciences.org/articles/78706/elife-78706-fig2-figsupp1-data1-v1.xlsx
Figure 3 with 2 supplements
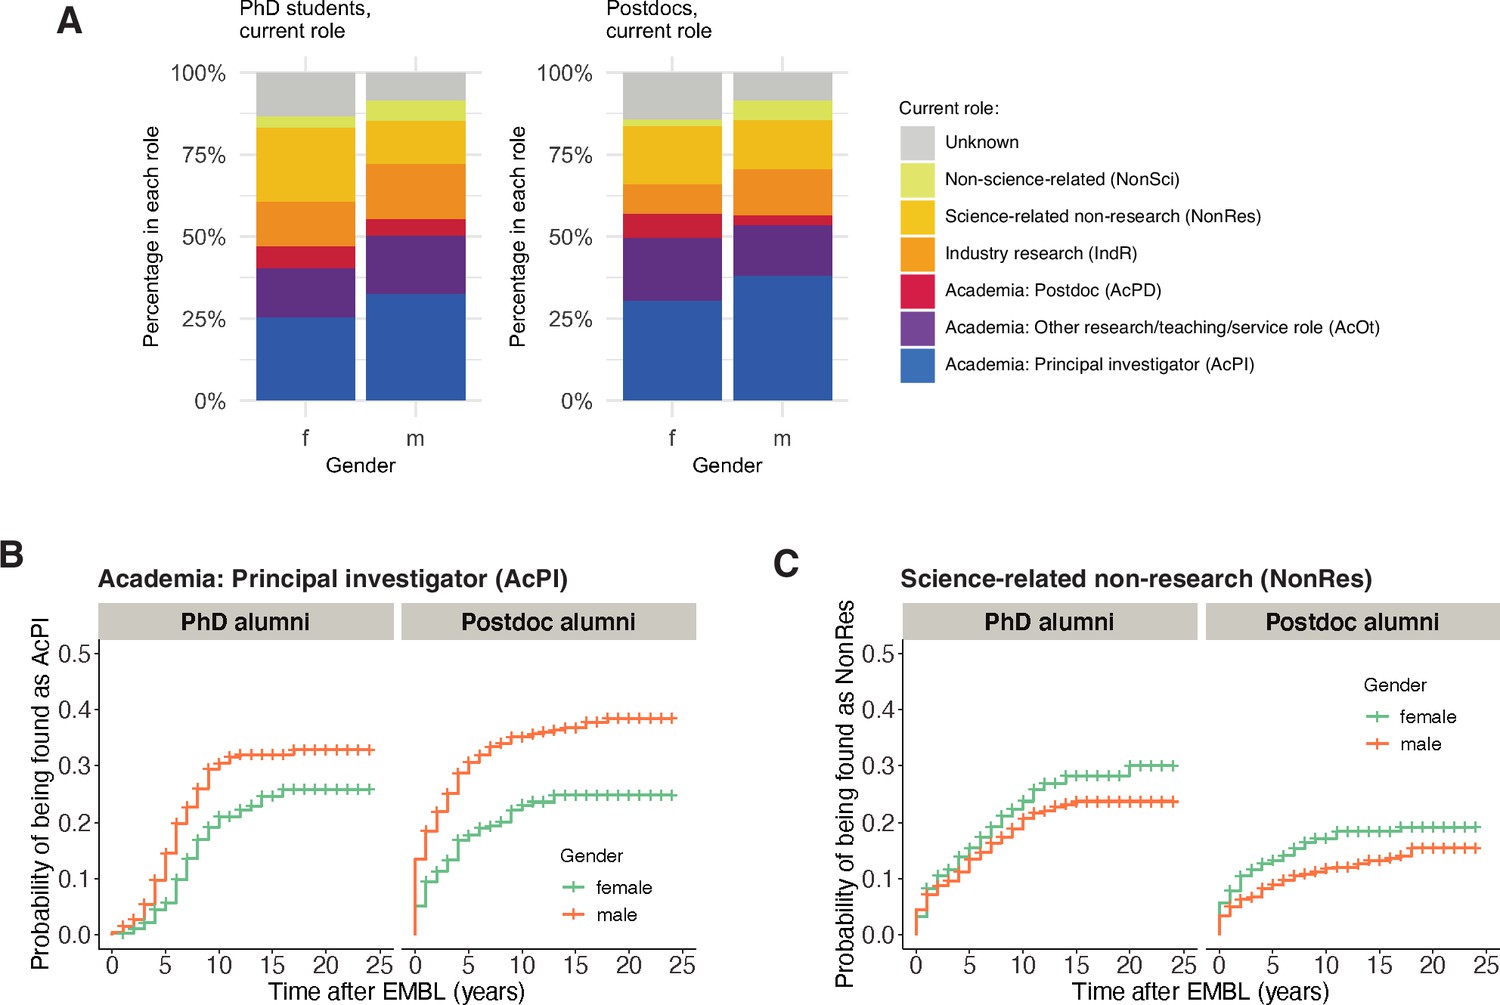
Gender differences in career outcomes.
(A) Charts showing the percentage of female (n=415) and male (n=554) PhD alumni, and female (n=492) and male (n=823) postdoc alumni, in different careers in 2021. (B) Kaplan–Meier plots showing the estimated probability of an individual being in a PI position (y-axis) as a function of time after EMBL (x-axis), stratified by gender for PhD alumni (left) and postdoc alumni (right). (C) Kaplan–Meier plots showing the estimated probability of an individual being in a science-related non-research position as a function of time after EMBL, stratified by gender for PhD alumni (left) and postdoc alumni (right). Kaplan–Meier plots for other career outcomes are shown in Figure 3—figure supplement 2. Hazard ratios calculated by a Cox regression model can be found in Table S5 in Supplementary file 1.
-
Figure 3—source data 1
Summary data plotted in Figure 3A.
- https://cdn.elifesciences.org/articles/78706/elife-78706-fig3-data1-v1.xlsx
Figure 3—figure supplement 1

Length of time taken to become a PI for female and male alumni.
(A) Box plot with overlaid dot plot showing the distribution of the length of time between PhD and first PI role for female alumni (left) and male alumni (right) who defended their PhD between 1997 and 2012 and became a PI within nine calendar years (and for whom we have a detailed career path; n=157). The mean value is indicated as a red cross and the p-values calculated using Welch’s t-test. The difference between the mean values for female and male alumni (6.1 years and 5.4 years) was not statistically significant (P=0.0719). (B) Plots for length of time between completion of an EMBL postdoc and first PI role for female alumni (left) and male alumni (right) who completed their postdoc between 1997 and 2012 (n=218). The difference between the mean values for female and male alumni (2.3 years and 3.1 years) was not statistically significant (P=0.0596). (C) Plots for length of time between PhD and first PI role for female alumni (left) and male alumni (right) who completed their EMBL postdoc between 1997 and 2012 and for whom we know year of PhD (and for whom we have a detailed career path; n=146). The difference between the mean values for female and male alumni (5.6 years and 5.7 years) was not statistically significant (P=0.778).
-
Figure 3—figure supplement 1—source data 1
Summary data plotted in Figure 3—figure supplement 1.
- https://cdn.elifesciences.org/articles/78706/elife-78706-fig3-figsupp1-data1-v1.xlsx
Figure 3—figure supplement 2
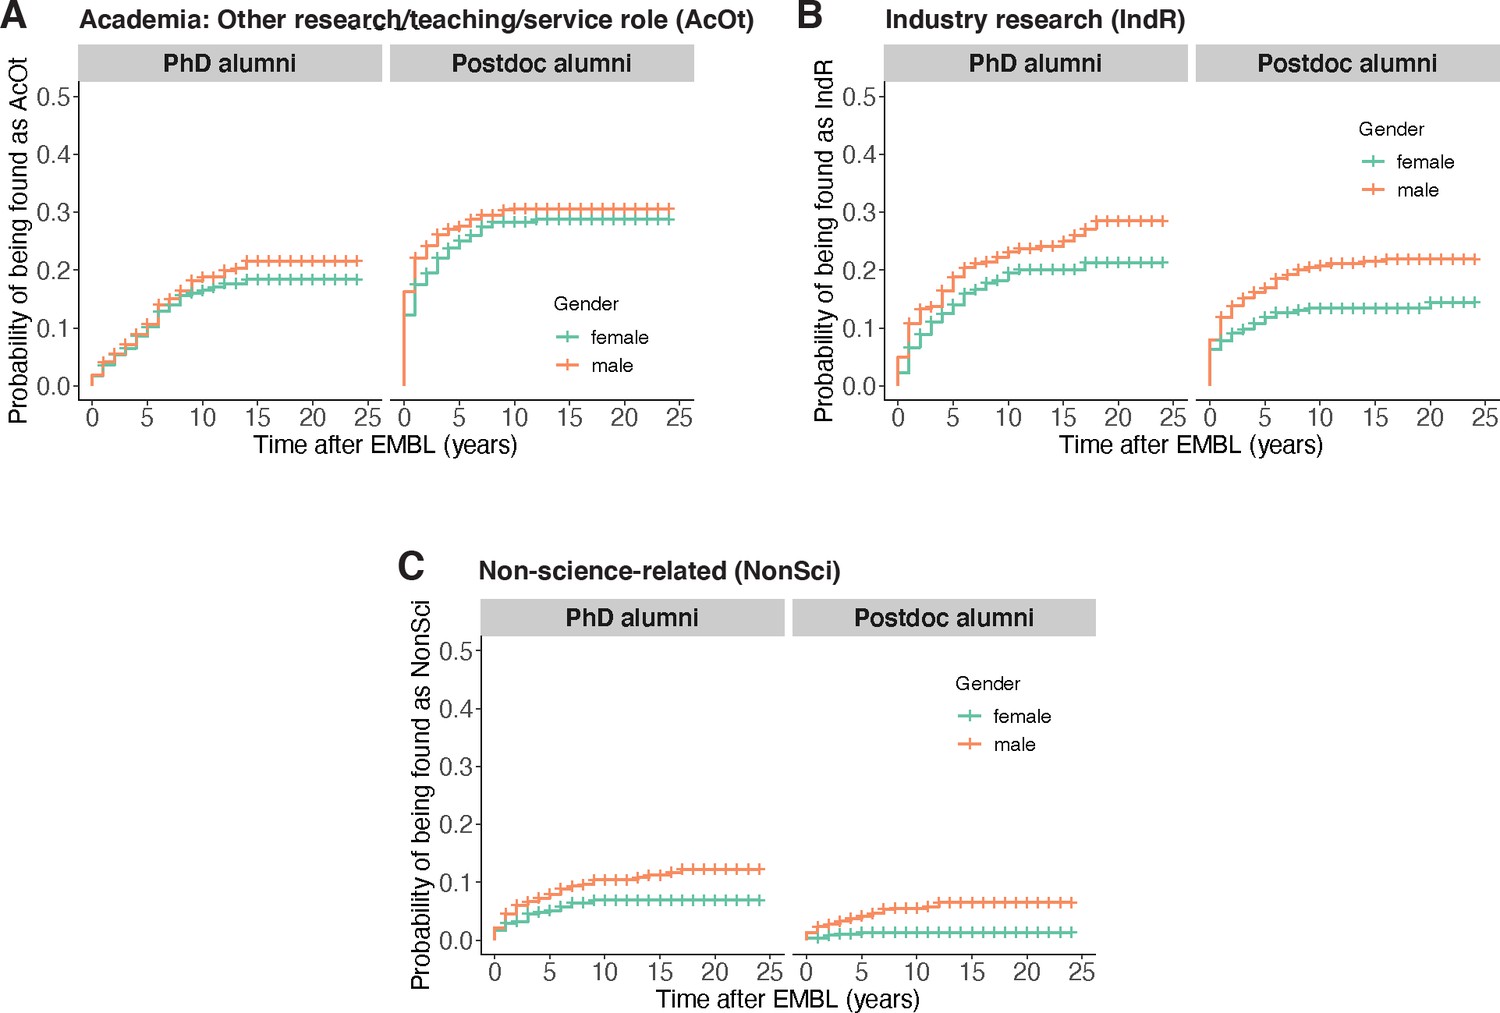
Rate of entry into different types of role by gender.
(A) Kaplan–Meier plots showing the estimated probability of an individual working in Academia: Other (y-axis) as a function of time after EMBL, stratified by gender for PhD alumni (left) and postdoc alumni (right). (B, C) Similar Kaplan–Meier plots for alumni working in Industry Research (B) and in Non-science-related careers (C). Hazard ratios calculated by a Cox regression model can be found in Table S5 in Supplementary file 1.
Figure 4 with 2 supplements
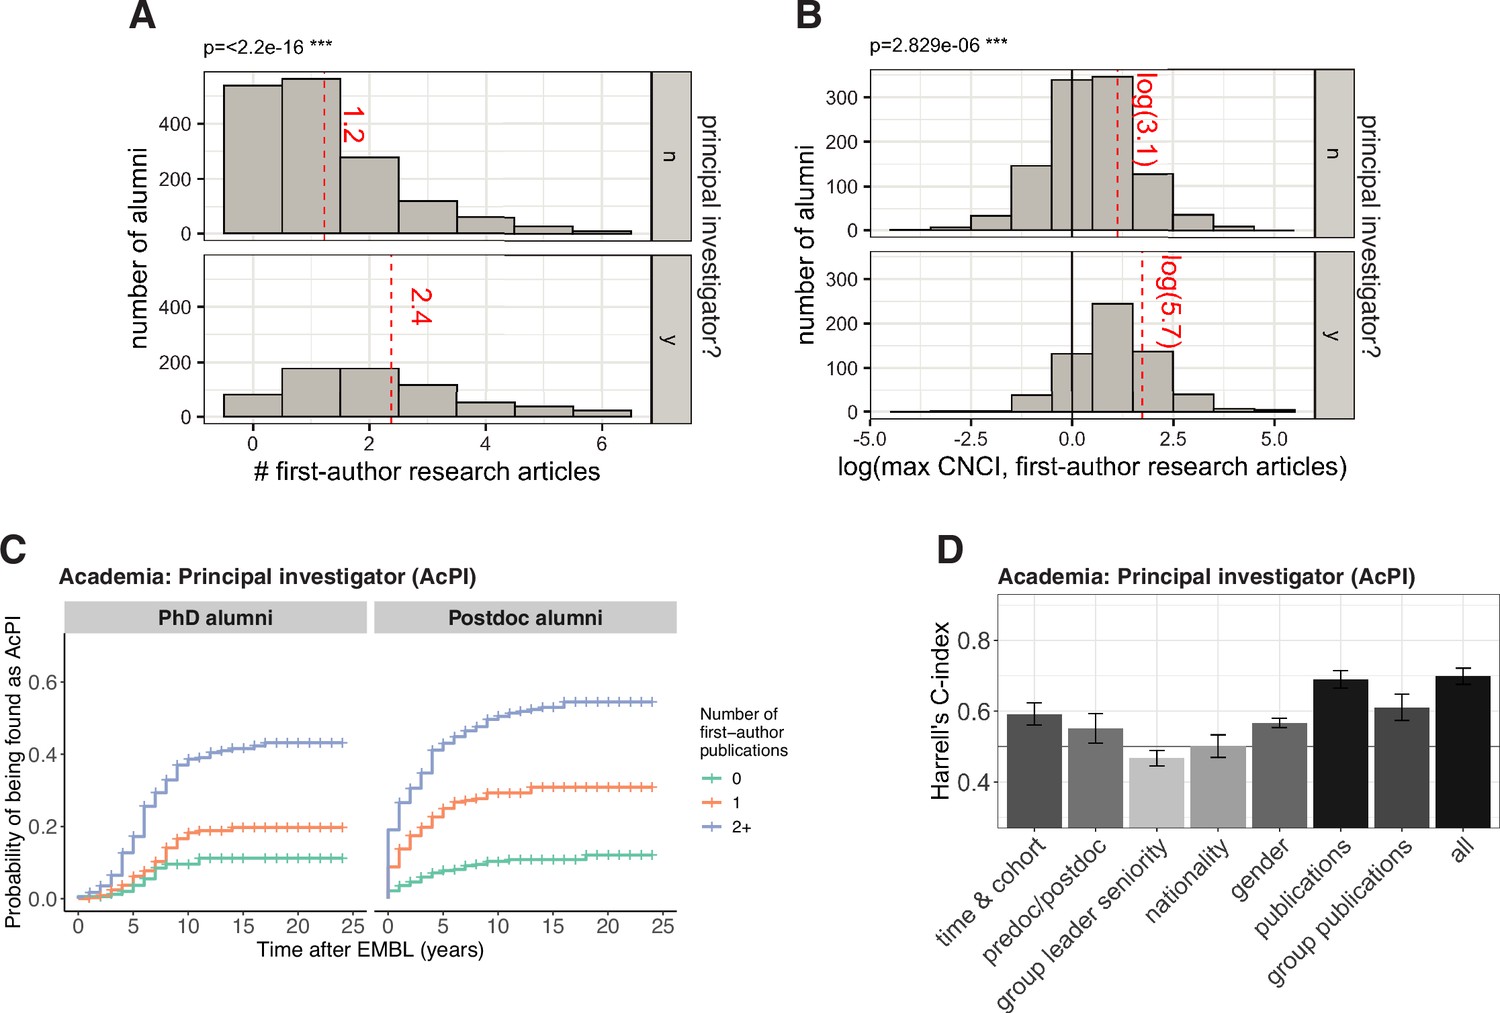
Publication factors are highly correlated with becoming a PI.
(A) Histograms showing the number of alumni who have 0, 1, 2, 3,... first-author articles from their time at EMBL and became PIs (bottom; n=662, excluding 23 outliers), and did not become PIs (top; n=1594, excluding 5 outliers). For clearer visualization, and to protect the identity of alumni with outlying numbers of publications, the x-axis is truncated at the 97.5th percentile. The mean for each group (including outliers) is shown as a red dashed line; alumni who became PIs have an average of 2.4 first-author articles from their time at EMBL, whereas other alumni have an average of 1.2 articles; this difference is significant (P<2.2 × 10⁻¹⁶; Welch’s t-test). (B) 1656 alumni had one or more first-author articles from their time at EMBL that had a CNCI value in the InCites database. For each of these alumni, the natural logarithm of the highest CNCI value was calculated, and these histograms show the number of alumni for which this natural logarithm is between –4.5 and –3.5, between –3.5 and –2.5, and so on; the bottom histogram is for alumni who became PIs, and the top histogram is for other alumni. A CNCI value of 1 (plotted here at ln(1)=0; vertical black line) means that the number of citations received by the article is the same as the average for other articles in that field published in the same year. The mean for each group is shown as a red dashed line; alumni who became PIs have an average CNCI of 5.7, whereas other alumni have an average CNCI of 3.1; this difference is significant (P<2.829 × 10⁻⁶; Welch’s t-test). (C) Kaplan–Meier plots showing the estimated probability of an individual becoming a PI (y-axis) as a function of time after EMBL (x-axis), stratified by number of first-author publications from research completed at EMBL, for PhD alumni (left) and postdoc alumni (right). Hazard ratios calculated by a Cox regression model can be found in Table S7 in Supplementary file 1. (D) Harrell’s C-Index for various Cox models for predicting entry into PI positions. The first seven bars show the C-index for univariate and multivariate models for a subset of covariates (which subset is shown below the x-axis), and the eighth bar is for a multivariate model that includes the covariates from all subsets. The subsets are time & cohort (multivariate, including the variables: cohort, PhD year (if known), start and end year at EMBL), predoc (ie PhD student)/postdoc (univariate), group leader seniority (univariate), nationality (univariate), gender (univariate), publications (multivariate: containing variables related to the alumni’s publications from their EMBL work; these are variables with a name beginning with “pubs” in Table S1 in Supplementary file 1) and group publications (multivariate: containing variables related to the aggregated publication statistics for all PhD students and postdocs who were trained in the same group; these are variables with a name beginning with “group_pubs” in Table S1 in Supplementary file 1). A value of above 0.5 indicates that a model has predictive power, with a value of 1.0 indicating complete concordance between predicted and observed order to outcome (e.g. entry into a PI position). Bars denote the mean, and the error bars show the 95% confidence intervals. A value of above 0.5 indicates that a model has predictive power, with a value of 1.0 indicating complete concordance between predicted and observed order to outcome (e.g. entry into a PI position). Bars denote the mean, and the error bars show the 95% confidence intervals.
-
Figure 4—source data 1
Summary data plotted in Figure 4A, B and D.
- https://cdn.elifesciences.org/articles/78706/elife-78706-fig4-data1-v1.xlsx
Figure 4—figure supplement 1

Cox models for predicting entry into various careers.
Harrell’s C-Index for various Cox models for predicting entry into Academia: Other (A), Industry Research (B), Science-related Non-research (C), and Non-science-related careers (D). As in Figure 4D, the first seven bars show the C-index for univariate and multivariate models containing subsets of variables, the eighth bar is for a multivariate model containing all variables, and a value of above 0.5 indicates that a model has predictive power.
-
Figure 4—figure supplement 1—source data 1
Summary data plotted in Figure 4—figure supplement 1.
- https://cdn.elifesciences.org/articles/78706/elife-78706-fig4-figsupp1-data1-v1.xlsx
Figure 4—figure supplement 2
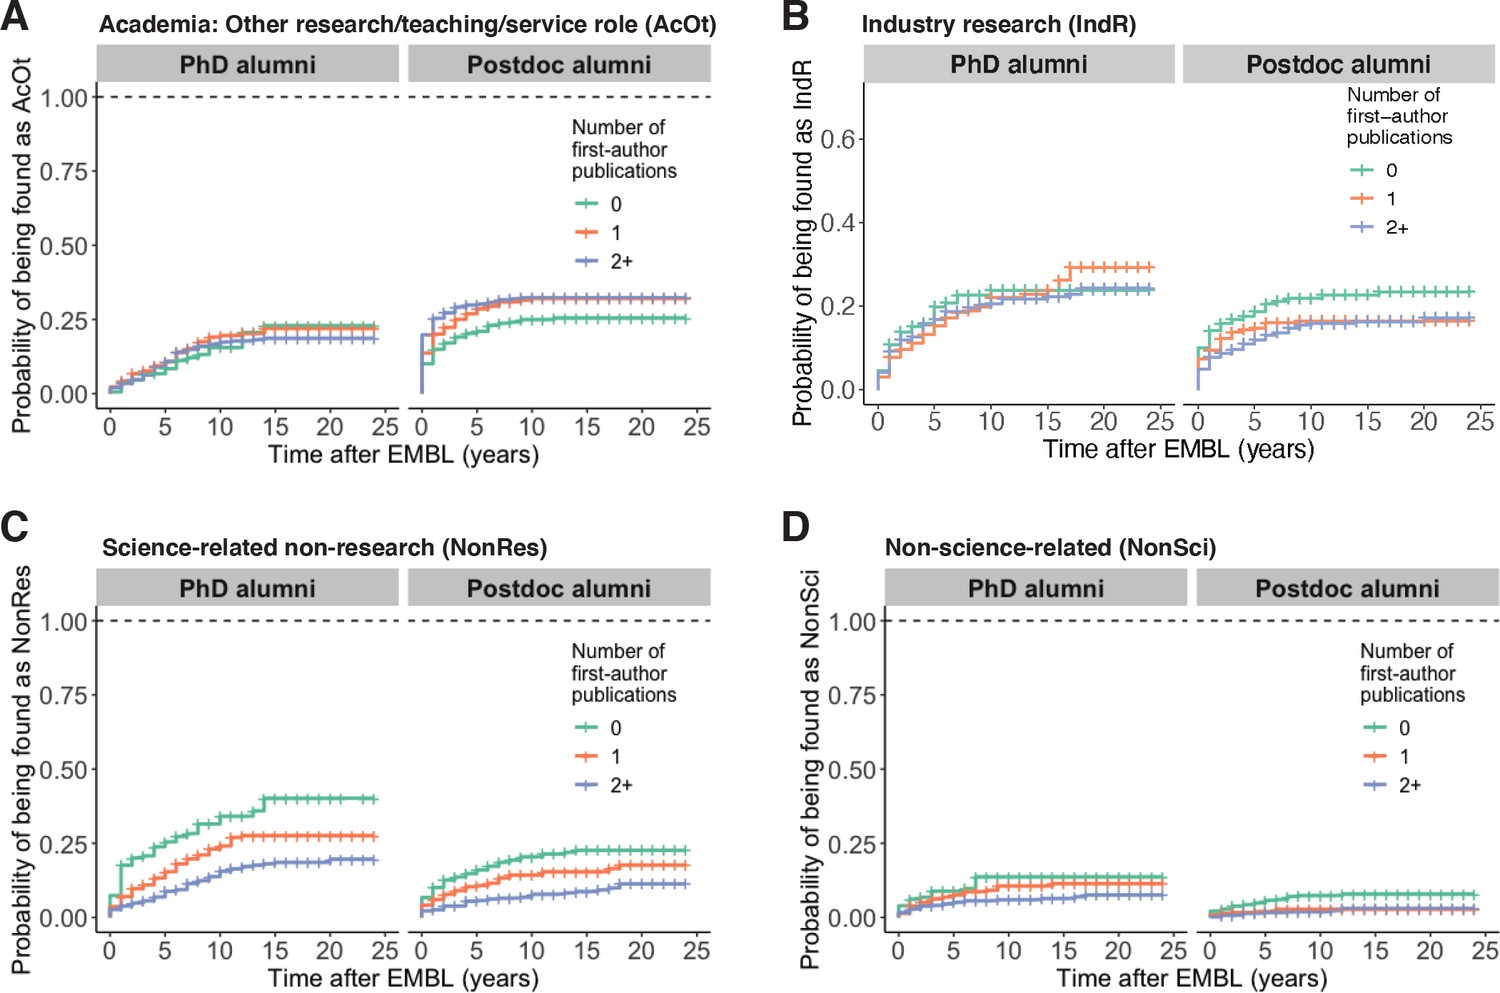
Entry into various careers and number of first-author publications.
Kaplan–Meier plots showing the estimated probability of an individual being in various careers (y-axis) as a function of time after EMBL (x-axis), stratified by number of first-author publications from research completed at EMBL for PhD alumni (left) and postdoc alumni (right). Hazard ratios calculated by a Cox regression model can be found in Table S7 in Supplementary file 1.
Figure 5
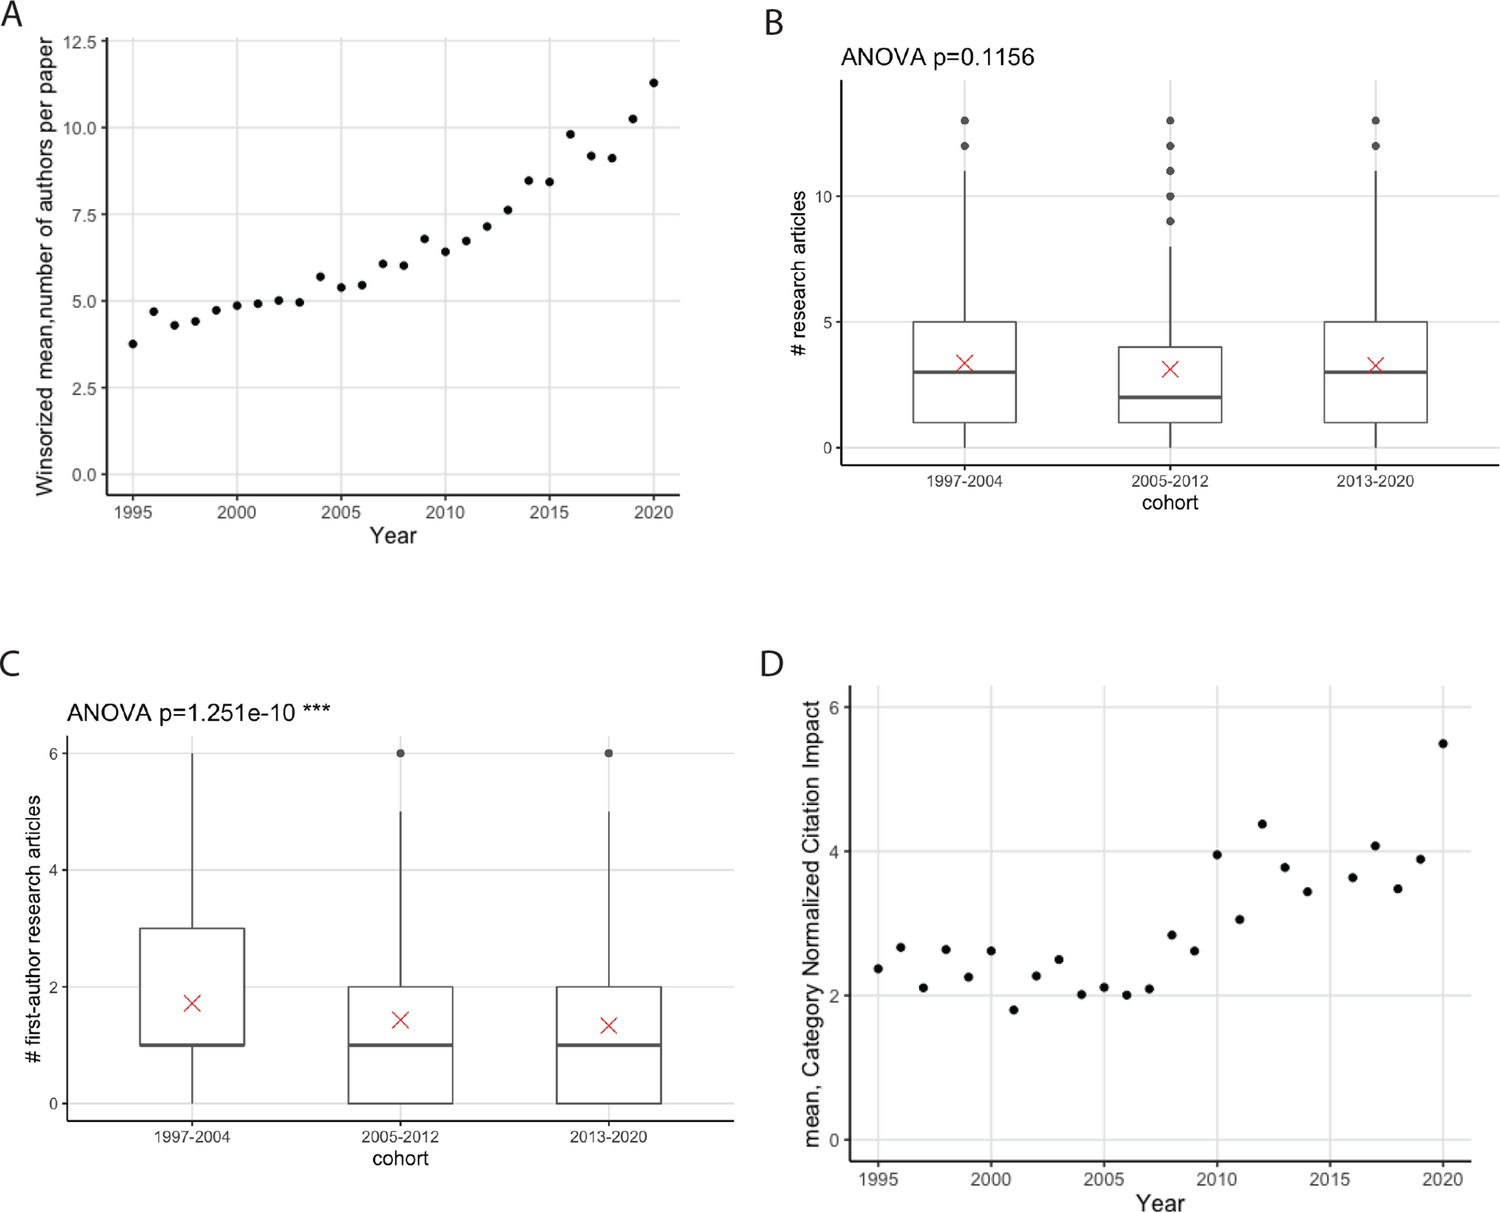
Publications are increasingly collaborative.
(A) Mean number of authors (y-axis) as a function of year (x-axis) for research articles that were published between 1995 and 2020, and have at least one of the alumni included in this study as an author (n=5413); the winsorized mean has been used to limit the effect of outliers. The mean number of authors has increased by a factor of more than two between 1995 and 2000. (B) Boxplot showing the distribution of the number of articles published per researcher for three cohorts. The mean is indicated as a red cross; the circles are outliers. No statistically significant difference was found between the cohorts; the p-value of 0.1156 was generated using a one-way analysis of variance (ANOVA) test of the full dataset (including outliers); the p-value excluding outliers is 0.26. (C) Boxplot showing the distribution of the number of first-author articles published per researcher for three cohorts; the two most recent cohorts published fewer first-author articles than the 1997–2004 cohort; the p-value (excluding outliers) was 6.5x10⁻⁷; see Table S12 in Supplementary file 1. (D) Mean CNCI (y-axis) as a function of time (x-axis) for research articles that were published between 1995 and 2020, and have at least one of the alumni included in this study as an author (n=5413). Recent articles have higher CNCI values. For clearer visualization, and to protect the identity of alumni with outlying numbers of publications, the y-axis in (B) and (C) is truncated at the 97.5 percentile.
-
Figure 5—source data 1
Summary data plotted in Figure 5.
- https://cdn.elifesciences.org/articles/78706/elife-78706-fig5-data1-v1.xlsx
Tables
Table 1
Career outcomes for 2284 EMBL alumni.
| Career | PhD alumni | Postdoc | Total |
|---|---|---|---|
| Academia: PI (AcPI) | 215 (22.2%) | 421 (32%) | 636 (27.8%) |
| Academia: Other (AcOt) | 102 (10.5%) | 281 (21.4%) | 383 (16.8%) |
| Academia: Postdoc (AcPD) | 168 (17.3%) | 76 (5.8%) | 244 (10.7%) |
| Industry research (IndR) | 153 (15.8%) | 179 (13.6%) | 332 (14.5%) |
| Science-related Non-research (SciR) | 178 (18.4%) | 171 (13%) | 349 (15.3%) |
| Non-science-related (NonSci) | 47 (4.9%) | 44 (3.3%) | 91 (4%) |
| Unknown | 106 (10.9%) | 143 (10.9%) | 249 (10.9%) |
| TOTAL | 969 | 1315 | 2284 |
-
See Table 2 for more information on the different jobs covered by Industry Research, Science-related Non-research, and Non-science-related. This classification is based on Stayart et al., 2020.
-
AcPI: includes those leading an academic research team with financial and scientific independence – evidenced by a job title such as group leader, professor, associate professor or tenure-track assistant professor. Where the status was unclear from the job title, we classified an alumnus as a Principal Investigator (PI) if one of the following criteria was fulfilled: (a) they appear to directly supervise students/postdocs (based on hierarchy shown on website); (b) they have published a last author publication from their current position; (c) their group website or CV indicates that they have a grant (not just a personal merit fellowship) as a principal investigator. AcOt: differs from Stayart et al., 2020 in that it includes academic research, scientific services or teaching staff (e.g., research staff, teaching faculty and staff, technical directors, research infrastructure engineers).
Table 2
Classification of Industry Research, Science-related Non-research and Non-science-related positions.
| Job function | PhD alumni | Postdoc | Total |
|---|---|---|---|
| Industry research | |||
| R & D scientist* | 138 (14.2%) | 167 (12.7%) | 305 (13.4%) |
| Entrepreneurship† | 6 (0.6%) | 8 (0.6%) | 14 (0.6%) |
| Postdoctoral | 7 (0.7%) | 1 (0.1%) | 8 (0.4%) |
| Business development, consulting & strategic alliances ‡ | 2 (0.2%) | 3 (0.2%) | 5 (0.2%) |
| Total | 153 (15.8%) | 179 (13.6%) | 332 (14.5%) |
| Science-related Non-research | |||
| Administration and training | 35 (3.6%) | 35 (2.7%) | 70 (3.1%) |
| Business development, consulting & strategic alliances | 38 (3.9%) | 20 (1.5%) | 58 (2.5%) |
| Tech support and product development | 20 (2.1%) | 24 (1.8%) | 44 (1.9%) |
| Science writing and communication | 16 (1.7%0) | 21 (1.6%) | 37 (1.6%) |
| Data science, analytics, software engineering § | 15 (1.5%) | 13 (1%) | 28 (1.2%) |
| Intellectual property and law | 16 (1.7%) | 10 (0.8%) | 26 (1.1%) |
| Science education and outreach | 10 (1%) | 11 (0.8%) | 21 (0.9%) |
| Clinical research management | 8 (0.8%) | 4 (0.3%) | 12 (0.5%) |
| Regulatory affairs | 5 (0.5%) | 7 (0.5%) | 12 (0.5%) |
| Clinical services/public health | 4 (0.4%) | 6 (0.5%) | 10 (0.4%0) |
| Sales and Marketing | 4 (0.4%) | 6 (0.5%) | 10 (0.4%) |
| Healthcare provider | 1 (0.1%) | 8 (0.6%) | 9 (0.4%) |
| Other | 4 (0.4%) | 2 (0.2%) | 6 (0.3%) |
| Entrepreneurship | 2 (0.2%) | 2 (0.2%) | 4 (0.2%) |
| Science policy and government affairs | 0 (0%) | 2 (0.2%0) | 2 (0.1%) |
| Total | 178 (18.4%) | 171 (13%) | 349 (15.3%) |
| Non-science-related | |||
| Data science, analytics, software engineering § | 18 (1.9%) | 25 (1.9%) | 43 (1.9%) |
| Business development, consulting & strategic alliances | 16 (1.7%) | 4 (0.3%) | 20 (0.9%) |
| Other (inc retired) | 7 (0.7%) | 12 (0.9%) | 19 (0.8%) |
| Entrepreneurship | 5 (0.5%) | 2 (0.2%) | 7 (0.3%0) |
| Administration and training | 1 (0.1%) | 1 (0.1%) | 2 (0.1%) |
| Total | 47 (4.9%) | 44 (3.3%) | 91 (4%) |
-
*
This function differs from the schema in Stayart et al., 2020; it includes alumni carrying out or overseeing scientific research in industry as group leaders, research staff, technical directors and non-directorship research leadership roles, including alumni who appear to be working in computational biology roles of a pharma, biotech, contract research or similar company regardless of job title (i.e. including data science roles that appear to be related to analysis of research-related data.)
-
†
Founders of companies whose primary focus is R&D (including contract research organizations).
-
‡
Includes director-level senior management roles overseeing the scientific direction & research of a company with R&D focus, e.g. CSOs in biotech start-ups.
-
§
Not including computational biology roles linked to R&D functions.
Table 3
Overview of PhD and postdoc cohorts.
| Completion years | PhD cohorts | Postdoc cohorts | All | ||||
|---|---|---|---|---|---|---|---|
| 1997–2004 | 2005–2012 | 2013–2020 | 1997–2004 | 2005–2012 | 2013–2020 | All | |
| n = | 256 | 341 | 372 | 369 | 422 | 524 | 2284 |
| n (%) known current role | 225 (88%) | 306 (90%) | 332 (89%) | 336 (88%) | 364 (86%) | 472 (90%) | 2035 (89%) |
| n (%) detailed career path | 220 (70%) | 258 (79%) | 413 (77%) | 179 (60%) | 271 (61%) | 285 (79%) | 1626 (71%) |
| n (%) female | 85 (33%) | 157 (46%) | 173 (47%) | 136 (37%) | 149 (35%) | 207 (40%) | 907 (40%) |
Additional files
-
MDAR checklist
- https://cdn.elifesciences.org/articles/78706/elife-78706-mdarchecklist1-v1.docx
-
Supplementary file 1
Supplementary tables (Table S1–11).
- https://cdn.elifesciences.org/articles/78706/elife-78706-supp1-v1.docx
-
Supplementary file 2
Supplementary methods.
- https://cdn.elifesciences.org/articles/78706/elife-78706-supp2-v1.docx
Download links
A two-part list of links to download the article, or parts of the article, in various formats.
Downloads (link to download the article as PDF)
Open citations (links to open the citations from this article in various online reference manager services)
Cite this article (links to download the citations from this article in formats compatible with various reference manager tools)
Meta-Research: The changing career paths of PhDs and postdocs trained at EMBL
eLife 12:e78706.
https://doi.org/10.7554/eLife.78706


