Inflammation produces catecholamine resistance in obesity via activation of PDE3B by the protein kinases IKKε and TBK1
- University of Michigan, United States
Figures
Figure 1 with 1 supplement
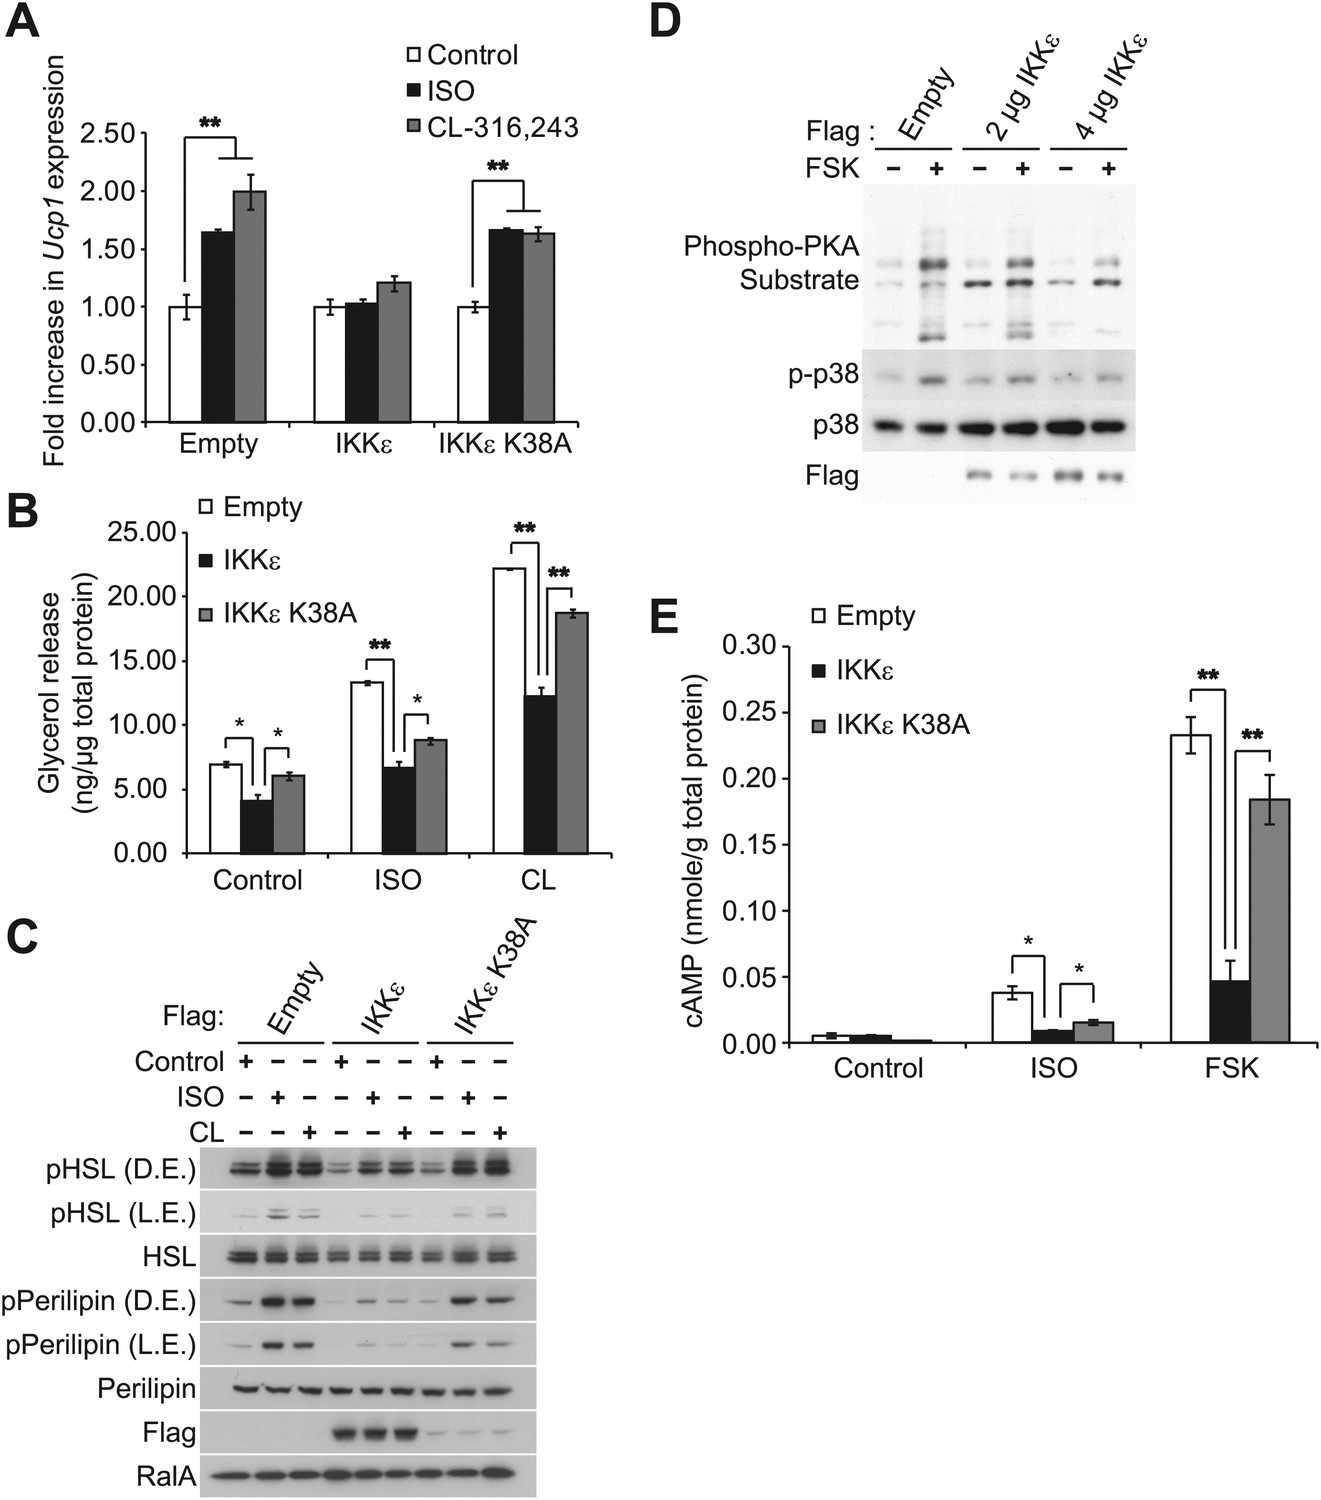
IKKε and TBK1 overexpression decrease sensitivity to the β-adrenergic/cAMP pathway in 3T3-L1 adipocytes.
(A) Fold increase in Ucp1 expression in 3T3-L1 adipocytes expressing empty vector, Flag-IKKε, or Flag-IKKε K38A following treatment with or without 10 μM ISO (black bars) or 10 μM CL-316,243 (CL, gray bars) for 4 hr. **p<0.01. Performed in triplicate. (B) Glycerol release from 3T3-L1 adipocytes expressing empty vector (white bars), Flag-IKKε (black bars), or Flag-IKKε K38A (gray bars) treated with or without 10 μM ISO or 10 μM CL. *p<0.05 and **p<0.01. Performed in triplicate. (C) Immunoblots of whole cell lysates from Figure 1B. Results were replicated in triplicate. D.E. stands for dark exposure and L.E. stands for light exposure. (D) Immunoblots of whole cell lysates from 3T3-L1 adipocytes expressing empty vector or Flag-IKKε treated with or without 50 μM FSK for 15 min. Results were replicated in multiple experiments. (E) cAMP levels from 3T3-L1 adipocytes expressing empty vector, Flag-IKKε, or Flag-IKKε K38A treated with or without 10 μM ISO or 50 μM FSK for 15 min. **p<0.0001 and *p<0.05. Performed in triplicate.
Figure 1—figure supplement 1
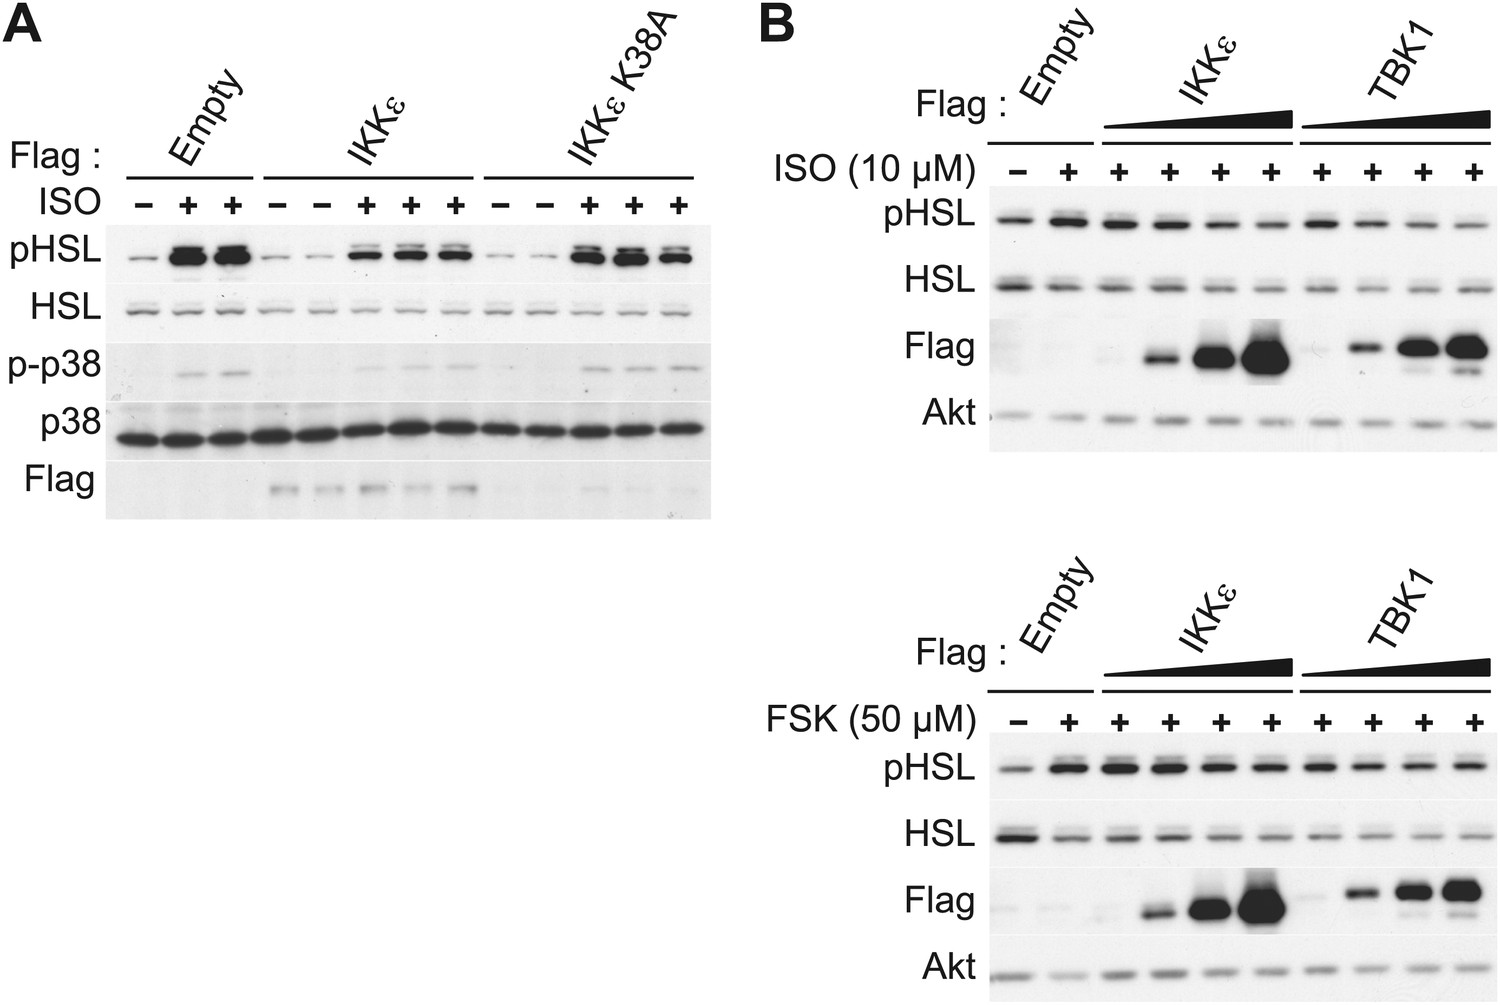
IKKε and TBK1 overexpression decrease sensitivity to the β-adrenergic/cAMP pathway in 3T3-L1 adipocytes.
(A) Immunoblots of whole cell lysates from 3T3-L1 adipocytes expressing empty vector, Flag-IKKε, or Flag-IKKε K38A treated with or without 10 μM ISO for 15 min. Results were replicated in multiple experiments. (B) Immunoblots of whole cell lysates from 3T3-L1 adipocytes expressing increasing amounts of Flag-IKKε or Flag-TBK1 treated with or without 10 μM ISO (top panel) or 50 μM FSK (bottom panel) for 15 min. Results were replicated in multiple experiments.
Figure 2 with 1 supplement
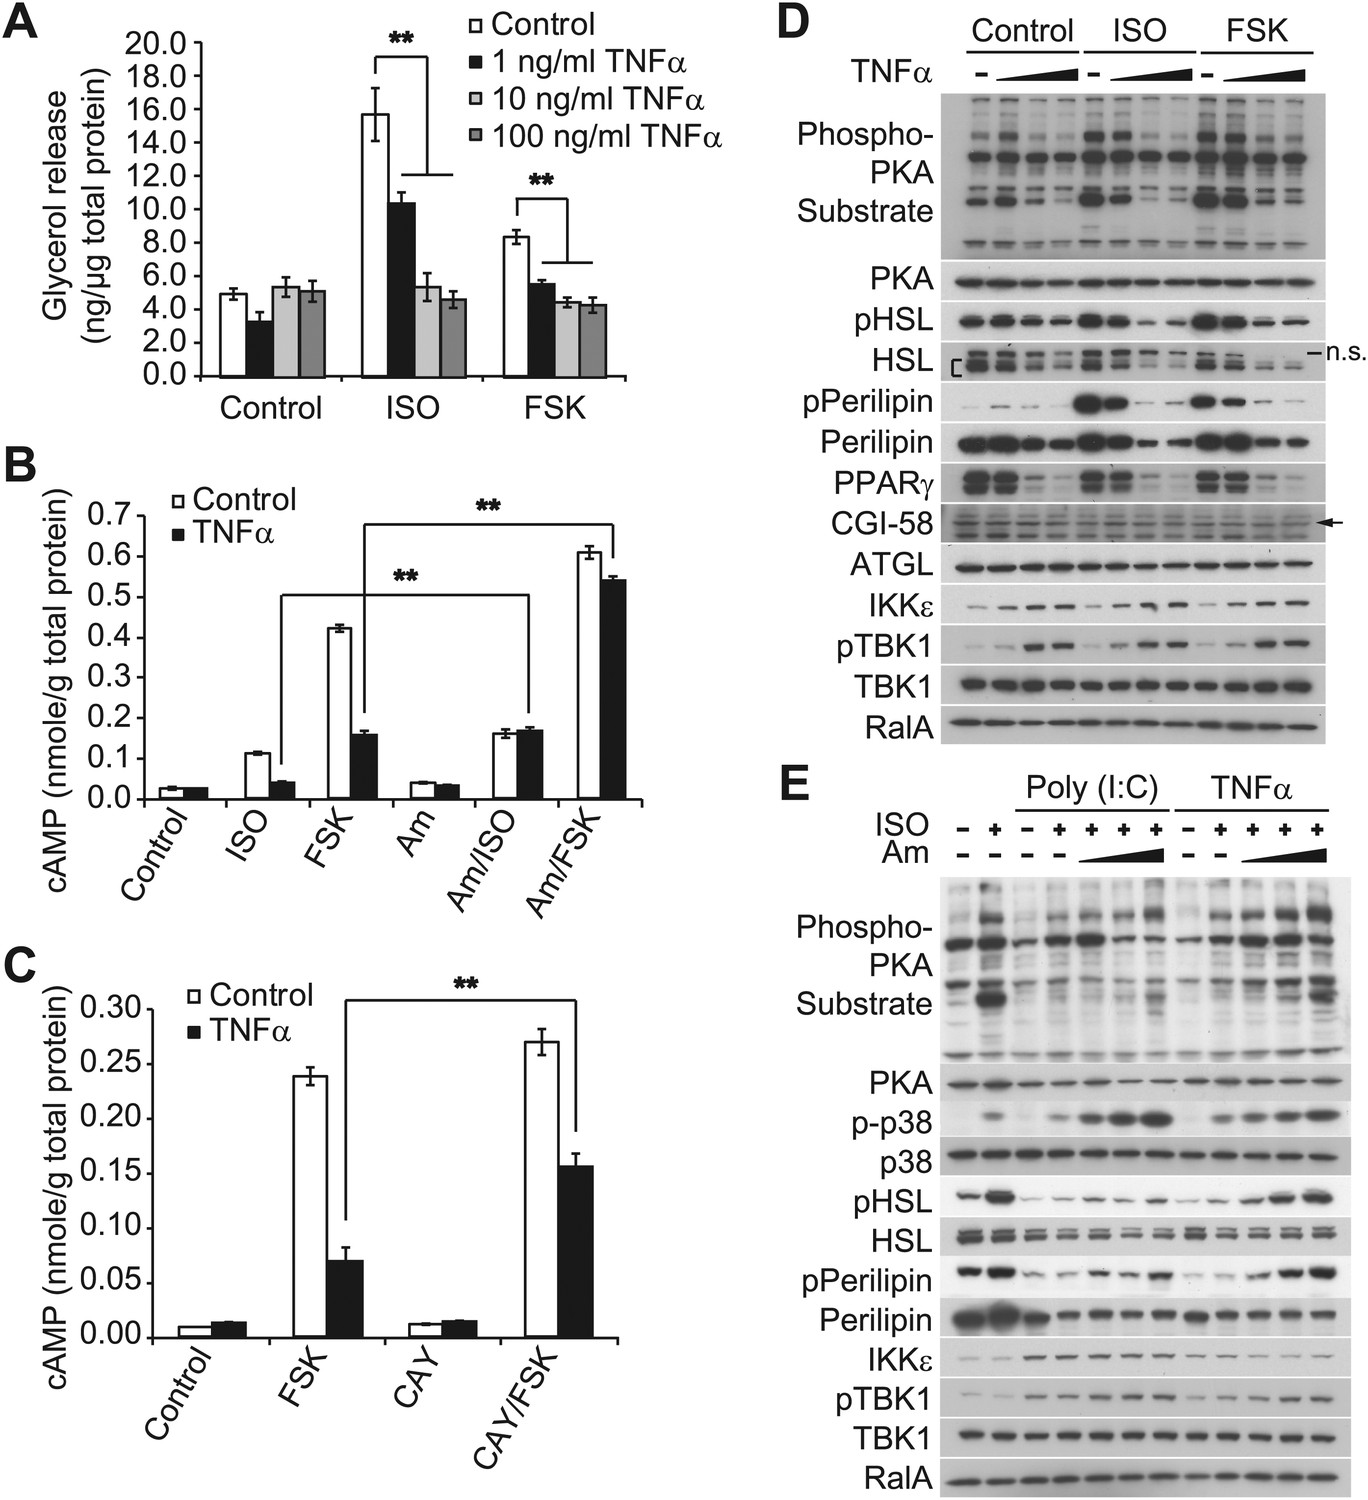
Prolonged treatment with TNFα decreases the sensitivity of adipocytes to β-adrenergic stimulation in a manner dependent on the activity of IKKε and TBK1.
(A) Glycerol release from 3T3-L1 adipocytes treated with or without different concentrations of TNFα as indicated for 24 hr followed by treatment with or without 10 μM ISO or 50 μM FSK. **p<0.0001. Performed in quadruplicate. (B) cAMP levels from 3T3-L1 adipocytes treated with or without 100 ng/ml TNFα for 24 hr followed by treatment with or without 10 μM ISO or 50 μM FSK in the presence or absence of pretreatment of 50 μM Amlexanox (Am). **p<0.0001. Performed in quadruplicate. (C) cAMP levels from 3T3-L1 adipocytes treated with or without 100 ng/ml TNFα for 24 hr followed by treatment with or without 50 μM FSK in the presence or absence of pretreatment of 1 μM CAY10576 (CAY). **p<0.0001. Performed in triplicate. (D) Immunoblots of whole cell lysates from 3T3-L1 adipocytes treated with or without different concentrations of TNFα as same as Figure 2A for 24 hr followed by treatment with or without 10 μM ISO or 50 μM FSK. Results were replicated in multiple experiments. ‘[’ indicates total HSL. ‘n.s.’ represents non-specific band. Arrow indicates CGI-58. (E) Immunoblots of whole cell lysates from 3T3-L1 adipocytes treated with or without 50 ng/ml TNFα or 100 μg/ml poly (I:C) for 24 hr followed by treatment with or without 10 μM ISO for 15 min in the presence or absence of pretreatment with increasing concentrations (0, 10, 50, and 200 μM) of amlexanox for 30 min. Results were replicated in multiple experiments.
Figure 2—figure supplement 1
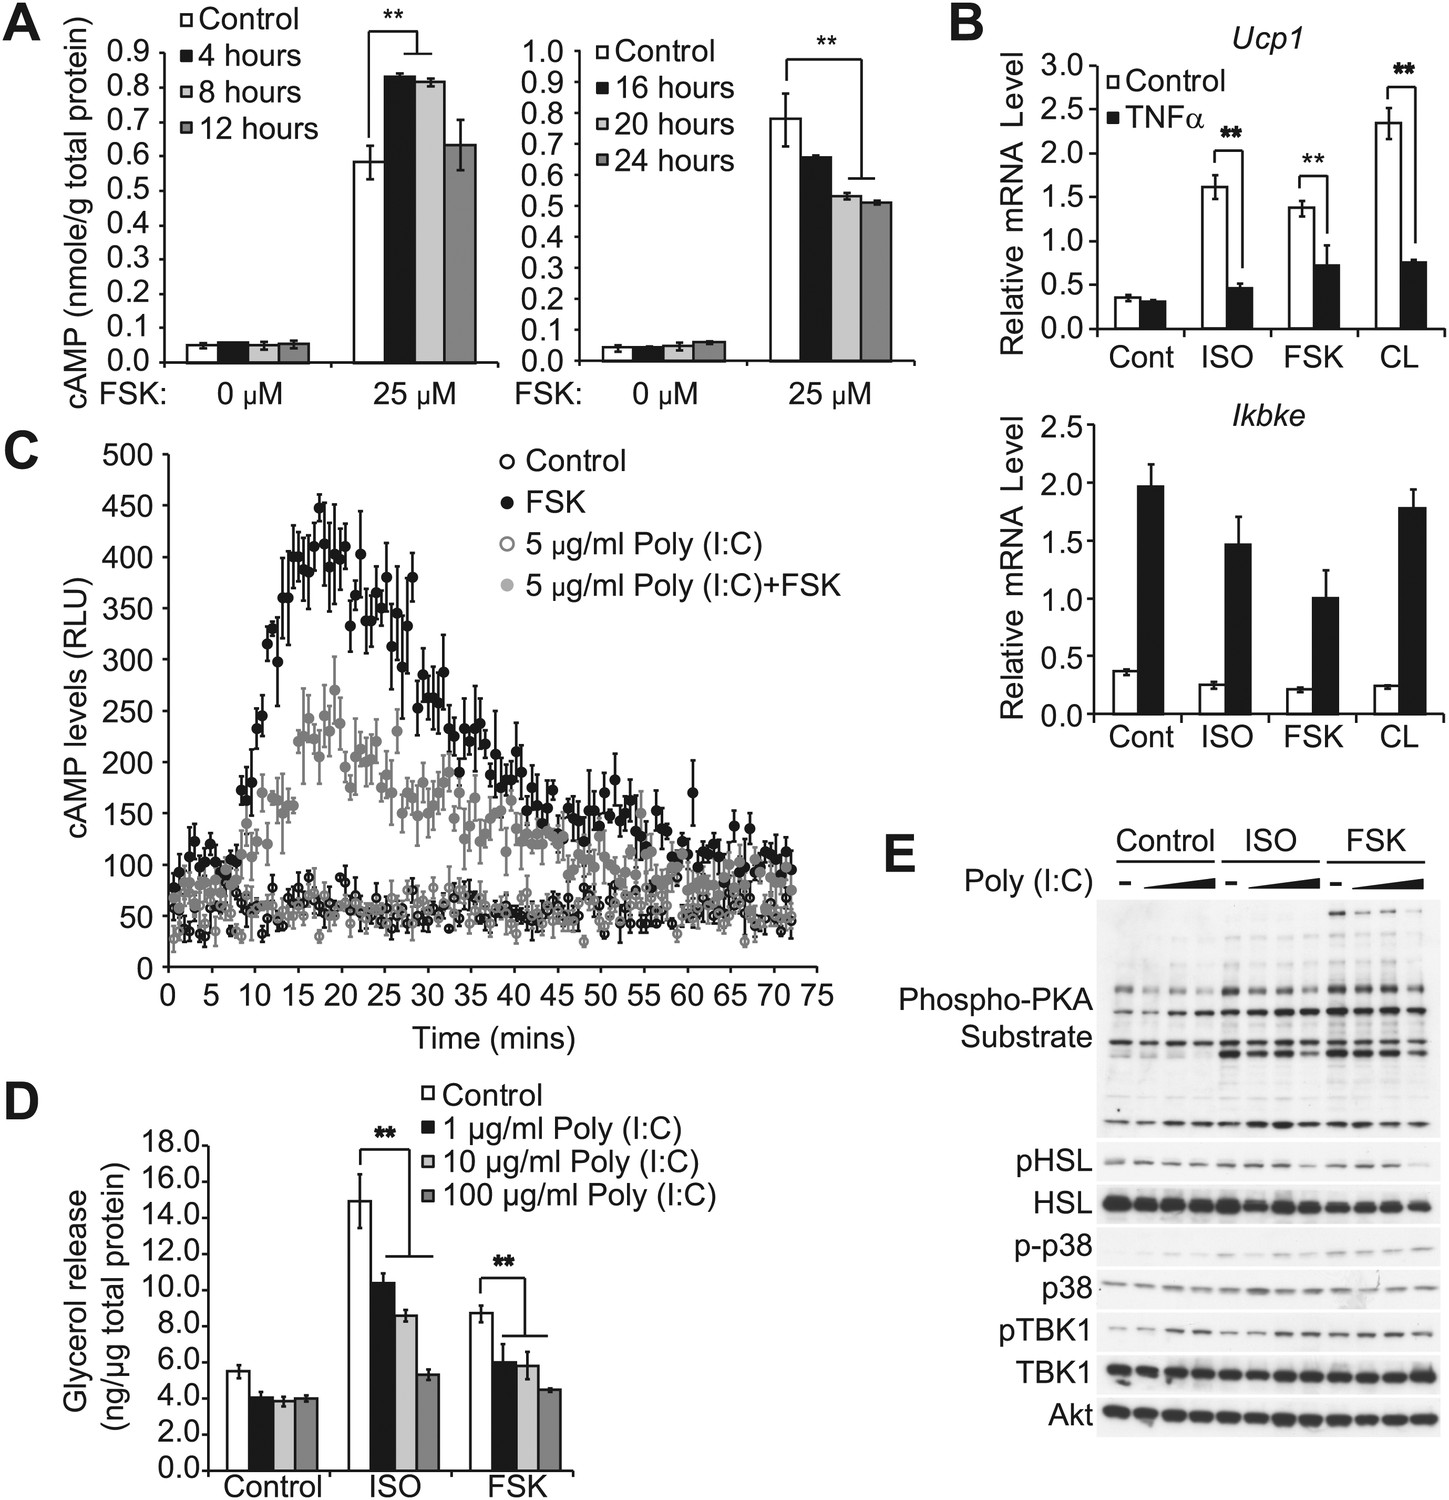
Prolonged exposure of inflammatory cytokines decreases the sensitivity of adipocytes to β-adrenergic stimulation.
(A) cAMP levels from 3T3-L1 adipocytes treated with or without 100 ng/ml TNFα for the indicated amount of time (left panel: 0–12 hr, right panel: 0–24 hr) followed by treatment with or without 25 μM FSK. **p<0.01. Performed in duplicate. (B) Relative gene expression (top panel: Ucp1, bottom panel: Ikbke) in 3T3-L1 adipocytes treated with or without 100 ng/ml TNFα for 24 hr followed by treatment with or without 10 μM ISO or 50 μM FSK, or 10 μM CL-316,243 for 4 hrs. **P<0.01 and **p<0.0001. Performed in tripilicate. (C) cAMP levels as measured by Glosensor from 3T3-L1 adipocytes treated with or without 5 μg/ml poly (I:C) for 24 hr followed by treatment with or without 50 μM FSK over the course of 75 min. Performed in triplicate. (D) Glycerol release from 3T3-L1 adipocytes treated with or without different concentrations of poly (I:C) as indicated for 24 hr followed by treatment with or without 10 μM ISO or 50 μM FSK. **p<0.0001. Performed in quadruplicate. (E) Immunoblots of whole cell lysates from 3T3-L1 adipocytes treated with or without different concentrations of poly (I:C) as same as Figure 2—figure supplement 1D for 24 hr followed by treatment with or without 10 μM ISO or 50 μM FSK. Results were replicated in multiple experiments.
Figure 3 with 1 supplement
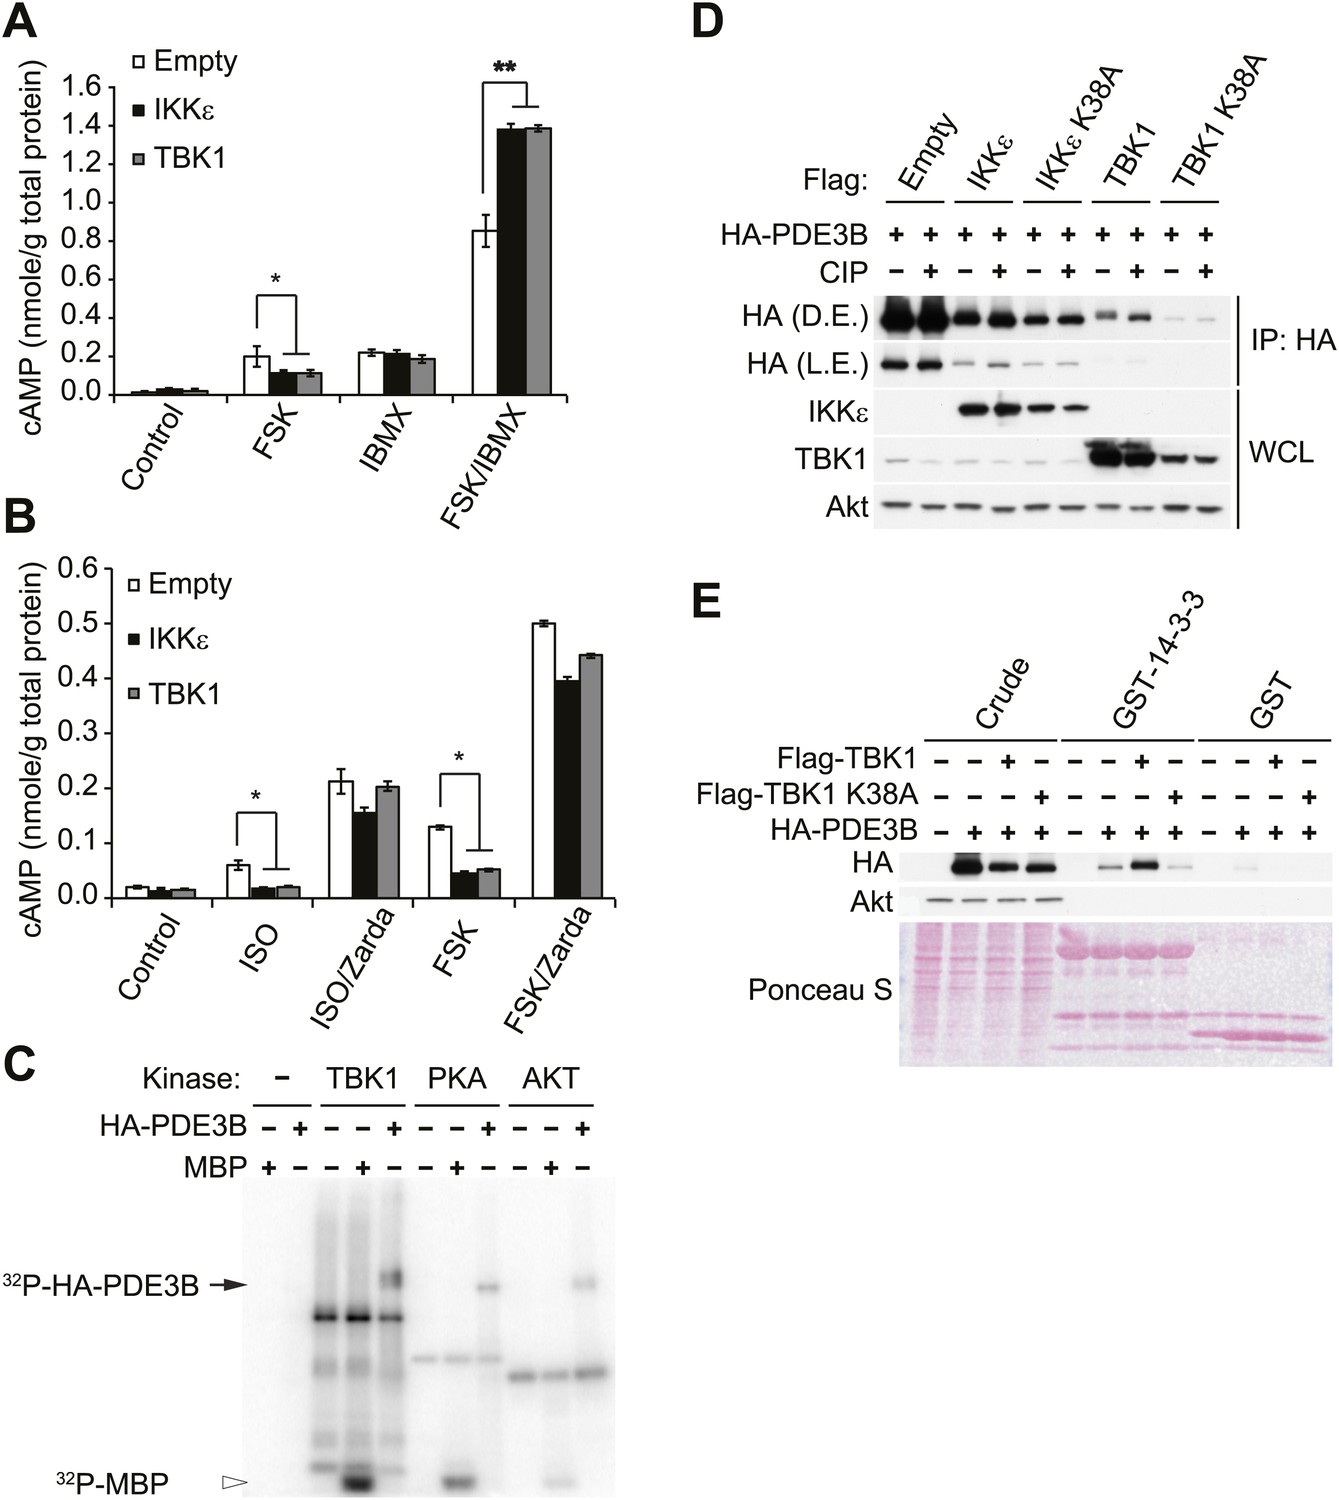
IKKε and TBK1 reduce cAMP levels through activation of PDE3B.
(A) cAMP levels from 3T3-L1 adipocytes expressing empty vector, Flag-IKKε, or Flag-TBK1 treated with or without 50 μM FSK, 250 μM IBMX, or together for 15 min. *p<0.05 and **p<0.0001. Performed in duplicate. (B) cAMP levels from 3T3-L1 adipocytes expressing empty vector, Flag-IKKε, or Flag-TBK1 treated with or without 10 μM ISO or 50 μM FSK together with or without 10 μM Zardaverine (Zarda) for 15 min. *p<0.05. Performed in duplicate. (C) 32P phospho-image of in vitro kinase reaction using either immunoprecipitated HA-PDE3B from HEK293T cells or 1 μg MBP (myelin basic protein) as a substrate with recombinant kinases as indicated. Results were replicated in multiple experiments. (D) Immunoblots of immunoprecipitation with anti-HA antibodies followed by treatment with or without CIP (top panel) and whole cell lysates (bottom panel) from Cos-1 cells co-expressing HA-PDE3B with Flag-IKKε/TBK1 or Flag-IKKε/TBK1 K38A. D.E. stands for dark exposure and L.E. stands for light exposure. Results were replicated in multiple experiments. (E) Immunoblots of GST-14-3-3 pulldown from HEK293T cells co-expressing HA-PDE3B with Flag-TBK1 or Flag-TBK1 K38A. Ponceau S staining shows the amount of beads used in GST-14-3-3 pulldown. Results were replicated in multiple experiments.
Figure 3—figure supplement 1
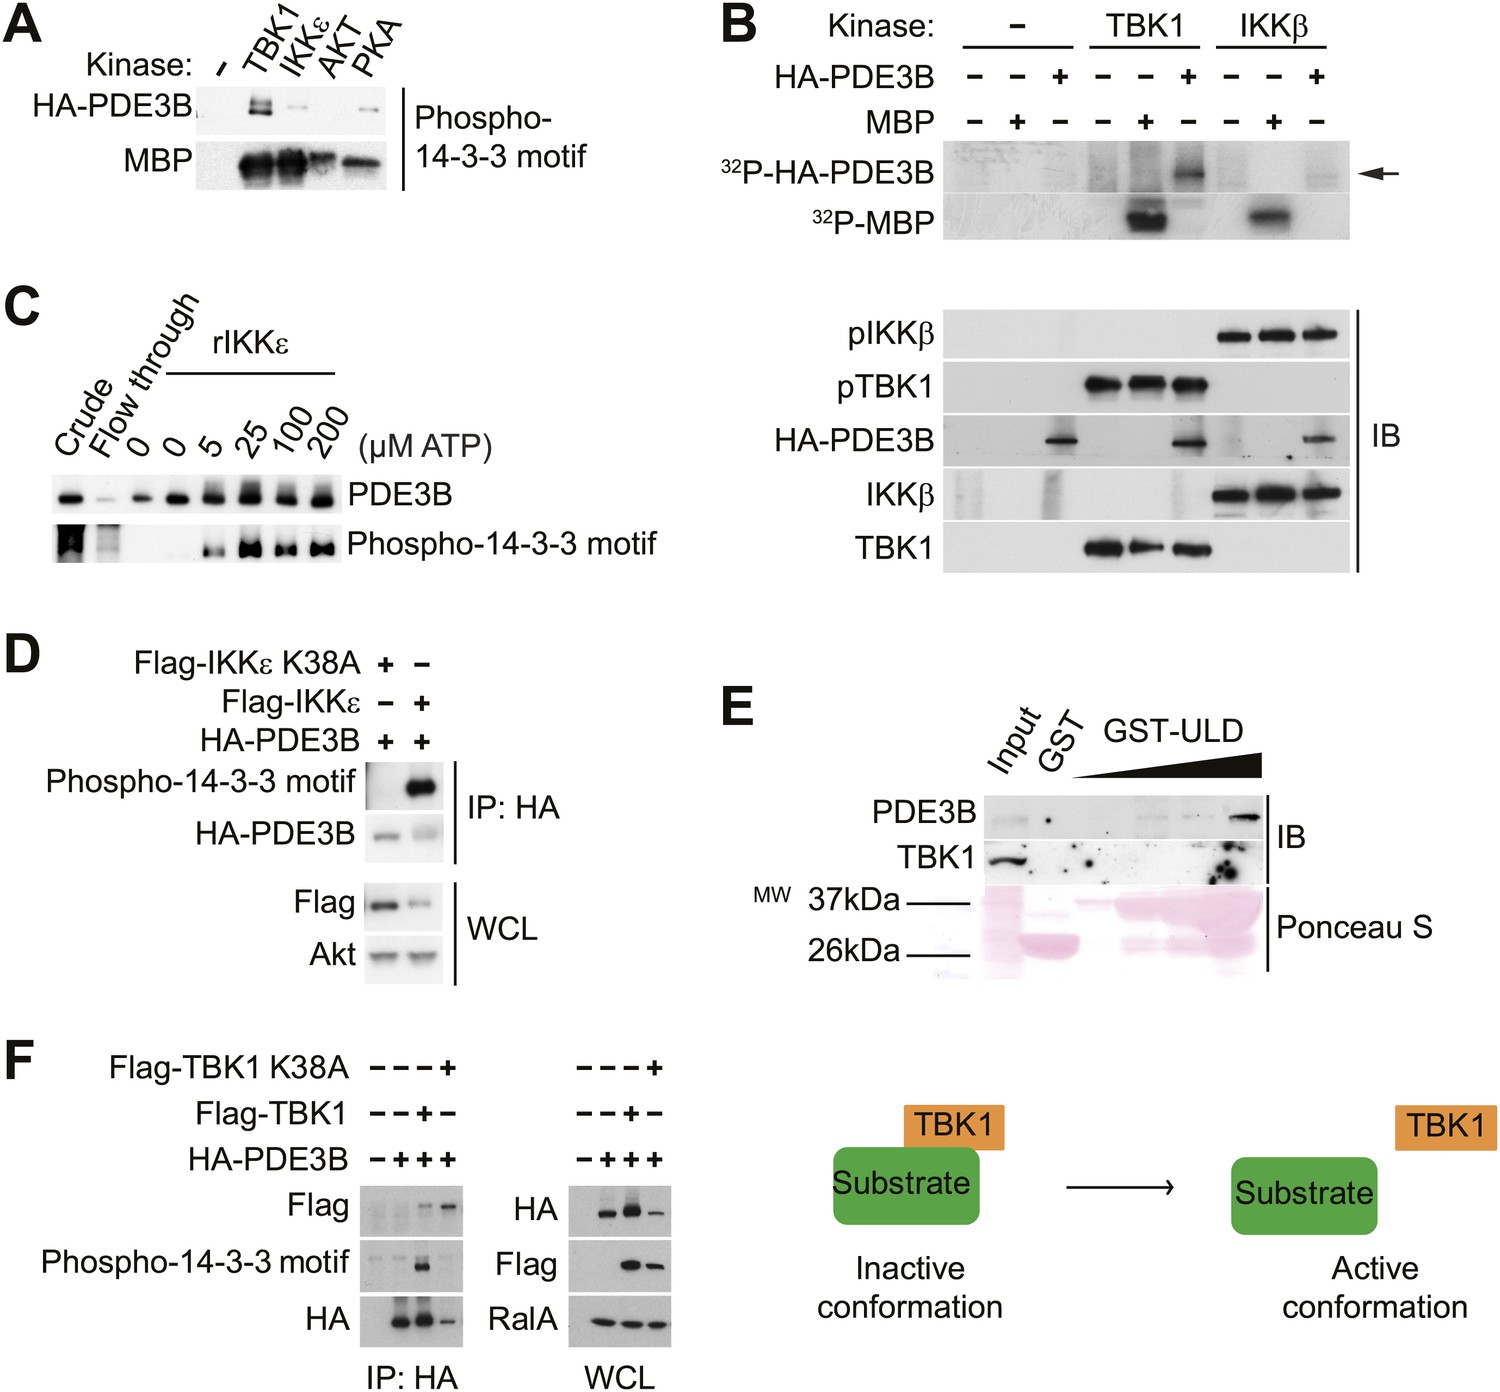
IKKε and TBK1 interact with PDE3B in a manner dependent on the activity of IKKε and TBK1.
(A) Immunoblots of in vitro kinase reaction using either immunoprecipitated HA-PDE3B from HEK293T cells or 1 μg MBP (myelin basic protein) as a substrate with recombinant kinases as indicated. Results were replicated in multiple experiments. (B) Top panel: 32P phospho-image of in vitro kinase reaction using either immunoprecipitated HA-PDE3B from HEK293T cells or 1 μg MBP as a substrate with recombinant kinases as indicated. Bottom panel: Immunoblots (IB) of in vitro kinase reaction. Results were replicated in multiple experiments. (C) Immunoblots of in vitro kinase reaction using immunoprecipitated HA-PDE3B from HEK293T cells as a substrate with recombinant MBP-IKKε kinase (rIKKε) using increasing amounts of ATP as indicated. Lane 1: Whole cell lysates from HEK293T cells expressing HA-PDE3B, Lane 2: IP flow-through, Lane 3: IP without rIKKε. Results were replicated in multiple experiments. (D) Immunoblots of immunoprecipitation with anti-HA antibodies (top panel) and whole cell lysates (WCL, bottom panel) from HEK293T cells co-expressing HA-PDE3B with Flag-IKKε or Flag-IKKε K38A. Results were replicated in multiple experiments. (E) Immunoblots of GST-TBK1 ULD pulldown from 3T3-L1 adipocytes. Ponceau S staining shows the amount of beads used in GST-TBK1 ULD pulldown. Results were replicated in multiple experiments. (F) Immunoblots of immunoprecipitation with anti-HA antibodies (left panel) and whole cell lysates (right panel) from HEK293T cells co-expressing HA-PDE3B with Flag-TBK1 or Flag-TBK1 K38A. Results were replicated in multiple experiments. The schematic model suggests that TBK1 associates with its substrates in an inactive conformation and subsequently dissociate upon phosphorylation in an active conformation.
Figure 4 with 1 supplement
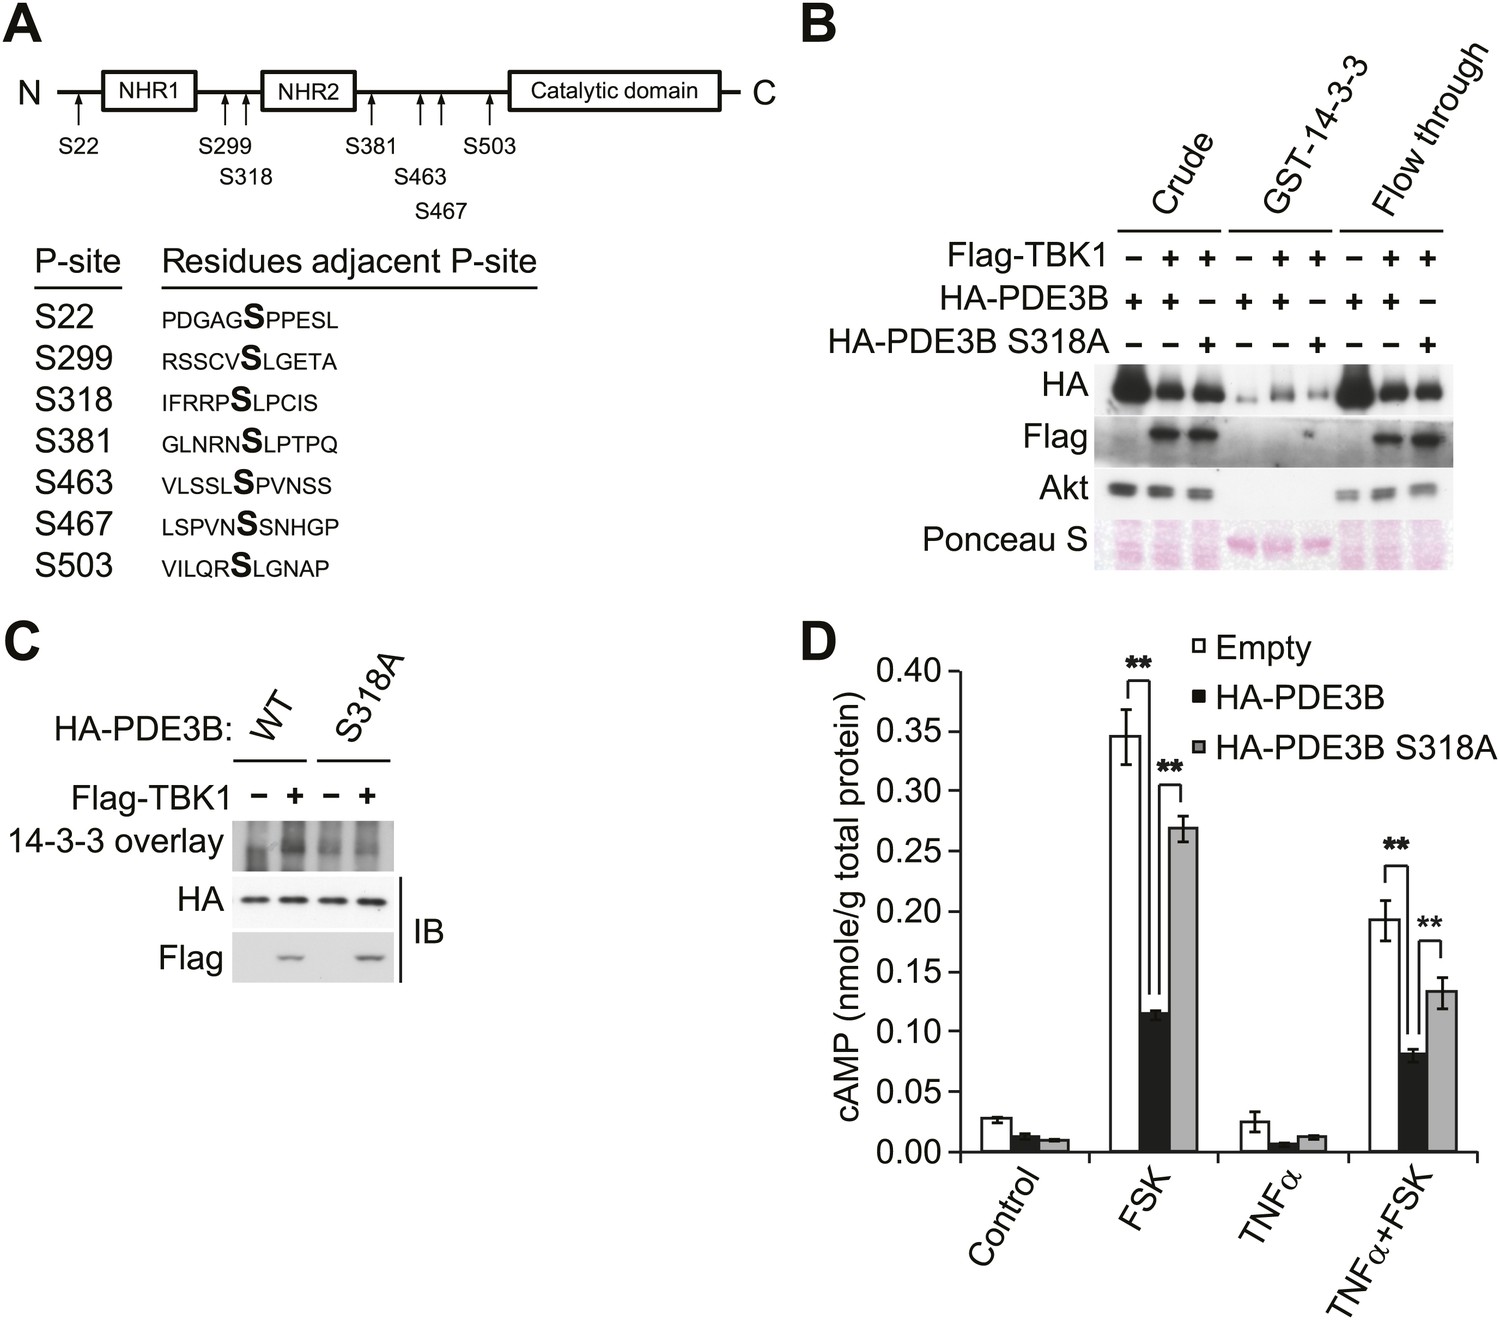
IKKε and TBK1 phosphorylate PDE3B at serine 318, resulting in the binding of 14-3-3β.
(A) Summary of sites on PDE3B phosphorylated by IKKε or TBK1 (P-sites) from mass spectrometry experiments. (B) Immunoblots of GST-14-3-3 pulldown from HEK293T cells co-expressing HA-PDE3B or HA-PDE3B S318A with Flag-TBK1. Ponceau S staining shows the amount of beads used in GST-14-3-3 pulldown. Results were replicated in multiple experiments. (C) GST-14-3-3 overlay on nitrocellulose membrane (top blot) and an immunoblot (IB) of whole cell lysates from HEK293T cells co-expressing HA-PDE3B or HA-PDE3B S318A with Flag-TBK1 (bottom blot). Results were replicated in multiple experiments. (D) cAMP levels from 3T3-L1 adipocytes expressing empty vector, HA-PDE3B, or HA-PDE3B S318A treated with or without 100 ng/ml TNFα for 16 hr followed by treatment with or without 25 μM FSK for 15 min. **p<0.0001 and **p<0.01. Performed in duplicate.
Figure 4—figure supplement 1
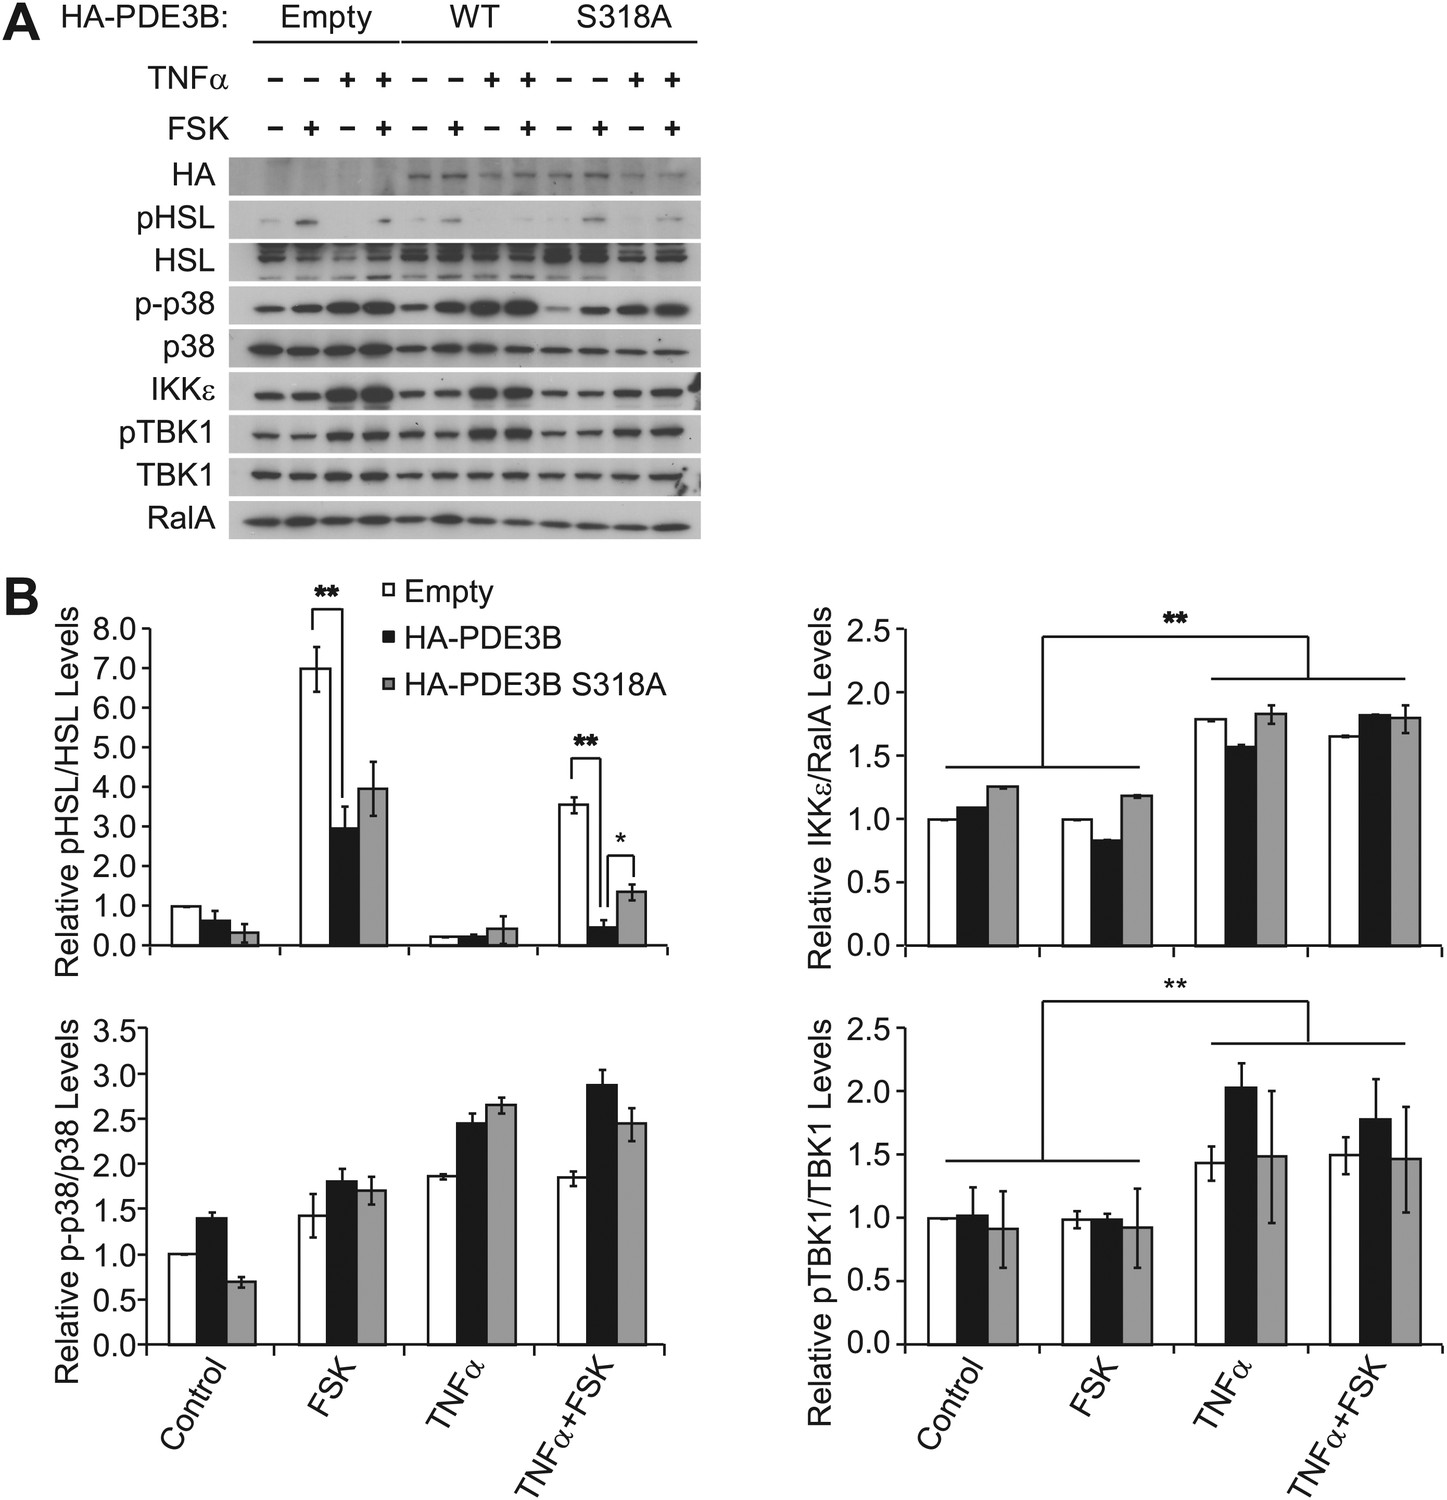
Overexpression of PDE3B in 3T3-L1 adipocytes reduces the attenuation of forskolin-stimulated β-adrenergic signaling produced by TNFα.
(A) Immunoblots of whole cell lysates from Figure 4D. (B) Top left panel, pHSL and total HSL signals in whole cell lysates were quantified and normalized to the basal signal (lane 1 in Figure 4—figure supplement 1A). The normalized pHSL/total HSL ratio is presented as the mean ± SEM of two independent experiments. **p<0.0001 and *p<0.05. Top right panel, quantification of total IKKε and RalA signals in whole cell lysates was performed as described above. **p<0.0001. Bottom left panel, quantification of phospho-p38 (p-p38) and total p38 signals in whole cell lysates was performed as described above. Bottom right panel, quantification of pTBK1 and total TBK1 signals in whole cell lysated was performed as described above. **p<0.01.
Figure 5

The IKKε/TBK1 inhibitor Amlexanox sensitizes β-adrenergic agonist-stimulated lipolysis in white adipose tissue in diet-induced obese mice.
(A) Fold increase in serum FFA (left panel) and glycerol (right panel) levels 15 min after CL-316,243 injection in ND- or HFD-fed mice treated with amlexanox or vehicle control for 4 days. n = 7 mice per group. *p<0.05. (B) Glycerol release from ex vivo epididymal (left panel) and inguinal (right panel) WATs after 1 hr pretreatment with amlexanox or vehicle. CL-316,243 treatment was started at time zero. n = 6, 3 WAT pieces × 2 mice. *P<0.05. (C) Immunoblots in inguinal WAT lysates from Figure 5B after 60 min of CL-316,243 treatment. (D) cAMP levels in epididymal WAT 20 min after CL-316,243 (CL) or saline control injection in HFD-fed mice treated with amlexanox or vehicle control for 4 days. n = 2 mice per saline-treated group and n = 3 mice per CL-316,324-treated group. *p<0.05. (E) Immunoblots in epididymal WAT 5 min after CL-316,243 or saline control injection in HFD-fed mice treated with amlexanox or vehicle control for 4 days. (F) Relative oxygen comsumption of mice in each treatment group. n = 7 for the vehicle-treated group, n = 5 for the amlexanox-treated group. *P<0.05 (Student’s t test).
Author response image 1
Download links
A two-part list of links to download the article, or parts of the article, in various formats.
Downloads (link to download the article as PDF)
Open citations (links to open the citations from this article in various online reference manager services)
Cite this article (links to download the citations from this article in formats compatible with various reference manager tools)
Inflammation produces catecholamine resistance in obesity via activation of PDE3B by the protein kinases IKKε and TBK1
eLife 2:e01119.
https://doi.org/10.7554/eLife.01119


