Identification of a pre-active conformation of a pentameric channel receptor
- Institut Pasteur, France
- Centre National de la Recherche Scientifique, France
- Université Pierre et Marie Curie, Cellule Pasteur, France
- Weill Cornell Medicine, United States
- Université Paris-Sud, CNRS, Université Paris-Saclay, France
- Institute of Biology, Ecole Normale Supérieure, France
Figures
Figure 1
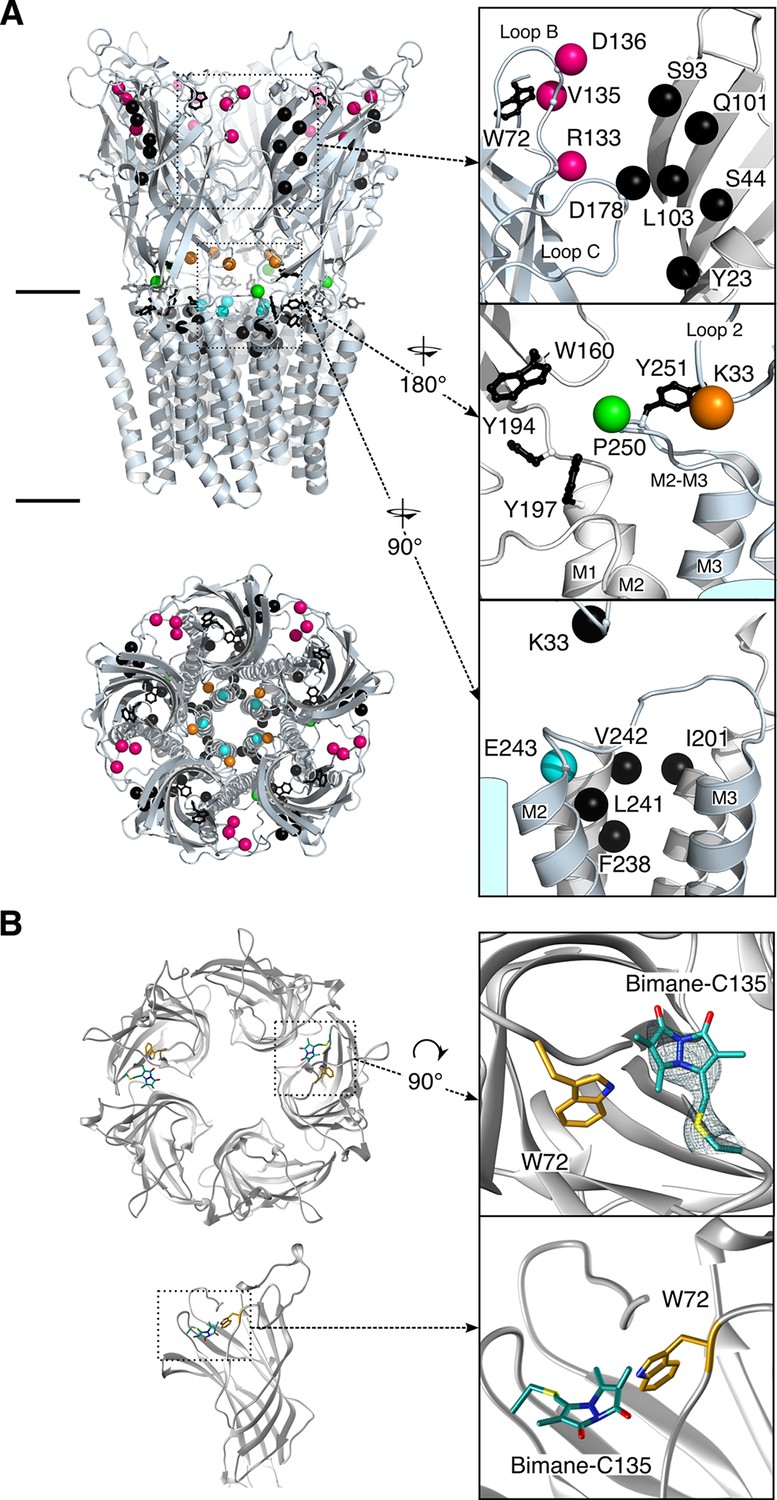
Structure of GLIC.
(A) Positions for fluorophore and quencher insertion. Top panel: side view of GLIC crystalized at pH 7. Lower panel: Top-down view of GLIC. Insets show particular regions targeted for mBBr labeling. Positions where cysteines are engineered are represented in color and positions for tryptophan/tyrosine mutations are in black. All amino acids are represented by a sphere for the Cß carbon, to show the orientation of the side chain. Endogenous tryptophans and tyrosines are in stick representation. (B) X-ray structure of the V135C-Bimane. A top and side view are presented showing the localization of the two Bimane molecules resolved in the structure. Insets show a zoom for both the top and side view of the V135C-Bimane and the putative quencher W72. In the top zoom, the experimental 2Fo-Fc density map contoured at one sigma is shown in mesh for the Bimane.
Figure 2 with 5 supplements
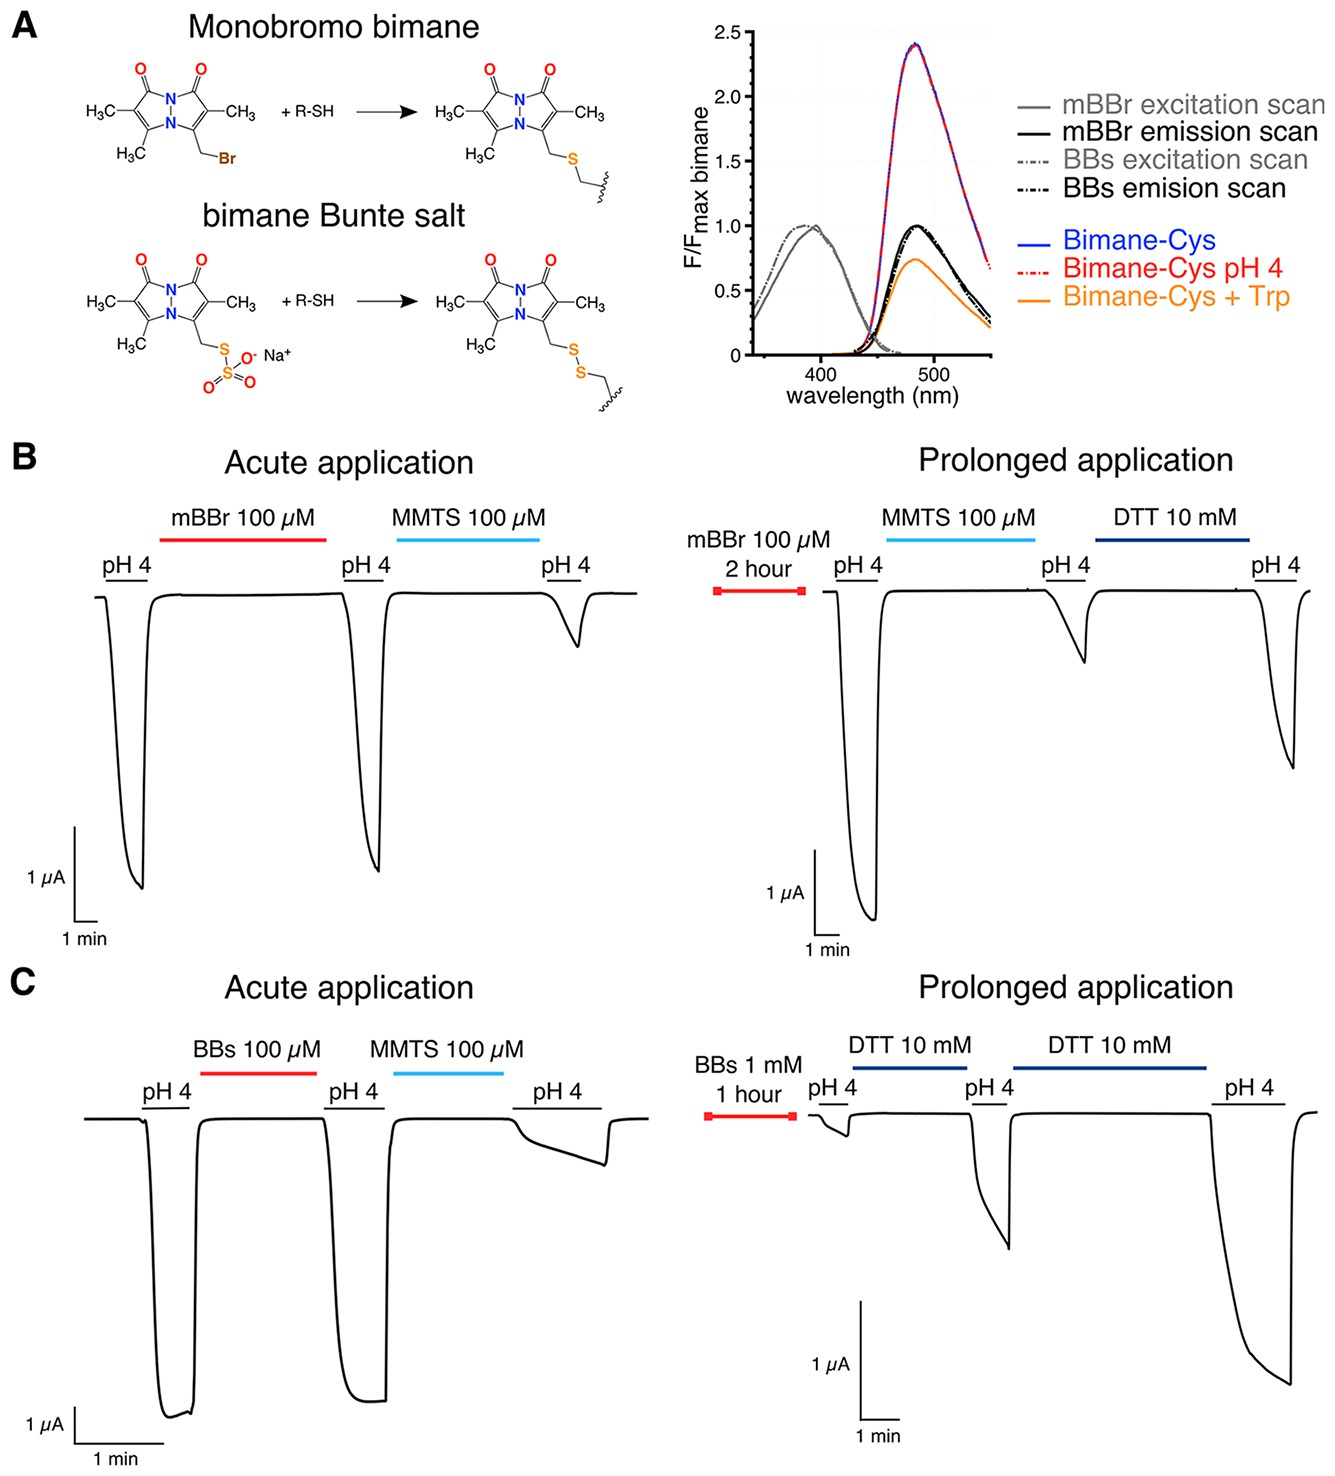
Bimanes characteristics and labeling of GLIC-expressing cells.
(A) Left: Structures of the Monobromo bimane (mBBr) and the bimane Bunte salt (BBs) before and after reaction with cysteines. Right: Excitation and emission spectra of both fluorophores and emission spectra of the mBBr (10 µM) after reaction with cysteines (1 mM), acidification of the medium (pH 4) or addition of tryptophan (25 mM). All spectra are normalized to the peak intensity of the mBBr emission spectrum. (B, C) Representative electrophysiological recordings of oocytes expressing GLIC Q193C mutant. Unless otherwise indicated, oocytes were perfused with a pH 7.3 solution. (B) Traces showing no functional inhibition of GLIC Q193C after mBBr exposure with acute (left) or prolonged application (right), whereas the same oocytes are inhibited by reaction with MMTS, which can be reversed by application of DTT. (C) Left: Trace showing the inhibition of GLIC Q193C after reaction with the MMTS but not the BBs after acute application. Right: Effective inhibition of GLIC Q193C after reaction with the BBs after the oocyte was incubated for 1 hr in presence of the fluorophore, followed by reduction of the Cys-BBs bond by DTT.
Figure 2—figure supplement 1
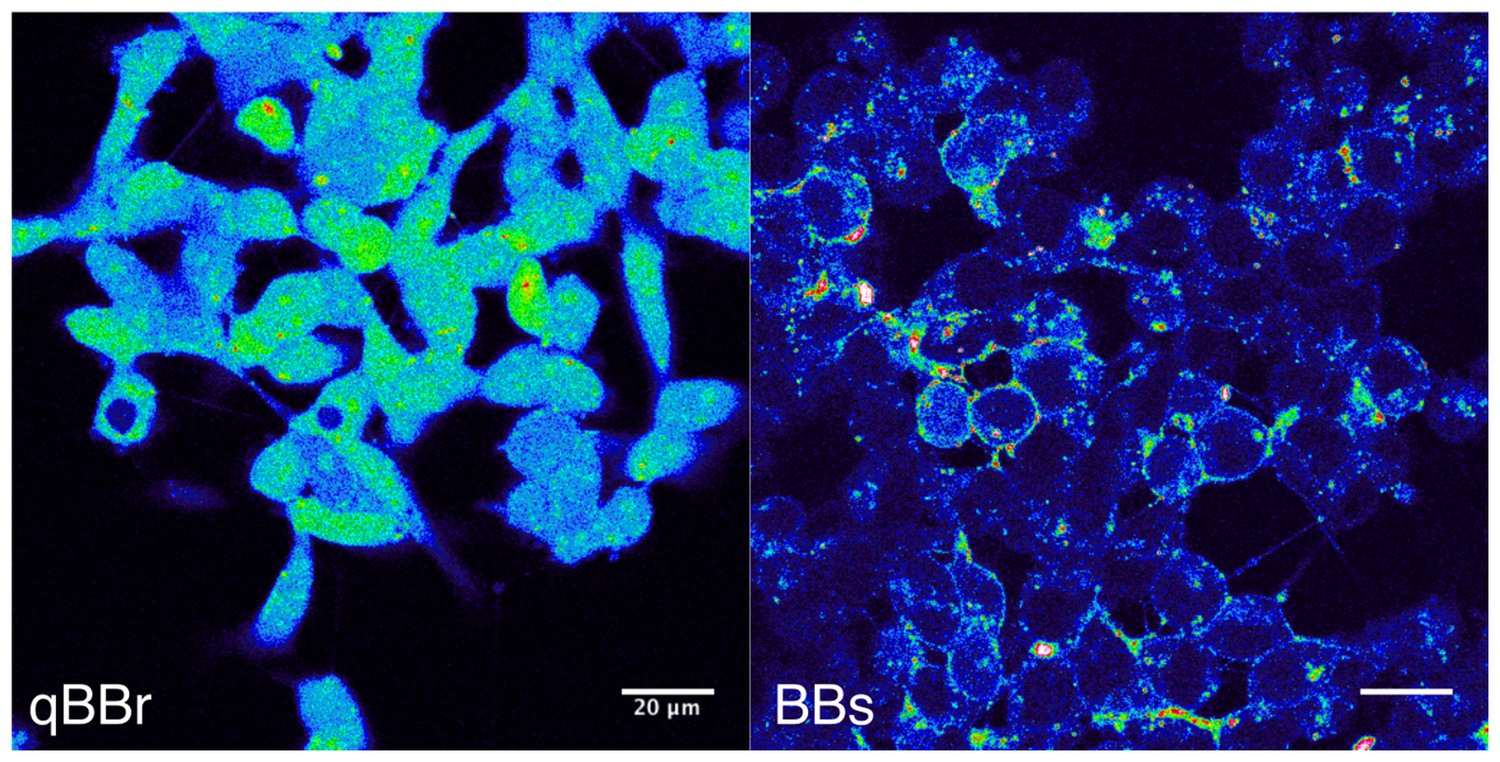
Bimane labeling of CHO cells.
The pictures were taken on a confocal microscope with a 405 nm excitation laser and show GLIC D136C transfected cells, positive for the transfection marker mCherry (not shown). On the left panel, cells were labeled for 1 hr, on ice, with the qBBr, a commercially available ‘non-permeant’ bimane derivative. On the right panel, cells were labeled for 1 hr, on ice, with the BBs. The scale bar represents 20 µm.
Figure 2—figure supplement 2
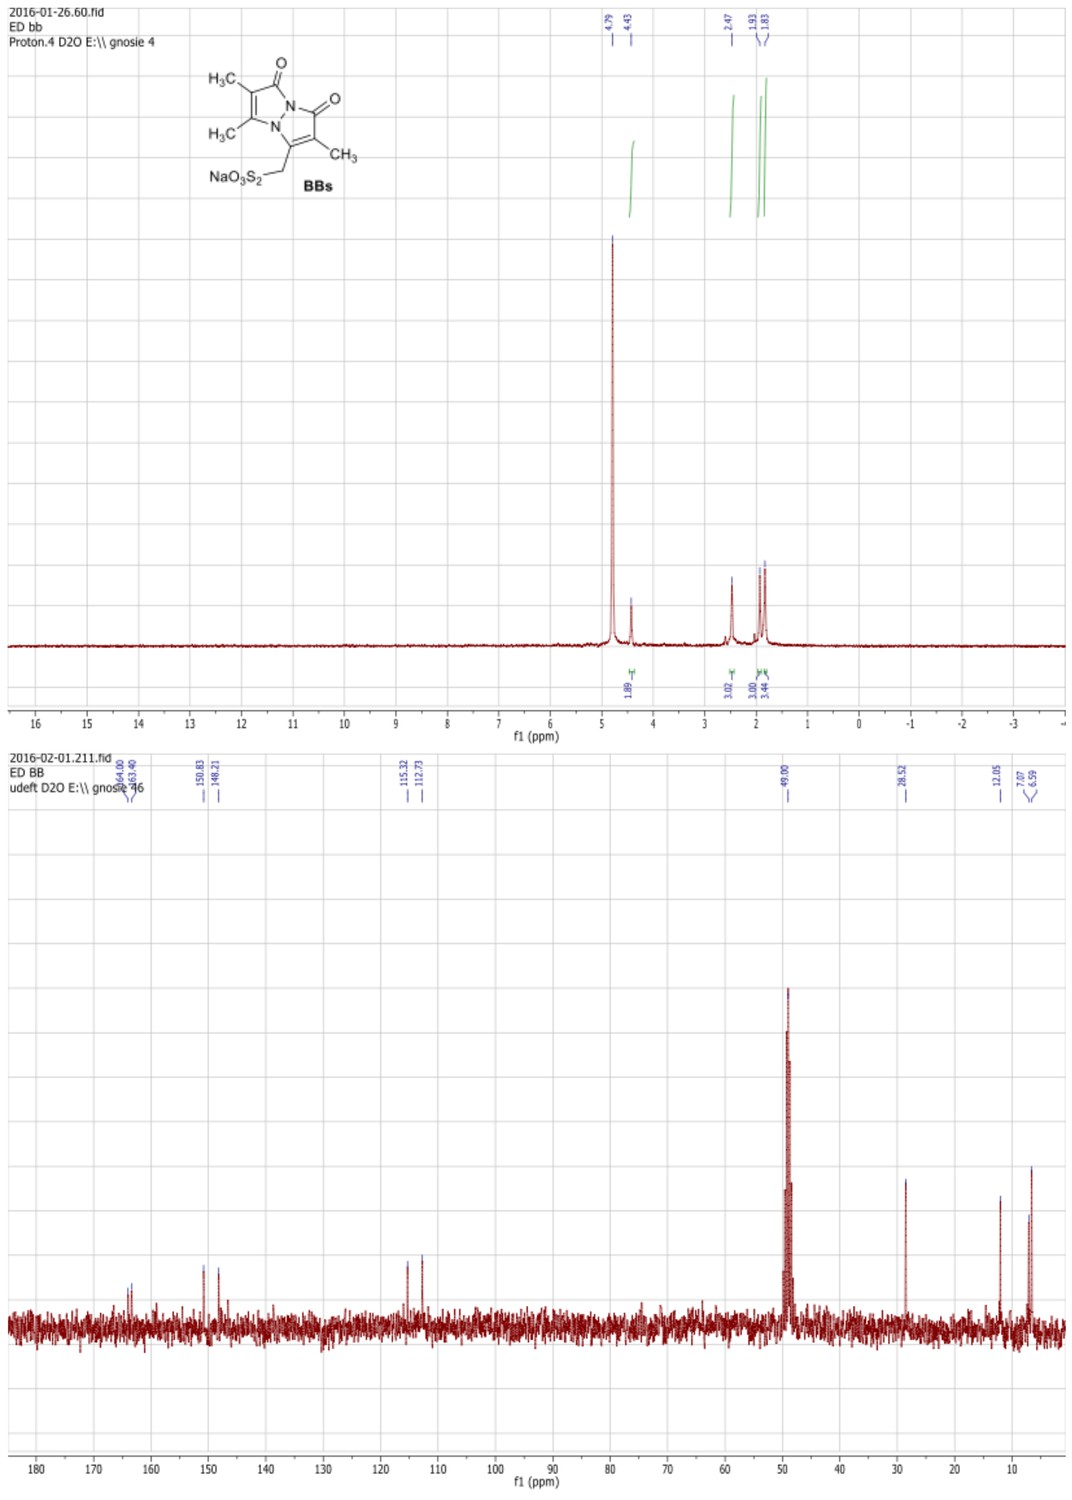
1HNMR (300 MHz, D2O) and 13C NMR (75 MHz, D2O/MeOD) spectra of the BBs.
https://doi.org/10.7554/eLife.23955.006
Figure 2—figure supplement 3
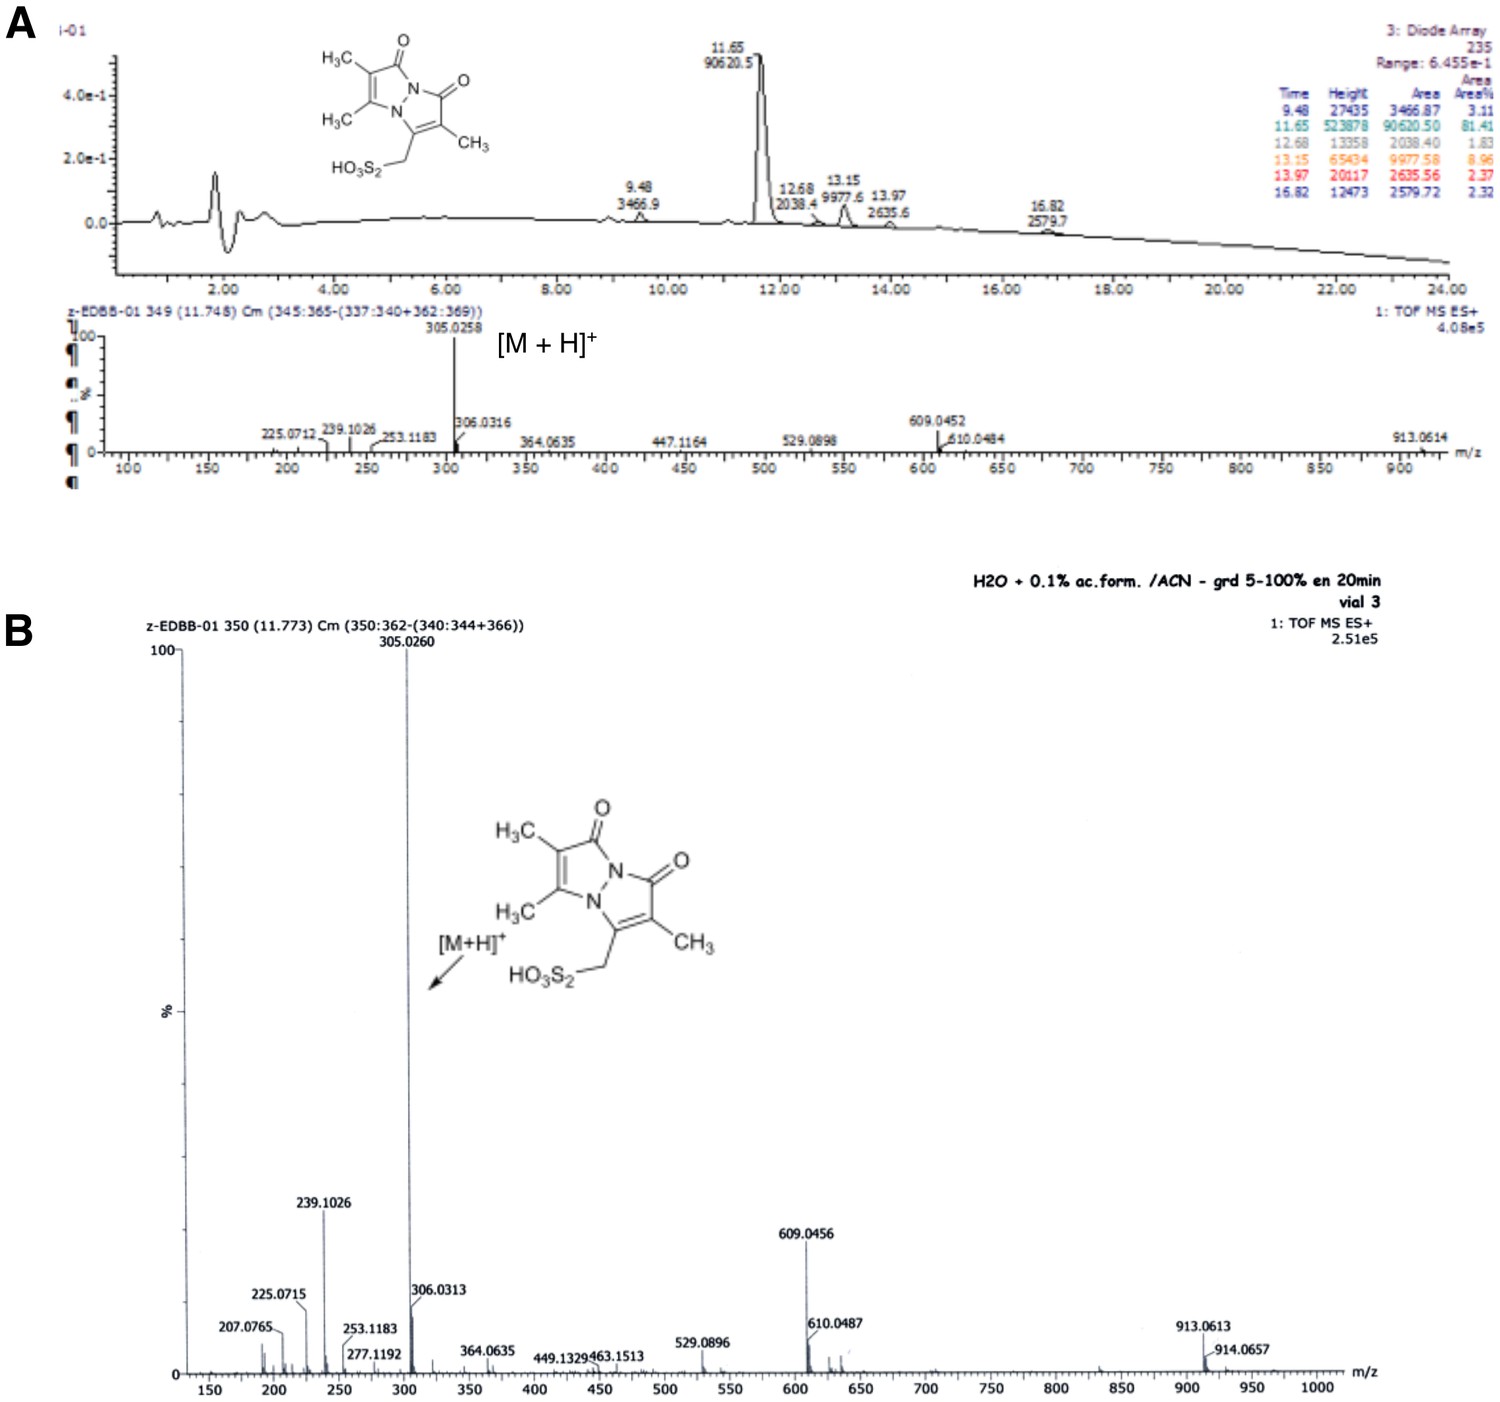
Characterisation of the synthetized BBs.
(A) RP-HPLC chromatogram and MS spectrum of bimane thiosulfonic acid. (B): HRMS (ESI) spectrum of bimane thiosulfonic acid.
Figure 2—figure supplement 4
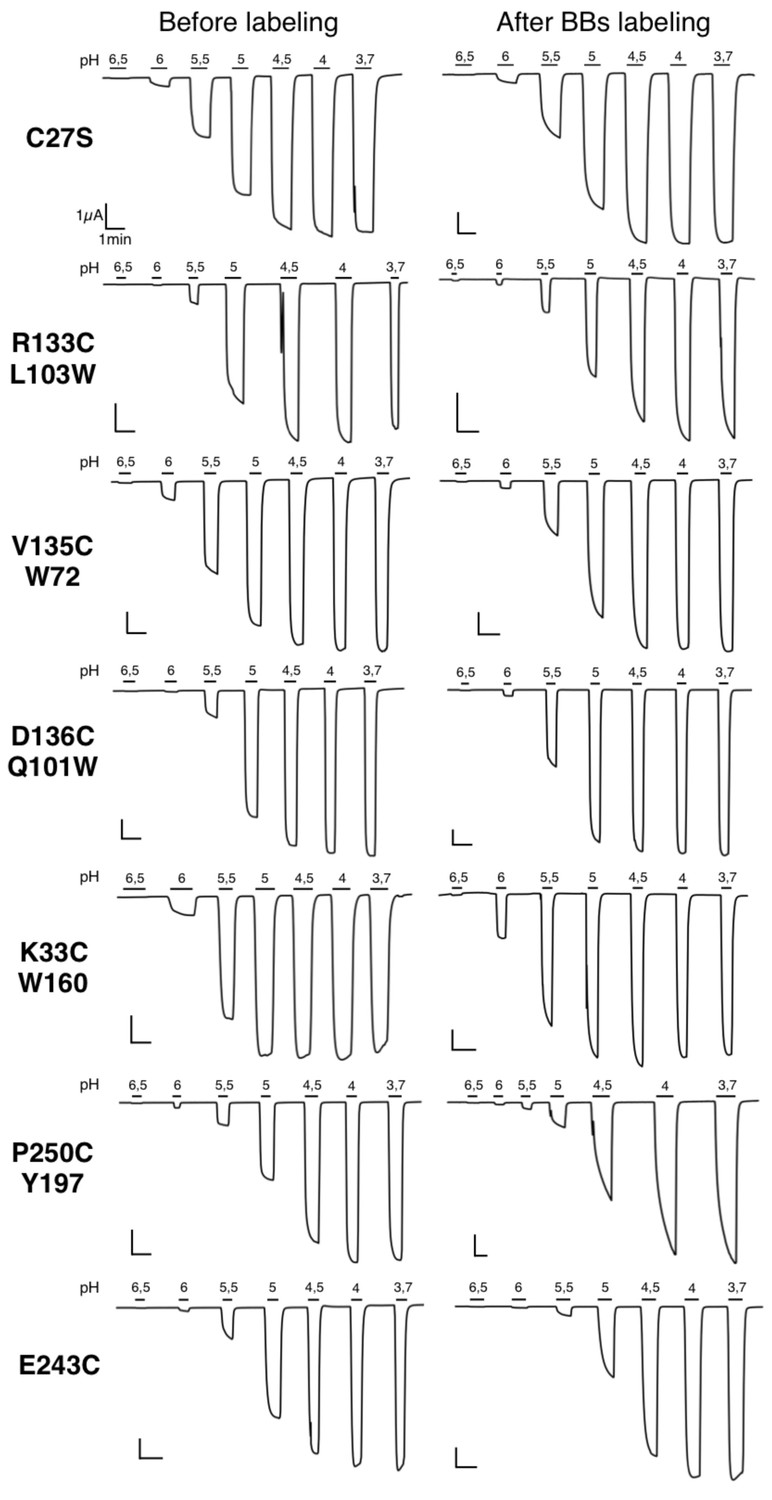
Typical electrophysiological traces for each major quenching-pairs mutants of GLIC.
On the left are recordings made before BBs labeling and on the right are recordings made for the same oocyte after a 1 hr BBs incubation, with the exception of the P250C mutant which showed an important run down (either with or without labeling) and for which two different representative oocytes are shown.
Figure 2—figure supplement 5
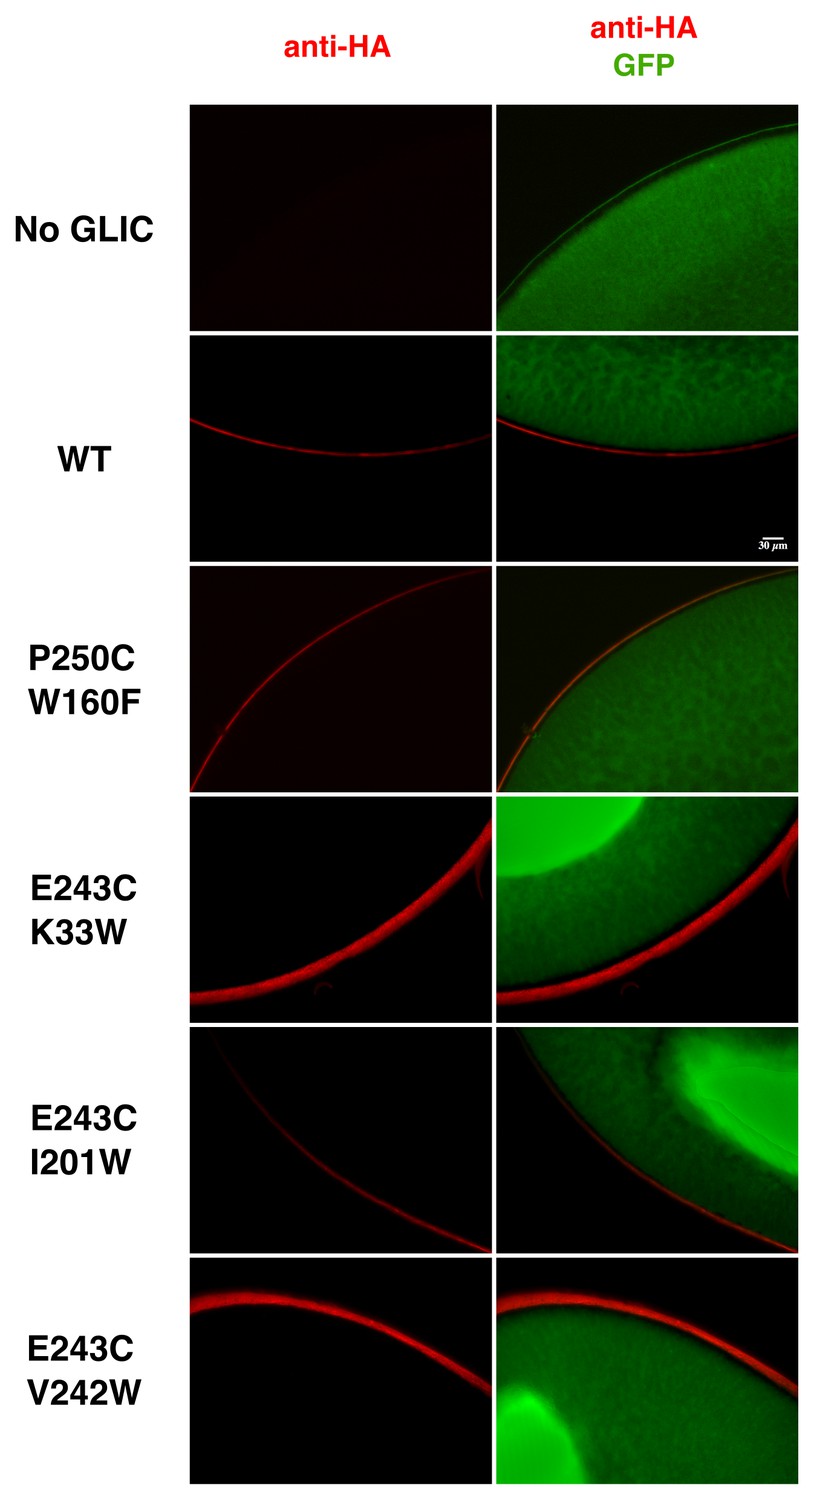
Immunolabeling of oocytes expressing GLIC WT and loss-of-function mutants.
Oocytes were co-injected with GLIC-HA WT or loss-of-function mutants and GFP. Control oocytes were injected with GFP only. Immunolabeling was directed against the HA-tag. Labeling of receptors expressed at the membrane is shown in red and GFP expressed in the cytoplasm in shown in green. The scale bar represents 30 µm.
Figure 3 with 2 supplements
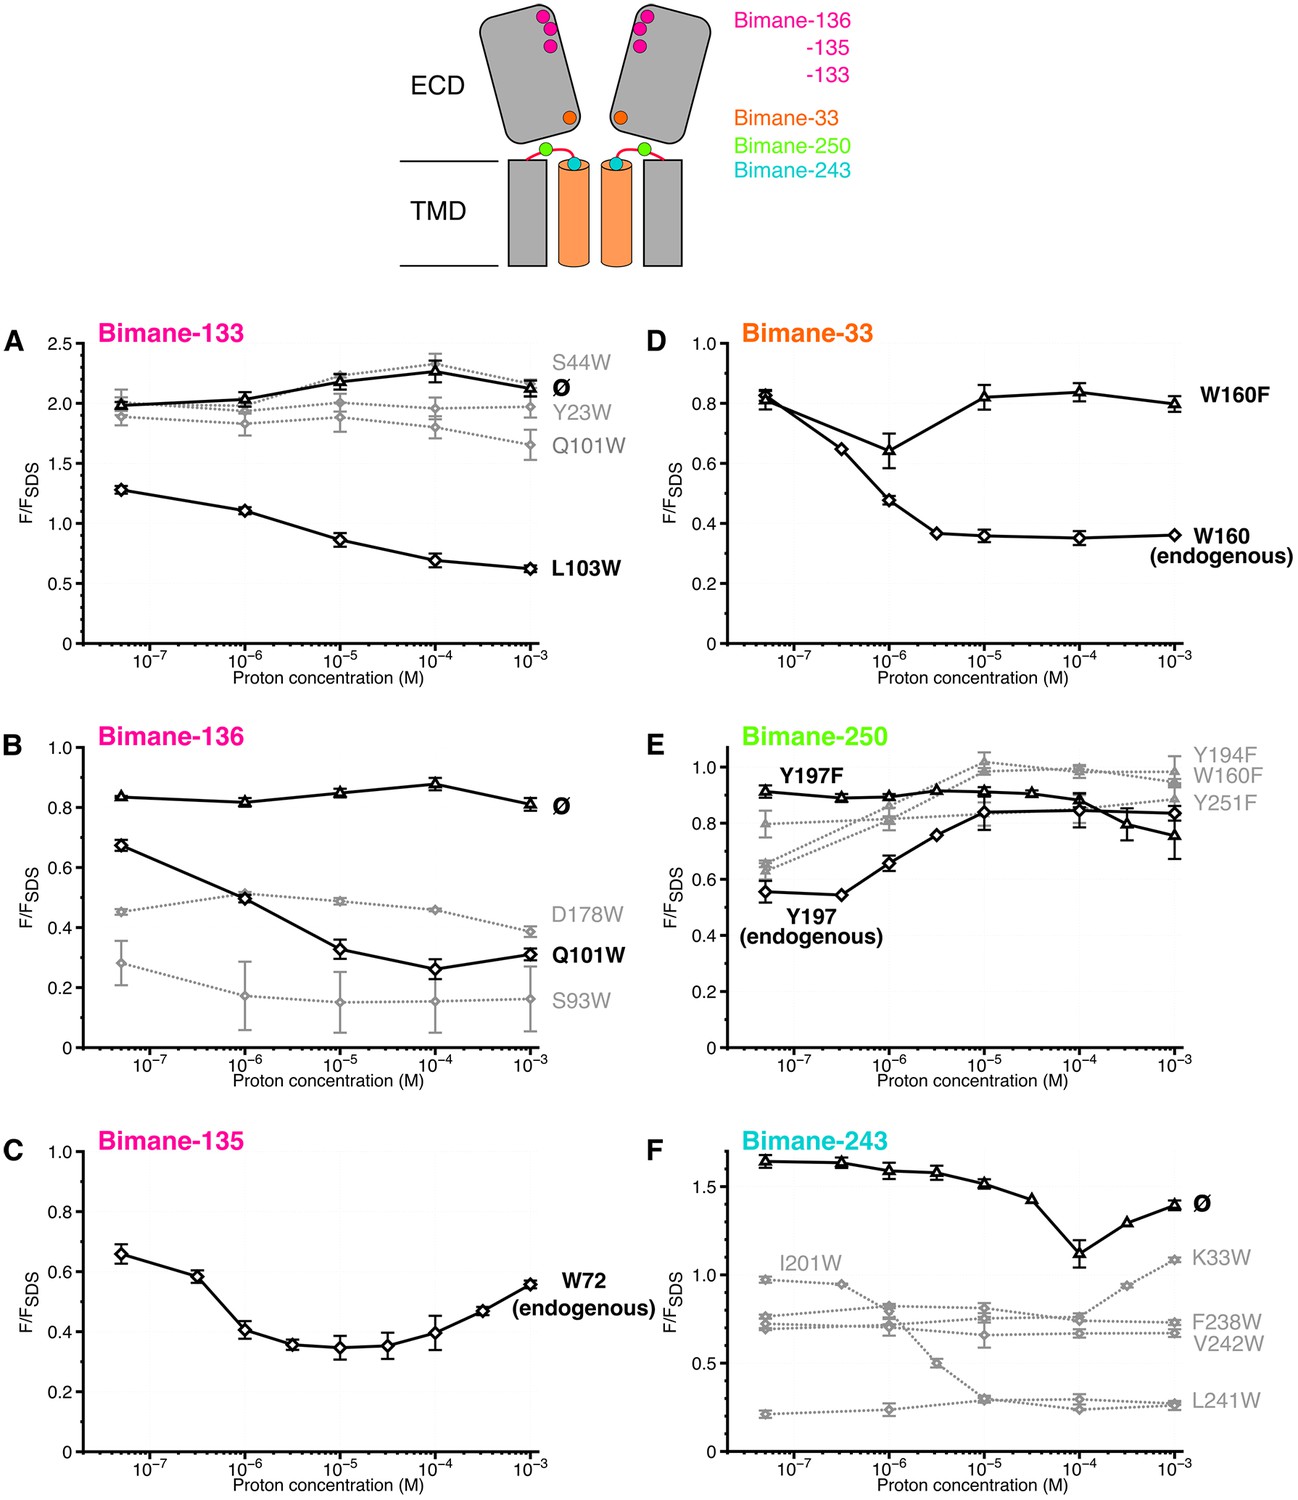
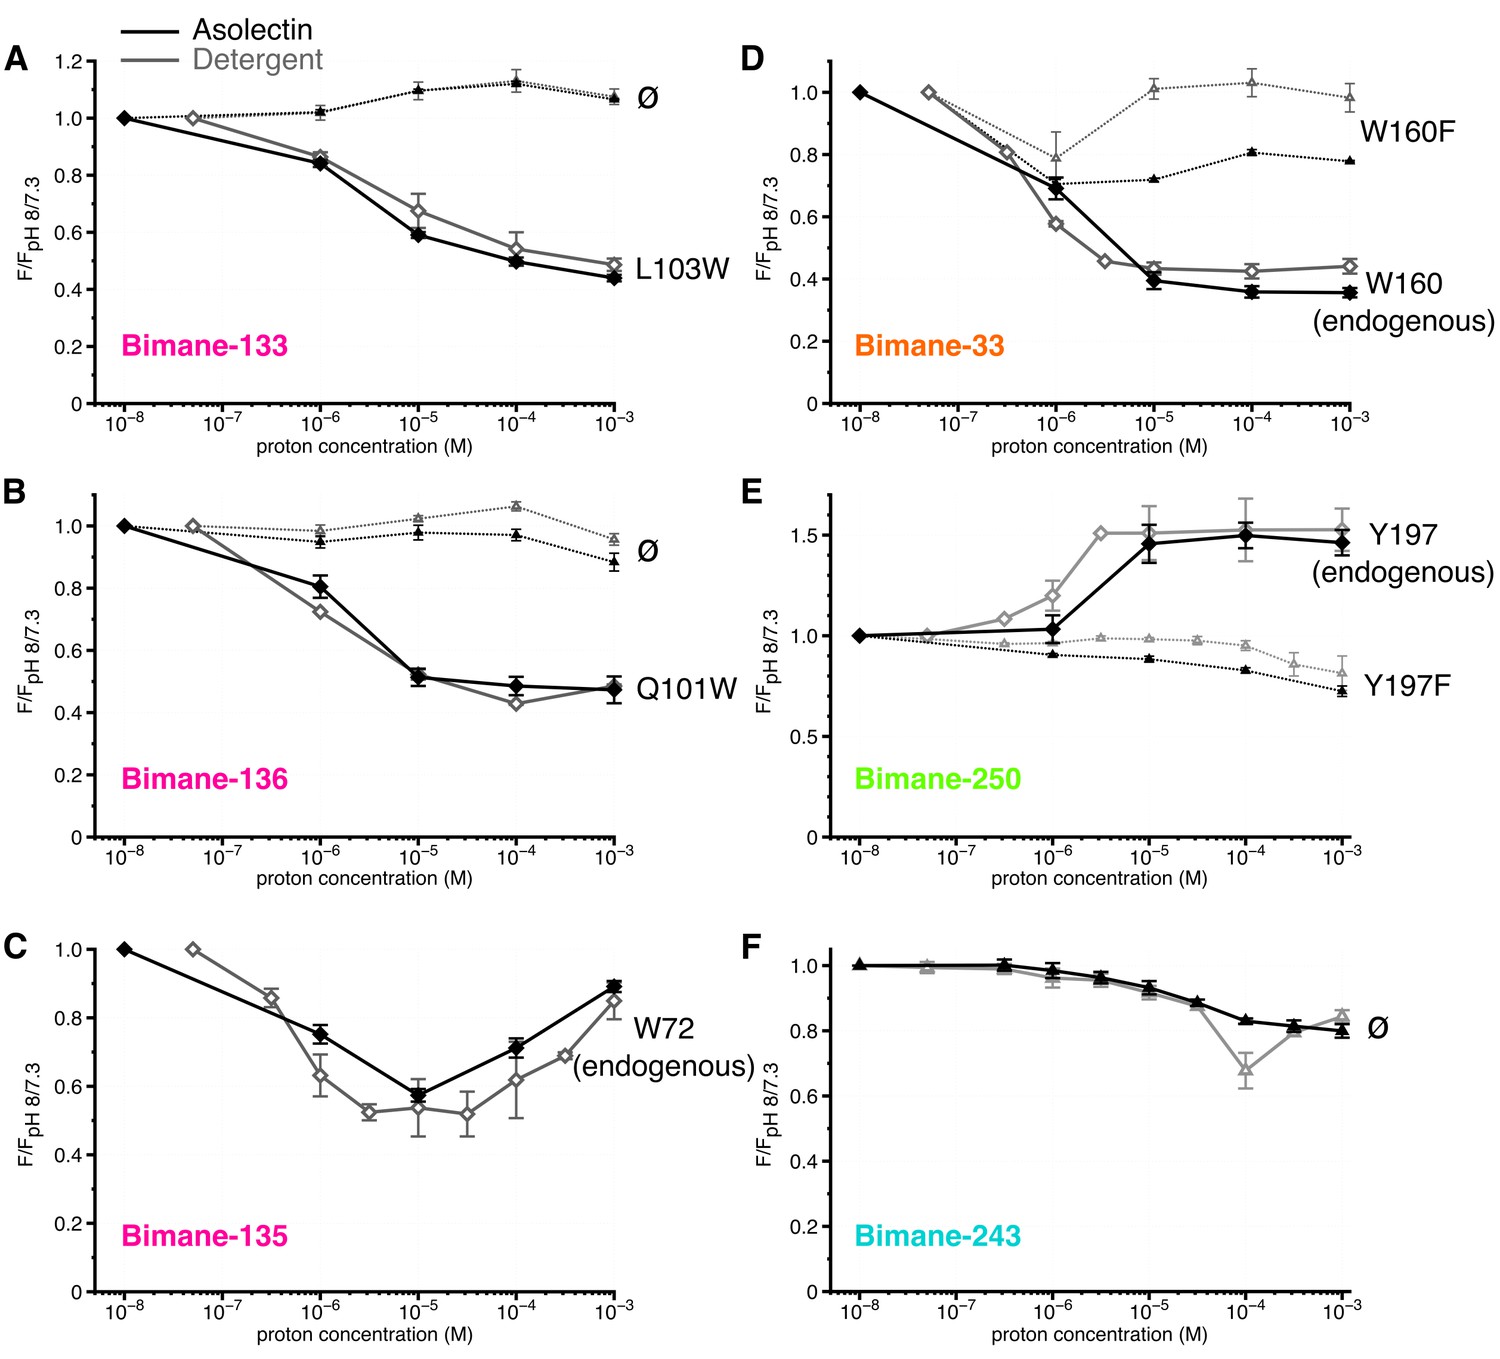
Steady-state variations of fluorescence of Bimane-GLIC mutants in detergent.
Top: Cartoon view of two subunits of GLIC, all the sites of bimane labeling are represented by a colored sphere. (A, B, C, D, E, F): The data show the fluorescence peak values as a function of the proton concentration, normalized to the peak intensity after SDS treatment. The same color code as the top cartoon was used to indicate the site of bimane labeling for each graph. Within one graph, the major quenching pairs with or without quencher are shown in bold black caption and secondary tryptophan quenchers are captioned in grey. The symbol ø was used for recordings made on receptors baring no other mutation than the one for bimane labeling and for which no endogenous quenchers were identified; otherwise the later are indicated in bold black caption. For all the points, mean values are presented and error bars represent the standard deviations.
Figure 3—figure supplement 1
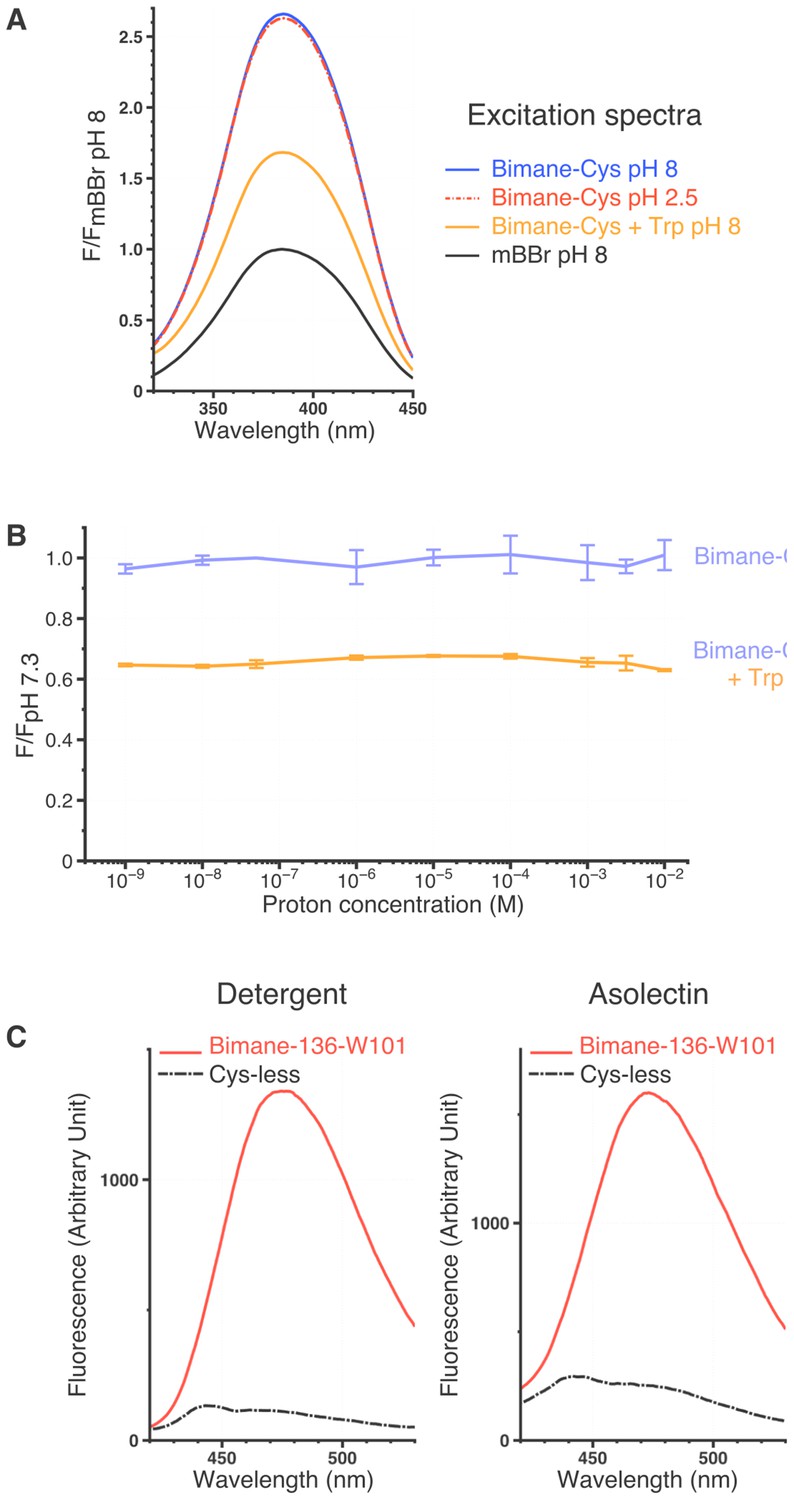
Spectral characteristics of mBBr and Bimane-GLIC mutants.
(A) Excitation spectra of the mBBr (10 µM) ± Cys (100 µM), ± Trp (12.5 mM) and at different pHs. All spectra were normalized on the peak value of the mBBr pH 8 excitation spectrum. (B) Variations of peak intensity of Bimane-Cys (10 µM) (purple) and Bimane-Cys (10 µM) + Trp (12.5 mM) (orange) in solutions ranging from pH 9 to pH 2. All intensities are normalized on the Bimane-Cys pH 7.3 peak intensity. All the data presented are mean values and error bars were calculated as standard deviations (n = 3). (C) Background fluorescence when recording Bimane-GLIC. The figure represents superimposed emission spectra of the Cys-less GLIC (C27S) and the Bimane-136-W101 mutant at pH 7.3, either in detergent or after reconstitution in asolectin liposomes. For both mutants, proteins were treated with mBBr and subsequently purified by gel filtration to remove unreacted fluorophore.
Figure 3—figure supplement 2
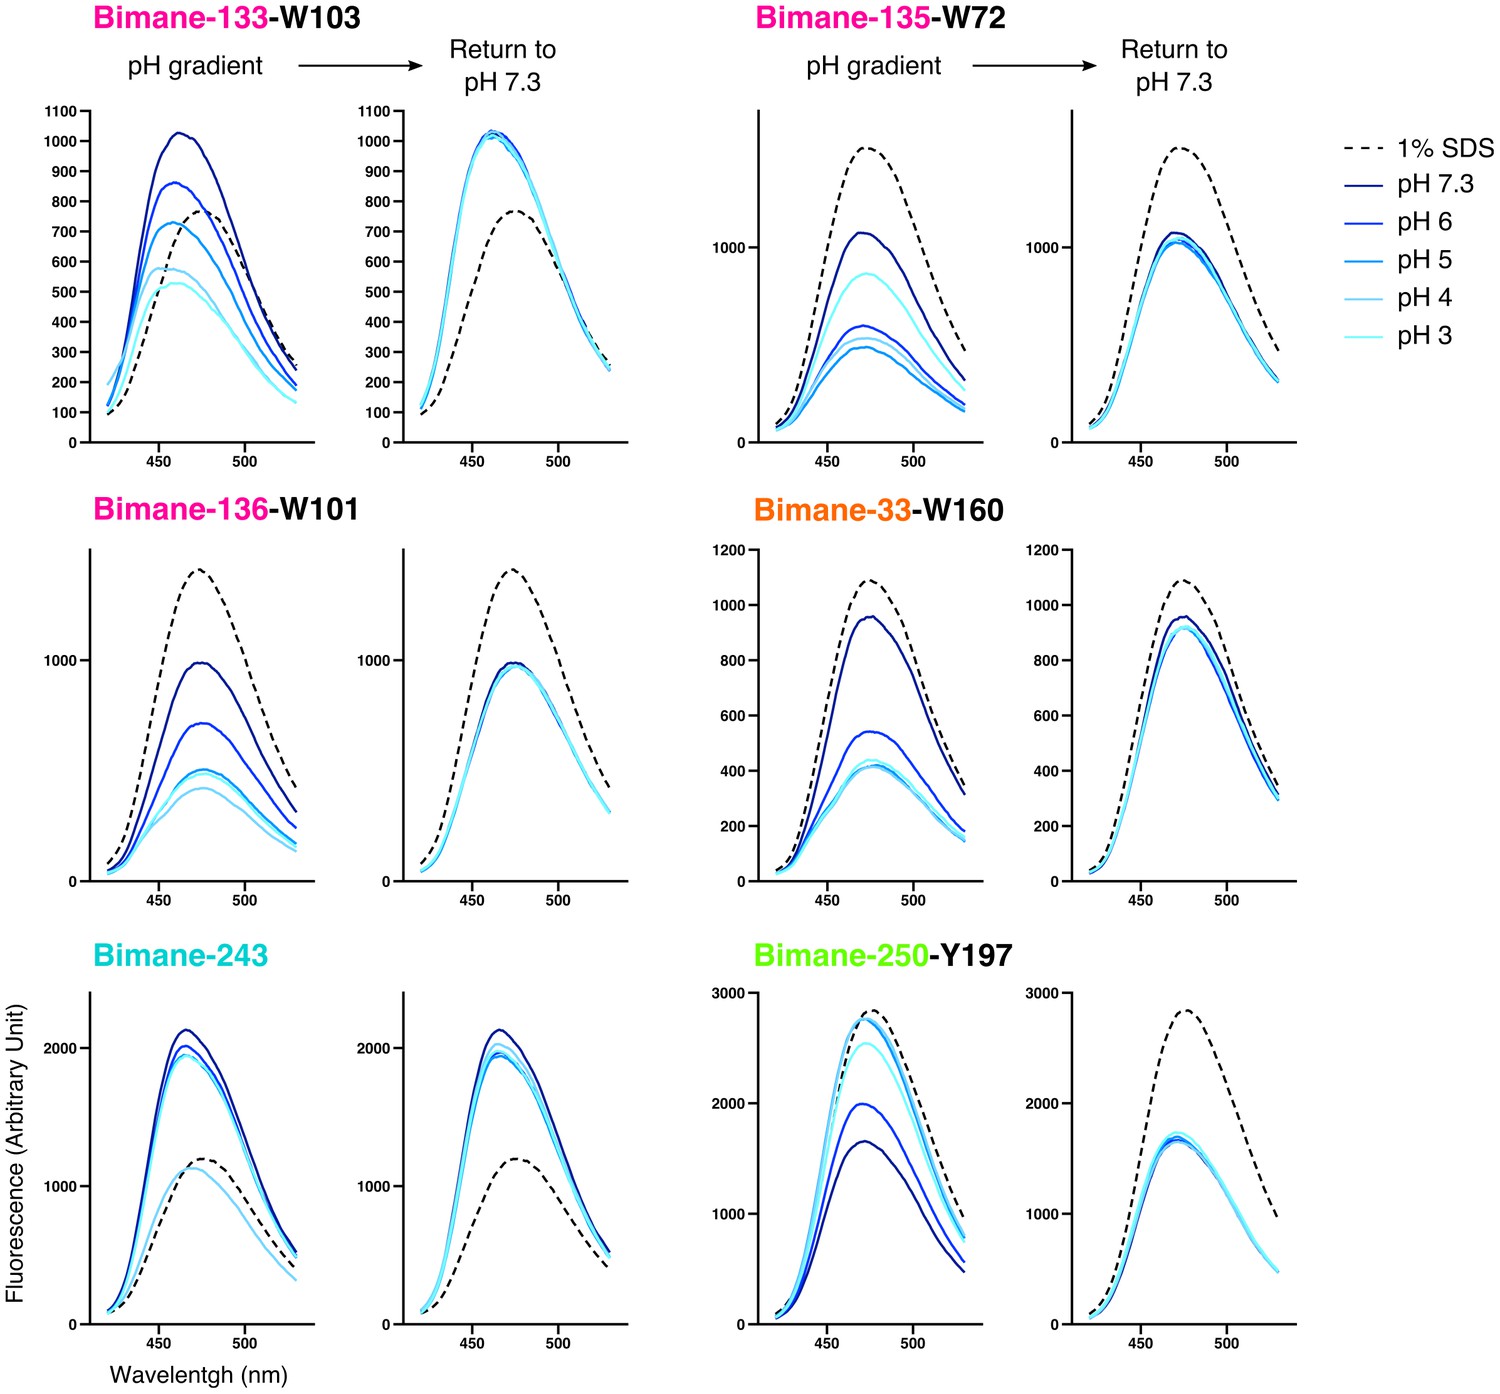
Emission spectra of Bimane-GLIC mutants in detergent.
For each mutant, the graph on the left represents representative emission spectra recorded at different pHs and in presence of 1% SDS used as a denaturing agent; the graph on the right represents the same samples after they were individually brought back to pH 7.3 (the 1% SDS spectrum is left for comparison). All axis labels are identical between graphs and were shown only on one graph for clarity.
Figure 4
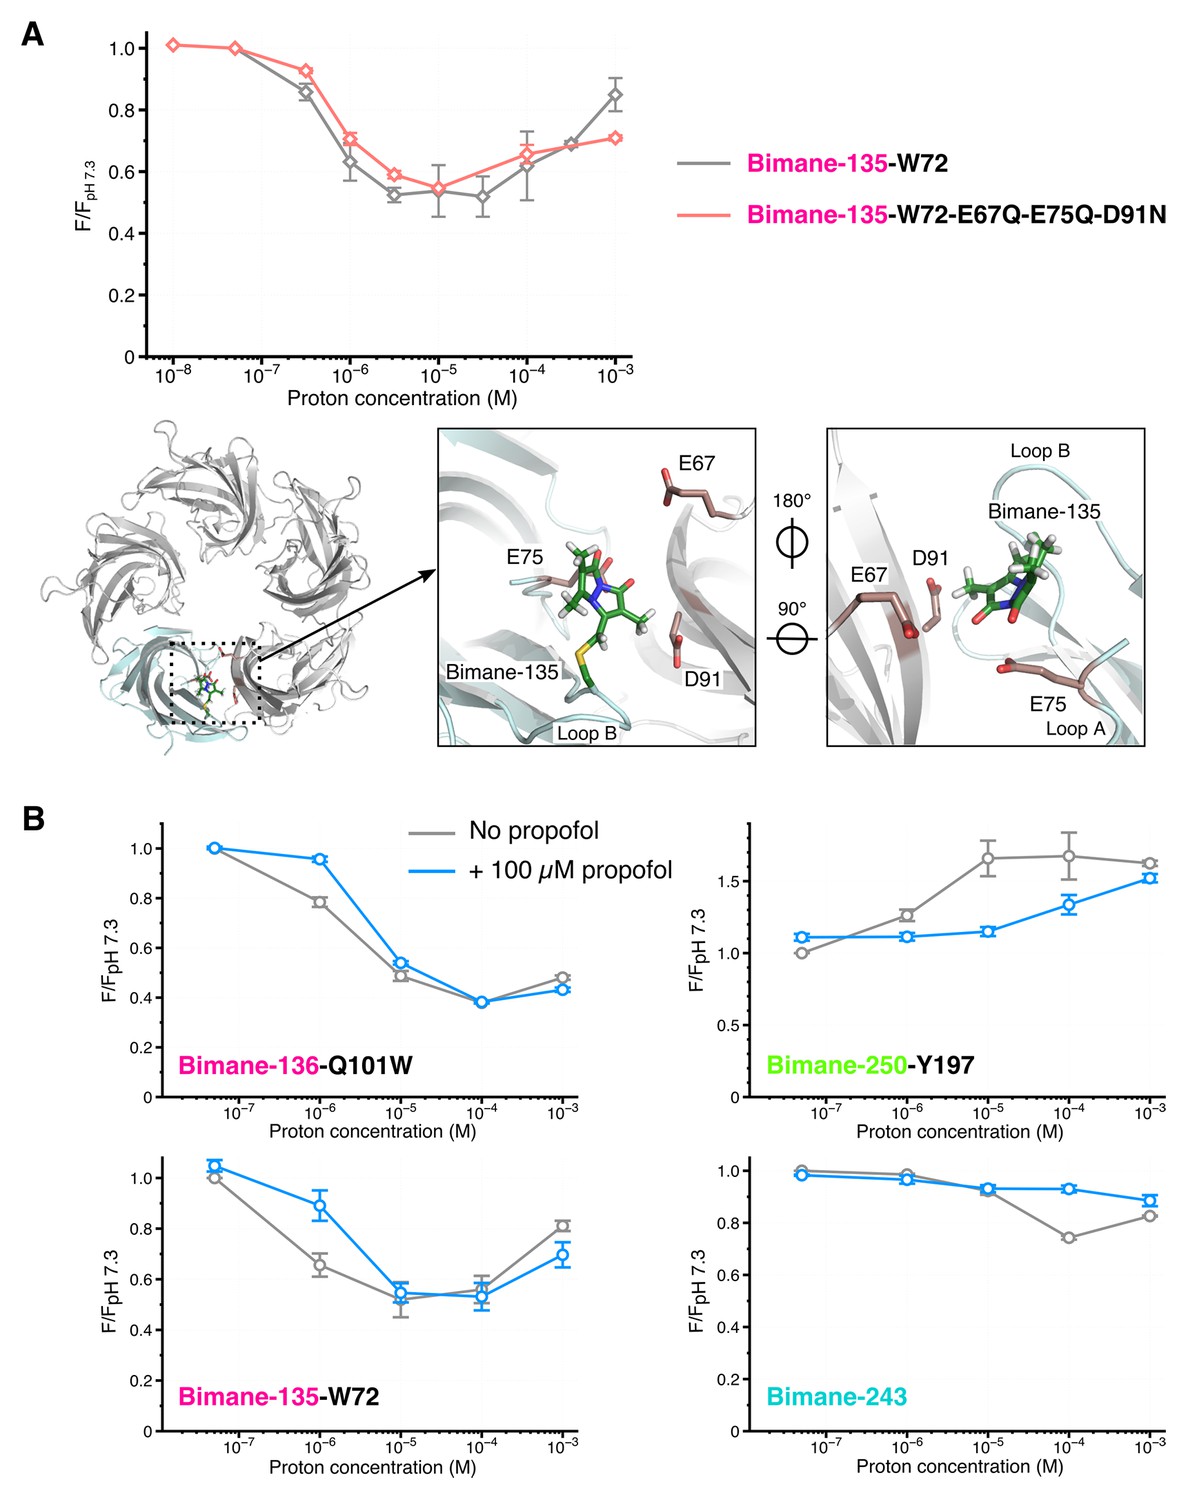
Effects of amino acid protonation and propofol on the fluorescence variations.
(A) Top: Fluorescence intensities of the mutants Bimane-135-W72 and Bimane-135-W72-E67Q-E75Q-D91N normalized on each mutant’s intensity at pH 7.3. Bottom, from left to right: Top view of the extracellular domain of GLIC Bimane-C135 showing one subunit in light blue, and the Bimane-C135 (green), E67, E75 and D91 (red) in stick representation; zoom on the subunits interface of the ECD, top view; zoom on the subunits interface viewed from the inside of the ECD. (B) For each pH, fluorescence recordings of Bimane-labeled mutants were first made without propofol, followed by addition of propofol at 100 µM final concentration and re-recording of the same samples. All the data were normalized on the value of fluorescence at pH 7.3 without propofol. For all the data, mean values are presented and error bars are calculated as standard deviations (n = 3 to 6).
Figure 5
Steady-state fluorescence of Bimane-GLIC in liposomes.
(A,B,C,D,E,F) The data show the fluorescence peak value for a given pH, normalized to the peak intensity of each mutant at the highest pH recorded (pH 8 or 7.3). Black lines represent the fluorescence values in liposomes and grey lines in detergent, for comparison. Plain lines represent the major fluorescent sensor and dashed lines the corresponding mutant in absence of quencher. The symbol ø was used for recordings made on receptors baring no other mutation than the one for bimane labeling and for which no endogenous quenchers were identified; otherwise the later are indicated in black caption. For all the data, mean values are presented and error bars are calculated as standard deviations.
Figure 6 with 1 supplement
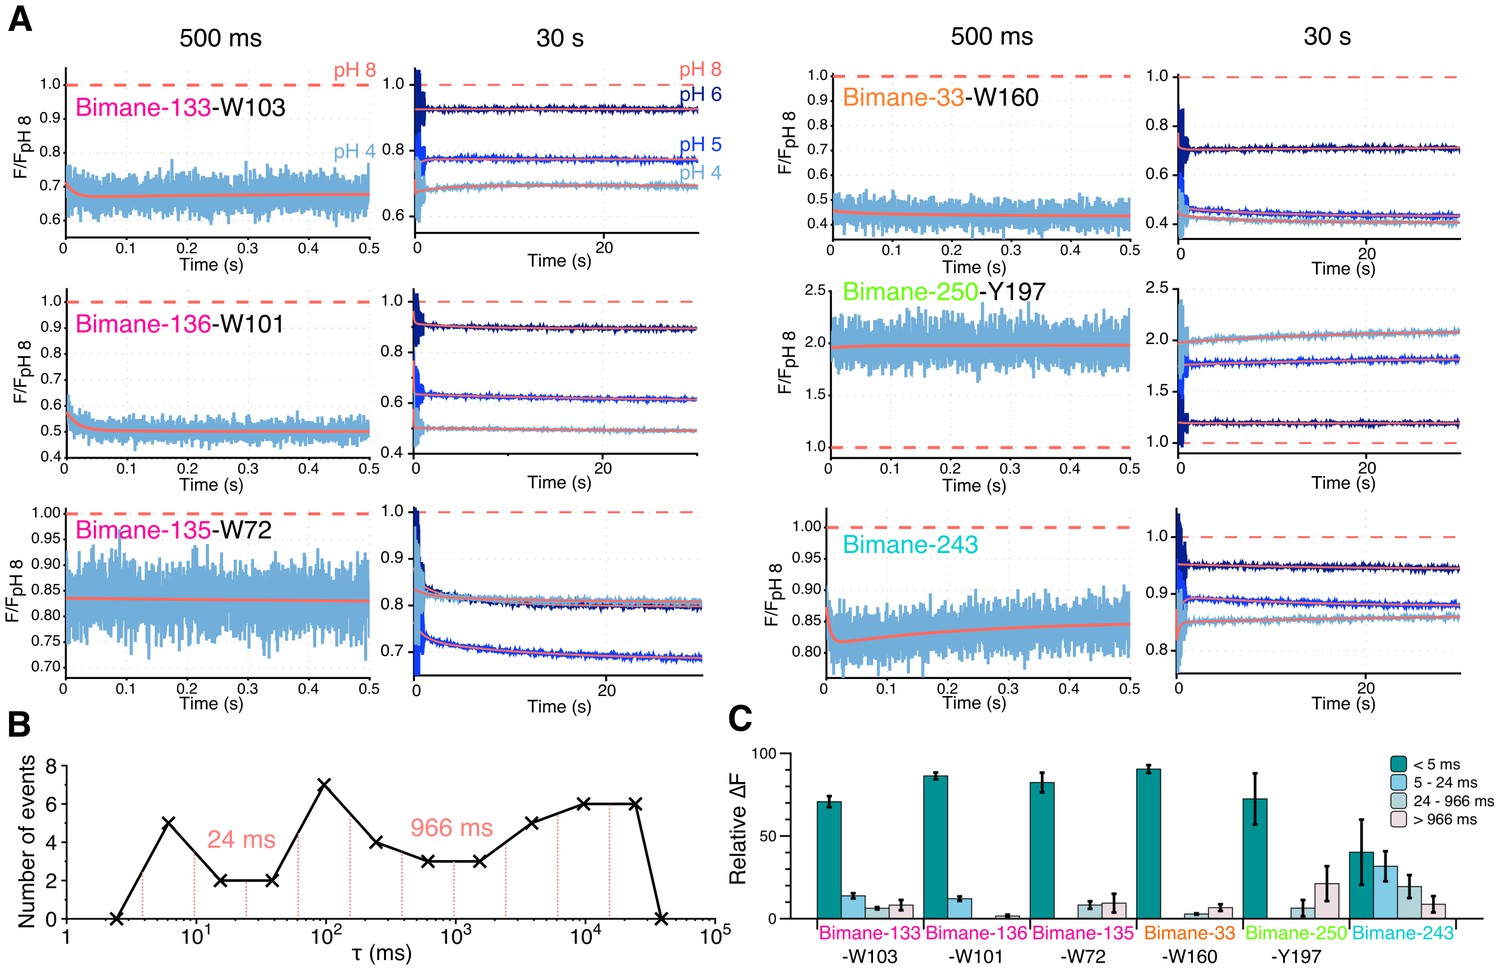
Stopped-flow fluorescence measurements.
(A) Each panel shows representative traces of the major quenching mutants with a zoom on the first 500 ms (left) and the entire recording (right). All traces are fitted to a multi-exponential (see Methods) represented in red. The color code is identical in each panel with a blue gradient starting from pH 6 (dark) to pH 4 (light). The red dash line represents the starting fluorescence at pH 8 after normalization, for the raw pH 8 trace see Figure 6—figure supplement 1. (B) Binning of τ values extracted from the stopped-flow multi-exponential fit (all pHs and all constructs were used for the plot). The log time binning interval is of 0.4 and the resulting bins are shown by red dashed lines on the plot. The distribution shows three major clusters for which the according τ value is indicated on the plot. (C) Fluorescence variations (calculated as a % of the overall variation at 30 s) for each time interval extracted from the binning plot. In this graph, mean values are presented and error bars are calculated as standard deviations.
Figure 6—figure supplement 1

Residuals of the stopped-flow data fits and pH 8 recordings.
Residuals plots: The figure shows an example for each mutant and pH recorded, chosen at random. The time axis (x) is represented in log scale for better visualization of the first milliseconds. pH 8 recordings: The figure shows non-treated, raw stopped-flow recordings of GLIC mutants at pH 8, chosen at random. The axis labels are the same for all the residuals plots and pH 8 raw data, respectively, and were represented only once for clarity. A.U. stands for arbitrary unit.
Figure 7 with 1 supplement

Comparison of GLIC motions and function.
(A) Fits to the Hill equation of fluorescence values in asolectin liposomes (black) and rate values extracted from the thallium flux assay (pink), both normalized to their respective maximum, for the Bimane-136-W101 mutant (n = 3). For comparison the ΔIf (thallium flux assay) curve of GLIC Cys-less is shown in grey (n = 3). (B) Stopped-flow recordings of the thallium fluxes quenching assay for the Bimane-136-W101 mutant. The pre-mix time was 15 ms for the empty and pH 5.2 liposomes and of 15.5 ms for the pH 4.5 and 4.2 recordings. (C) Fits to the Hill equation for electrophysiological currents (red) and fluorescence values in asolectin liposomes (black) for all major quenching pair mutants. The current and fluorescence are normalized to their respective maximum; pH 3.7 current values were excluded from the fits for mutants Bimane-250-Y197 and Bimane-33-W160 as they were systematically smaller than the maximal current. For all the data except panel B, mean values are presented and error bars are calculated as standard deviations.
Figure 7—figure supplement 1

Thallium flux assay.
(A) The figure shows raw, non-treated, recordings of ANTS encapsulated in proteoliposomes carrying either the GLIC Cys-less (left) or the GLIC mutant Bimane-136-W101 (right), at different pHs. The pre-mix times (times for which the liposomes are in presence of proton before addition of thallium) after which the fluorescence was recorded is indicated on the side of each trace. The black traces show the recordings of ANTS-containing liposomes without any receptors. (B) The figure shows plots of ANTS quenching by thallium rates as a function of the pre-mix times, for GLIC Cys-less (left) and GLIC Bimane-136-W101 (right). The purple trace shows the rates measured at pH 4.2 in presence of the pore blocker picrotoxinin (PTX) at 400 µM. In these graphs, mean values are presented, the error bars represent the standard deviation and measurement were done with n = 4 to 6.
Figure 8
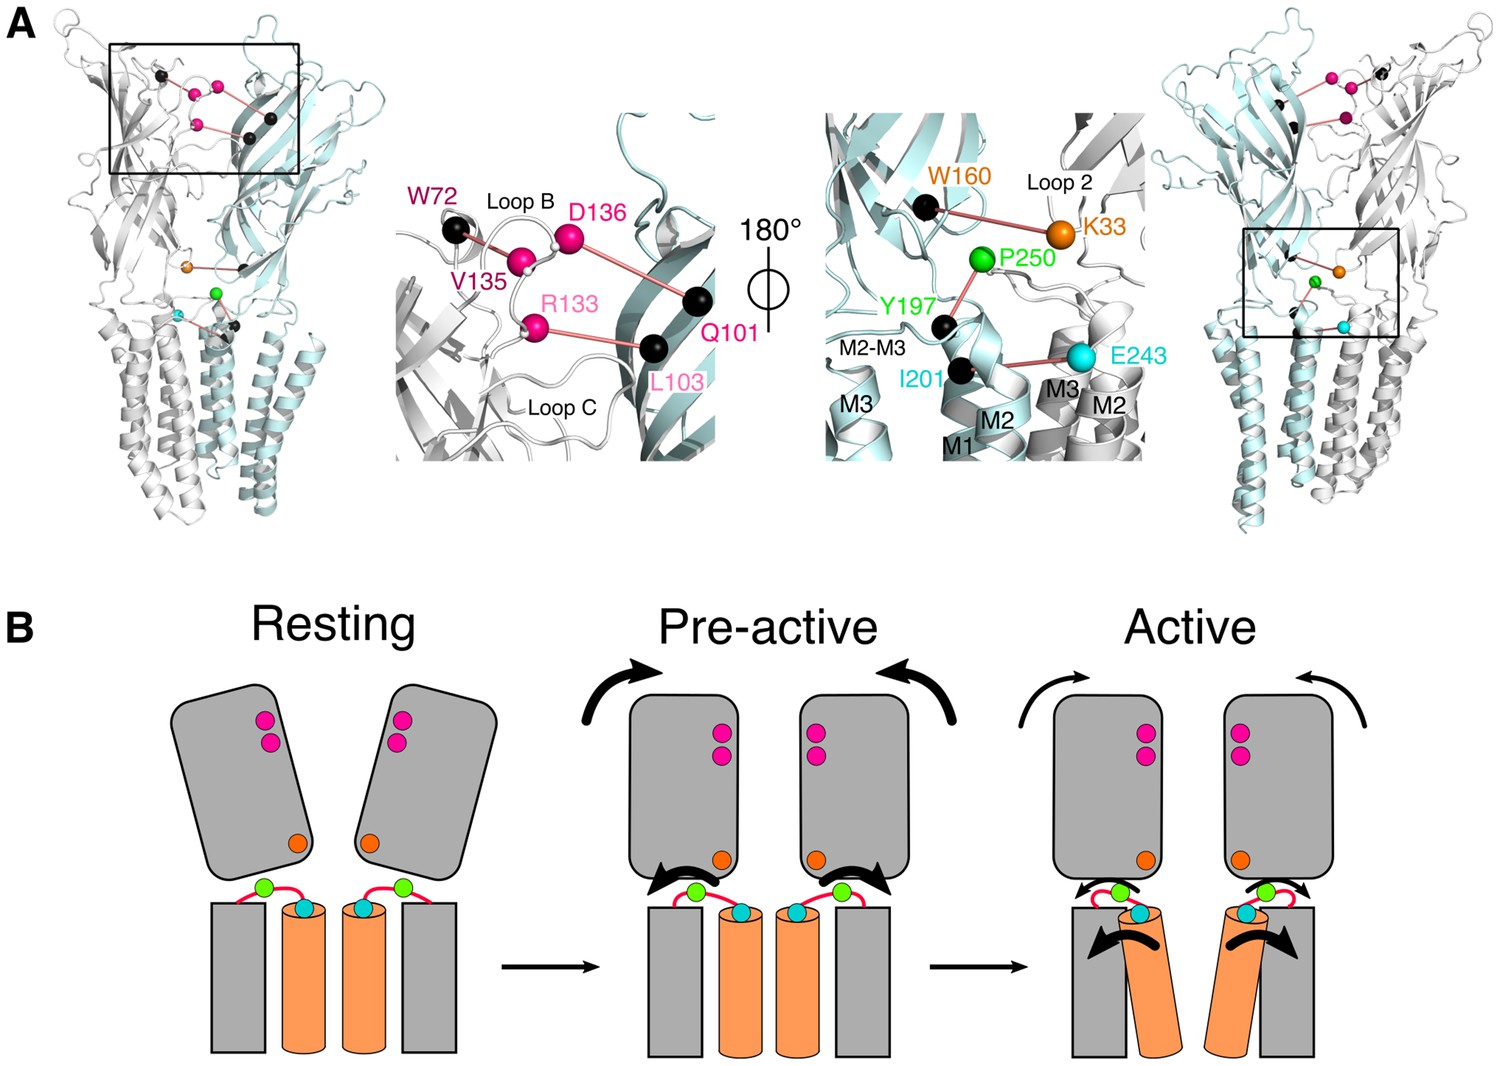
Conformational motions summary.
(A) Global and zoomed in view of the GLICpH 7 structure, representing only two subunits, with the left structures viewed from the outside of the pentamer and the right structures from the inside. All major quenching pairs are represented by a sphere, colored for the mutation to cysteine and bimane labeling, and black for the corresponding quencher. All pairs are captioned in the same color and joined by a red line. (B) Hypothetic kinetic scheme for the GLIC structural reorganizations. The large arrows represent the major recorded fluorescence variations and the small arrows represent minor variations.
Author response image 1
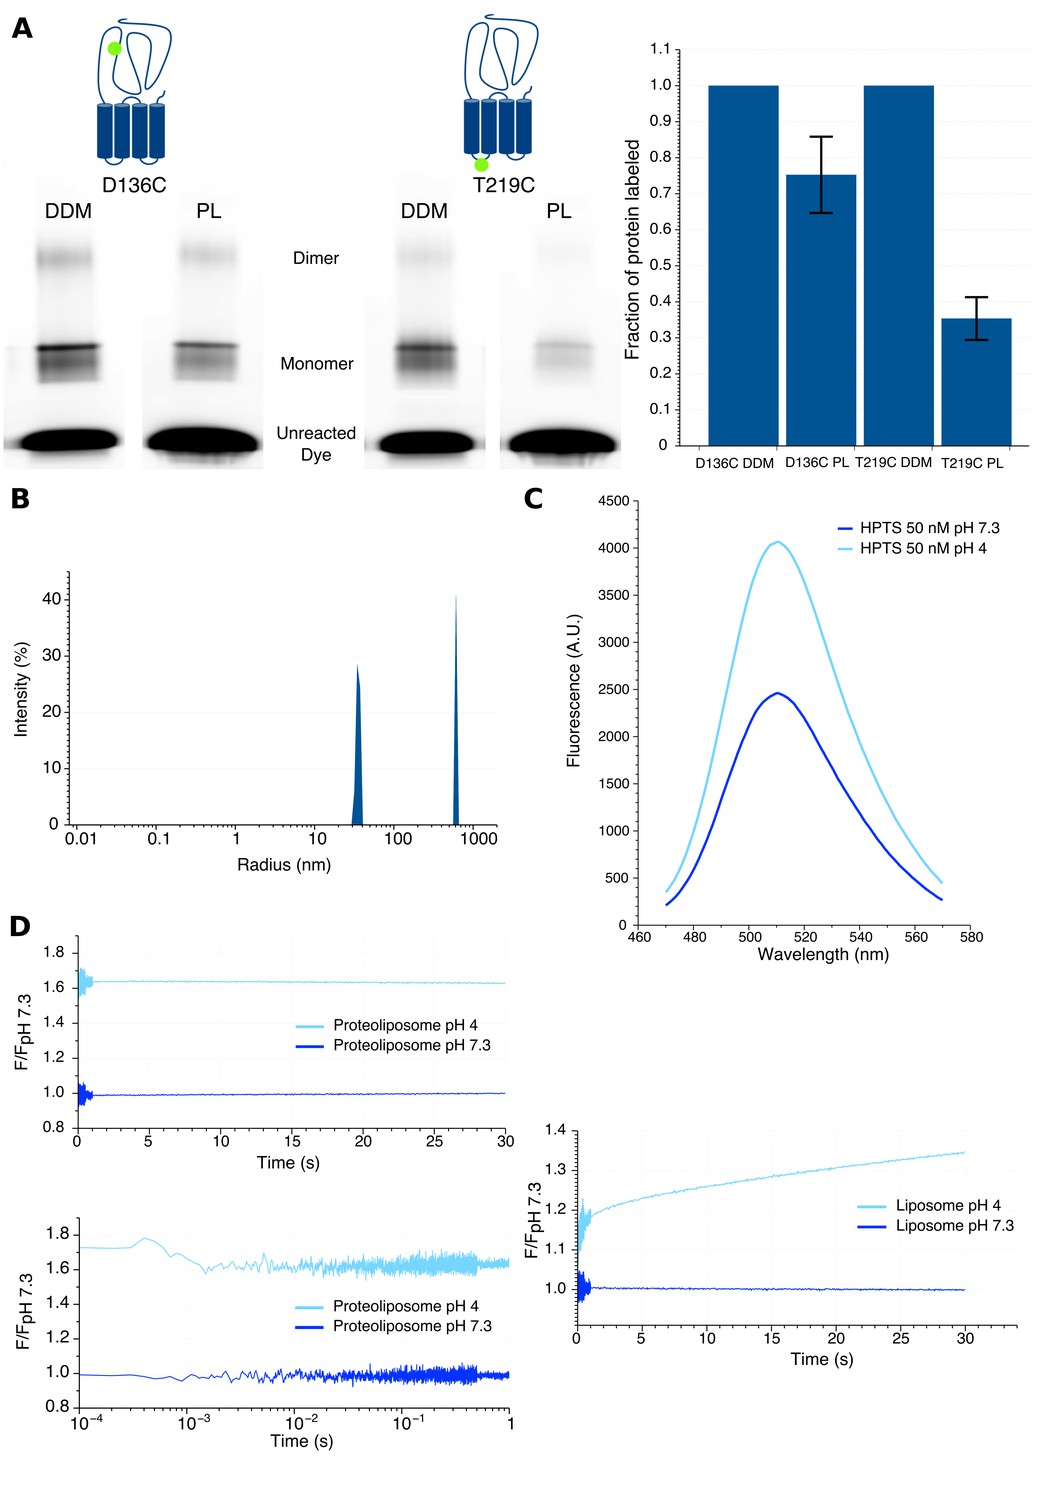
Characteristics of proteoliposomes used for Bimane quenching studies.
(A) SDS-PAGE gel fluorescence scan (left) and labeling quantification (right) of GLIC mutants D136C and T219C reconstituted in liposomes (PL) or in detergent (DDM) and labeled with Alexa Fluor 546. (B) Dynamic light scattering profile of GLIC proteoliposomes. The peaks are represented with the standard radius-weighted intensity and the radius on a log scale. The first peak represents GLIC proteoliposomes (which are the major species of objects) and the second peak represents aggregates (very minor species). (C) Emission spectra of the HPTS fluorophore in proteoliposome buffer, excited at 372 nm at pH 7.3 and pH 4. (D) Stopped-flow recordings of HTPS loaded GLIC proteoliposomes (left) or empty liposomes (right). The lower left panel shows a zoom of the first second of the GLIC proteoliposomes recordings, represented using a log scale for better visualization of the first milliseconds. For all recordings, the excitation was set at 372 nm and the fluorescence recorded through a 505 nm high-pass filter after a 2.1 ms mixing dead-time to reach either pH 7.3 or pH 4.
Tables
Table 1
Dose dependence of currents and fluorescence. The table contains pH50 and nH values obtained through Hill equation fittings of current and fluorescence dose-response curves. Imax values represent the maximal current recorded. NF stands for not functional when maximal currents are smaller than 500 nA. NA stands for non-applicable and was used for mutants that did not elicit fluorescence variations bigger than 10% across the range of pH tested. NM stands for not measured. n represents the number of experiments. For all the data, mean values are presented and error values represent the standard deviations.
| Electrophysiology non-labeled | Electrophysiology labeled | Fluorescence detergent | Fluorescence liposomes | |||||||||||
|---|---|---|---|---|---|---|---|---|---|---|---|---|---|---|
| Mutant | pH50 | nH | Imax | n | pH50 | nH | Imax | n | pH50 | nH | n | pH50 | nH | n |
| WT | 5.3 ± 0.2 | 1.29 ± 0.06 | 6 ± 1 | 4 | NA | NA | NA | NA | NM | NM | NM | NM | NM | NM |
| C27S | 5.31 ± 0.07 | 1.6 ± 0.2 | 7.0 ± 0.4 | 5 | 5.3 ± 0.1 | 1.7 ± 0.2 | 7 ± 2 | 3 | NA | NA | 3 | NA | NA | 3 |
| R133C | 5.3 ± 0.2 | 1.8 ± 0.1 | 7 ± 3 | 4 | 5.1 ± 0.2 | 2.14 ± 0.05 | 8 ± 3 | 3 | 5.4 ± 0.3 | 1.7 ± 0.6 | 5 | 5.5 ± 0.1 | 1.3 ± 0.2 | 3 |
| R133C Y23W | 5.2 ± 0.4 | 2.0 ± 0.3 | 9.2 ± 0.8 | 3 | 5.1 ± 0.2 | 2.50 ± 0.07 | 6 ± 1 | 3 | NA | NA | 3 | NM | NM | NM |
| R133C Q101W | 4.9 ± 0.2 | 2.3 ± 0.1 | 4 ± 2 | 3 | 5.0 ± 0.1 | 2.49 ± 0.03 | 4.9 ± 0.9 | 3 | NA | NA | 3 | NM | NM | NM |
| R133C L103W | 5.1 ± 0.1 | 2.2 ± 0.4 | 6.8 ± 0.8 | 3 | 5.23 ± 0.09 | 1.7 ± 0.2 | 6 ± 2 | 3 | 5.2 ± 0.3 | 0.7 ± 0.2 | 4 | 5.50 ± 0.04 | 0.78 ± 0.07 | 3 |
| V135C W72 | 5.6 ± 0.2 | 1.7 ± 0.3 | 7.0 ± 0.9 | 4 | 5.29 ± 0.08 | 2.0 ± 0.1 | 7.2 ± 0.7 | 3 | 6.31 ± 0.09 | 1.7 ± 0.2 | 7 | 6.05 ± 0.02 | 3 ± 1 | 4 |
| V135C E67Q E75Q D91N | 5.1 | 1.8 | 7.3 | 1 | 5.1 ± 0.2 | 2.0 ± 0.4 | 6.5 ± 1.0 | 3 | 6.14 ± 0.03 | 1.8 ± 0.2 | 3 | NM | NM | NM |
| D136C | 5.3 ± 0.1 | 1.9 ± 0.2 | 7.0 ± 0.9 | 4 | 5.29 ± 0.04 | 2.0 ± 0.3 | 8.3 ± 0.9 | 3 | NA | NA | 3 | NA | NA | 3 |
| D136C S93W | 4.50 ± 0.05 | 2.1 ± 0.4 | 3 ± 1 | 3 | 4.60 ± 0.06 | 1.5 ± 0.1 | 2.1 ± 0. 9 | 3 | NA | NA | 4 | NM | NM | NM |
| D136C Q101W | 5.17 ± 0.08 | 2.3 ± 0.1 | 8 ± 2 | 3 | 5.4 ± 0.2 | 2.2 ± 0.3 | 9 ± 3 | 3 | 5.85 ± 0.08 | 0.96 ± 0.08 | 4 | 5.8 ± 0.1 | 1.3 ± 0.6 | 3 |
| D136C D178W | 5 | 1.8 | 6.2 | 1 | 5.3 | 1.8 | 6.6 | 1 | NA | NA | 3 | NM | NM | NM |
| K33C W160 | 5.88 ± 0.03 | 1.8 ± 0.1 | 9 ± 2 | 3 | 5.6 ± 0.2 | 1.8 ± 0.4 | 8 ± 2 | 3 | 6.22 ± 0.03 | 2.0 ± 0.4 | 4 | 5.95 ± 0.07 | 1.25 ± 0.09 | 6 |
| K33C W160F | 4.55 ± 0.03 | 2.6 ± 0.2 | 3.0 ± 0.1 | 3 | 4.4 ± 0.1 | 2.2 ± 0.6 | 1 ± 1 | 4 | NA | NA | 3 | NA | NA | 3 |
| P250C Y197 | 5.1 ± 0.1 | 1.54 ± 0.09 | 7.0 ± 1.2 | 3 | 4.8 ± 0.2 | 2.3 ± 0.4 | 4.3 ± 0.8 | 3 | 5.88 ± 0.09 | 2.1 ± 0.8 | 5 | 5.5 ± 0.3 | 2.2 ± 0.6 | 4 |
| P250C W160F | NF | NF | NF | 3 | NF | NF | NF | 4 | 6.06 ± 0.06 | 1.9 ± 0.1 | 3 | NM | NM | NM |
| P250C Y194F | 5.1 ± 0.2 | 1.7 ± 0.4 | 6.4 ± 0.8 | 3 | 4.5 ± 0.2 | 1.8 ± 0.2 | 2 ± 1 | 3 | 5.97 ± 0.02 | 1.4 ± 0.4 | 4 | NM | NM | NM |
| P250C Y197F | 5.2 ± 0.1 | 1.3 ± 0.3 | 4.1 ± 0.1 | 5 | 4.73 ± 0.09 | 1.2 ± 0.2 | 1.5 ± 0.9 | 3 | NA | NA | 3 | NA | NA | 3 |
| P250C Y251F | NF | NF | NF | 7 | NF | NF | NF | 3 | NA | NA | 4 | NM | NM | NM |
| E243C | 5.1 ± 0.1 | 1.7 ± 0.3 | 8 ± 1 | 4 | 4.7 ± 0.2 | 1.7 ± 0.3 | 5 ± 4 | 3 | 4.5 ± 0.2 | 2.0 ± 0.2 | 4 | 4.8 ± 0.1 | 0.9 ± 0.3 | 6 |
| E243C K33W | NF | NF | NF | 4 | NF | NF | NF | 3 | NA | NA | 3 | NM | NM | NM |
| E243C I201W | NF | NF | NF | 10 | NF | NF | NF | 3 | 5.67 ± 0.04 | 1.549 ± 0.004 | 3 | 5.8 | 1.4 | 2 |
| E243C F238W | 5.2 ± 0.2 | 1.4 ± 0.2 | 7 ± 1 | 4 | 4.7 ± 0.3 | 1.5 ± 0.5 | 5 ± 3 | 3 | NA | NA | 3 | NM | NM | NM |
| E243C L241W | 5.7 ± 0.2 | 0.69 ± 0.06 | 5.09 ± 0.08 | 3 | 4.8 ± 0.1 | 0.61 ± 0.03 | 2 ± 1 | 3 | NA | NA | 3 | NM | NM | NM |
| E243C V242W | NF | NF | NF | 4 | NF | NF | NF | 5 | NA | NA | 3 | NM | NM | NM |
Table 2
Activation kinetics of GLIC mutants labeled with bimane. The τ values were obtained through a double exponential fit to the electrophysiology traces (see Materials and methods). n represents the number of recordings used for the analysis. For all the data, mean values are presented and error values represent the standard deviations.
| Mutant | τ1 (s) | τ2 (s) | τw (s) | n |
|---|---|---|---|---|
| R133C L103W | 1.0 ± 0.5 | 6 ± 5 | 3 ± 2 | 3 |
| V135C W72 | 1.9 ± 0.4 | 9 ± 5 | 3 ± 1 | 3 |
| D136C Q101W | 0.9 ± 0.2 | 5 ± 4 | 2 ± 2 | 3 |
| K33C W160 | 1.7 ± 0.6 | 7 ± 5 | 5 ± 3 | 3 |
| P250C Y197 | 5.4 ± 0.7 | 50 ± 8 | 30 ± 10 | 3 |
| E243C | 2.80 ± 0.09 | 8.9 ± 0.6 | 3.57 ± 0.06 | 3 |
Table 3
Fluorescence values at pH 7/8 in detergent or asolectin liposomes. The data presented are the values of fluorescence at the highest tested pH, normalized to the fluorescence after denaturation (1% SDS). n represents the number of experiments. For all the data, mean values are presented and error values represent the standard deviations.
| Mutant | F/FSDS in detergent | n | F/FSDS in asolectin | n |
|---|---|---|---|---|
| Bimane-133 | 1.98 ± 0.03 | 4 | 1.91 ± 0.02 | 3 |
| Bimane-133-W103 | 1.28 ± 0.03 | 4 | 1.182 ± 0.003 | 3 |
| Bimane-135-W72 | 0.66 ± 0.03 | 7 | 0.76 ± 0.03 | 4 |
| Bimane-136 | 0.835 ± 0.003 | 3 | 0.87 ± 0.03 | 3 |
| Bimane-136-W101 | 0.67 ± 0.02 | 4 | 0.69 ± 0.02 | 4 |
| Bimane-33-W160 | 0.83 ± 0.02 | 4 | 1.09 ± 0.03 | 6 |
| Bimane-33-W160F | 0.81 ± 0.08 | 3 | 0.87 ± 0.02 | 3 |
| Bimane-243 | 1.68 ± 0.02 | 4 | 1.60 ± 0.01 | 6 |
| Bimane-250-Y197 | 0.55 ± 0.05 | 4 | 0.60 ± 0.01 | 4 |
| Bimane-250-Y197F | 0.93 ± 0.01 | 3 | 1.42 ± 0.08 | 3 |
Table 4
Comparison of stopped-flow and steady-state fluorescence variations. The two columns show the maximal fluorescence variation recorded in the steady-state conditions or after 30 s of stopped-flow recordings. (+) indicates an increase of fluorescence and (−) indicates a decrease. n represents the number of experiments. For all the data, mean values are presented and error values represent the standard deviations.
| Mutant | pH | Maximal ∆F steady-state (%) | n | Maximal ∆F stopped-flow (%) | n |
|---|---|---|---|---|---|
| Bimane-133-W103 | pH 6 | (−) 16 ± 1 | 3 | (−) 11 ± 3 | 4 |
| pH 5 | (−) 41 ± 1 | 3 | (−) 28 ± 9 | 3 | |
| pH 4 | (−) 50 ± 1 | 3 | (−) 38 ± 5 | 4 | |
| Bimane-135-W72 | pH 6 | (−) 25 ± 3 | 4 | (−) 20 ± 7 | 6 |
| pH 5 | (−) 43 ± 2 | 4 | (−) 29.9 ± 0.9 | 6 | |
| pH 4 | (−) 29 ± 3 | 4 | (−) 20 ± 3 | 4 | |
| Bimane-136-W101 | pH 6 | (−) 20 ± 4 | 3 | (−) 12 ± 3 | 4 |
| pH 5 | (−) 49 ± 3 | 3 | (−) 43 ± 4 | 4 | |
| pH 4 | (−) 53 ± 2 | 5 | (−) 45 ± 4 | 4 | |
| Bimane-33-W160 | pH 6 | (−) 31 ± 4 | 6 | (−) 28 ± 5 | 3 |
| pH 5 | (−) 61 ± 3 | 6 | (−) 55 ± 4 | 4 | |
| pH 4 | (−) 64 ± 2 | 6 | (−) 56 ± 3 | 3 | |
| Bimane-250-Y197 | pH 6 | (+) 3 ± 7 | 4 | (+) 15 ± 8 | 4 |
| pH 5 | (+) 46 ± 9 | 4 | (+) 60 ± 20 | 4 | |
| pH 4 | (+) 50 ± 6 | 4 | (+) 70 ± 40 | 4 | |
| Bimane-243 | pH 6 | (−) 2 ± 2 | 6 | (−) 13 ± 10 | 4 |
| pH 5 | (−) 7 ± 2 | 6 | (−) 19 ± 9 | 4 | |
| pH 4 | (−) 17.0 ± 0.8 | 6 | (−) 18 ± 9 | 4 |
Table 5
Kinetic and fluorescence parameters of real-time measurements. All the values presented in the table were extracted from multi-exponential fits of the real-time measurements (see Materials and methods). The relative ∆F for each exponential fit were calculated using the maximal F variation of each curve. In the case fluorescence variations were ‘bi-directional’, the respective amplitudes of each phases were added to determine the maximal F variation value. (+) indicates an increase of fluorescence and (−) indicates a decrease. NA stands for non-applicable and was used when a single or double exponentials were sufficient to fit the data. For Bimane-133-W103 at pH 6, no fluorescence variations were measured after the 5 ms non-exploited data; hence no exponential fits were made for this particular condition. n represents the number of experiments. For all the data, mean values are presented and error values are calculated as standard deviations.
| Dead-time (<5 ms) | Exponential 1 | Exponential 2 | Exponential 3 | ||||||
|---|---|---|---|---|---|---|---|---|---|
| Mutant | pH | Relative ∆F (%) | τ1 (ms) | Relative ∆F (%) | τ2 (ms) | Relative ∆F (%) | τ3 (ms) | Relative ∆F (%) | n |
| Bimane-133-W103 | pH 6 | (−) 94 ± 6 | NA | NA | NA | NA | NA | NA | 4 |
| pH 5 | (−) 72 ± 1 | 10 ± 4 | (−) 11.6 ± 0.7 | 290 ± 40 | (+) 11 ± 5 | 21,000 ± 6000 | (−) 5 ± 4 | 3 | |
| pH 4 | (−) 71 ± 3 | 10 ± 7 | (−) 14 ± 2 | 600 ± 400 | (+) 6 ± 1 | 26,000 ± 18,000 | (−) 8 ± 3 | 4 | |
| Bimane-135-W72 | pH 6 | (−) 53 ± 9 | 50 ± 40 | (−) 12 ± 4 | 700 ± 400 | (−) 17 ± 6 | 3000 ± 1000 | (−) 19 ± 4 | 6 |
| pH 5 | (−) 50 ± 20 | 100 ± 100 | (−) 8 ± 5 | 1000 ± 1000 | (−) 19 ± 8 | 8000 ± 4000 | (−) 21 ± 6 | 6 | |
| pH 4 | (−) 82 ± 6 | 700 ± 400 | (−) 8 ± 2 | 30,000 ± 40,000 | (−) 9 ± 6 | NA | NA | 4 | |
| Bimane-136-W101 | pH 6 | (−) 40 ± 30 | 9 ± 4 | (−) 30 ± 10 | 100 ± 10 | (−) 10 ± 10 | 2900 ± 600 | (−) 14 ± 7 | 4 |
| pH 5 | (−) 60 ± 10 | 9 ± 3 | (−) 30 ± 10 | 40 ± 20 | (−) 5 ± 2 | 18,500 ± 900 | (−) 7 ± 2 | 4 | |
| pH 4 | (−) 86 ± 2 | 11 ± 3 | (−) 12 ± 1 | 4000 ± 5000 | (−) 1.6 ± 0.9 | NA | NA | 4 | |
| Bimane-33-W160 | pH 6 | (−) 73 ± 9 | 9 ± 5 | (−) 19 ± 9 | 100 ± 100 | (−) 6.1 ± 0.7 | 3000 ± 4000 | (−) 3.2 ± 0.6 | 3 |
| pH 5 | (−) 88.3 ± 0.9 | 100 ± 100 | (−) 5 ± 2 | 1000 ± 1000 | (−) 2.9 ± 0.4 | 16,000 ± 9000 | (−) 4 ± 2 | 4 | |
| pH 4 | (−) 90 ± 2 | 100 ± 100 | (−) 2.8 ± 0.4 | 2000 ± 2000 | (−) 3.6 ± 0.8 | 10,000 ± 2000 | (−) 4.1 ± 0.5 | 3 | |
| Bimane-250-Y197 | pH 6 | (+) 90 ± 10 | 300 ± 500 | (+) 10 ± 10 | NA | NA | NA | NA | 4 |
| pH 5 | (+) 86 ± 5 | 200 ± 100 | (+) 5 ± 2 | 9000 ± 3000 | (+) 9 ± 4 | NA | NA | 4 | |
| pH 4 | (+) 70 ± 20 | 100 ± 100 | (+) 6 ± 5 | 6000 ± 5000 | (+) 20 ± 10 | NA | NA | 4 | |
| Bimane-243 | pH 6 | (−) 80 ± 20 | 8000 ± 10,000 | (−) 8 ± 7 | 12,000 ± 3000 | (−) 21 ± 7 | NA | NA | 4 |
| pH 5 | (−) 60 ± 20 | 9 ± 7 | (−) 11 ± 4 | 270 ± 40 | (+) 22 ± 8 | 16,000 ± 6000 | (−) 12 ± 7 | 4 | |
| pH 4 | (−) 40 ± 20 | 5 ± 1 | (−) 32 ± 9 | 150 ± 20 | (+) 19 ± 7 | 14,000 ± 7’000 | (+) 9 ± 5 | 4 | |
Author response table 1
Labeling efficiency of GLIC mutants by Bimane. n stands for number of experiments. All the data represent mean values and error values were calculated as standard deviations.
| Mutant | FSDS/protein | n |
|---|---|---|
| K33C | 113 ± 41 | 4 |
| K33C W160F | 54 ± 41 | 3 |
| D136C | 155 ± 35 | 3 |
| D136C S93W | 52 | 2 |
| D136C D178W | 106 ± 4 | 3 |
| D136C Q101W | 85 ± 14 | 4 |
| R133C | 60 ± 4 | 4 |
| R133C Y23W | 48 | 2 |
| R133C Q101W | 60 ± 8 | 3 |
| R133C L103W | 53 ± 7 | 4 |
| V135C | 119 ± 36 | 7 |
| V135C E67Q E75Q D91N | 108.6 ± 0.6 | 3 |
| Q193C | 37 ± 3 | 3 |
| P250C | 70 ± 15 | 4 |
| P250C W160F | 70.9 ± 0.6 | 3 |
| P250C Y194F | 52.6 ± 0.4 | 3 |
| P250C Y197F | 60 ± 4 | 3 |
| P250C Y251F | 68.1 ± 0.6 | 3 |
| E243C | 113 ± 2 | 4 |
| E243C K33W | 102 ± 2 | 3 |
| E243C I201W | 118 ± 5 | 3 |
| E243C F238W | 69.7 ± 0.7 | 3 |
| E243C V242C | 16 ± 1 | 3 |
| E243C L241W | 101 ± 7 | 3 |
Additional files
-
Supplementary file 1
The supplementary file contains two tables presenting the X-ray diffraction data and analysis for the mutant Bimane-135 (Supplementary file 1A) and the distance analysis of the GLIC wild-type structures (Supplementary file 1B).
- https://doi.org/10.7554/eLife.23955.025
Download links
A two-part list of links to download the article, or parts of the article, in various formats.
Downloads (link to download the article as PDF)
Open citations (links to open the citations from this article in various online reference manager services)
Cite this article (links to download the citations from this article in formats compatible with various reference manager tools)
Identification of a pre-active conformation of a pentameric channel receptor
eLife 6:e23955.
https://doi.org/10.7554/eLife.23955


