Population structuring of multi-copy, antigen-encoding genes in Plasmodium falciparum
- Howard Hughes Medical Institute and the University of Michigan, United States
- New York University School of Medicine, United States
- Princeton University, United States
- Santa Fe Institute, United States
Figures
Figure 1

Characteristic time series demonstrating the emergence and maintenance of population structure under three levels of recombination probabilities, 0.001 (a), 0.01 (b) and 0.1 (c), while keeping all other parameters equal. Top: stacked histograms of the number of genome transmission events per year of the different circulating repertoires, each represented by a different color. All var repertoires sampled less than 50 times are pooled and plotted in grey. Bottom: The corresponding number of transmission events of each var gene per year (each gene plotted in a different color). As recombination increases, population turnover is more rapid, still showing well-defined population structure. Although dominant genome identities may change in time, the level of transmission per gene is relatively constant and hardly influenced by turnovers on the strain population level. The relative fraction of short-lived genomes increases with recombination (grey area), and although the total number of transmission events per year is not influenced by recombination rate, cases of transmission of de-novo genomes is higher for higher levels of recombination. Parameters: b = 18, G = 30, g = 6, α = 15, H = 10,000, ω = 0.0005, τ = 1.
Figure 2
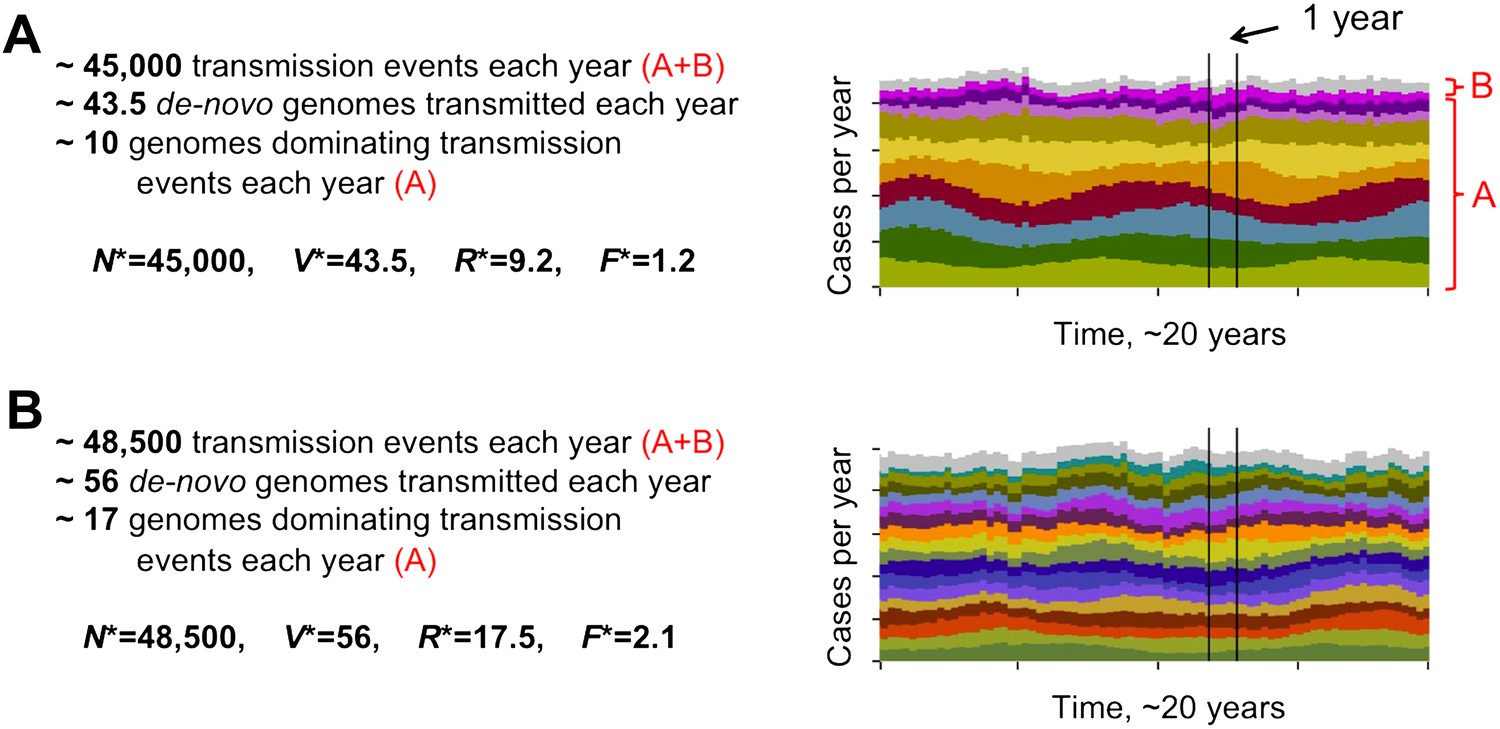
Different degrees of distinct var repertoire overlap with transmission intensity. The number of genome transmission events per year for the different circulating repertoires are represented by different colors as stacked histograms similar to those of Figure 1. Emerging populations are typically characterized for low transmission intensities (A), by a low number of dominating genomes with a low level of antigenic overlap (R* = 9.2, F* = 1.2, see ‘Materials and methods’); and for high transmission intensities (B), by higher diversity and higher antigenic similarity (R* = 17.5, F* = 2.1). The fraction of long-lived genomes dominating transmission events is labeled by A in both figures, and the fraction of short-lived genomes, by B (these are grouped into one single number and plotted in gray). Parameters: b = 8.5 and b = 9.5, G = 50, g = 6, α = 15, H = 20,000, ω = 0.0005, ρ=0.01, τ = 1, κ = 1 year.
Figure 3
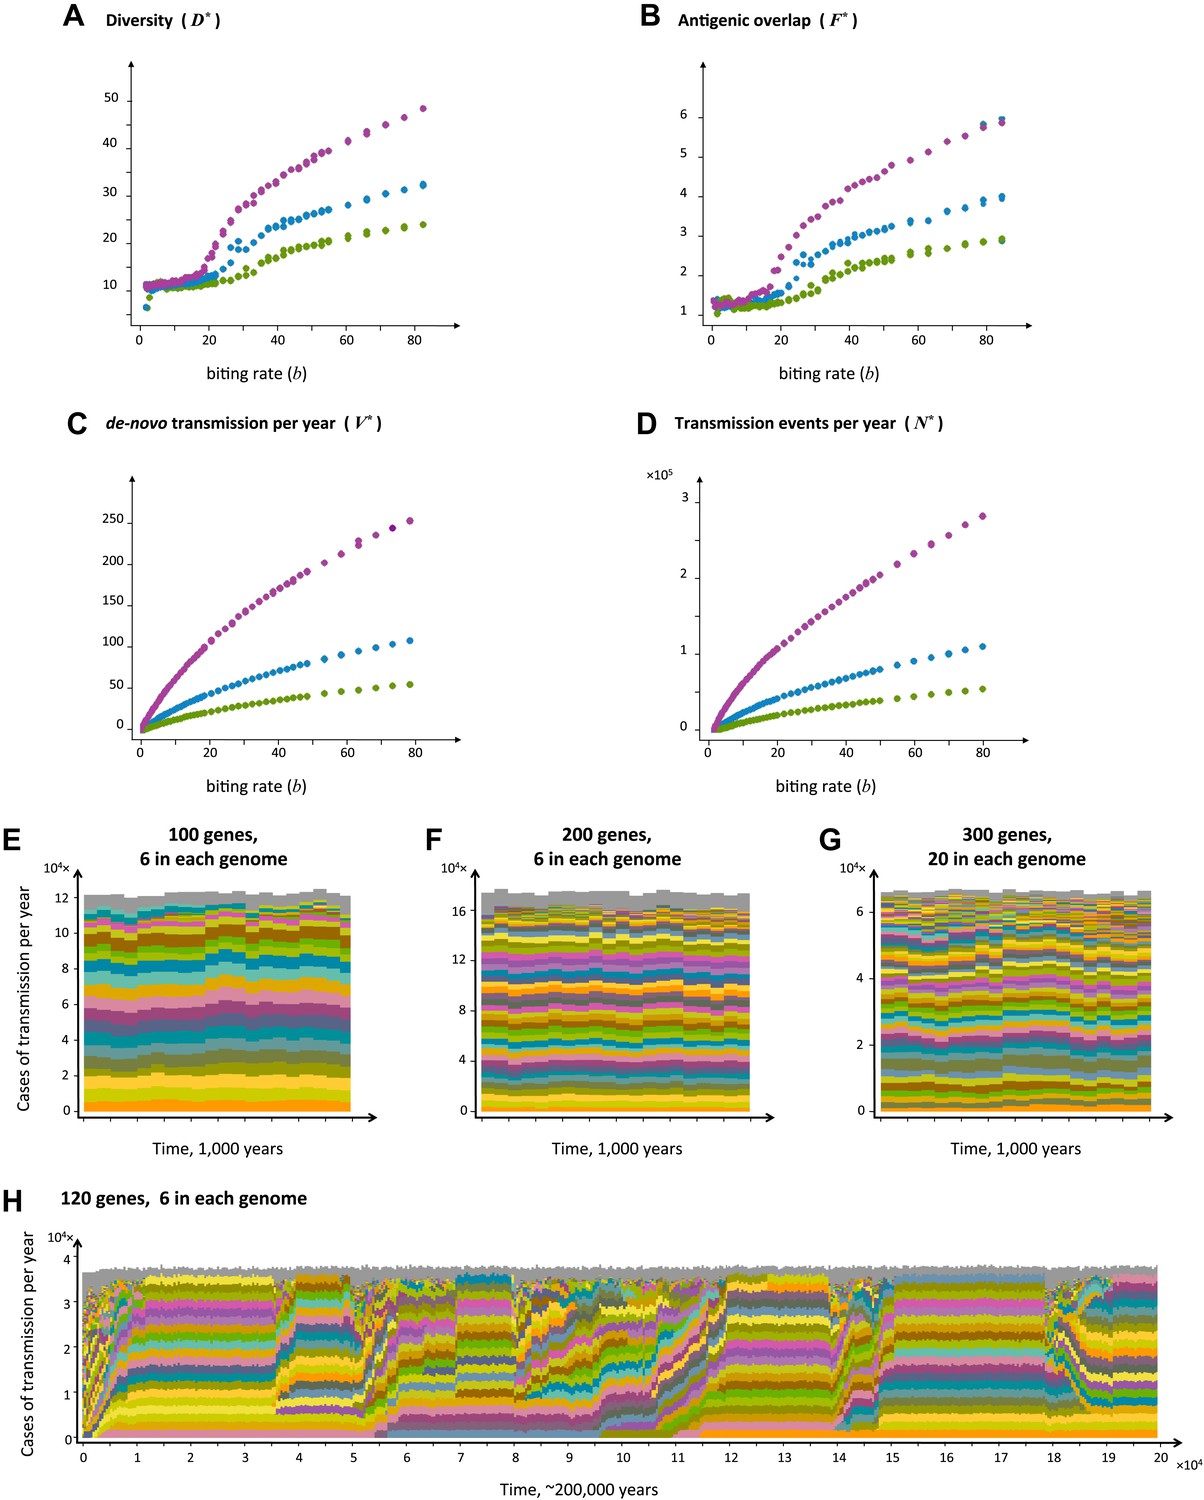
Top four panels: the metrics characterizing population structure for three host population sizes as a function of transmission intensity (see ‘Materials and methods’). Green, blue and purple represent H = 5,000, H = 10,000, and H = 25,000, respectively. (A) A measure of diversity capturing the number of dominating genomes (R*, in the y-axis) as a function of b, (B), a measure of average antigenic similarity between genomes (F*, in the y-axis) as a function of b, (C) the average number of novel repertoires generated and successfully transmitted each year, and (D) the total number of successful transmission events each year. As transmission intensity increases, the number of dominating genomes increases, and in accordance, the degree of antigenic similarity increases as well—however the number of distinct repertoires that are maintained in the system at epidemiologically relevant frequencies remains extremely low relative to the total number of distinct repertoires that can be crated through recombination. Note the differences in magnitude; while the number of de novo repertoires entering the system is 10-fold higher then the observed diversity, the number of successful transmission events that these dominating repertoires are involved in is on the order of 106. For extremely low biting rates, in a narrow window of parameter values, diversity decreases abruptly (A). This reflects a different dynamic regime in which dominant strains replace each other in a fluctuating manner and population structure does not apply. Parameters: G = 50, g = 6, α = 15, ω = 0.0005, ρ=0.05, τ = 1, κ = 1 year. Bottom four panels: characteristic time series demonstrating structured parasite populations for larger gene pools (G) and longer sequence lengths (g): (A) b = 18, G = 100, g = 6, α = 15, N = 20,000, ω = 0.0005, ρ=0.001, τ = 1. (B) b = 18, G = 200, g = 6, α = 15, H = 20,000, ω = 0.0005, ρ=0.001, τ = 1. (C) b = 18, G = 300, g = 20, α = 15, H = 20,000, ω = 0.0005, ρ=0.001, τ = 1. (D) b = 12, G = 120, g = 6, α = 15, H = 10,000, ω = 0.0005, ρ=0.005, τ = 1, κ = 1 year.
Figure 4
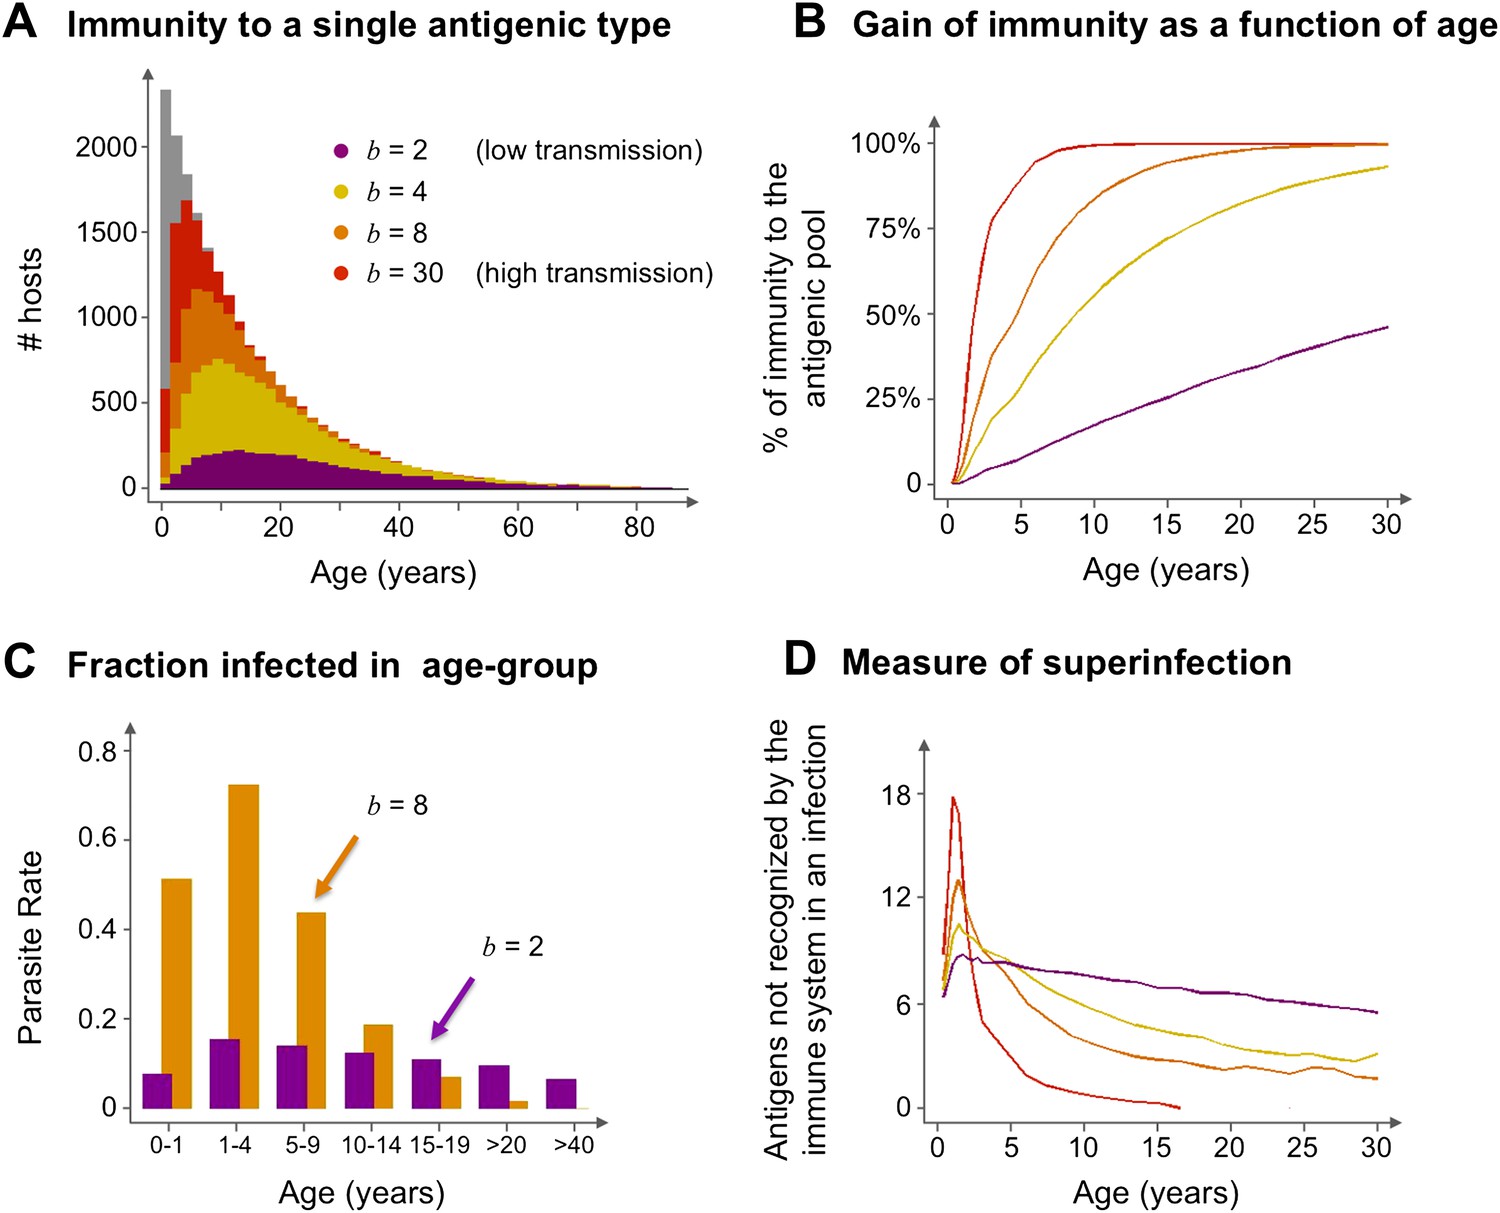
Age profiles of immunity and infection: (A) In color are the number of hosts immune to a single arbitrary antigen in different age classes superimposed over a histogram representing the entire age distribution of hosts (in gray). The level of immunity in each class is shown for four different transmission intensities (b = 2, 4, 8 and 30, where b is the average number of biting events per host per year). (B) The average level of immunity to the general antigenic pool as a function of age. It can be seen in (A) and (B), that at higher levels of transmission intensity, exposure to the diversity of antigenic types typically shifts towards the younger age classes, and hosts gain high levels of immunity to a majority of the variants earlier on in life. (C) A measure of parasite rate demonstrated by the fraction of infected hosts in different age groups (see also Gupta and Day, 1994b) for 2 transmission intensities (b = 2 and 8). (D) A measure of superinfection demonstrated by the average number of antigens an infected host is naïve in each age class. Under high-transmission regimes, we characteristically observe high levels of superinfection (i.e., relatively long durations of infection) and high parasite rates in the very young age classes, after which immunity is rapidly gained to most of the antigenic variants circulating in the population. In contrast, host populations in regimes of very low transmission, characteristically exhibit similar levels of parasite rates in all age groups, and immunity is gradually gained throughout life, with infection spanning all age classes. Parameters: G = 40, g = 6, α = 15, H = 20,000, ω = 0.0005, ρ=0.01, τ = 1, κ = 1 year. Transmission events were sampled at a frequency of 1:100, and the host population was sampled every 10 years at a ratio of 1:100.
Figure 5
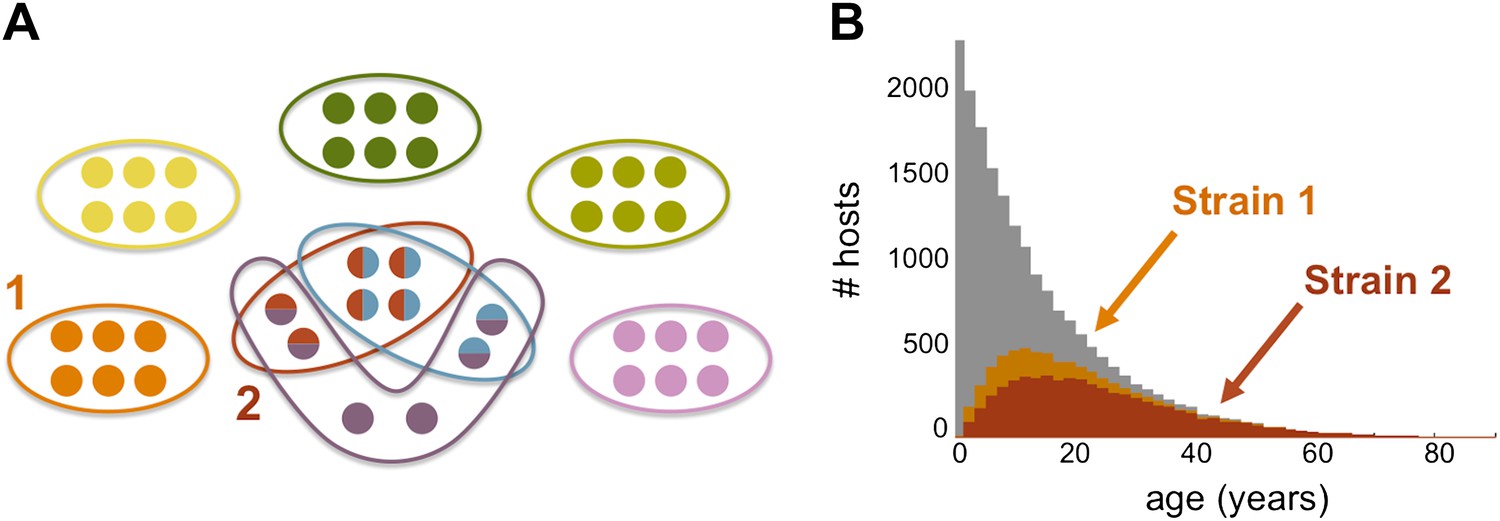
Strain specific immunity and transcending immunity. (A) Diagram demonstrating the partition of 40 genes from the general pool (represented by circles) between 8 dominating strains (each marked with a unique color, and composed of a subset of 6 genes). Five of these strains are antigenically unique as they have no overlap with any of the other strains, two of these strains share all of their genes with other strains (red and light blue), and one of the strains has a partially unique antigenic profile sharing 66% of its genes with other strains (purple). (B) The number of hosts immune to strains 1 and 2 (orange and red, respectively) for each age class superimposed over the host age distribution (grey). Immunity to strain 1 is strain specific and only gained through exposure to this particular strain due to the uniqueness of its antigenic profile. By contrast, immunity to strain 2 is strain ‘transcending’ and acquired also by exposure to other strains with which it shares genes. It follows that hosts are exposed to strain 1 at a higher level and at younger ages, than those for strain 2. Parameters: b = 3, G = 40, g = 6, α = 15, H = 20,000, ω = 0.0005, ρ=0.01, τ = 1, κ = 1 year.
Figure 6
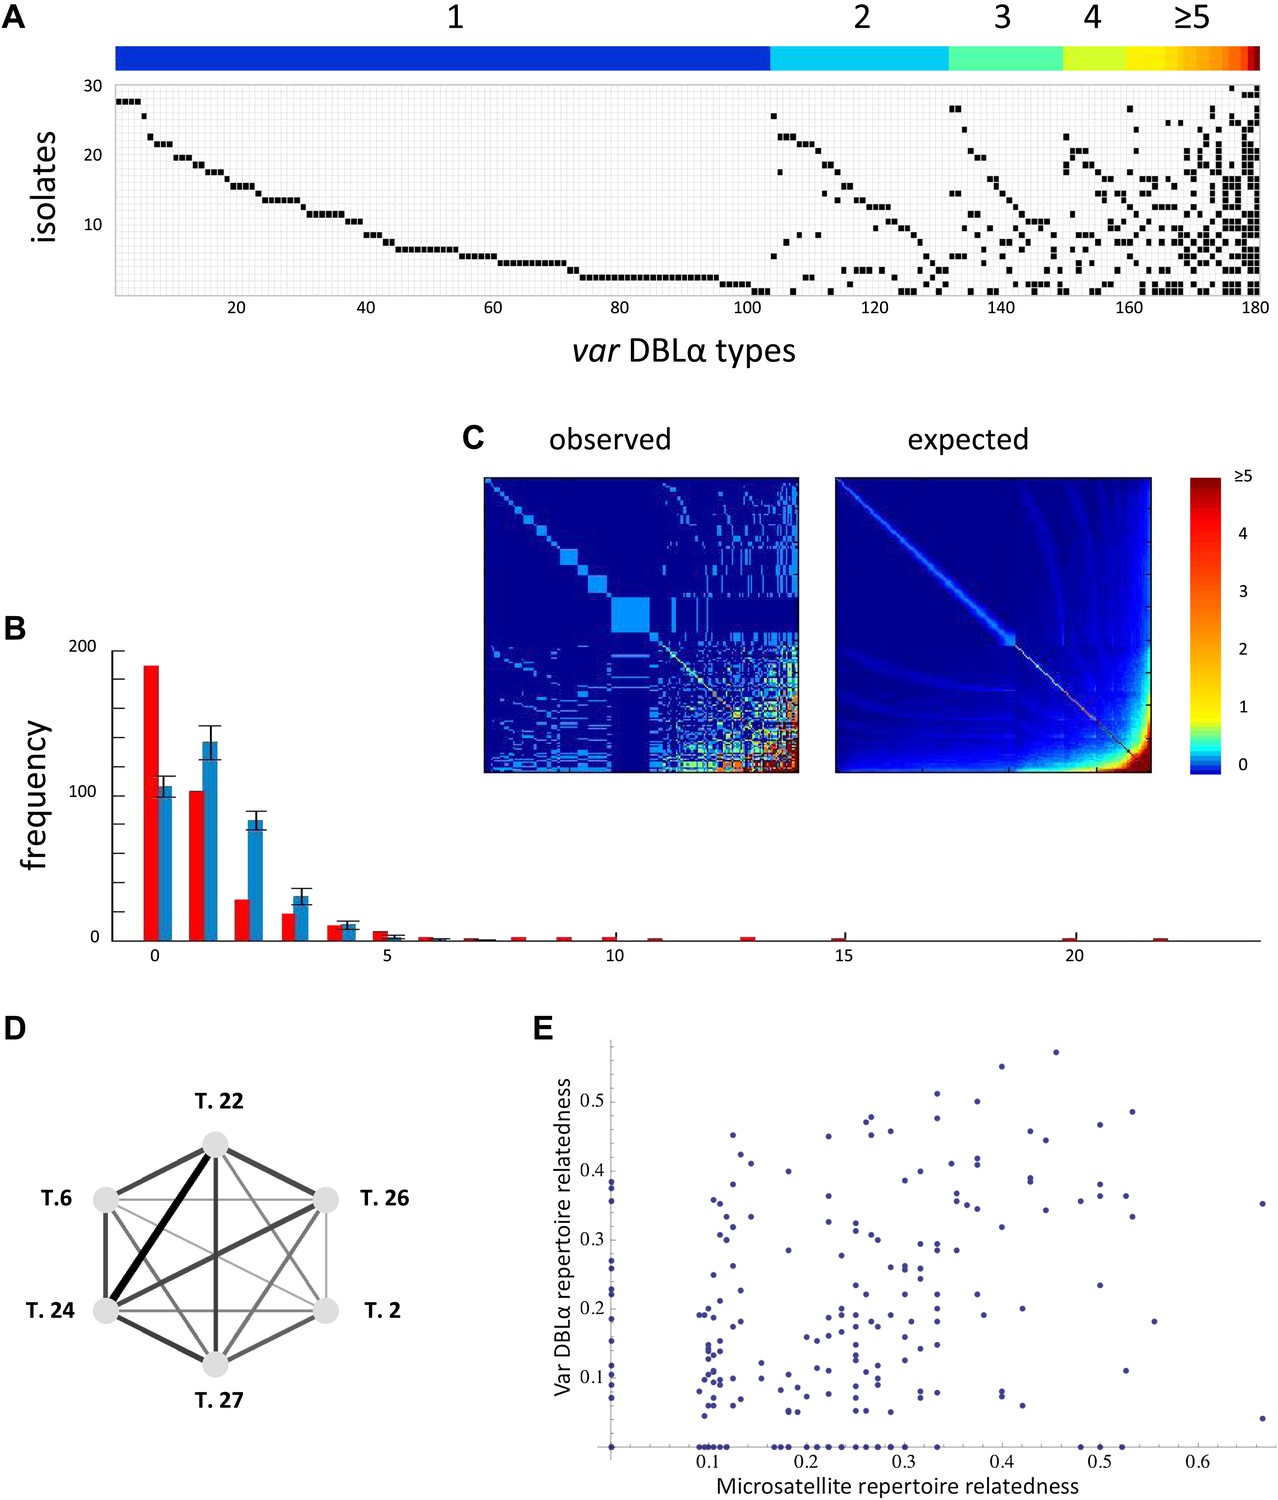
Nonrandom organization of var DBLα types between 30 sampled parasite isolates from Amele, Papua New Guinea as published in (Chen et al., 2011). (A) Presence–absence matrix showing the distribution of var types in isolates: Each row corresponds to an individual parasite isolate and each column to a distinct var type. The color bar indicates the number of distinct isolates each var type was identified in. (B) The frequency distribution of the number of isolates in which each var type was identified, obtained by assuming a total var richness of ∼369, as estimated in (Chen et al., 2011). The observed distribution for the data (red) and the expected distribution when assuming all var types circulate at equal frequencies (blue) were found to be significantly different (pv<0.0001 using a K–S two sample test). Note the enrichment for both very rare and very common var types in the data. (C) Observed and expected co-occurrence of var DBLα types. In each matrix cell (i,j) is the number of times var types i and j were found in the same isolate. The co-occurrence of var types found in multiple isolates is significantly higher than for the null expectation under the assumption of linkage equilibrium among all var types (pv<0.01) (Artzy-Randrup and Stone, 2005) (the expected co-occurrence matrix conserves both the observed number of var types in each isolate and the observed frequency distribution of different var types (Chen et al., 2011)). (D) A network of allele pairs with both high D and r. The D values are among the highest pair-wise comparisons in the dataset (using a cutoff of D > 0.0748), and the r values range from 1 to 0.58, and are reflected by the weight of the edges. Based on sequence features (Bull et al., 2007), and the fact that genomic organization of var sequence groups appear to be conserved across globally distributed isolates (Kyes et al., 2007), it is very unlikely that var type 22 (being UpsA-like) is physically linked to the other alleles in the network (since they are all UpsB/UpsC-like). (E) The relatedness of the var DBLα repertoires of an isolate pair as a function of the relatedness of their microsatellite repertoires. Relatedness is defined as the number of var types shared between the two isolates, divided by the average number of var types identified per isolate for that pair of isolates.
Figure 7
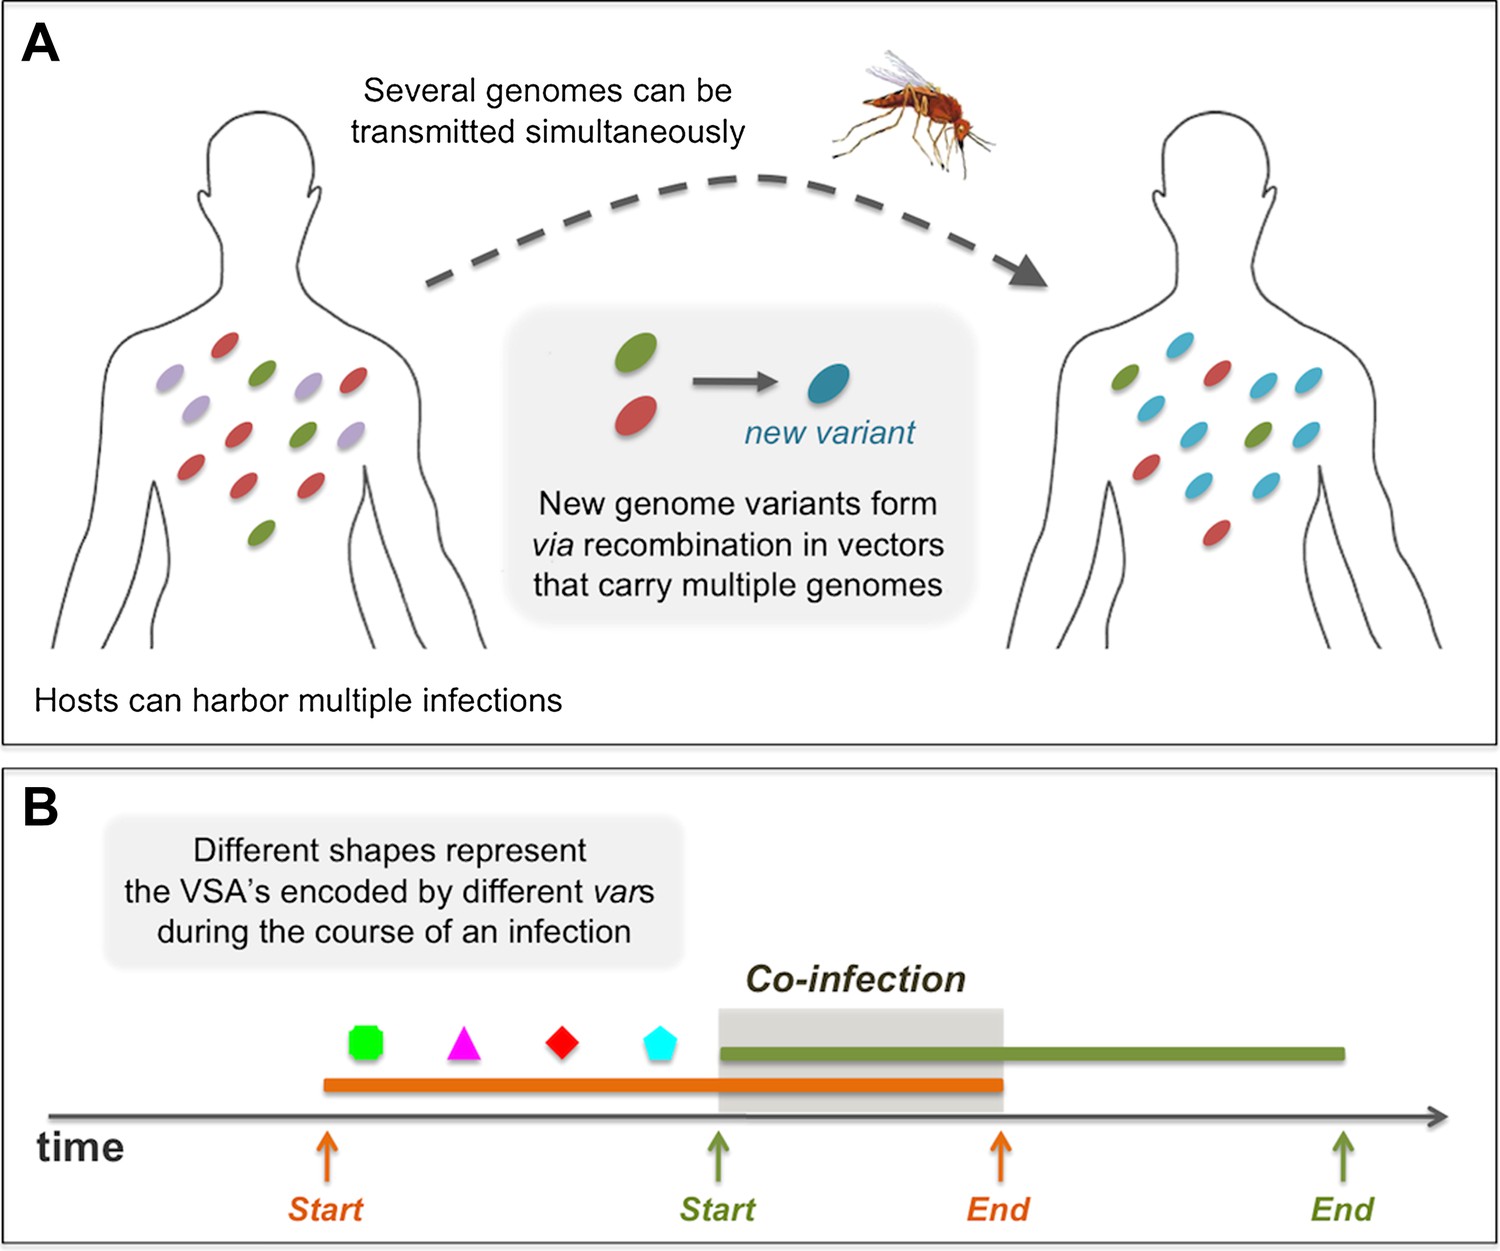
Diagrams showing processes that take place during the course of a simulation: (A) in a biting event, there is likeliness that multiple parasite genomes will be transmitted simultaneously. In these events, at probability ρ, the genomes recombine to create new parasite genome variants, which then infect the receiving host. (B) A sketch of the rules governing the dynamics of infection and co-infection. By sequentially expressing different var genes during the course of an infection, host immunity is gradually gained to the PfEMP1 variants (VSA's) associated with the infecting parasite genome. When the host is exposed to an additional genome, this parasite begins expressing its var genes sequentially, as it would, had it been infecting the host on its own. Transmissibility of each of the infecting parasites during such periods of co-infection decreases according to the multiplicity of infection at the time.
Download links
A two-part list of links to download the article, or parts of the article, in various formats.
Downloads (link to download the article as PDF)
Open citations (links to open the citations from this article in various online reference manager services)
Cite this article (links to download the citations from this article in formats compatible with various reference manager tools)
Population structuring of multi-copy, antigen-encoding genes in Plasmodium falciparum
eLife 1:e00093.
https://doi.org/10.7554/eLife.00093


