Mitotic spindle scaling during Xenopus development by kif2a and importin α
- University of California, Berkeley, United States
Figures
Figure 1 with 1 supplement
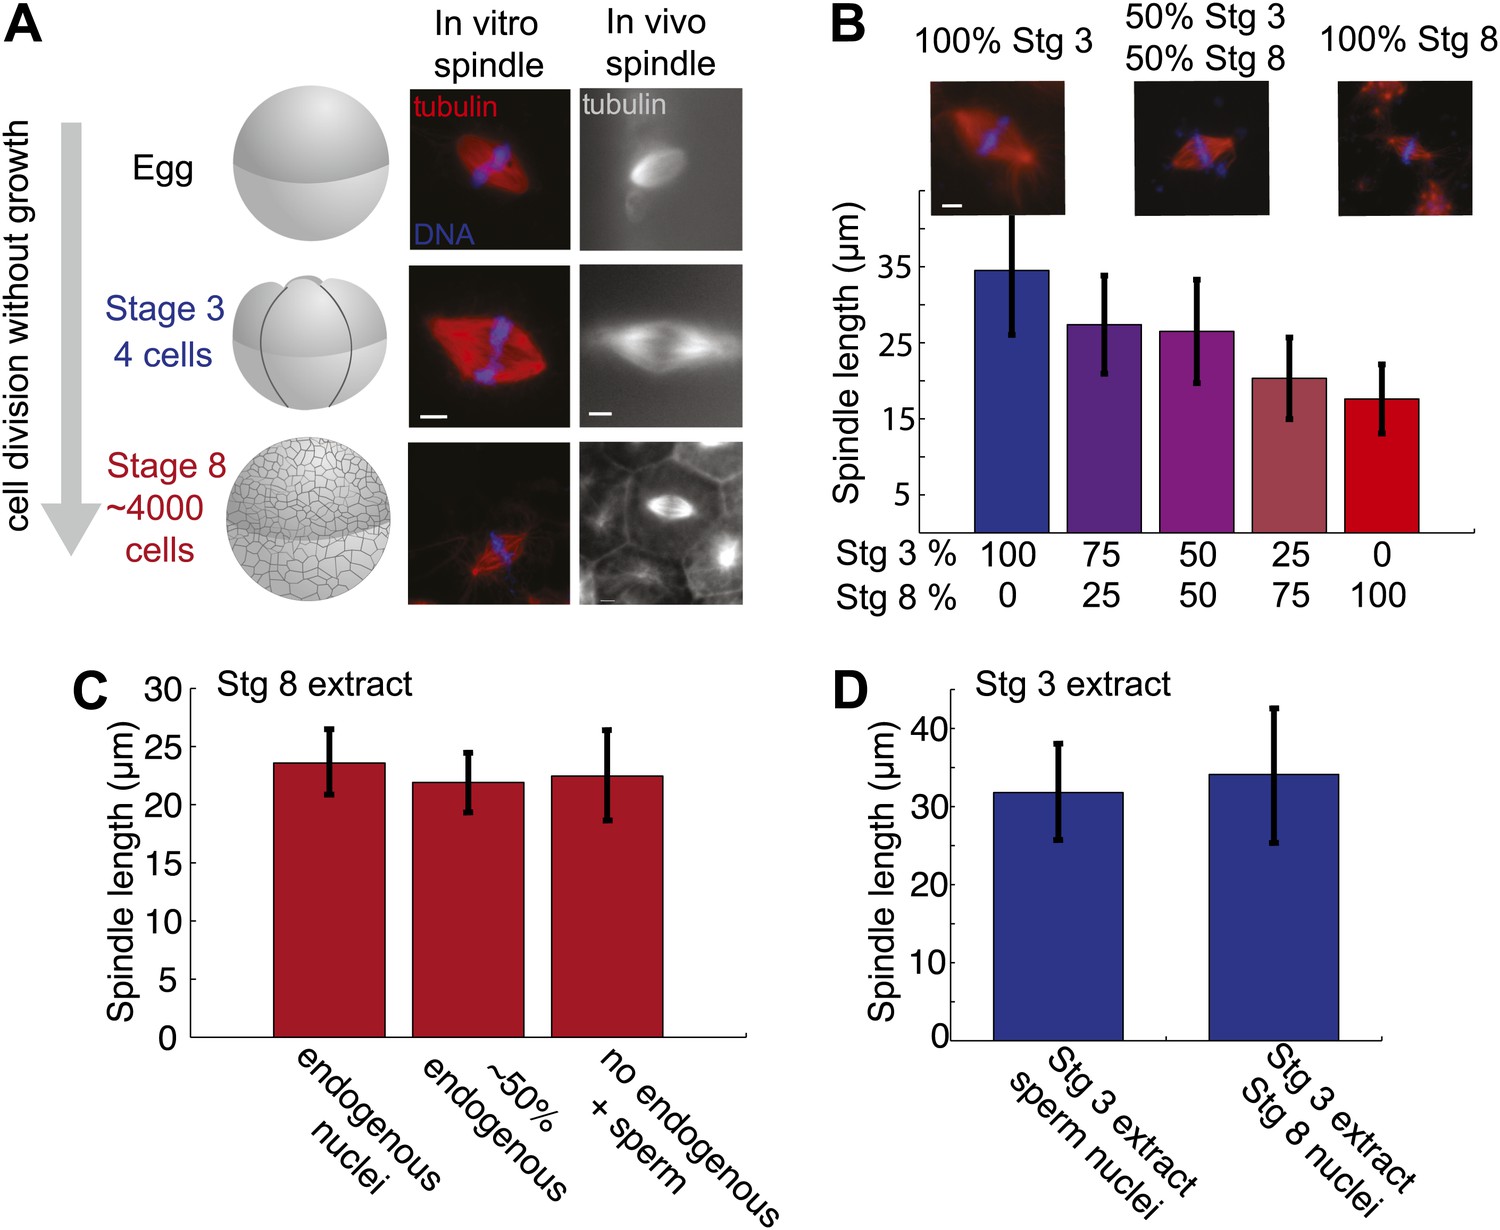
Embryo extracts recapitulate spindle scaling during development.
(A) Schematic of early embryonic developmental stages of Xenopus laevis used in this study and representative images of spindles formed in egg and embryo extracts and in fixed hemisected eggs or embryos. Tubulin fluorescence is red or gray and DNA is blue. (B) Length analysis of spindles in individual or mixed embryo extracts. Fixed spindles were centrifuged onto coverslips and pole-to-pole length was measured from 49 to 230 spindles in each condition sampled from three independent experiments. Mean ± SD, p<0.0001 by Kruskal–Wallis test. Representative images are shown for mixtures as indicated. The scale bars represent 10 µm. (C) Spindles from unfractionated stage 8 extract, stage 8 extract centrifuged at 3000×g for 10 min to remove nuclei or stage 8 extract filtered through a 1-µm filter with added demembranated sperm nuclei were sedimented onto coverslips, and pole-to-pole length was measured. Mean ± SD, n ≥ 29 spindles per condition. Differences were not considered statistically significant by an unpaired t-test. (D) Spindles were generated in stage 3 extract with nuclei purified from stage 8 extract. Spindles were processed and analyzed as above. Mean ± SD, n ≥ 40 spindles from two extracts. Differences were not statistically significant by an unpaired t-test.
Figure 1—figure supplement 1
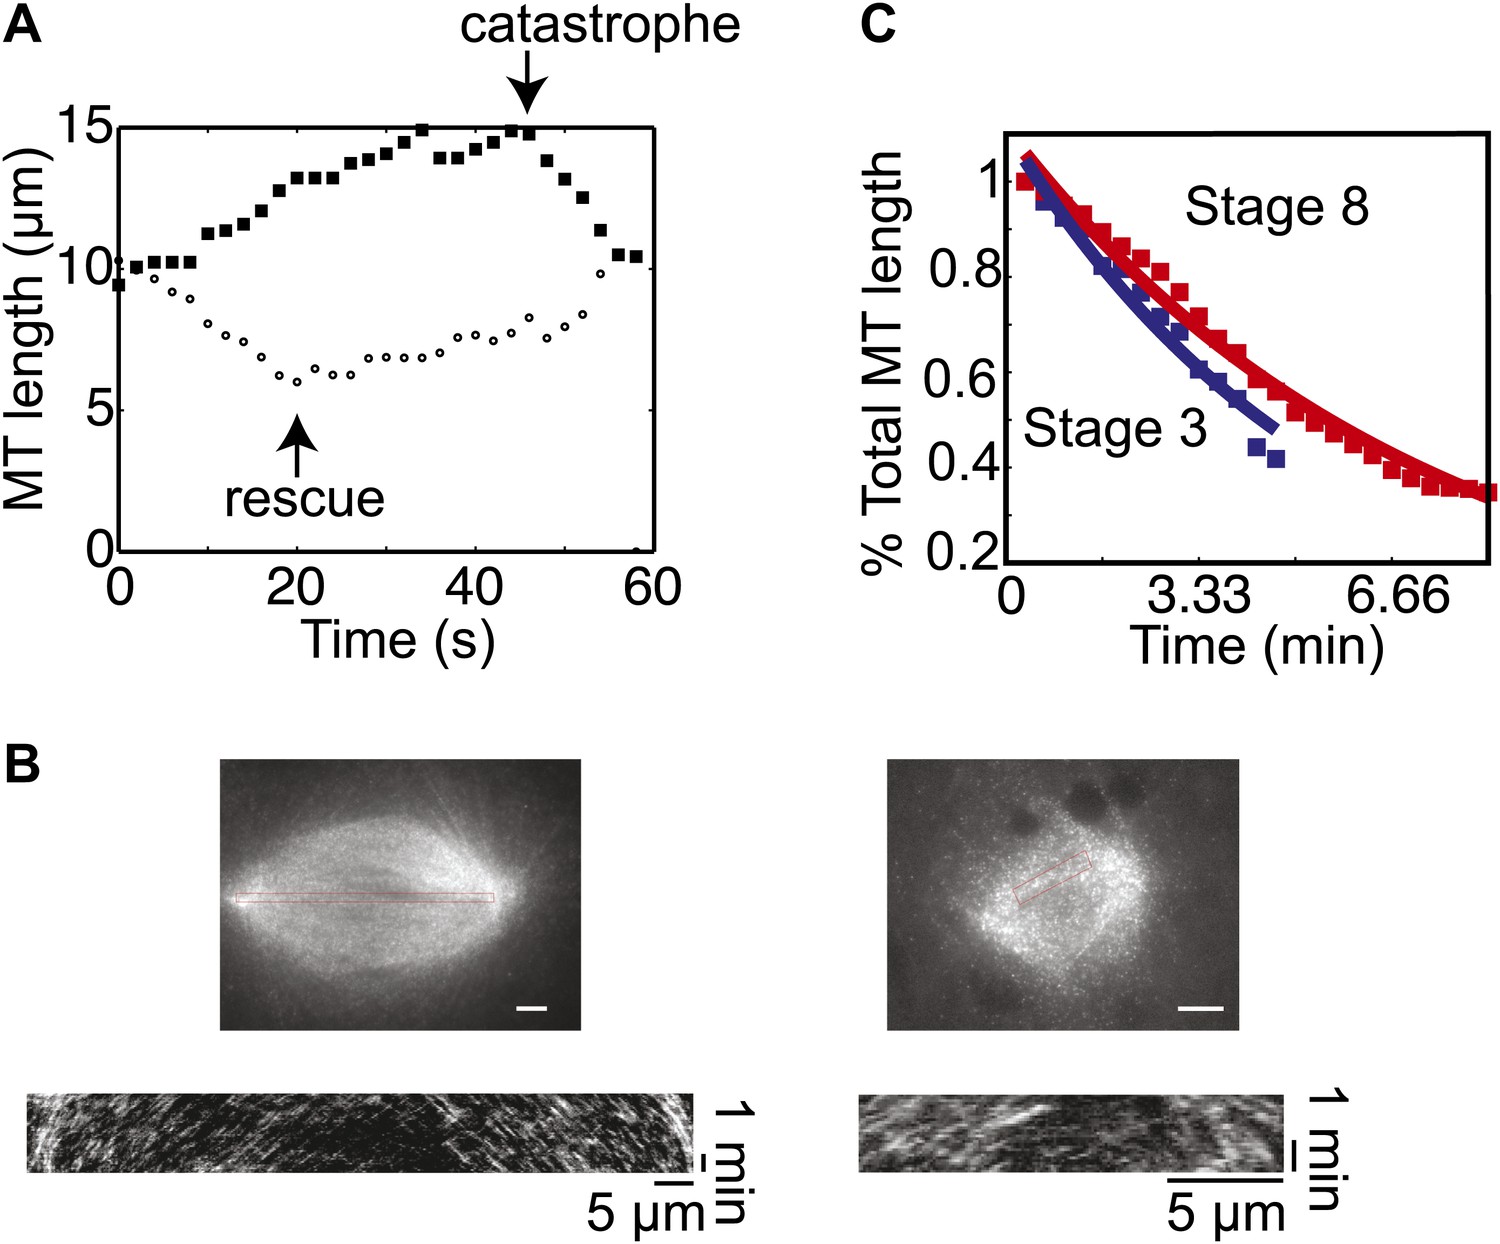
MT flux and severing are similar in embryo extracts.
(A) Examples of MT length data used to calculate the dynamics of centrosome-nucleated MTs. One MT catastrophes during the time course and starts to shrink while a different MT is shrinking and undergoes rescue. (B) Examples of fluorescent speckle analysis of stage 3 and stage 8 spindles. Sparse labeling of MTs with rhodamine tubulin permitted tracking of individual speckles as they moved toward spindle poles. Kymograph analysis allowed quantification of flux rates within the spindles. Data are included in Table 1. (C) MT severing activity was measured and analyzed as in Loughlin et al. (2011) with no significant difference between stage 3 and stage 8. Data are representative of two extracts at each stage.
Figure 2
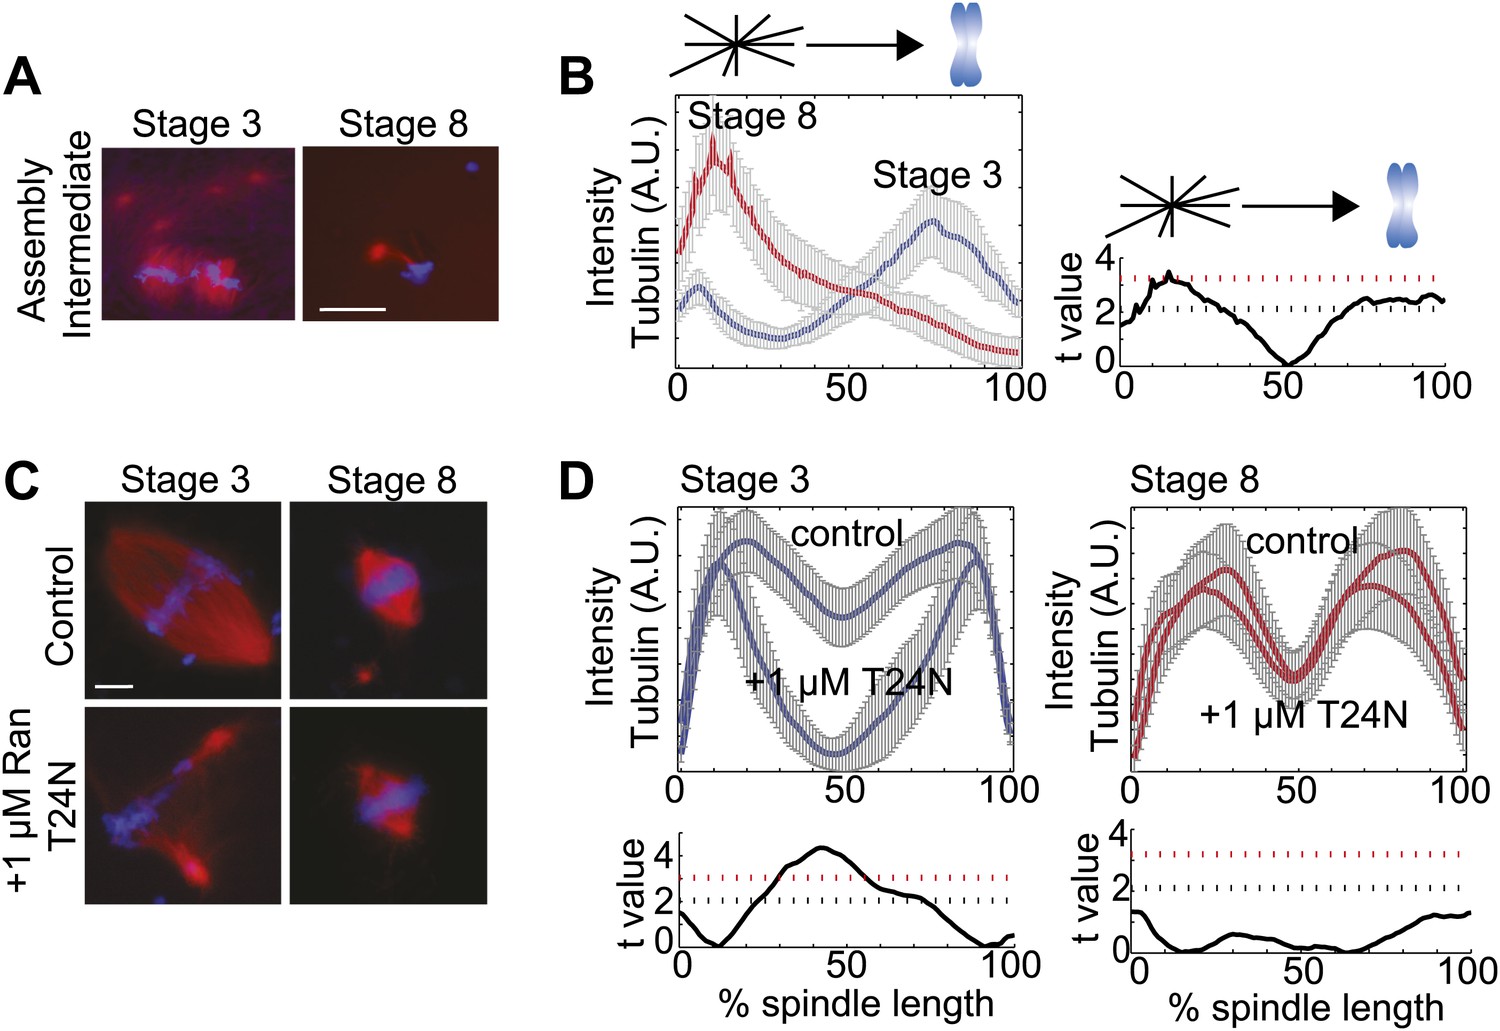
Spindle assembly pathways change during development.
(A) Spindle assembly intermediates 15 min after initiation exhibit different morphologies in stage 3 and stage 8 extracts. (B) Left panel: Line scan quantification of tubulin intensity in spindle intermediates starting at the centrosome and ending at chromatin with normalized lengths for statistical analysis. Right panel: t-test statistical analysis across discrete length bins of stage 3 and stage 8 intensities as described in the experimental procedures. Black dashed line is equivalent to a p value of 0.01 and red dashed line is equivalent to a p value of 0.001. (C) Inhibition of the RanGTP gradient by addition of 1 µM RanT24N disrupts steady-state spindles in stage 3 but not stage 8 extracts. (D) Upper panels: Line scan quantification of tubulin intensity with normalized spindle lengths for statistical analysis. Lower panels: t-test statistical analysis across discrete length bins of control vs 1 µM RanT24N addition as described in the experimental procedures. Black dashed line is equivalent to a p value of 0.01 and red dashed line is equivalent to a p value of 0.001. Mean ± SE from three extracts, tubulin is red and DNA is blue. The scale bars represent 10 µm.
Figure 3 with 1 supplement
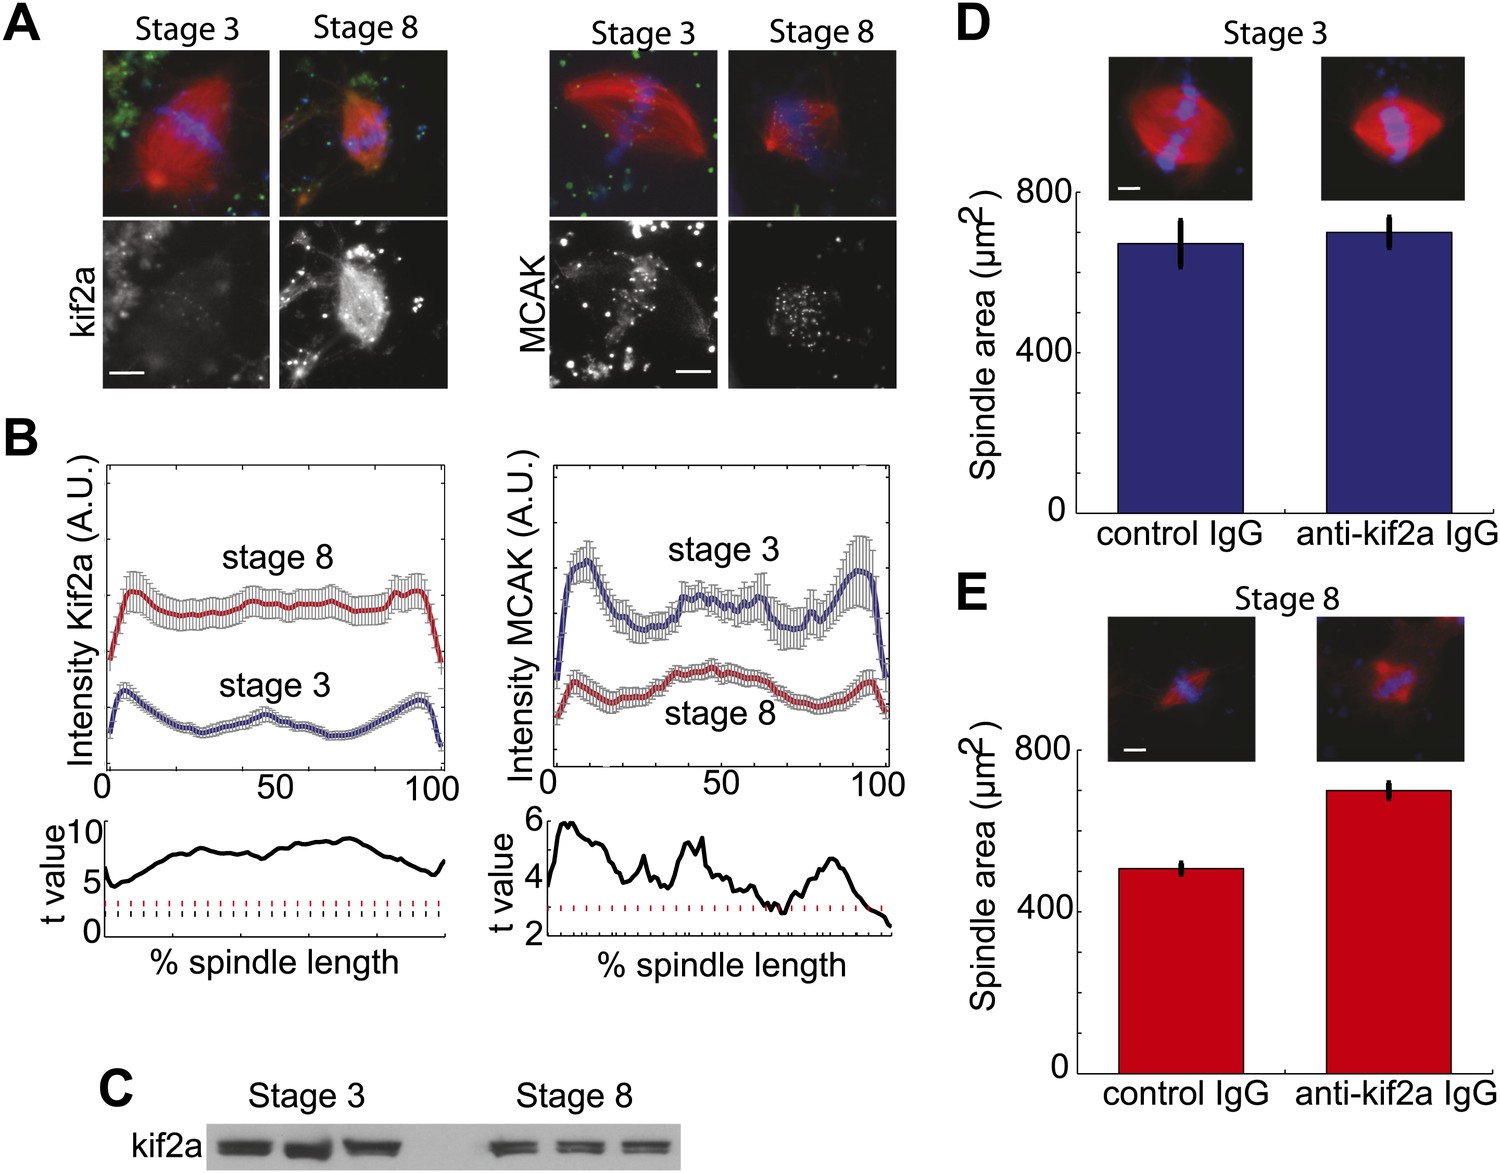
Stage 8 extract spindles recruit kif2a.
(A) Kinesin-13s Kif2a and MCAK detected in stage 3 and stage 8 extract spindles. Top panels show microtubules (MTs) (red), chromatin (blue), and either Kif2a or MCAK as indicated (green). Bottom panels show just Kif2a or MCAK immunofluorescence within the spindle. (B) Upper panels: Line scan quantification of immunofluorescence intensity with normalized spindle lengths for statistical analysis. Lower panels: t-test analysis in each length bin. Black dashed line is equivalent to a p value of 0.01 and red dashed line is equivalent to a p value of 0.001. Mean ± SE from three extracts. (C) Immunoblot from three extracts each of stage 3 and stage 8 Kif2a indicate average levels of kif2a in each extract. (D) and (E) Inhibition of kif2a with 5 µg/ml inhibitory anti-kif2a antibody in stage 3, p=0.668 by unpaired t-test (D) and stage 8 p<0.0001 by unpaired t-test (E). Representative images are show for each condition. Mean ± SE, n ≥ 65 spindles from three extracts for each condition.
Figure 3—figure supplement 1
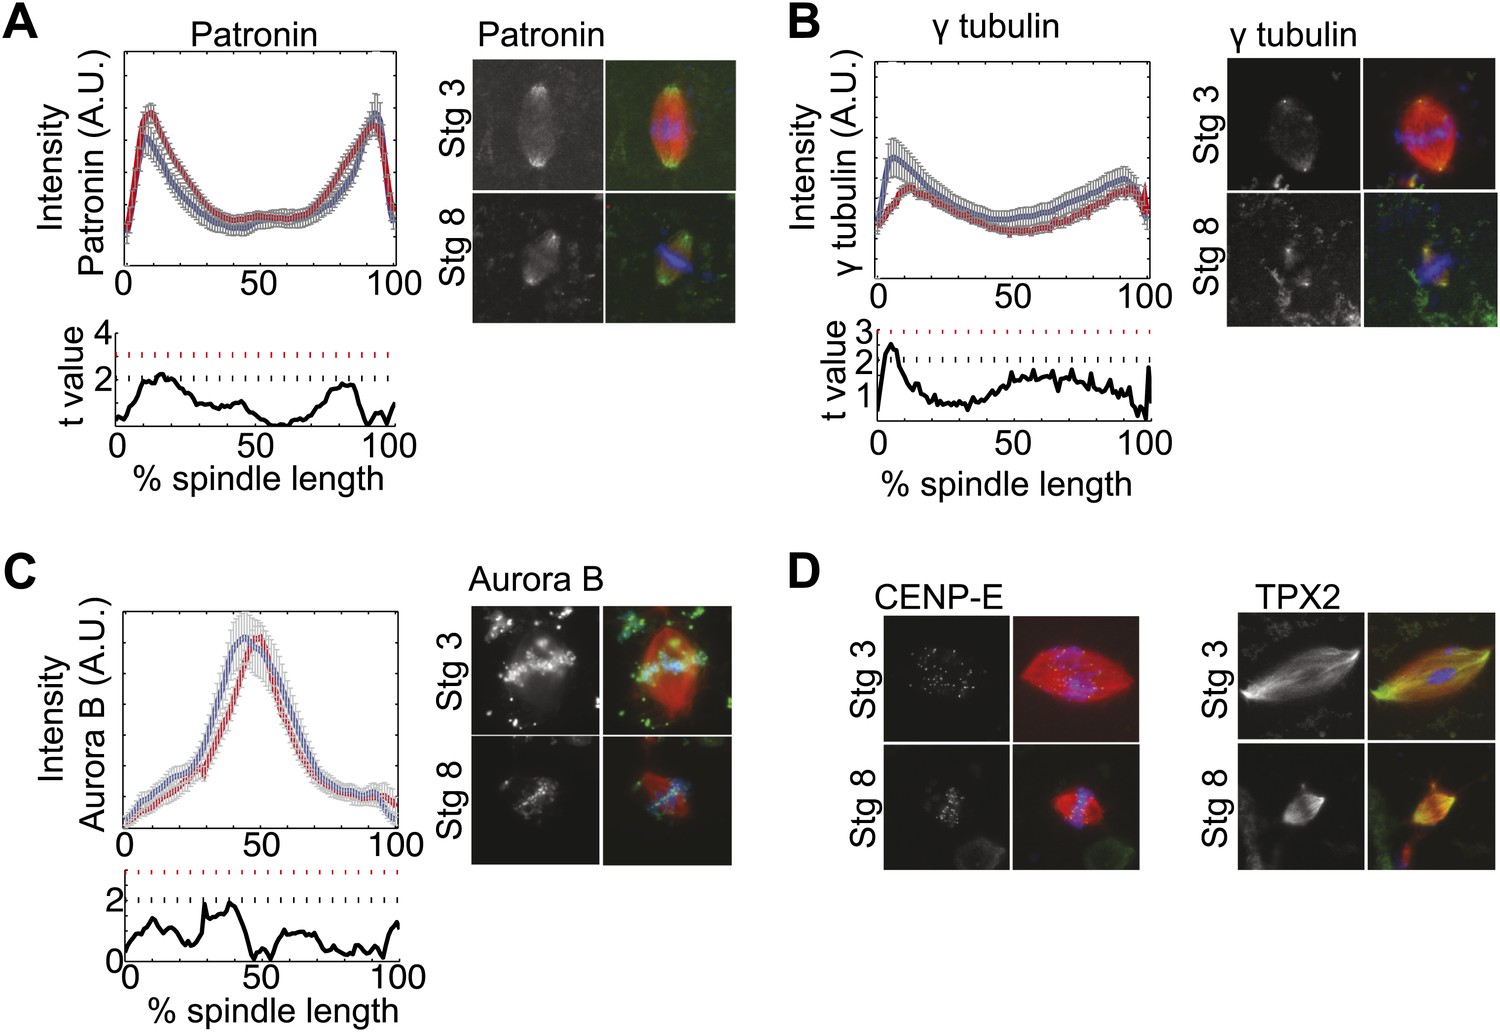
Fluorescence intensity analysis of MT dynamics modulators.
(A), (B), and (C) Upper panels: Line scan quantification of patronin (A), gamma tubulin (B), and aurora B (C) fluorescence intensity with normalized spindle lengths for statistical analysis, blue line is stage 3 and red line is stage 8. Lower panels: t-test statistical analysis across discrete length bins as described in the experimental procedures. These modulators of MT dynamics show little to no difference in intensities. Black dashed line is equivalent to a p value of 0.01 and red dashed line is equivalent to a p value of 0.001. Mean ± SE from three extracts. (D) Immunofluorescence localization of CENP-E and TPX2 appear similar in stage 3 and stage 8 embryo extract spindles.
Figure 4 with 3 supplements
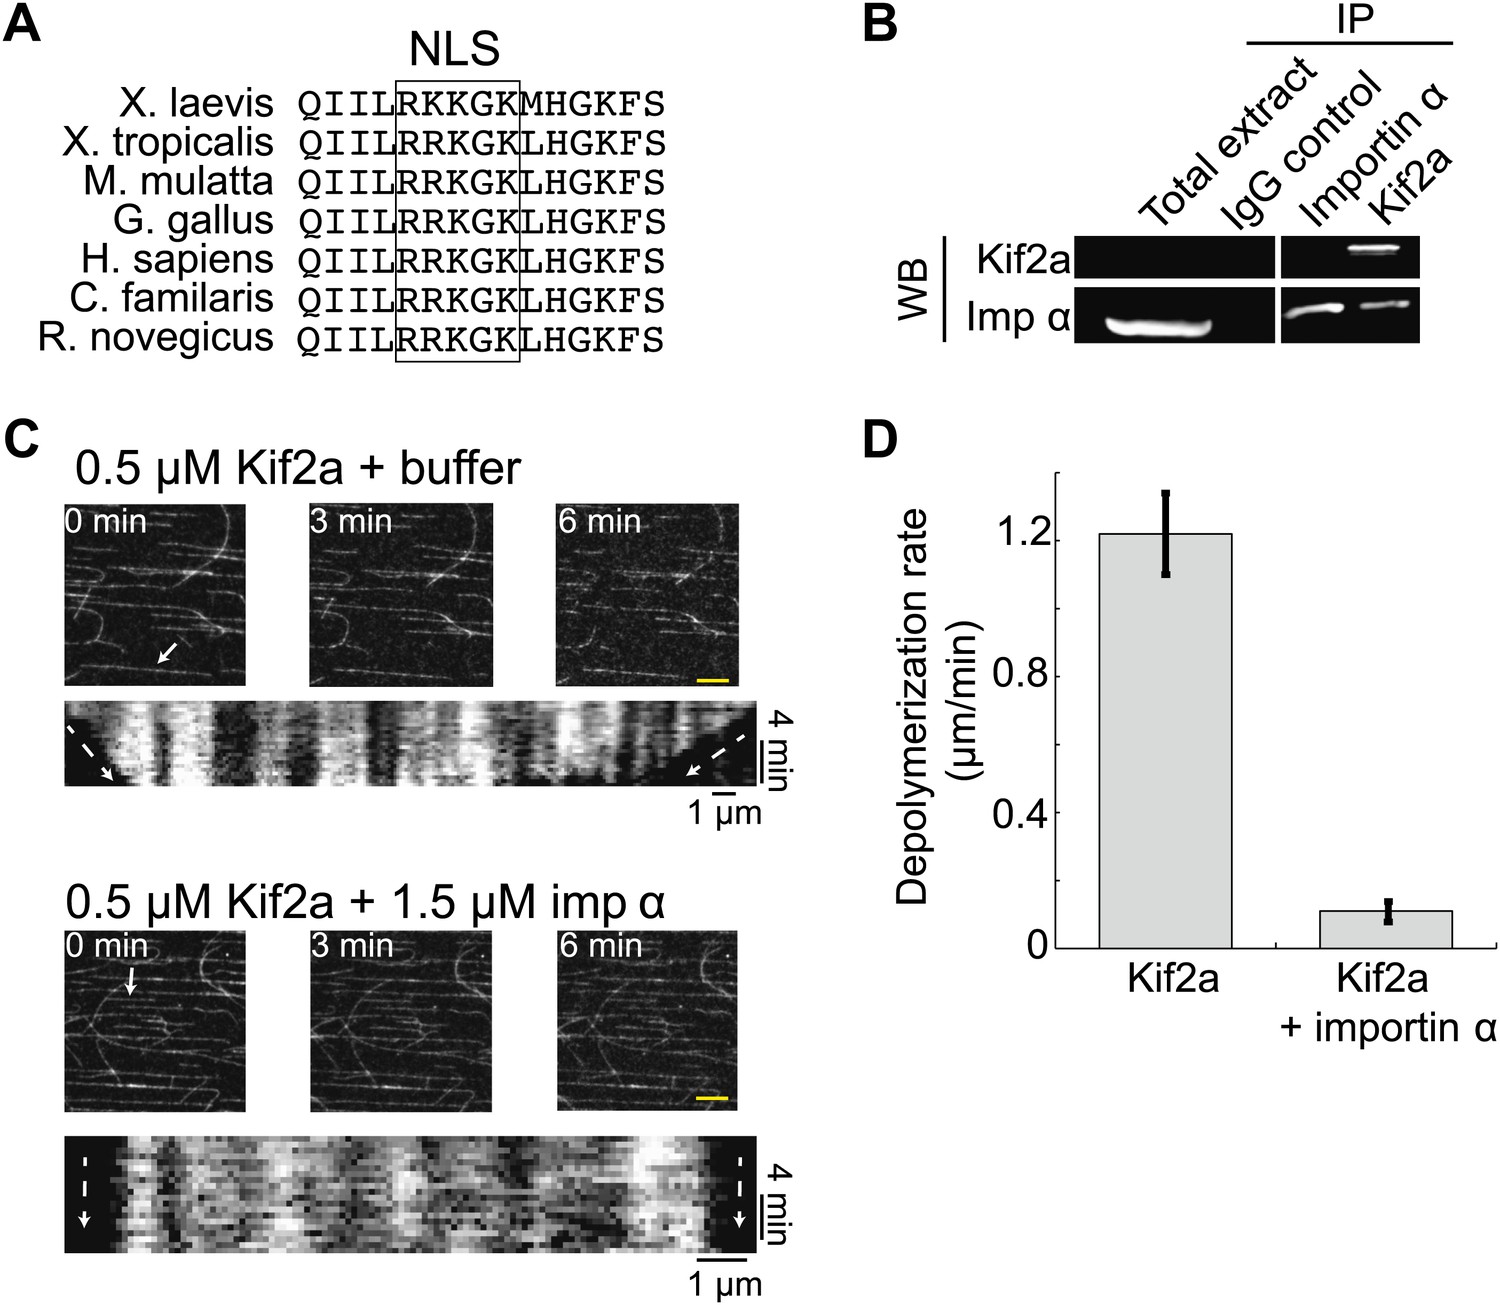
Kif2a is regulated by importin α.
(A) Sequence alignment of region surrounding the nuclear localization signal (NLS) identified using PredictNLS program. The boxed NLS sequence is conserved within these species. (B) Immunoprecipitation with antibodies specific for kif2a, importin α, or control IgG from egg extract indicates an interaction between kif2a and importin α that maybe subject to strong competition by other cargos. Immunoblot with the indicated antibodies detect components of the immunoprecipitation. (C) Time-lapse images and kymographs from a flow cell depolymerization assay using taxol-stabilized MTs and purified full-length kif2a or kif2a plus purified importin α. Kymographs are derived from individual MTs indicated in the time 0 frame by white arrows. The scale bar represents 5 µm in time-lapse frames. (D) Quantification of the in vitro depolymerization rate of kif2a with and without importin α. Mean ± SE, n ≥ 20 MTs from two independent experiments, p<0.0001 by unpaired t-test.
Figure 4—figure supplement 1

Kif2a is regulated by importin immunofluorescence detection of recombinant MBP or MBP fused to the motor domain of kif2a added at 250 nM to interphase egg extracts, showing kif2a nuclear import that is lost upon mutation of the NLS.
https://doi.org/10.7554/eLife.00290.012
Figure 4—figure supplement 2
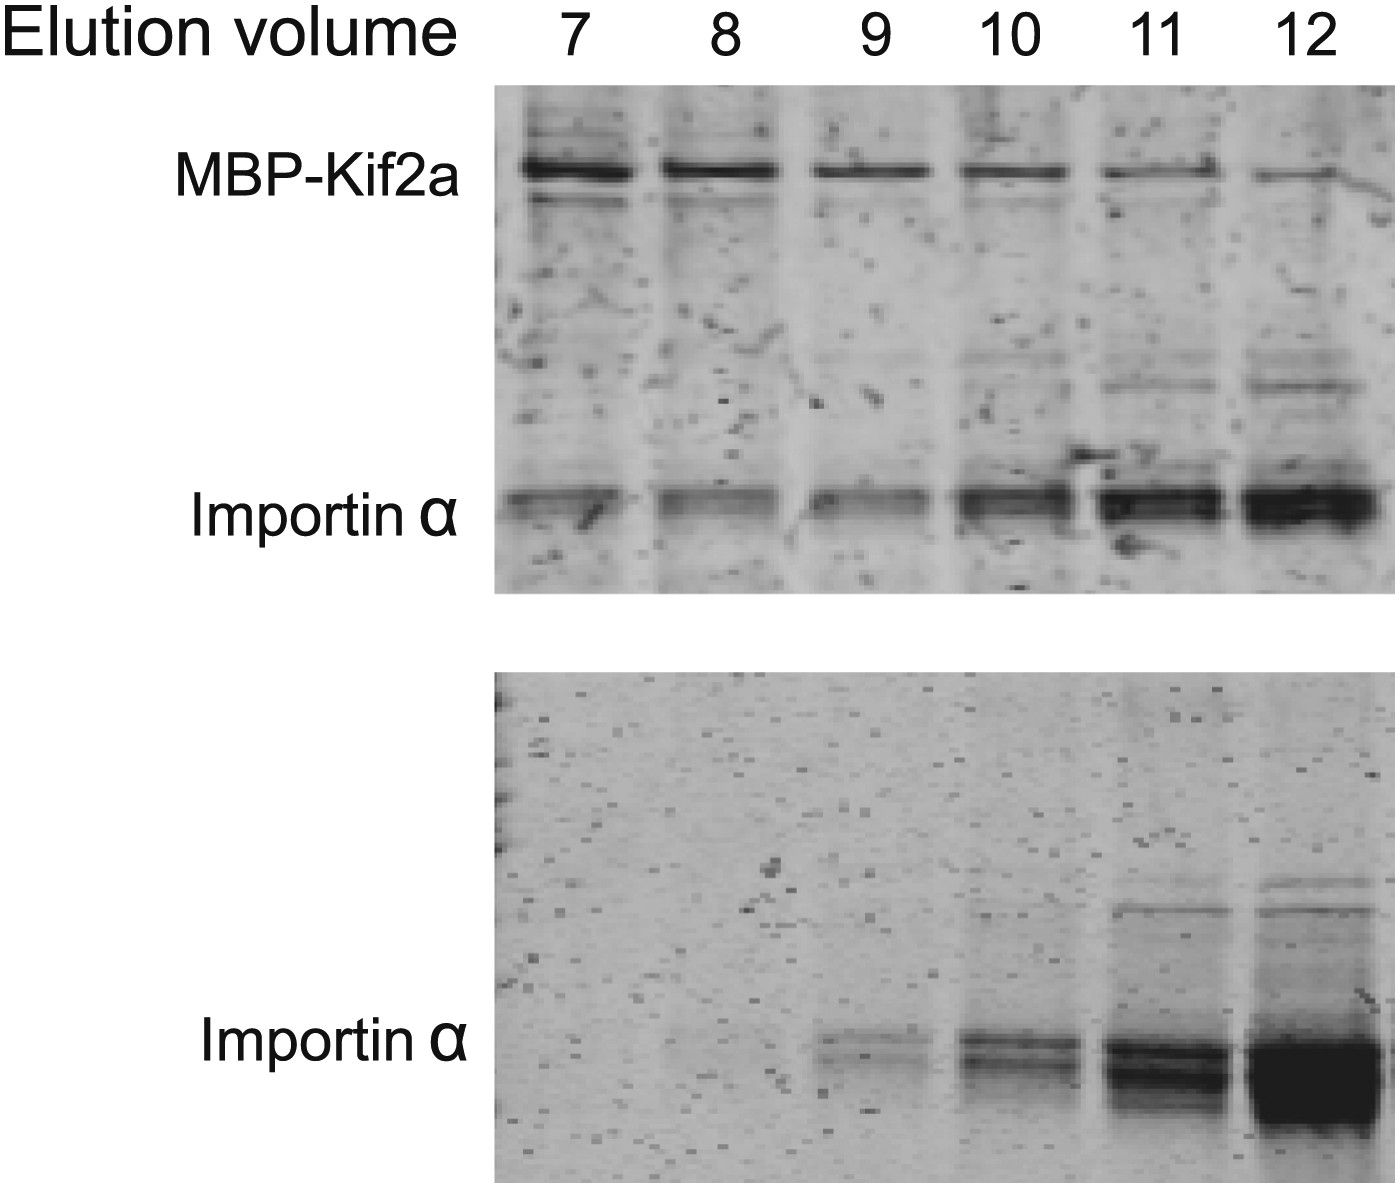
Kif2a interacts with importin size exclusion chromatography of kif2a and importin α or importin α alone on a superdex 200 column.
In the presence of kif2a, a portion of importin α elutes earlier and together with kif2a.
Figure 4—figure supplement 3
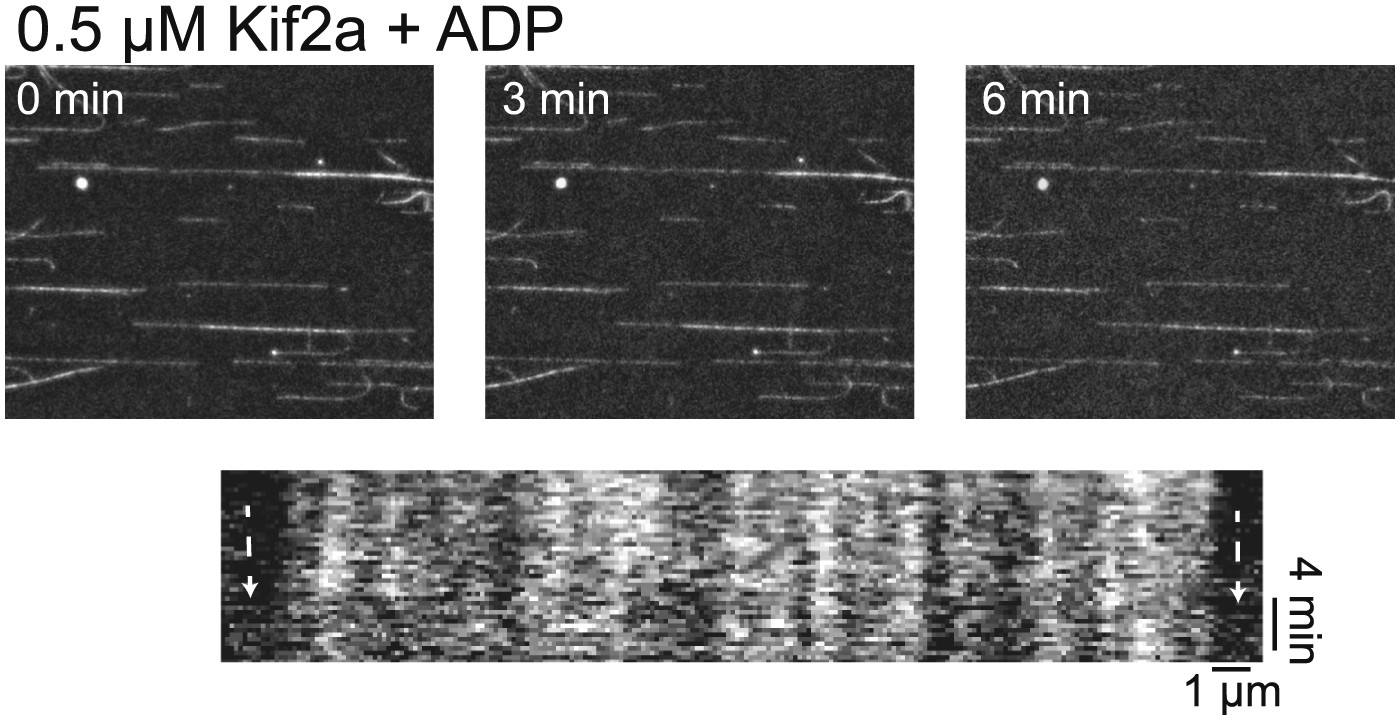
Kif2a is regulated by importin.
In vitro depolymerization of taxol-stabilized MTs by kif2a requires ATP. MTs show no sign of depolymerization from the ends compared to Figure 4C in the presence of ADP.
Figure 5 with 1 supplement
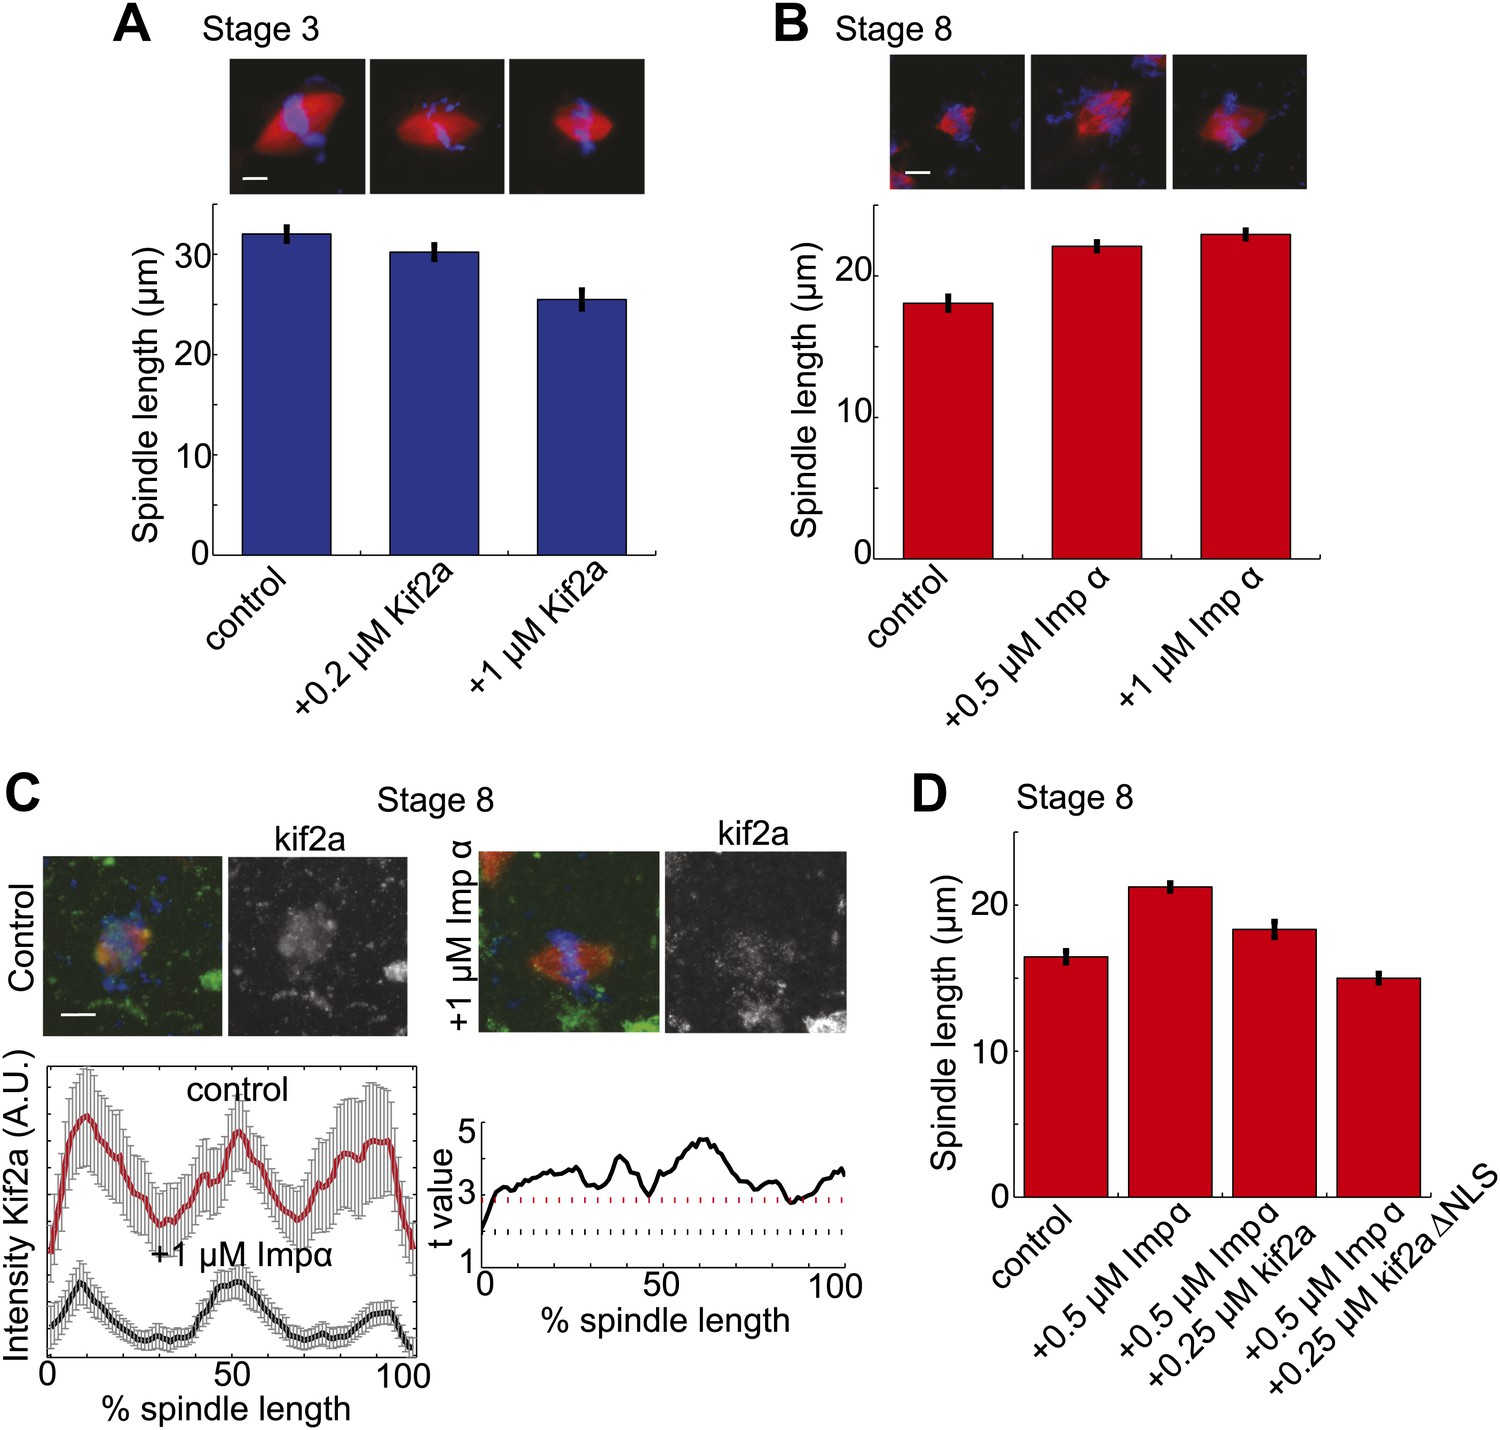
Regulation of kif2a by importin α scales spindles size.
(A) Addition of recombinant kif2a to stage 3 extracts decreases spindle size in a dose-dependent manner. Mean ± SE, n ≥ 48 spindles from two extracts, p<0.0001 by Kruskal–Wallis test. Scale bars represent 10 µm. (B) Addition of recombinant importin α to stage 8 extracts increases spindle size. Mean ± SE, n ≥ 86 spindles from three extracts, p<0.0001 by Kruskal–Wallis test. (C) Addition of 1 µM recombinant importin α to steady-state spindles in stage 8 extracts decreases kif2a recruitment to spindles in addition to increasing spindle size. Left panel: Line scan quantification of immunofluorescence intensity with normalized spindle lengths for statistical analysis. Right panel: t-test analysis across each length bin. Black dashed line is equivalent to a p value of 0.01 and red dashed line is equivalent to a p value of 0.001. Mean ± SE, n ≥ 44 spindles from three extracts. (D) Addition of recombinant kif2a can rescue the increased spindle size caused by importin α addition in stage 8 extracts. An NLS mutant of kif2a (kif2a ΔNLS) is more robust at returning spindles to normal size. Mean ± SE, n ≥ 55 spindles from two extracts.
Figure 5—figure supplement 1
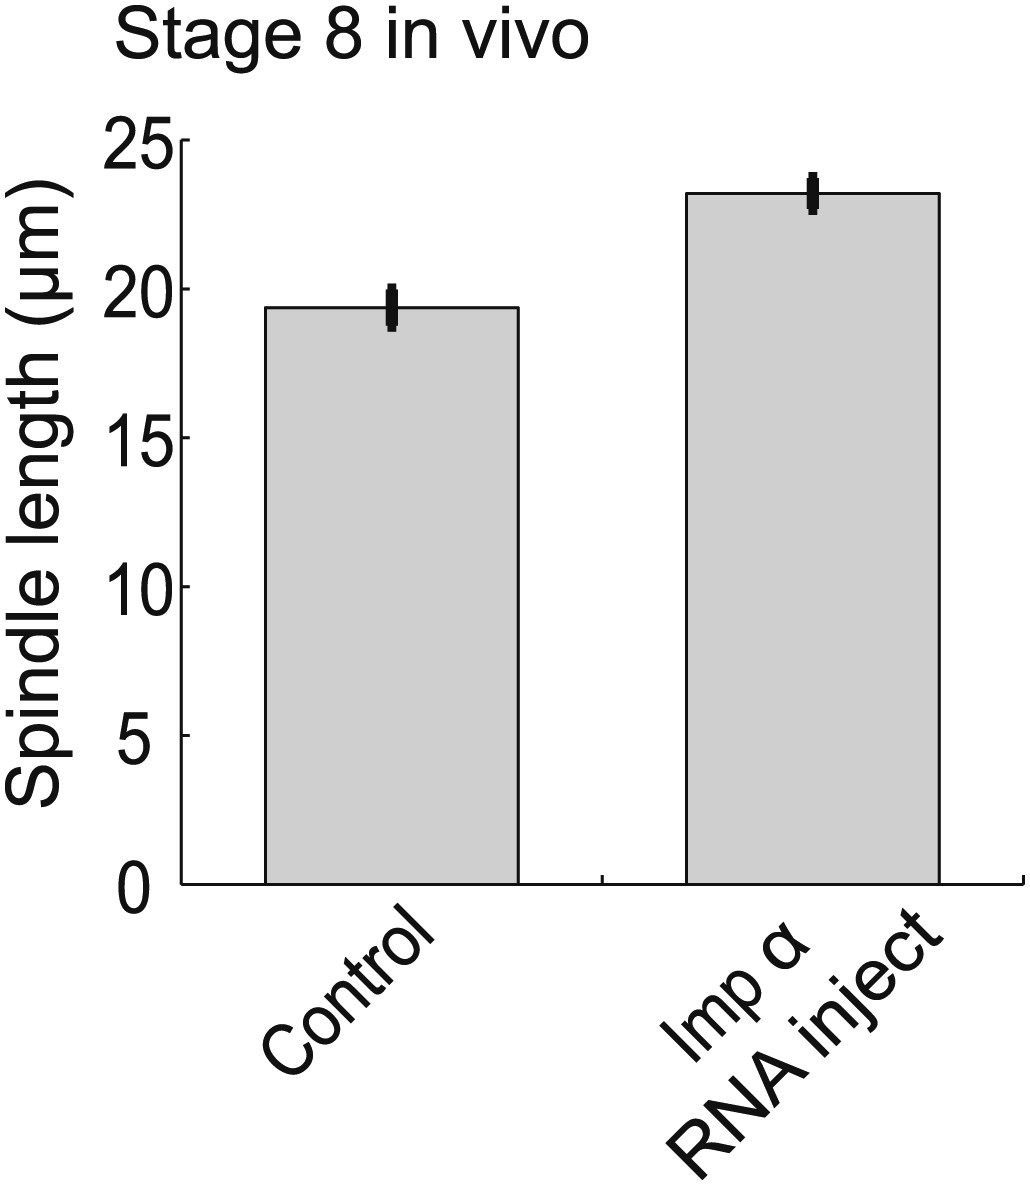
Importin α overexpression increases spindle size in stage 8 embryos.
Mean ± SE, n ≥ 65 spindles, p<0.0001 by unpaired t-test.
Figure 6
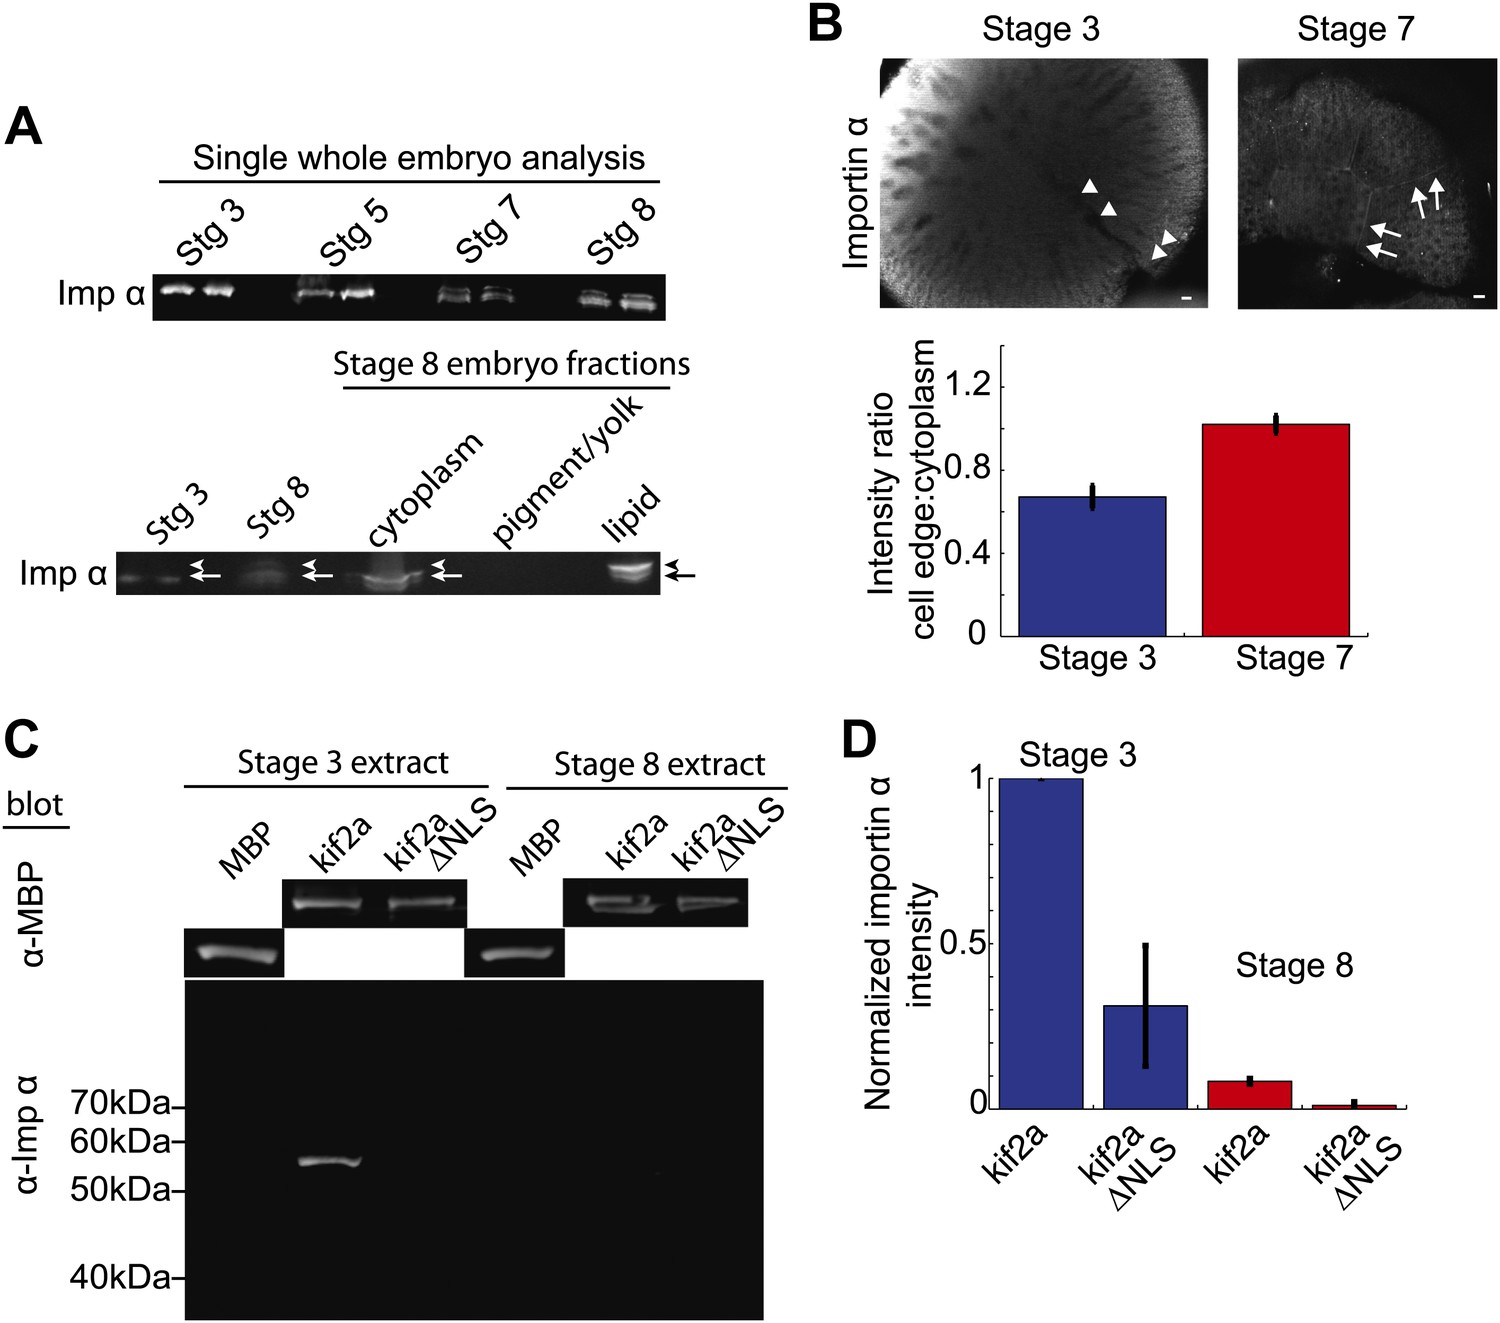
Partitioning of importin α to membrane decreases its cytoplasmic levels and binding to kif2a.
(A) Detection of importin α in single whole embryos (two each) at different stages of development or in different fractions from a multiple embryo extract by immunoblotting with importin α antisera. Arrows in the lower panel indicate the multiple populations of importin α that partition into different fractions. (B) Immunofluorescence detection of importin α in embryos at different stages and quantification of the spatial distribution by determining the relative fluorescence intensity of importin α at the cell periphery vs the cytoplasm. Mean ± SD, n = 12 and 17 cells from more than nine embryos, p <0.0001 by unpaired t-test. Scale bars represent 40 µm. (C) Pull down of importin α from stage 3 or stage 8 embryo extracts by recombinant kif2a. Immunoblot of MBP indicates equivalent levels of kif2a retrieved, while immunoblot of importin α shows amounts of extract importin α interacting with the MBP control, kif2a or kif2a ΔNLS. (D) Quantification of importin α intensity in immunoblots from pull down experiments normalized to kif2a intensity. Mean ± SE, n = 3 extracts each.
Figure 7 with 1 supplement
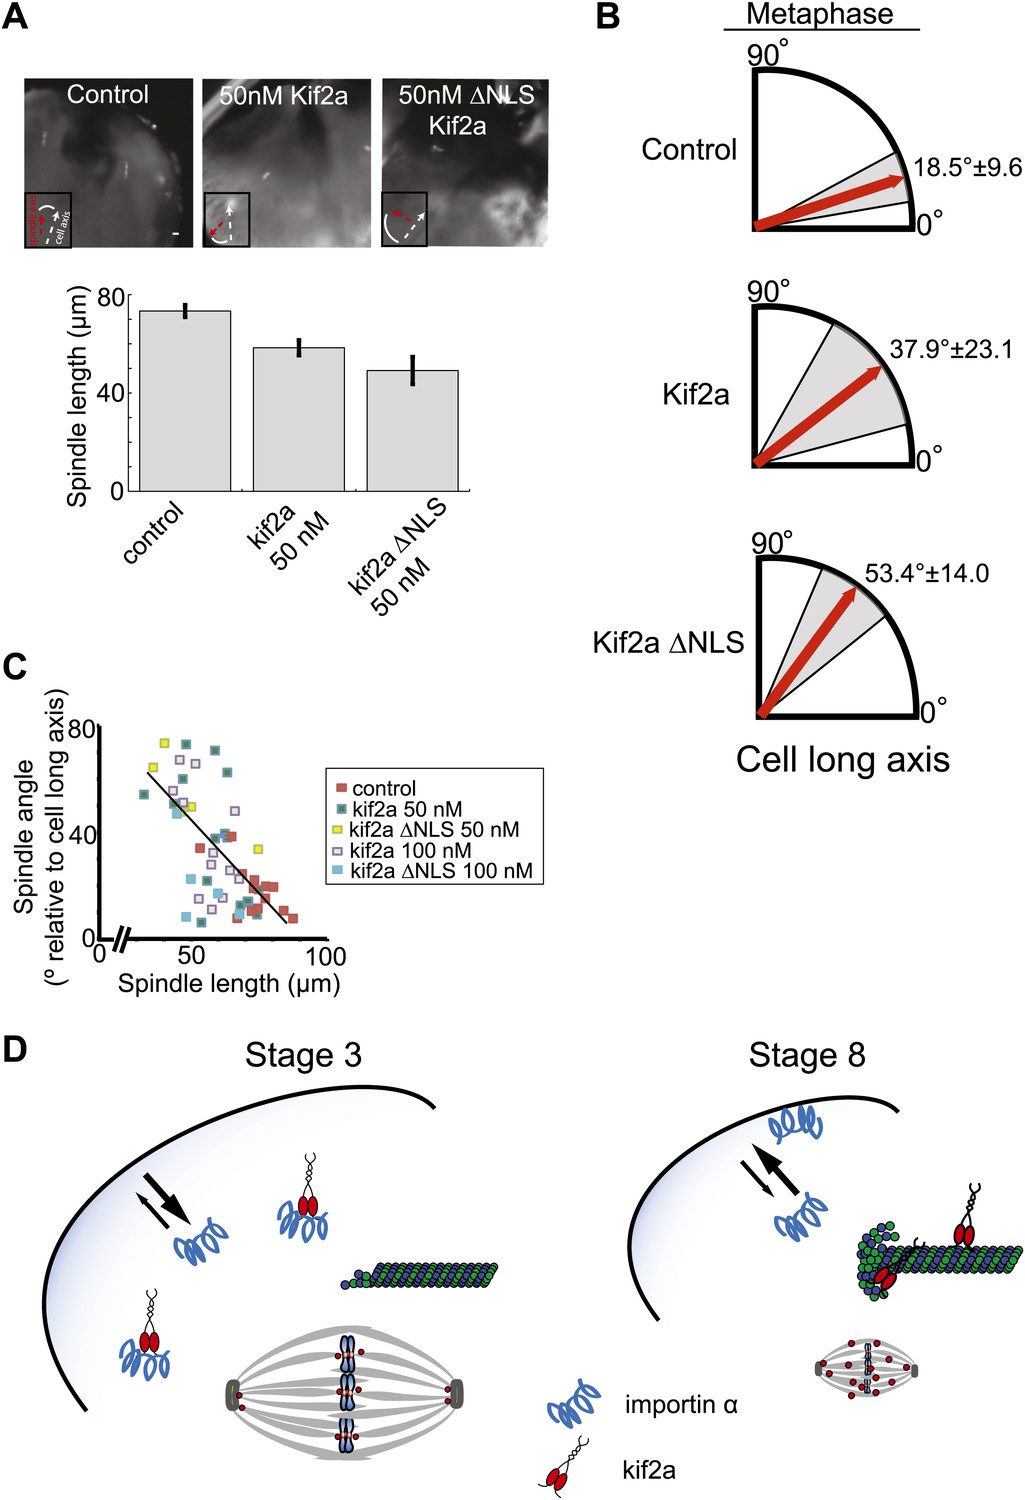
Metaphase spindle orientation in stage 3 embryos depends on spindle size.
(A) Microinjection of kif2a into two-cell embryos just prior to cytokinesis decreases spindle size in the subsequent mitosis. Representative images of decreased spindle size in fixed hemisected embryos. Spindle orientation (pole-to-pole axis, red arrow, vs long axis of the cells, white arrow) is indicated in bottom left. The scale bar represents 40 µm. (B) Quantification of spindle orientation in stage 3 embryos after microinjection of kif2a or kif2a ΔNLS at metaphase. Only metaphase spindle orientation is affected. Mean ± SD, n = 6–15 spindles, p<0.01 by unpaired t-test for control vs kif2a injected and p<0.0001 for control vs kif2a ΔNLS injected. (C) Correlation plot of spindle length and spindle orientation in stage 3 embryos. Each point is a single spindle, and the line a linear regression of all the data. (D) Model of how kif2a regulation by importin α regulates spindle size during development.
Figure 7—figure supplement 1
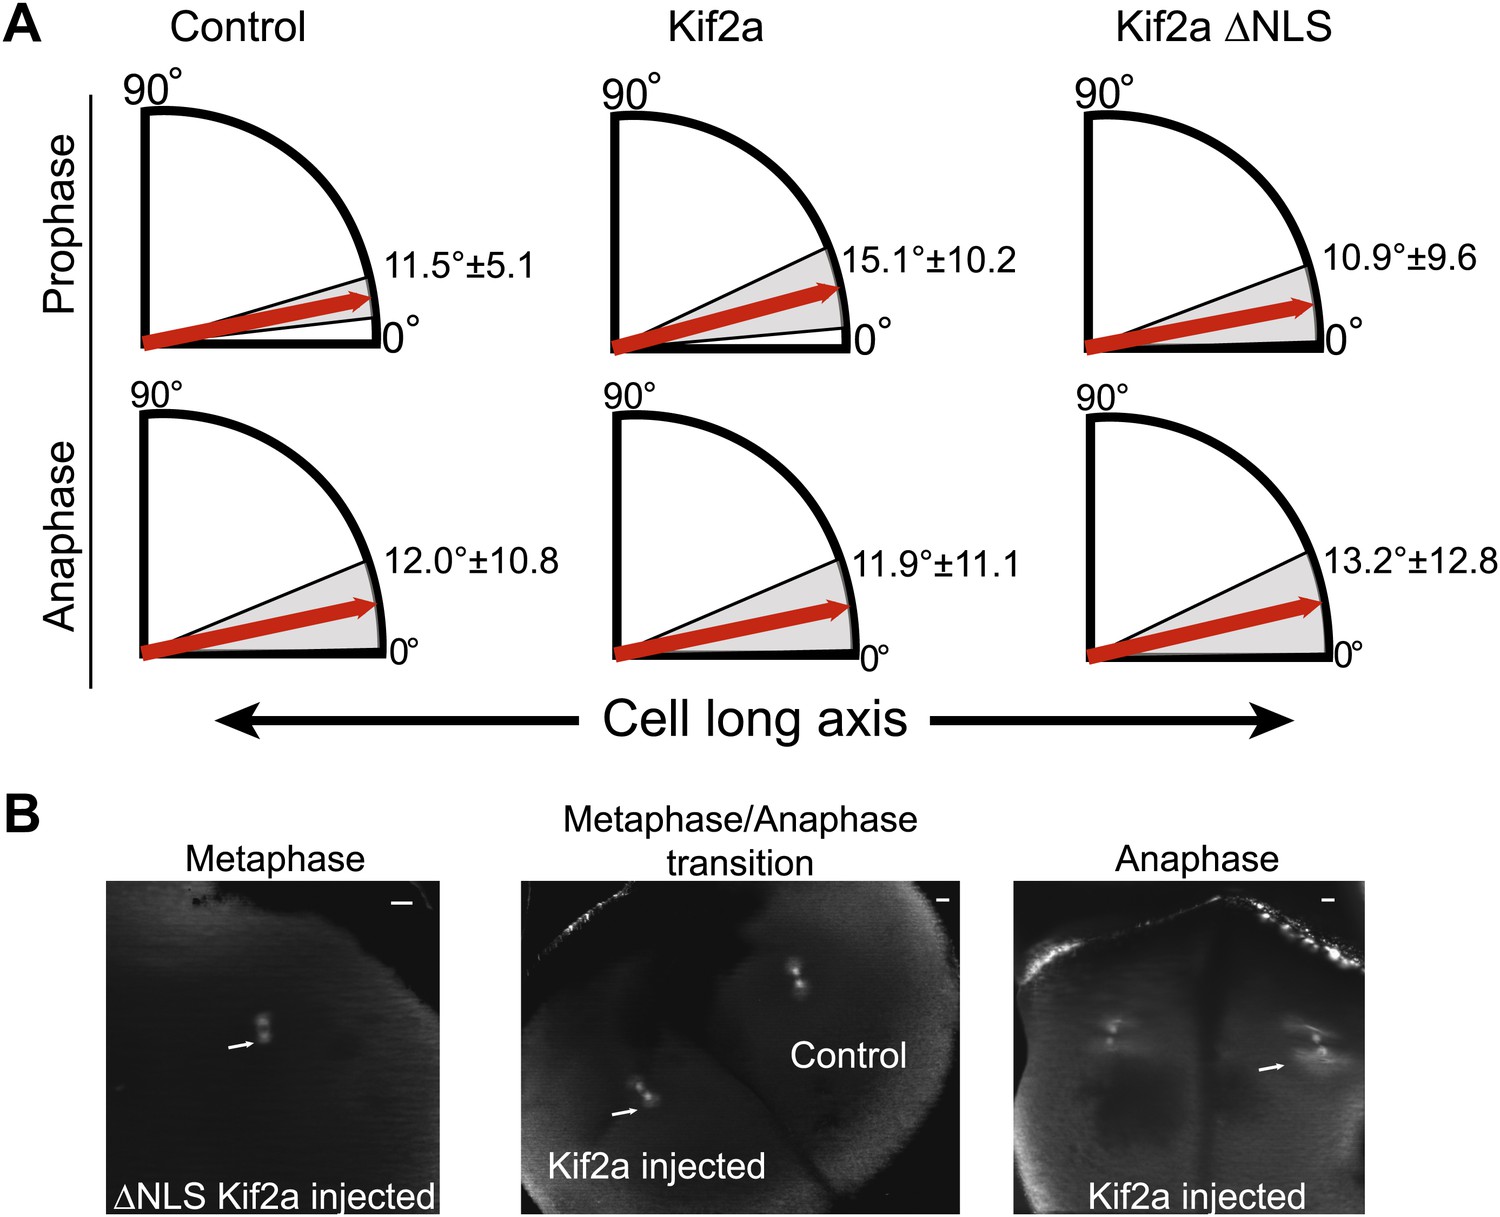
Prophase and anaphase spindle orientation and astral MTs.
(A) Quantification of spindle orientation in stage 3 embryos after microinjection of kif2a or kif2a ΔNLS at prophase and anaphase. Mean ± SD, n = 8–15 spindles. Comparison between control and either kif2a or kif2a ΔNLS was not significant by unpaired t-test in either prophase or anaphase. (B) Examples of spindles with astral MTs at different stages of mitosis found in stage 3 embryos microinjected with 100 nM kif2a or kif2a ΔNLS as detected by immunofluorescence against α-tubulin.
Videos
Video 1
Centrosomal MT dynamics in embryo extracts. Purified human centrosomes were added to either stage 3 or stage 8 extracts with Alexa 488–labeled tubulin. After ∼5-min equilibration, time-lapse images were collected every 5 s for 2 min.
Video 2
EB1 comets on MT plus ends emanating from centrosomes in stage 3 and stage 8 extracts. Purified human centrosomes were added to either stage 3 or stage 8 extracts together with Alexa 488–labeled EB1. Time-lapse images were collected every 2 s for up to 1 min. Examples of tracking are shown for four EB1 comets.
Video 3
In vitro depolymerization of MTs by kif2a is inhibited by importin α, related to Figure 4. Immobilized taxol-stabilized MTs were incubated with kif2a (500 nM) and an ATP-regenerating system or under the same condition with importin α added to threefold the kif2a concentration. Images were collected every 20 s for 5–10 min.
Tables
Table 1
Microtubule dynamics and spindle MT flux in embryo extracts
| Stage 3 extract | Stage 8 extract | Egg extract | |
| MT growth rate—EB1 tracking (µm/min) | 20.6 ± 2.9 | 18.9 ± 2.4 | 12.4 ± 2.4 (11.5–18.5) |
| Nucleation frequency (min−1) | 7.0 ± 1.2 | 5.1 ± 0.78 | 8.3 ± 0.36 |
| Catastrophe frequency** (min−1) | 0.54 ± 0.3 | 1.8 ± 0.54 | 0.72 ± 0.54 (0.9–5.82) |
| Rescue frequency* (min−1) | 1.08 ± 0.96 | 0.48 ± 0.3 | 0.78 ± 0.3 (0.004–0.05) |
| Spindle MT flux rate (µm/min) | 2.38 ± 0.33 | 2.17 ± 0.28 | N.D. (1.79–2.3) |
-
*p<0.01, **p<0.001 between stage 3 and stage 8 extracts by t-test.
-
Values in italics indicate the range of previously made measurements in egg extracts.
-
References for MT dynamics in egg extracts (Wilde et al., 2001; Tournebize et al., 1997; Carazo-Salas et al., 2001; Maddox et al. 2003; Tirnauer et al., 2004; Brown et al., 2007). N ≥ 30 microtubules in at least 3 extracts for dynamics and three to five spindles in three extracts for flux.
Download links
A two-part list of links to download the article, or parts of the article, in various formats.
Downloads (link to download the article as PDF)
Open citations (links to open the citations from this article in various online reference manager services)
Cite this article (links to download the citations from this article in formats compatible with various reference manager tools)
Mitotic spindle scaling during Xenopus development by kif2a and importin α
eLife 2:e00290.
https://doi.org/10.7554/eLife.00290


