Sequence-dependent base pair stepping dynamics in XPD helicase unwinding
- University of Illinois at Urbana-Champaign, United States
- University of Wisconsin-Madison, United States
- University of Winconsin-Madison, United States
- University of Iowa, United States
- Center for the Physics of Living Cells, University of Illinois at Urbana-Champaign, United States
Figures
Figure 1 with 3 supplements
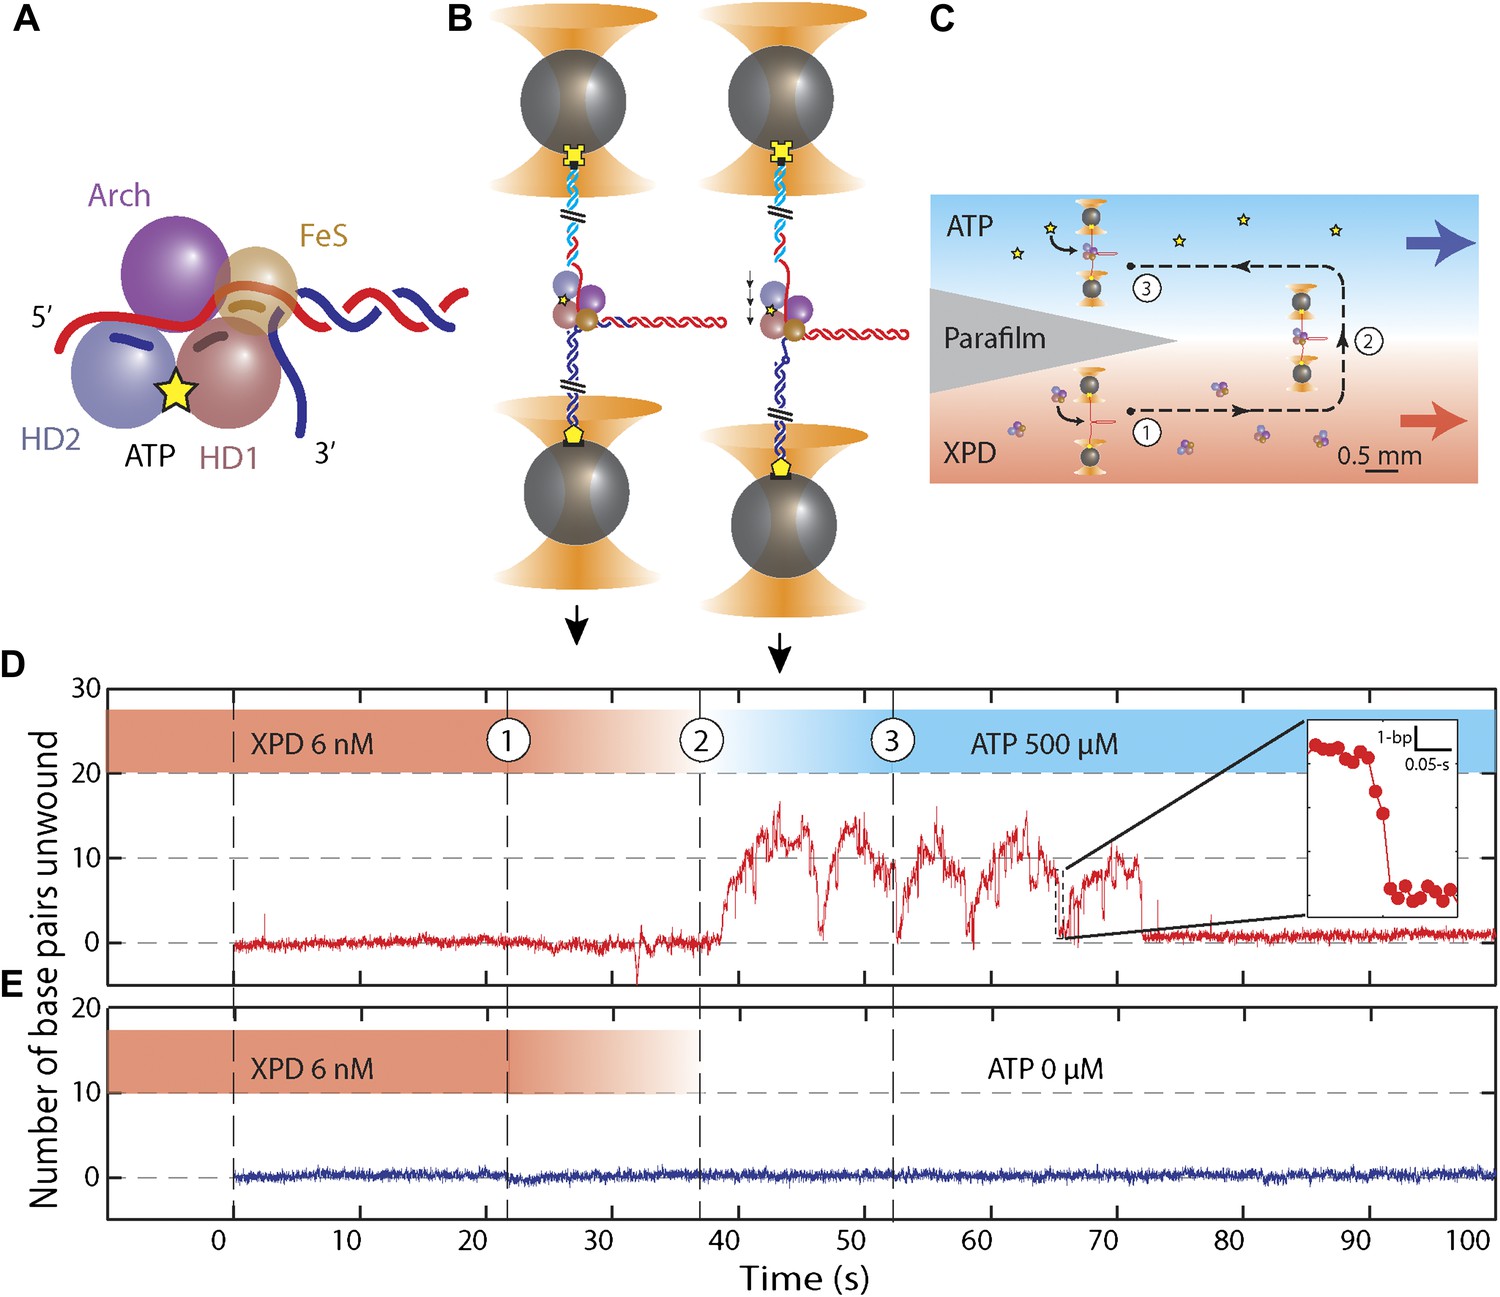
Unwinding activity of individual XPD helicase.
(A) Schematic of XPD helicase with DNA. The 5′–3′ helicase consists of two RecA-like domains (HD1, salmon; HD2, blue) forming the Rad3 motor core that hydrolyzes ATP (yellow star), an ARCH domain (purple), and a FeS cluster (brown) that belongs to HD1. (B) Schematic of the hairpin-unwinding assay (Dumont et al., 2006). A single construct was tethered between two trapped beads via biotin-streptavidin (yellow cross) and digoxigenin-antibody (yellow pentagon) linkages. A single helicase bound to the 5′ (dT)10 ssDNA loading site. Unwinding of the 89-bp hairpin was monitored from the change in end-to-end extension of the molecule under a constant tension of 12 pN. (C) Experimental layout. A laminar flow cell created two adjacent streams of buffer containing XPD only (red; [XPD] = 6 nM) and ATP only (blue; [ATP] = 0–500 μM), respectively. During an experiment, a tether was incubated at position (1) for 20 s, and then moved along the dashed-line path across the stream interface (2) and into the ATP-rich stream (3). (D) ATP-dependent single-helicase activity corresponding to (C). Inset highlights one XPD backslide. (E) Control experiments in an ATP-free stream displayed no unwinding activity.
Figure 1—figure supplement 1
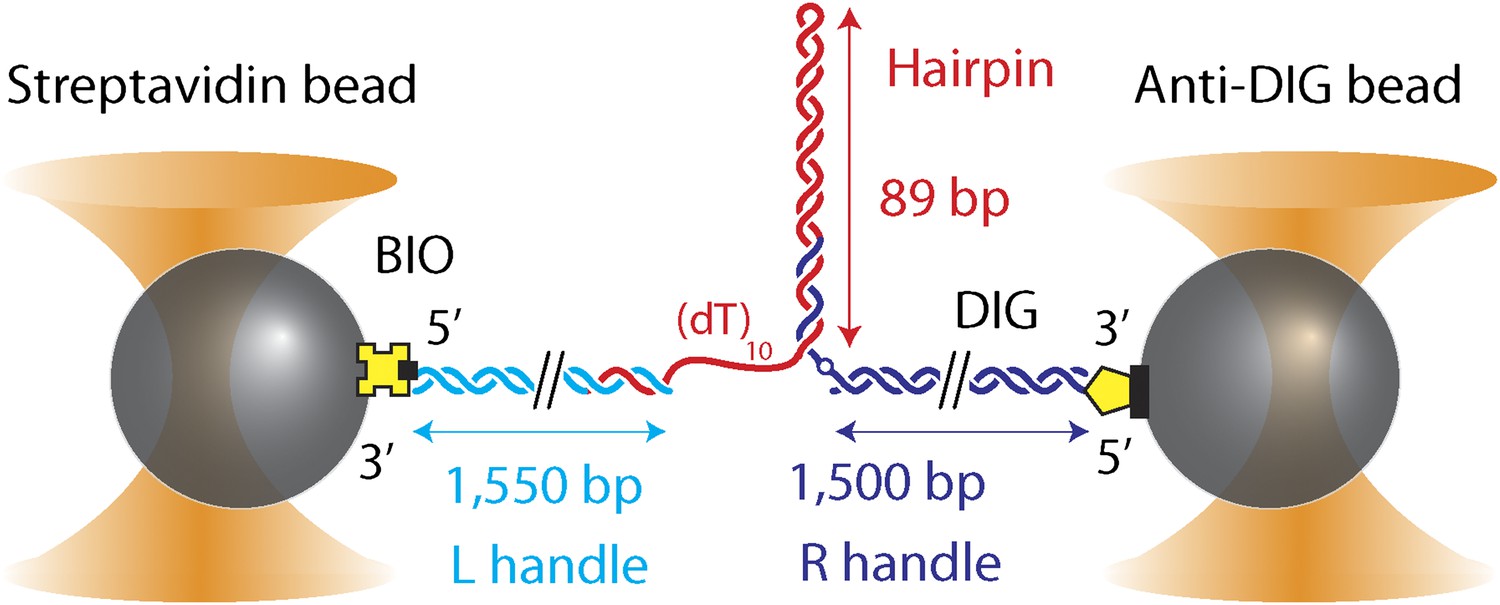
DNA hairpin substrate design.
Schematic representation of the DNA hairpin substrate extended between two trapped beads (not to scale). The construct consisted of three separate fragments ligated together: a 1550-bp ‘Left handle’ (L; cyan), a 1500-bp ‘Right handle’ (R; dark blue), and the 89-bp (with (dT)4 tetraloop) hairpin (red). L and R served as linkers attached to the trapped beads via 5′-biotin and 5′-digoxigenin modifications, respectively. L was attached to a 0.79-μm streptavidin-coated bead, R to a 0.86-μm anti-digoxigenin-coated bead. The hairpin was flanked at the 5′ end by a (dT)n ssDNA region that serves as a helicase loading site (here n = 10) and at the 3′ end by an abasic site (dark blue open circle). The construct was modular, allowing the hairpin sequence and the loading site length to be varied (see ‘Materials and methods’).
Figure 1—figure supplement 2
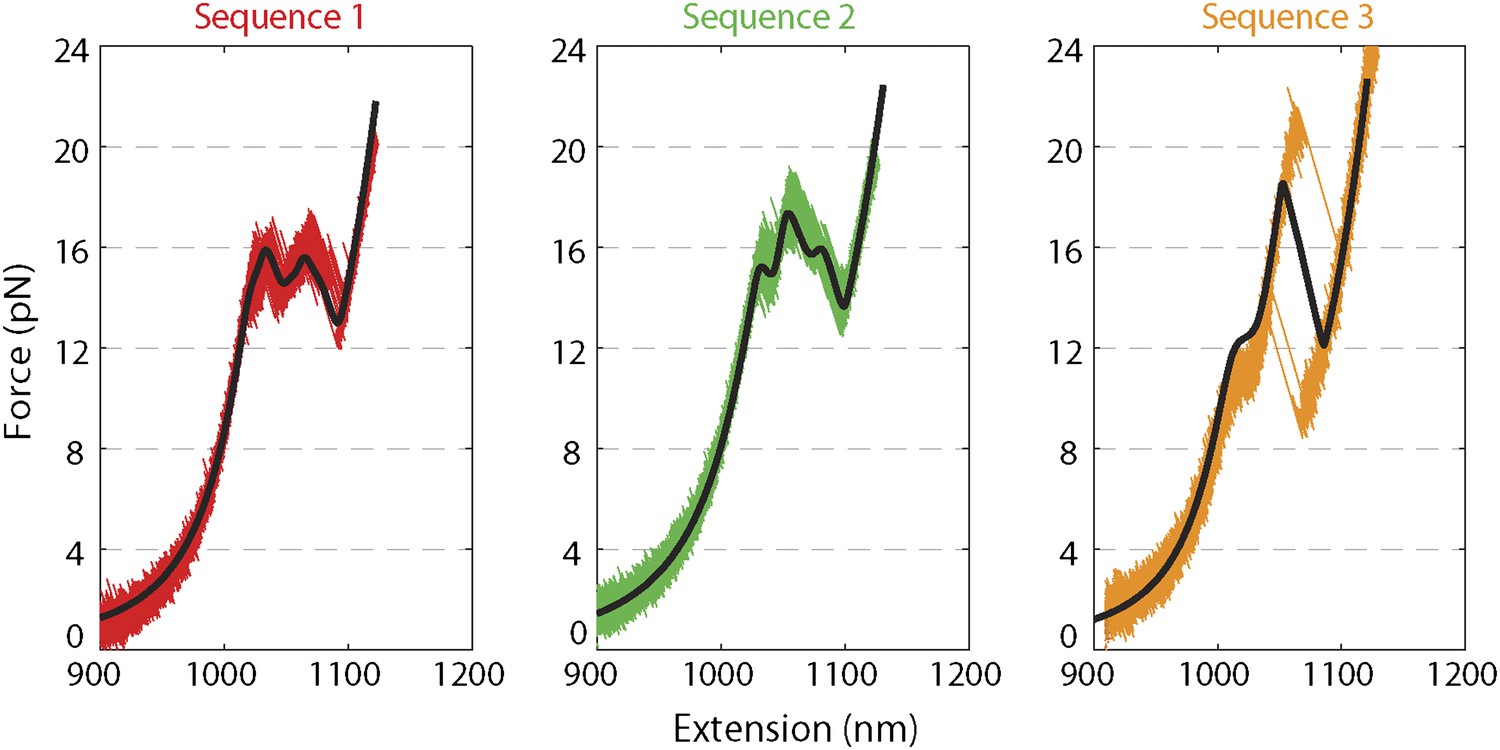
Force extension curves of DNA hairpin.
Representative force extension curves (FEC) of each hairpin sequence (sequences 1–3 are red, green, and orange, respectively; see ‘Materials and methods’). The data were collected at a rate of 2500 Hz, stretching the molecule at a constant speed of ∼80 nm/s. Sequence 1 and 2 displayed a primary unfolding transition at ∼16 pN, whereas sequence 3 showed two transitions at ∼12 pN and ∼22 pN, corresponding to unfolding of its AT- and GC-rich portions, respectively. Solid lines (black) represent fits to the FEC using a previously published theoretical method (Huguet et al., 2010). Included in the fitting model were the Worm Like Chain parameters (Murphy et al., 2004; Dumont et al., 2006; Woodside et al., 2006) for the elastic behavior of the DNA handles and hairpin and the nearest-neighbor base-pairing energies (Borer et al., 1974; Huguet et al., 2010; Santalucia, 1998) for modeling the hairpin unfolding transition (see ‘Materials and methods’). A global set of parameters was used to fit all three sequences.
Figure 1—figure supplement 3
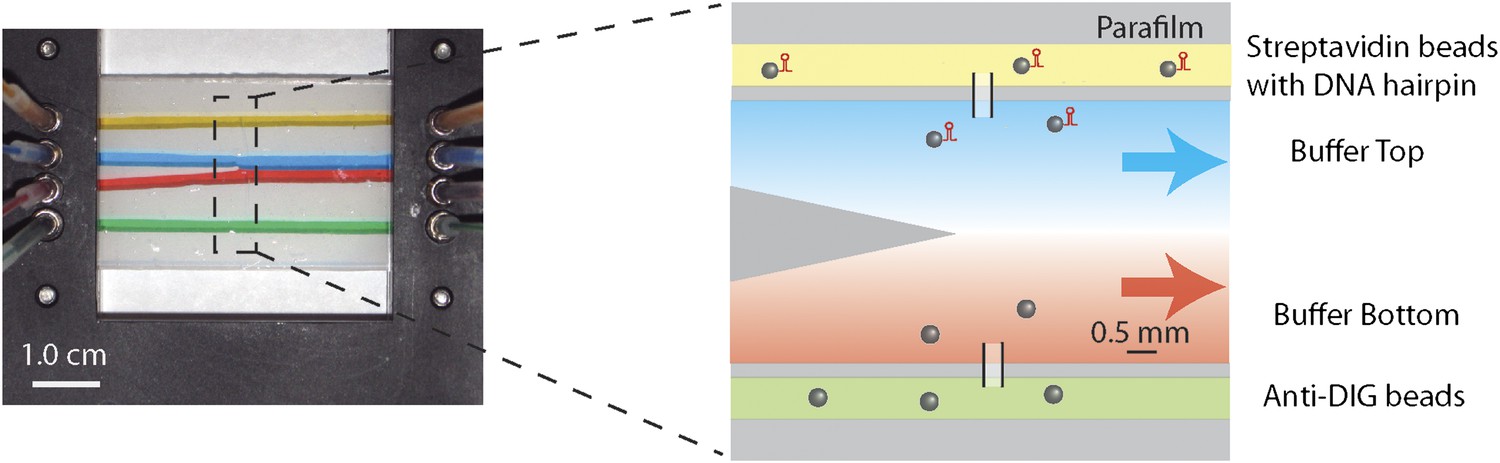
Laminar flow cell design.
Photograph and schematic of a typical experimental flow cell. The flow cell consisted of two microscope cover glasses sandwiching one piece of patterned parafilm (see ‘Materials and methods’). Eight small inlet holes on the top cover glass (four on each side) allowed different buffers to be streamed in through tubing mounted into the chamber bracket. In this photograph, food dye of different colors was flowed into the cell at a rate of 100 μl/hr to illustrate the four streams. The two inner streams (red and blue) merge into a central channel at a point near the center of the flow cell. Due to the laminar flow, a sharp interface is maintained between the two streams. The zoom-in shows the corresponding schematic of the experimental flow cell. The top channel (yellow) was loaded with streptavidin beads with attached DNA substrate. The bottom channel (green) was loaded with anti-DIG beads. The two types of beads diffused into the central channel via thin glass capillaries inserted into the parafilm, where they could be trapped and manipulated. In a typical measurement of single-XPD helicase activity, the top stream (blue) contained ATP while the bottom stream (red) contained protein (‘Materials and methods’).
Figure 2 with 1 supplement
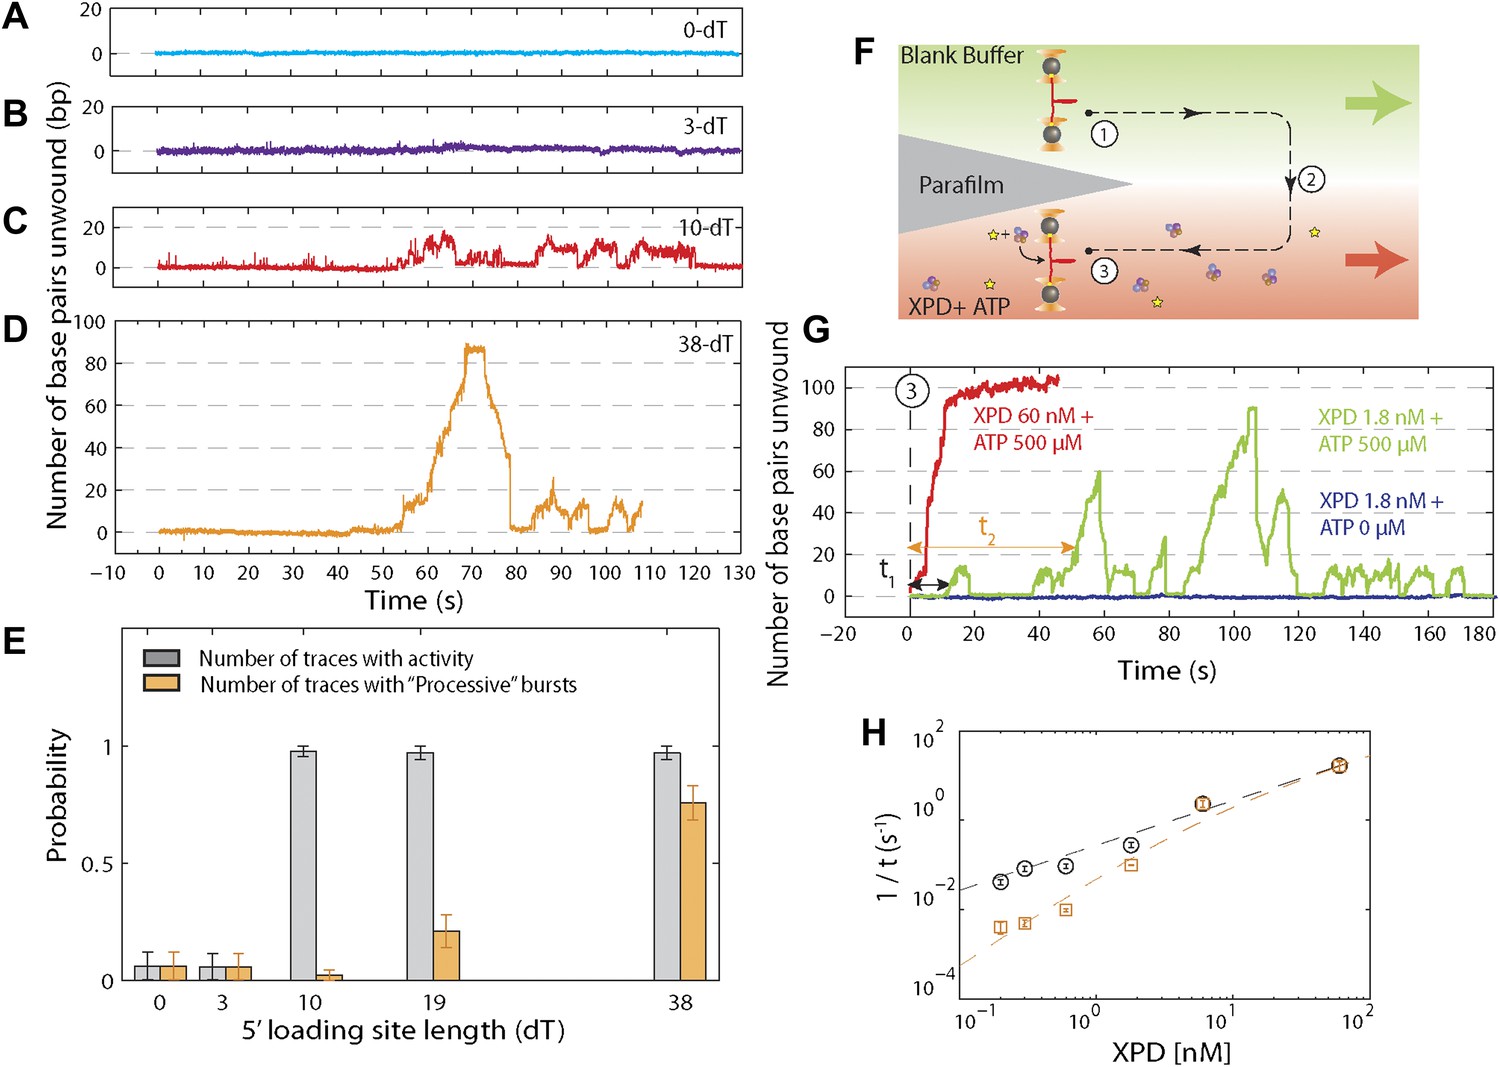
Effect of 5′ loading site length and XPD concentration on activity.
(A)–(D), Representative XPD unwinding traces for different helicase loading site lengths: 0-dT, 3-dT, 10-dT, and 38-dT. The traces in (A) and (B) show no unwinding activity, which we defined as hairpin unfolding by >5 bp. In contrast, the traces in (C) and (D) exhibit activity; we defined this activity as low-processivity (C) if the 89-bp hairpin was not completely unwound, or processive (D) if it was. Traces were occasionally seen to revert from processive to low-processivity activity (D), potentially indicating dissociation of one of the cooperating XPD molecules while leaving the other remaining. (E) Fraction of active traces (gray bars) and processive traces (orange bars) vs 5′ loading site length: 0-dT, 3-dT, 10-dT, 19-dT and 38-dT (N = 14, 15, 40, 31, and 31 tethers, respectively). No activity was detected when the loading site was <10 nt. Processive activity was detected only when the binding site was ≥19 nt, long enough to accommodate two or more XPD helicases. Probabilities were calculated from the Laplace estimator (nsuccess + 1)/(Ntrial + 2). Error bars throughout denote SD. (F) Experimental layout for XPD titration measurement. The laminar flow cell was used to create two adjacent streams of buffer containing XPD mixed with ATP (red; [XPD] = 0.2–60 nM and [ATP] = 500 μM) and blank buffer only (green), respectively. A single tether was formed at position (1), and then moved along the dashed-line path across the stream interface (2) and into the XPD + ATP-rich stream (3). (G) Representative XPD-dependent helicase activity. Unwinding traces in the presence of [XPD] = 60 nM (red) and 1.8 nM (green) are shown. The waiting times τ1 (and τ2) were defined as the total time elapsed from entering the XPD + ATP-rich stream until the initial low-processivity (and processive) unwinding activity was detected. Control experiments in which the tether was moved into an ATP-free stream with 1.8 nM XPD (navy) displayed no unwinding activity. (H) 1/τ vs XPD concentration. 1/τ1 (black) and 1/τ2 (orange) were fitted to the models described in the main text ([XPD] = 0.2, 0.3, 0.6, 1.8, 6.0, and 60 nM, N = 27, 59, 71, 56, 16, and 13 binding events, respectively). Error bars throughout denote SEM.
Figure 2—figure supplement 1
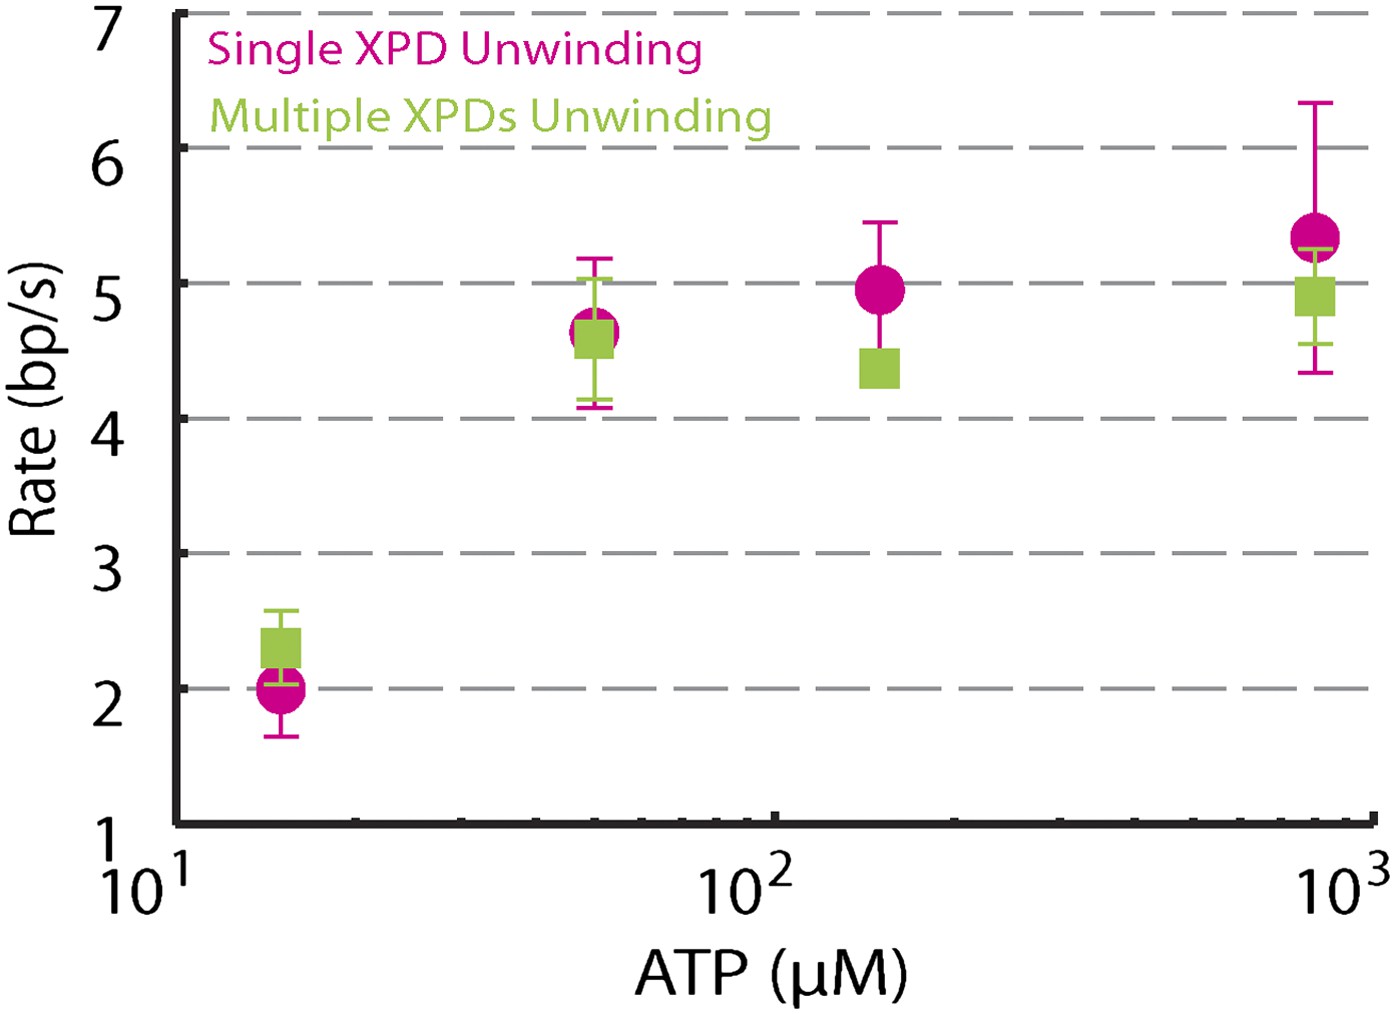
Dependence of unwinding rates of single XPD and multiple XPDs on ATP concentration.
Unwinding rates of single XPD (magenta circles) and multiple XPDs (green squares) under different ATP conditions: (N = 3–9 traces at each ATP concentration; 15–800 μM). Error bars denote SEM. Unwinding rates determined from the slope of each time trace.
Figure 3 with 1 supplement

XPD stepping behavior.
(A) Representative traces of XPD unwinding at 500, 250, 25, 12.5, and 6.25 μM ATP (black, light green, cyan, purple, and brown respectively; data filtered and decimated to 100 Hz ([ATP] = 500, 250 μM) and 50 Hz (25, 12.5, 6.25 μM). Raw data in gray acquired at 1 kHz). A step-fitting algorithm (Kerssemakers et al., 2006) was used to fit the data (red). Dashed rectangle (1) highlights a 1-bp backstep; dashed rectangle (2) highlights a large 5-bp backward and forward step event. (B) PWD analysis for selected traces at all ATP concentrations. The color map is the same as (A), with pink for 50 μM ATP.
Figure 3—figure supplement 1
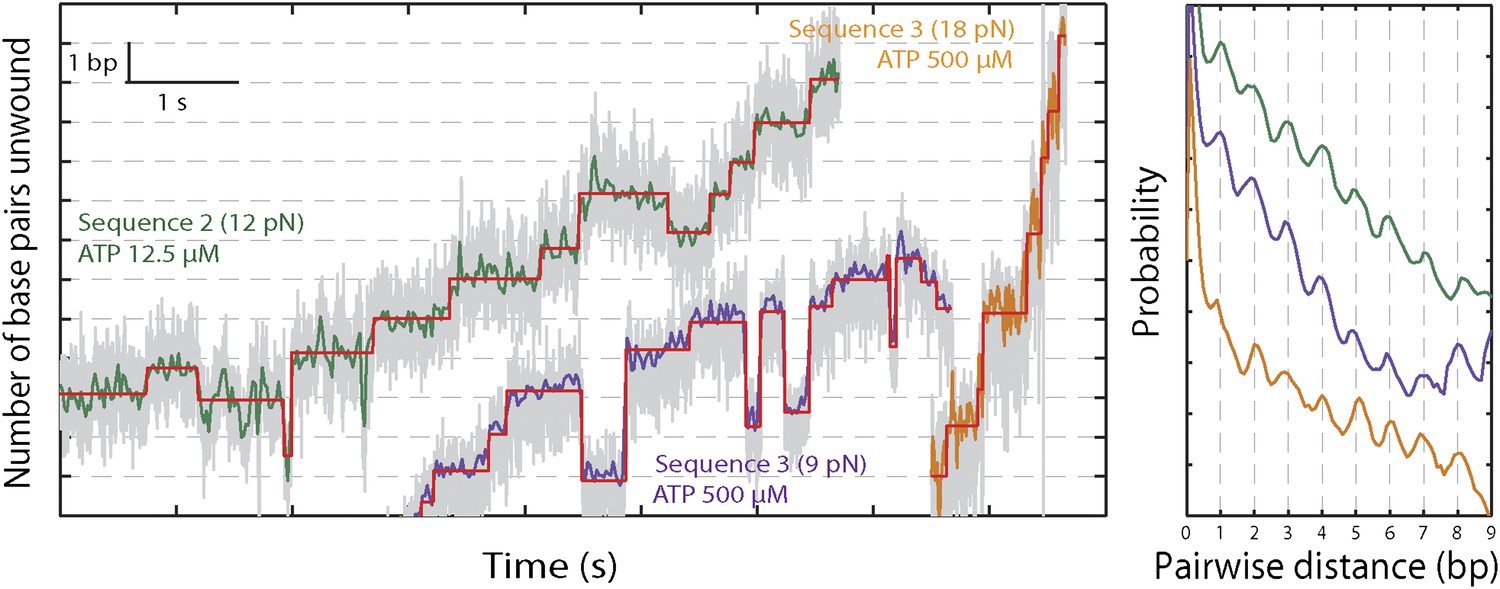
XPD stepping dynamics for alternate sequences and forces.
Representative traces of XPD unwinding and PWD analysis at 12.5 μM ATP and 12 pN for sequence 2 (green), 500 μM ATP and 9 pN for sequence 3 (purple), and 500 μM ATP and 18 pN for sequence 3 (orange). Data was filtered and decimated to 50 Hz for sequence 2 (12 pN) and sequence 3 (9 pN), and 100 Hz for sequence 3 (18 pN). (Raw data in gray acquired at 1 kHz.) Two different tensions were applied for sequence 3, taking advantage of the two transitions corresponding to unfolding of its AT- and GC-rich portion (Figure 1—figure supplement 2). At 9 pN, XPD unwound DNA within the 29-bp AT-rich portion of the hairpin; at 18 pN, this AT-rich region was unfolded, and XPD unwound DNA within the GC-rich portion of the hairpin (see ‘Materials and methods’). A step-fitting algorithm (Kerssemakers et al., 2006) was used to fit the data (red). PWD analysis was performed for selected traces for sequence 2 (N = 12), for sequence 3 at 9 pN (N = 13), and for sequence 3 at 18 pN (N = 5).
Figure 4 with 2 supplements
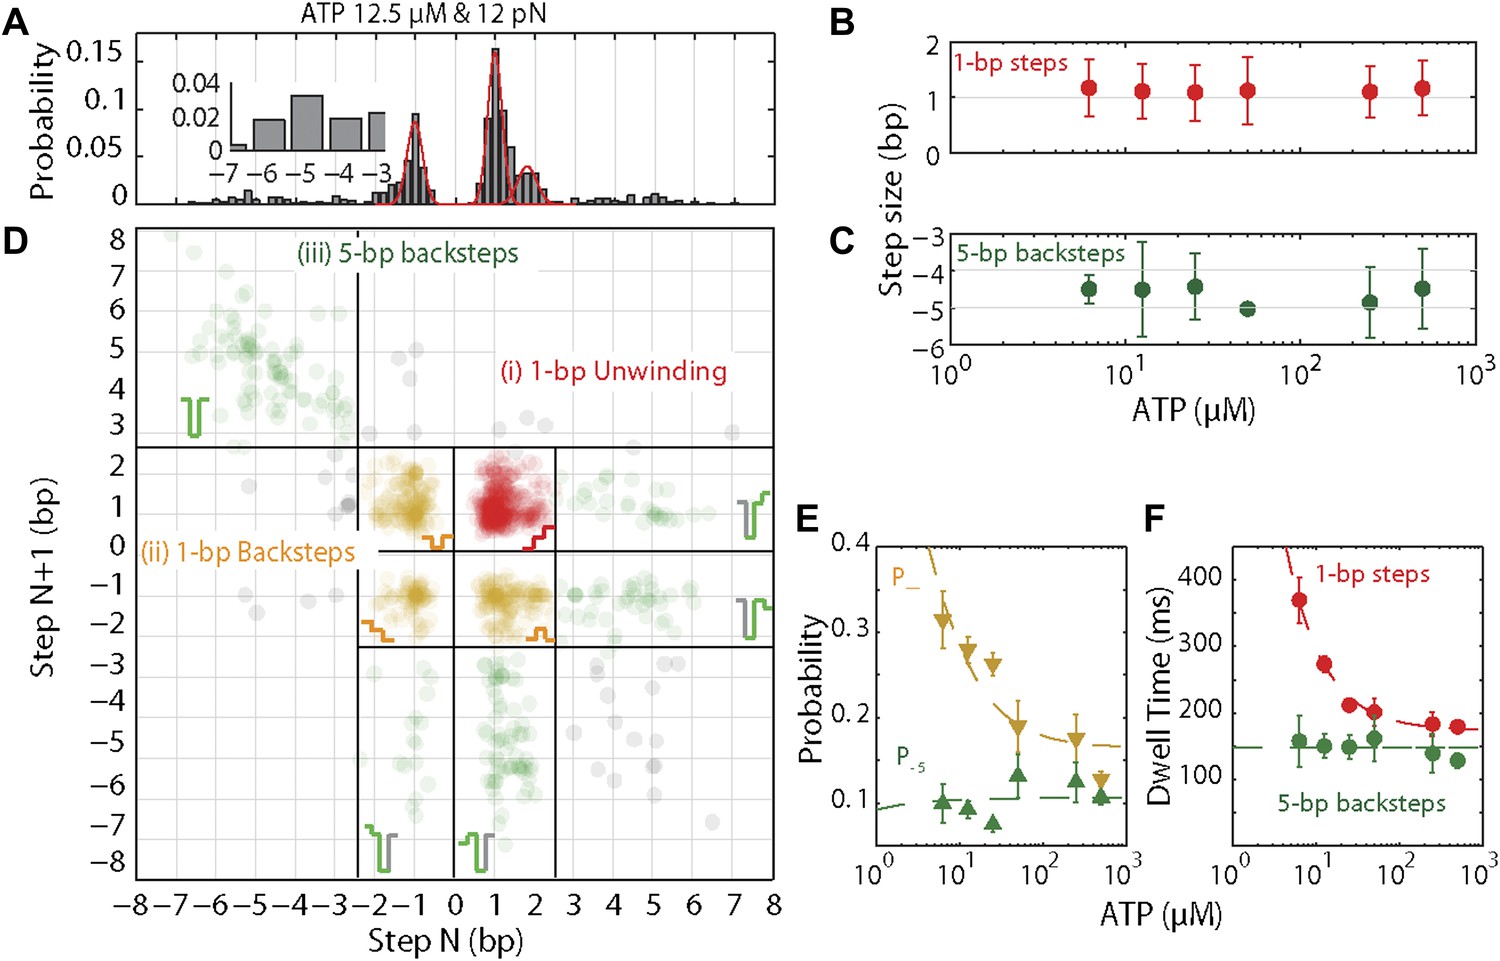
XPD stepping dynamics and dependence on ATP.
(A) Representative histogram of step sizes for 12.5 μM ATP, with Gaussian fit (red). Step sizes were determined from the step-fitting algorithm. Inset highlights the larger backsteps. (B) and (C) Mean step size for elemental 1-bp steps (B) and large 5-bp backsteps (C) vs ATP concentration. Means were determined from the Gaussian fits of the step size distribution obtained from the step finding algorithm (A). Error bars throughout denote 95% confidence intervals from Gaussian fit. (D) Representative scatter plot of step pairs for 12.5 μM ATP. Each data point represents the step sizes of every adjacent pair of steps. Three regions are highlighted: (i) Step pairs with consecutive 1-bp unwinding steps (red); (ii) pairs with 1-bp backsteps (orange); and (iii) pairs with larger (∼5 bp) backsteps (dark green). Grey points represent the small fraction of step pairs that did not fit in the categorization above. (E) Probabilities for taking 1-bp backsteps, p− (orange), and for taking larger backsteps, p−5 (dark green), vs ATP concentration. Probabilities were calculated from the Laplace estimator (nsuccess + 1)/(Ntrial + 2). Error bars denote SD. (F) Dwell times for 1-bp steps vs ATP concentration. Error bars denote SEM. Dashed lines in (E) and (F) represent a global fit to the kinetic model described in the text and ‘Materials and methods’. The reduced χ value for the global fit to the data in panels E and F was 3.2. Experimental details are summarized in Table 1.
Figure 4—figure supplement 1
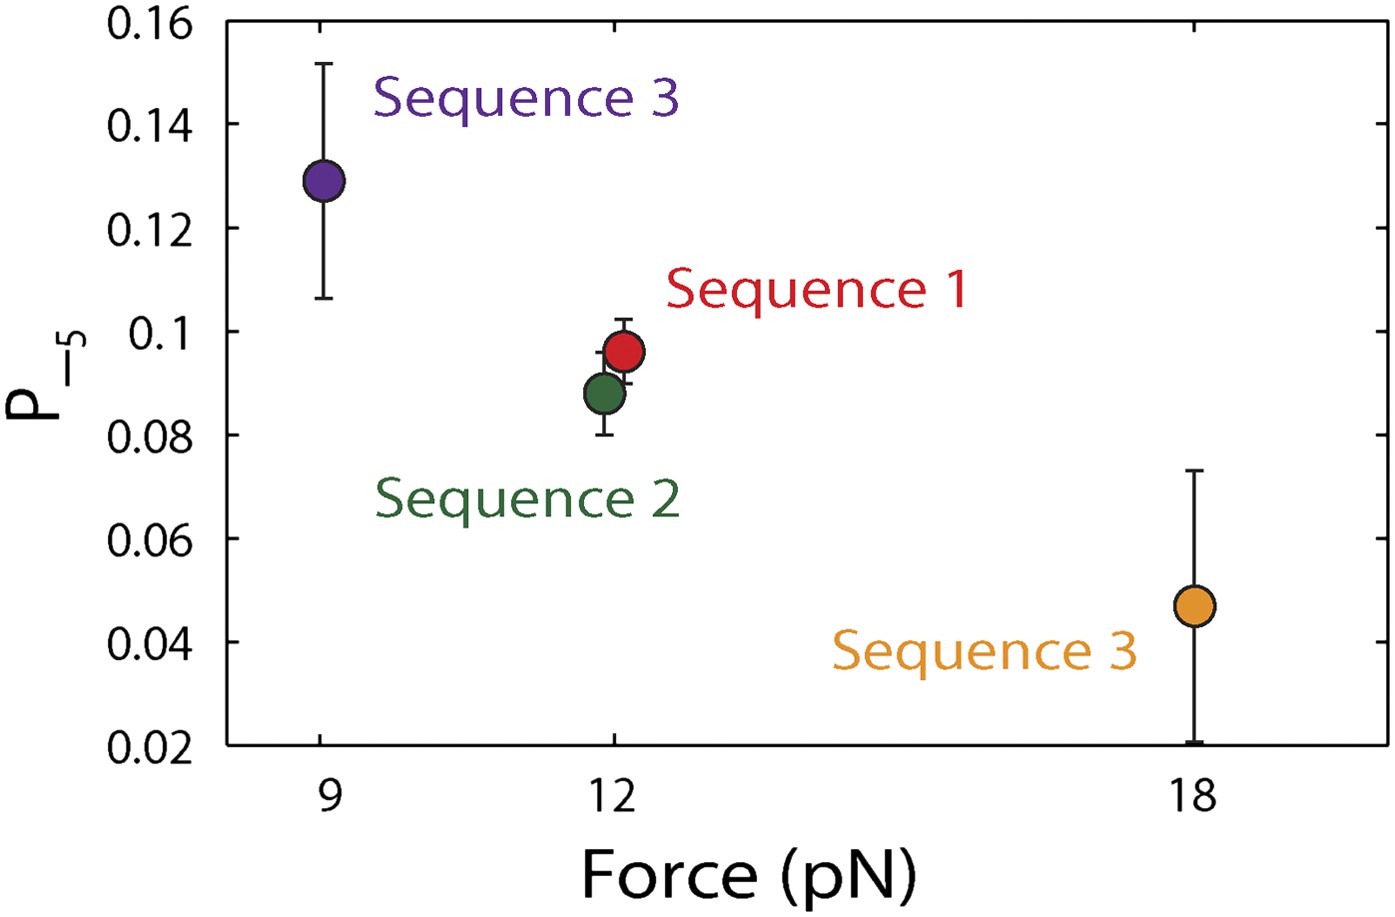
Dependence of large 5-bp backsteps on tension.
Probabilities for taking large backsteps, P−5, vs force. Error bars denote SD.
Figure 4—figure supplement 2
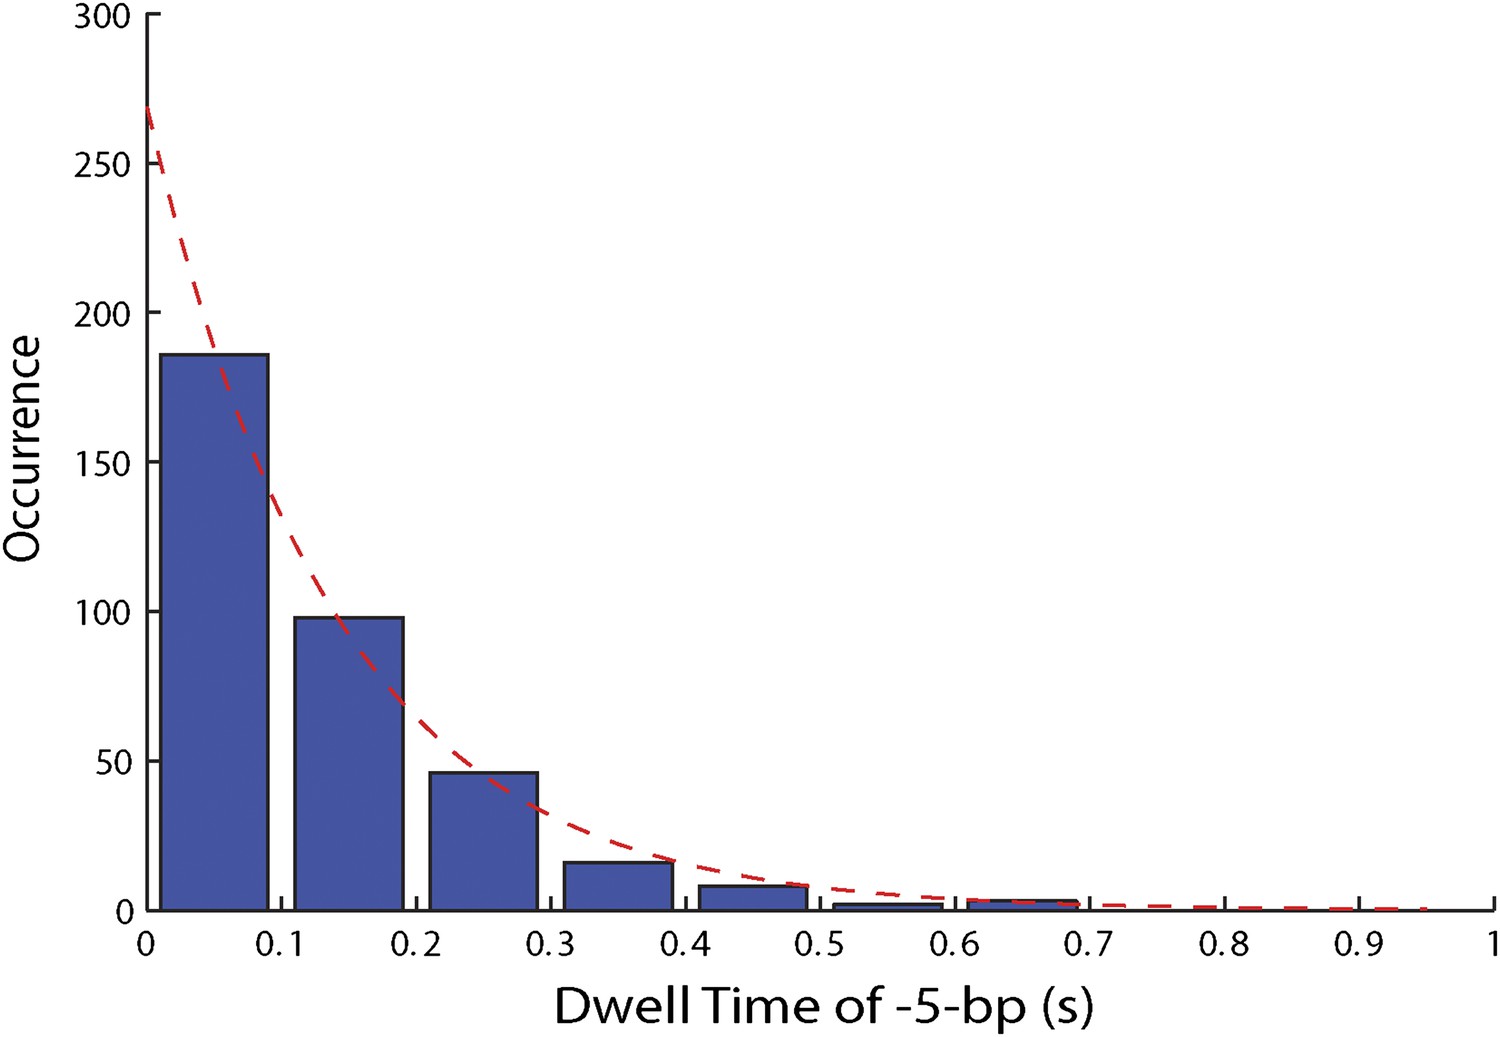
Distribution of dwell times for large 5-bp backsteps.
Dwell times between large 5-bp backsteps and subsequent forward steps are independent of ATP (Figure 4F). The distribution of dwell times combining all ATP conditions is exponential (6.25, 12.5, 25, 50, 250, and 500 μM ATP; N = 359).
Figure 5 with 5 supplements
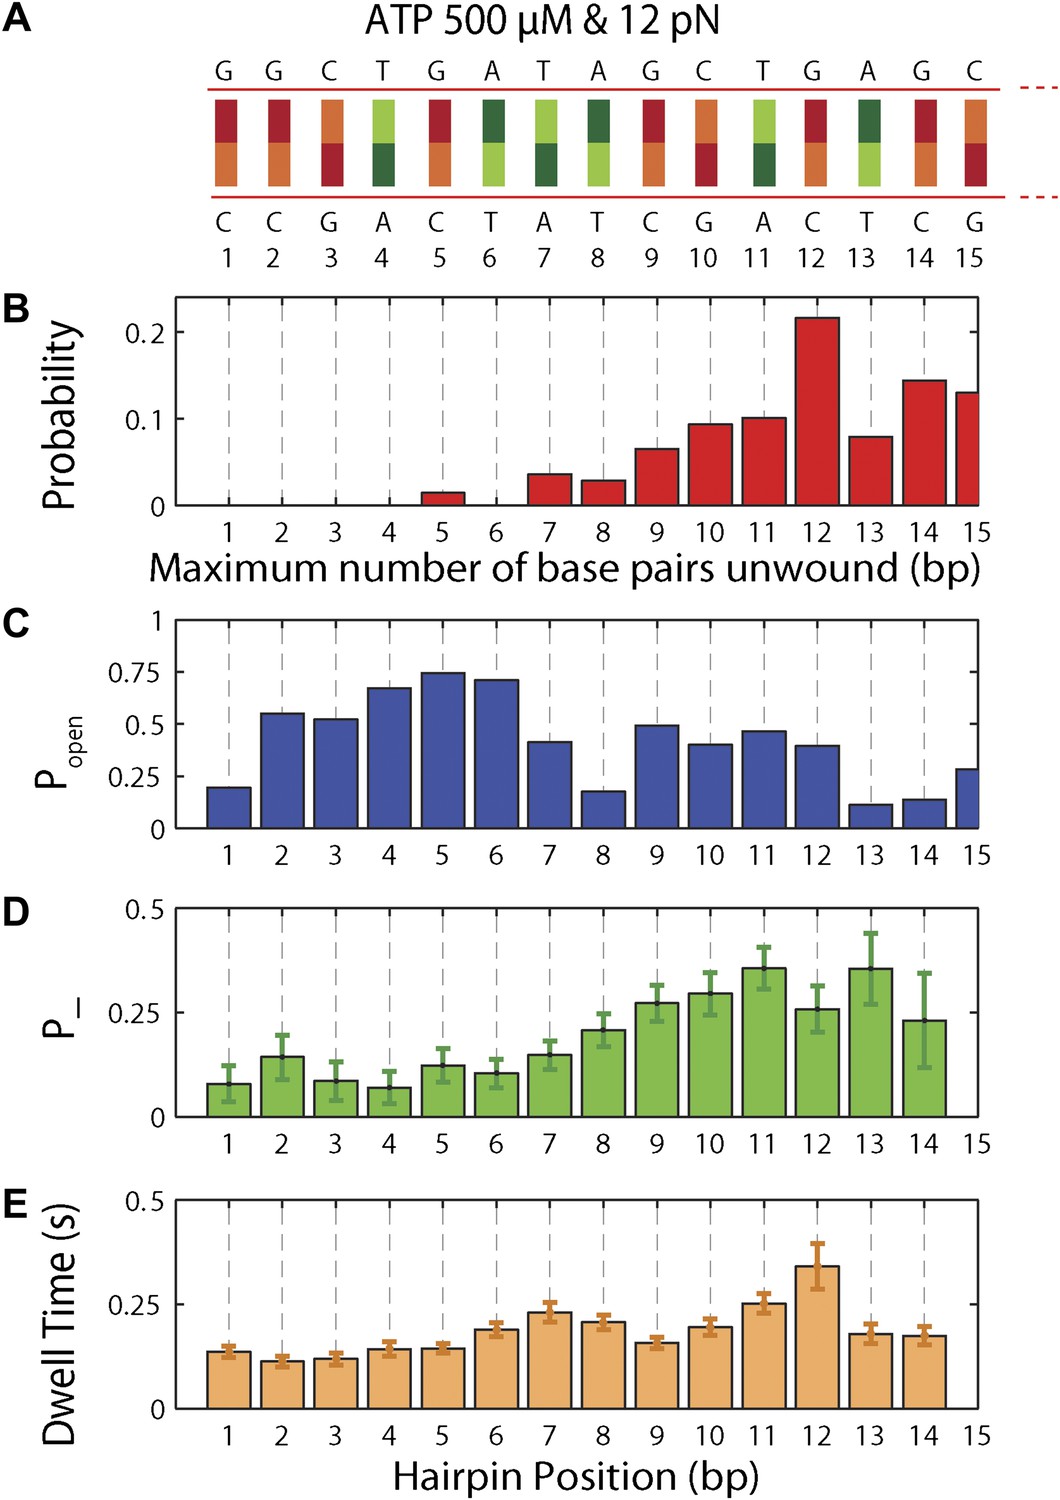
Sequence dependence of XPD processivity, backstepping probability, and dwell time.
(A) DNA hairpin sequence from base pair 1 to 15. (B) Histogram of the processivity (N = 144 bursts). (C) Hairpin fork opening probability popen vs hairpin position. (D) Mean backstepping probability vs hairpin position (N = 1612 total steps). (E) Mean dwell time τ vs hairpin position. Data for (B), (D) and (E) were obtained at saturating ATP conditions (500 μM), under which condition translocation is rate-limiting.
Figure 5—figure supplement 1
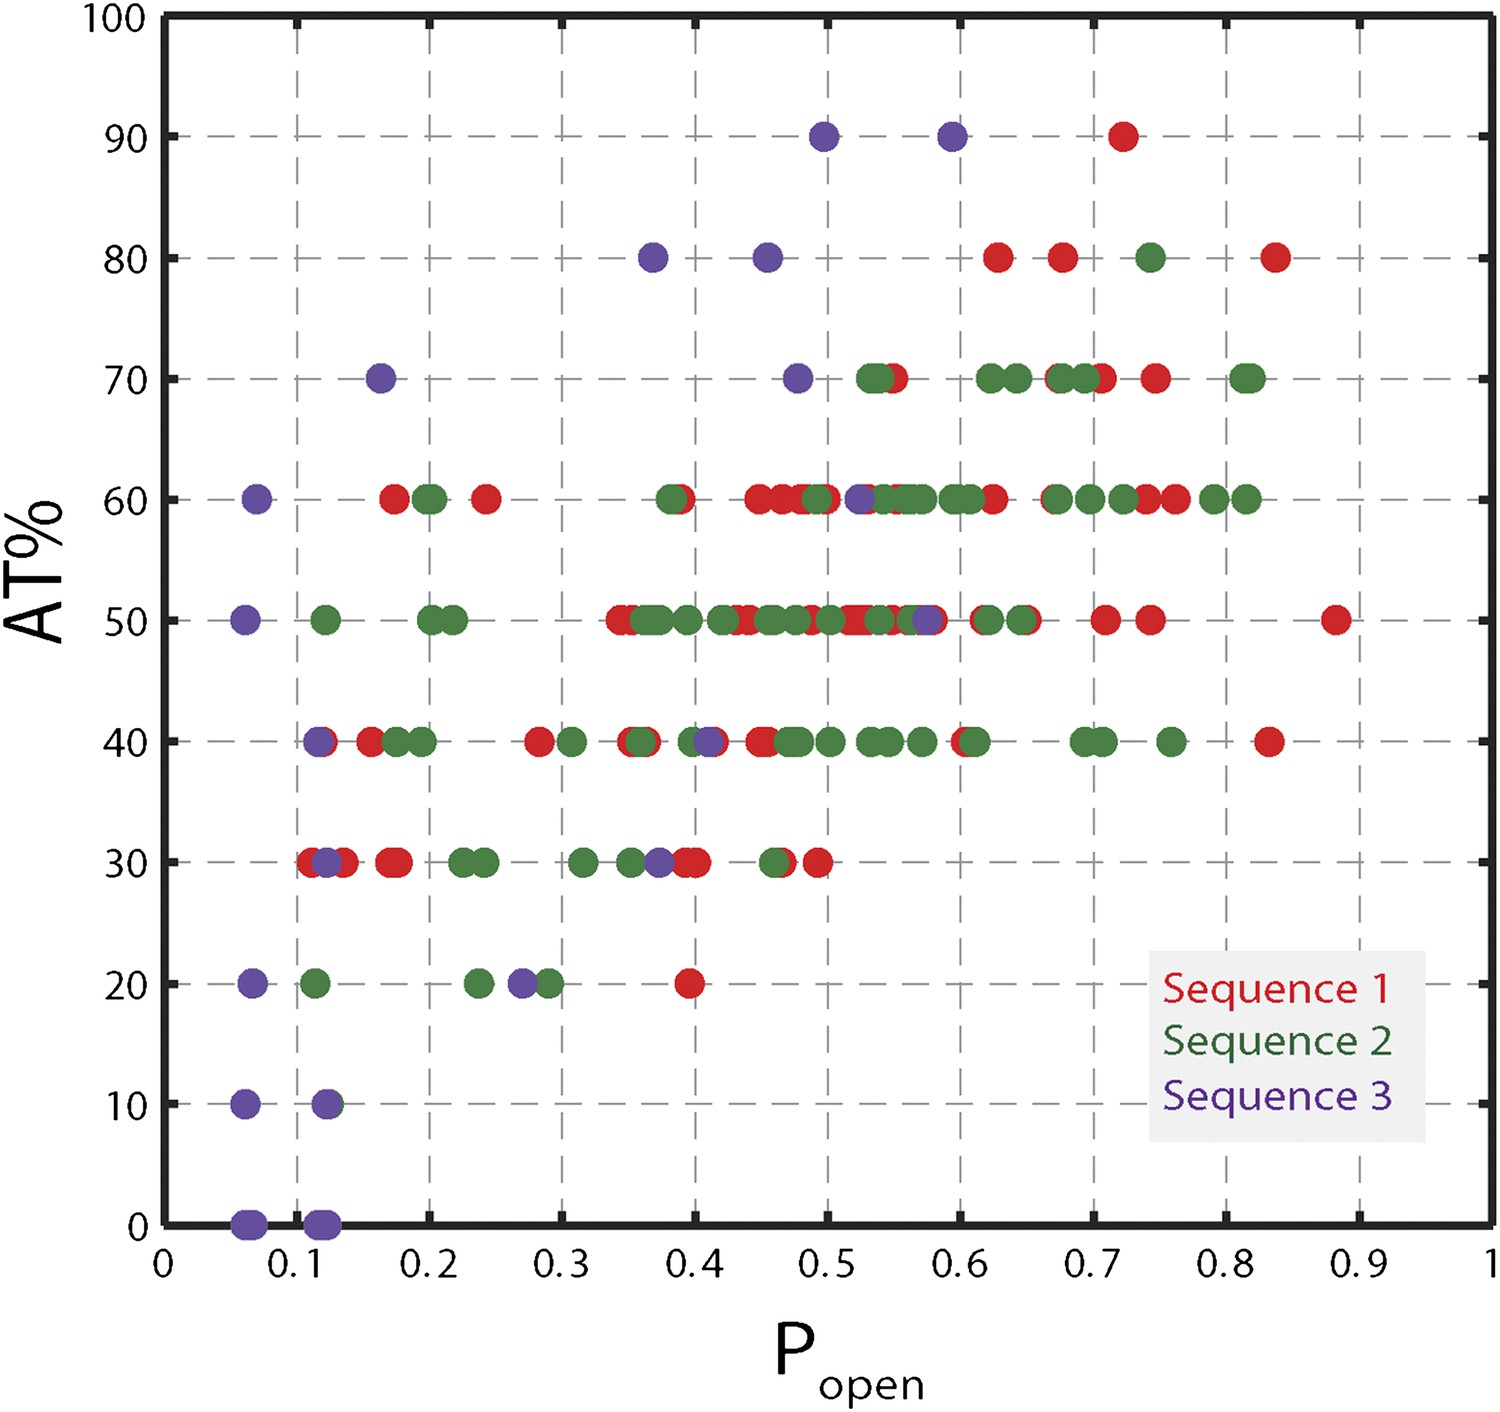
Correlation between AT% and popen.
AT% vs Popen for sequence 1, 2, and 3. AT% was calculated over a window of 10 bp at each hairpin position (i.e. for position n, the value corresponded to the AT% over base pairs n to n + 9). Popen values were calculated for each hairpin position, as described in the text. Correlation coefficients are 0.50, 0.54, 0.97 for sequence 1, 2, and 3, respectively.
Figure 5—figure supplement 2
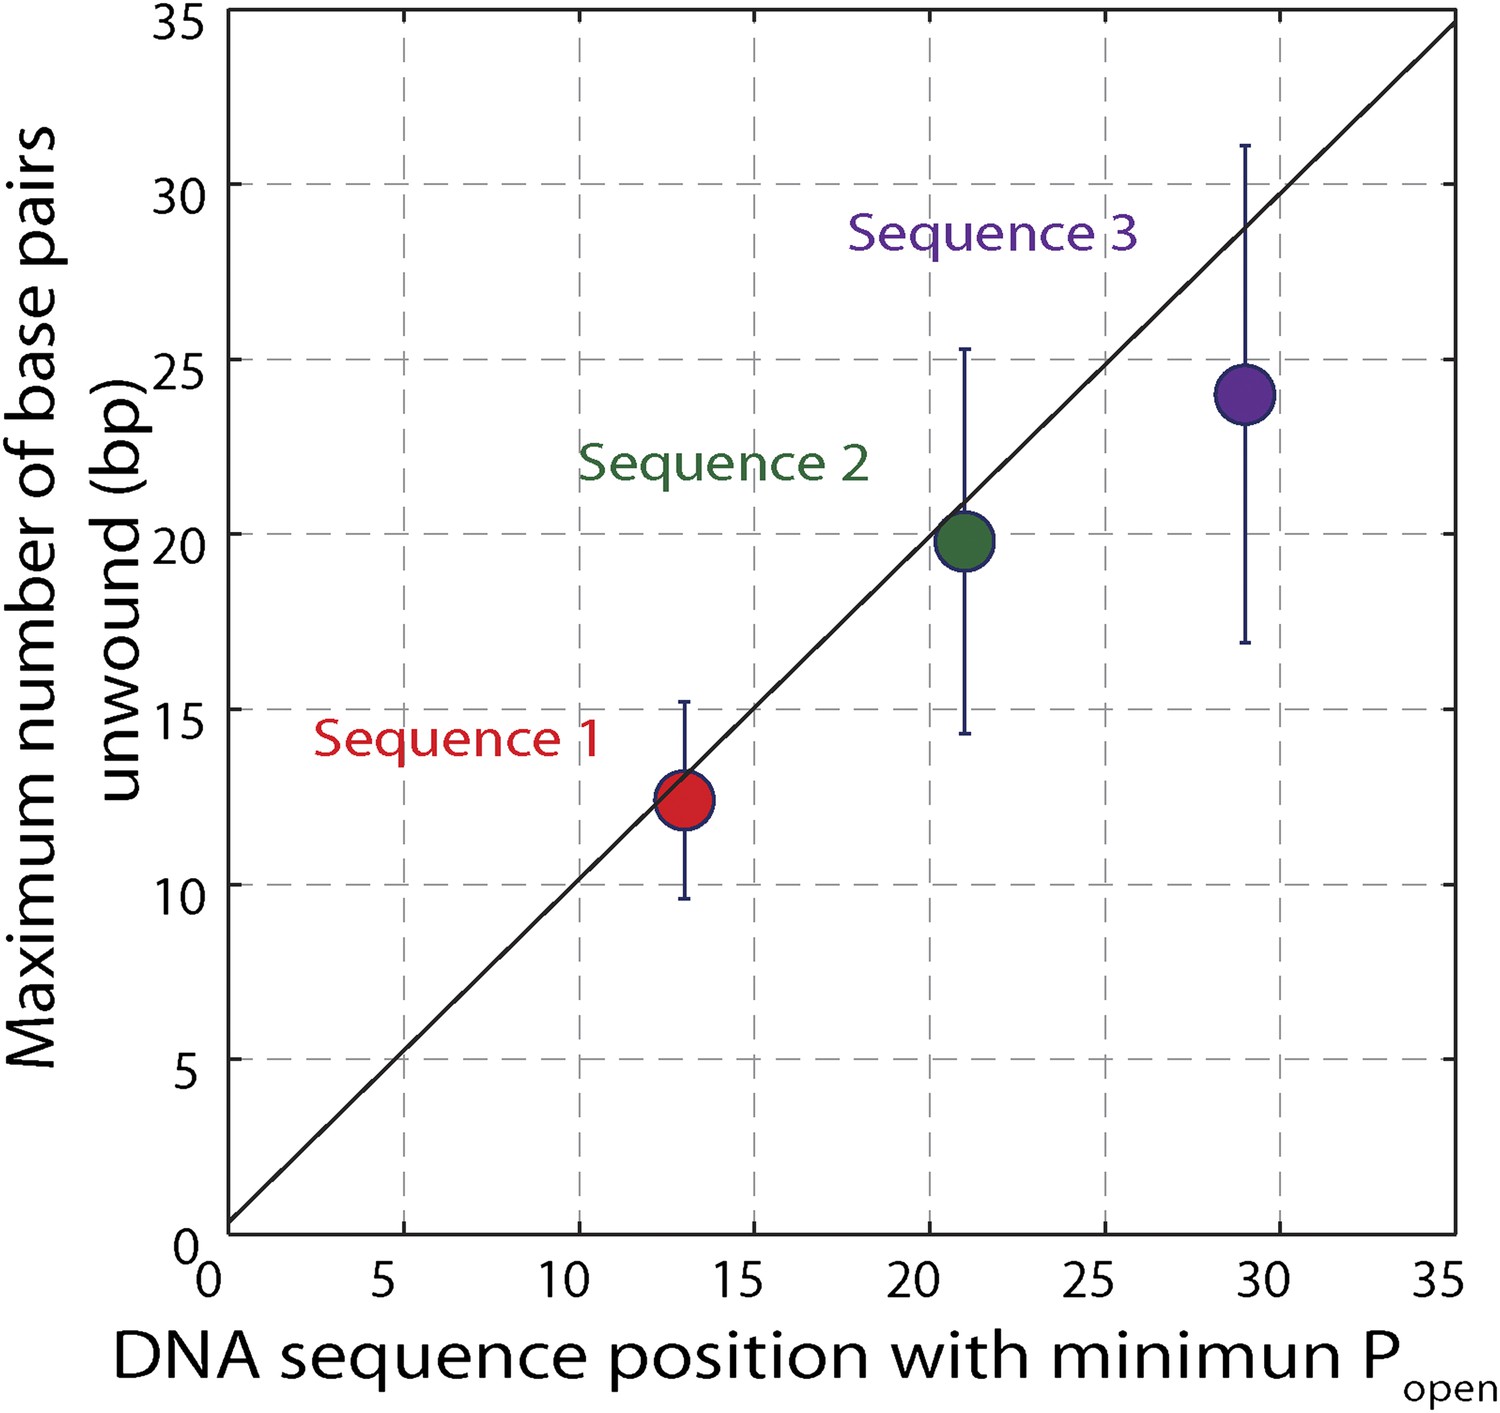
Effect of hairpin sequence on XPD helicase processivity.
Mean maximum number of base pairs unwound vs hairpin position with minimum opening probability Popen. The minimum Popen was ∼0.1. The data are from sequence 1 (red, N = 139 bursts), sequence 2 (green, N = 69 bursts), and sequence 3 (orange, N = 25 bursts) and demonstrate the correlation between processivity and low opening probability. Error bars denote SD.
Figure 5—figure supplement 3
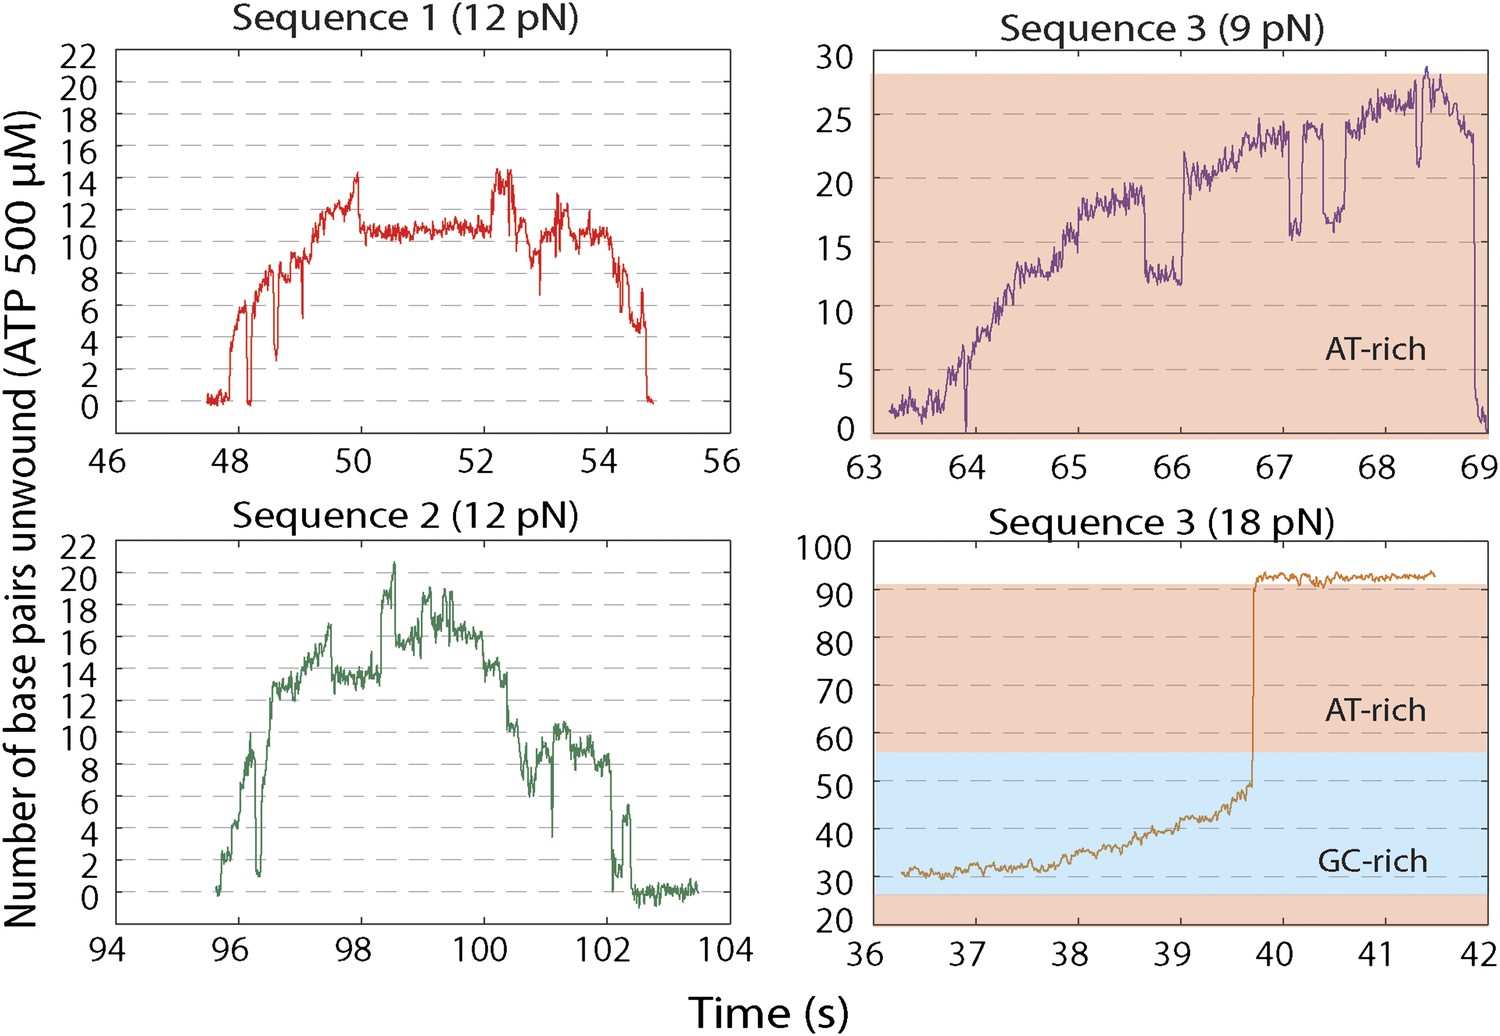
Representative XPD unwinding bursts for different sequences and forces.
(A) sequence 1 at 12 pN (red); (B) Sequence 2 at 12 pN (green); (C) Sequence 3 at 9 pN (purple); (D) Sequence 3 at 18 pN (orange). For sequence 3, the AT-rich and GC-rich portions of the hairpin that are unwound are denoted by the pink and cyan shaded areas, respectively.
Figure 5—figure supplement 4
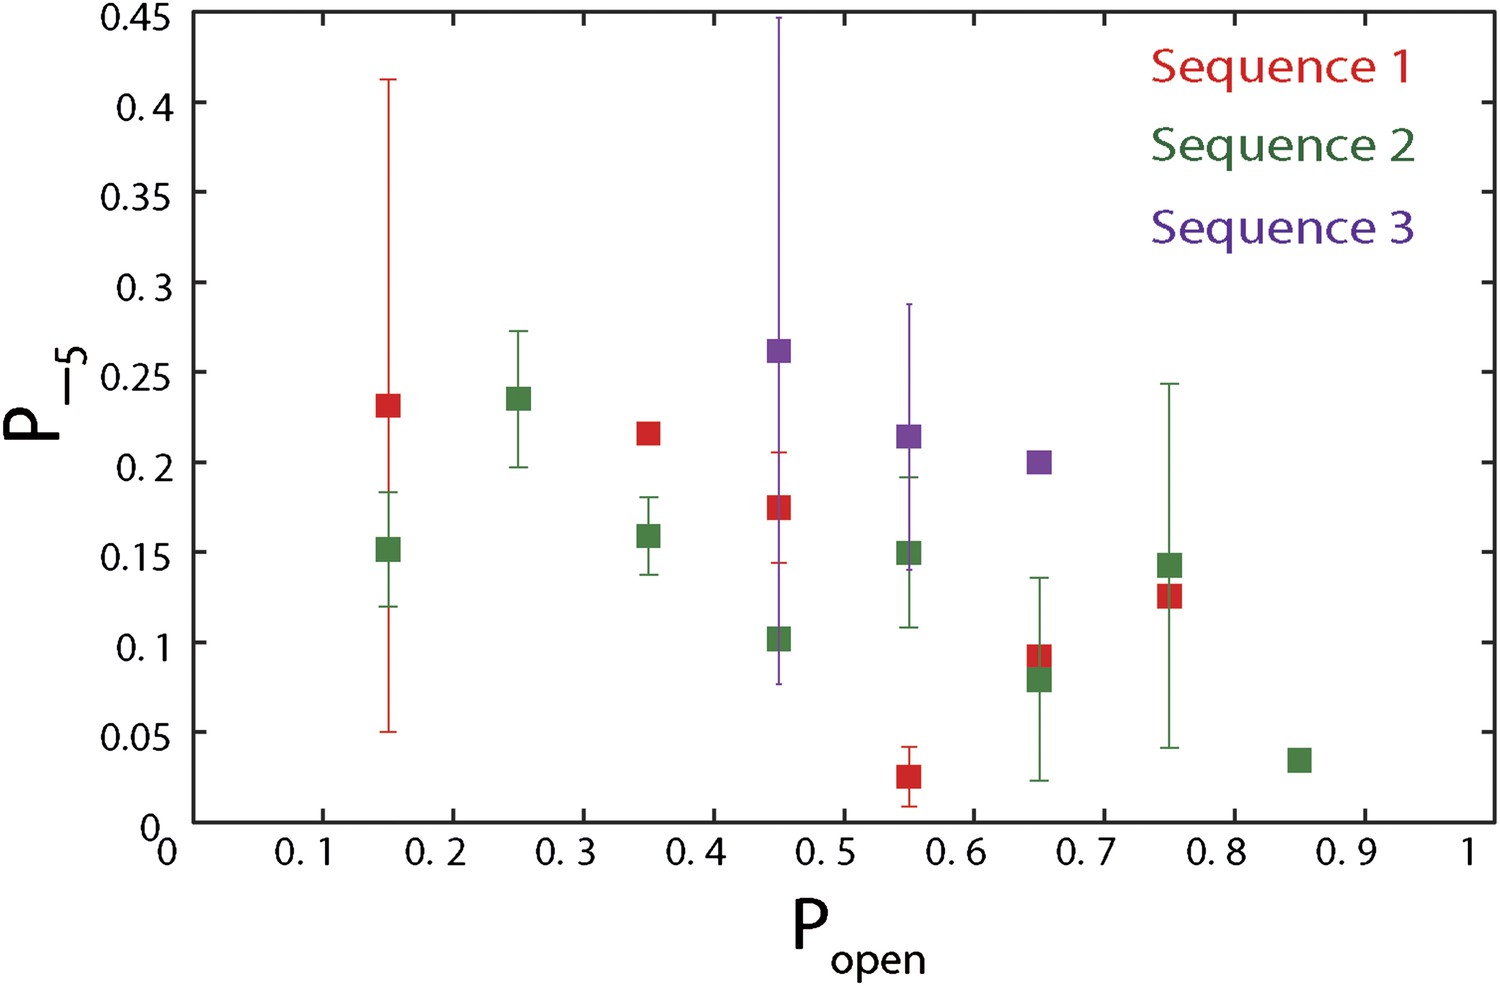
Dependence of large 5-bp backsteps on sequence.
Probabilities for taking large backsteps, P−5, vs hairpin fork opening probability Popen. Error bars denote SD.
Figure 5—figure supplement 5
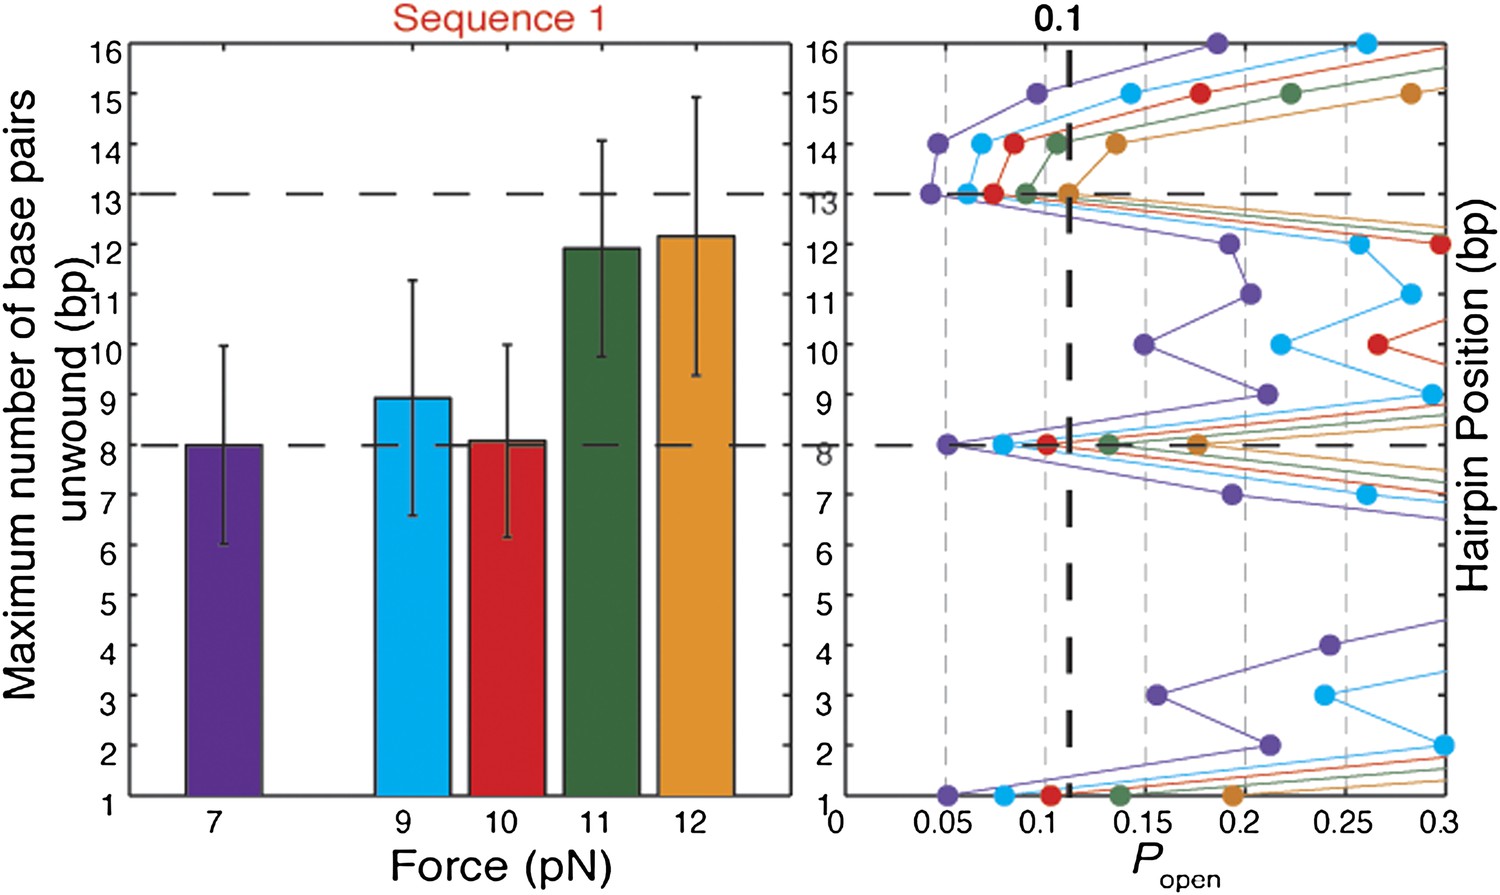
Effect of tension on XPD helicase processivity.
Maximum number of base pairs unwound (left) in hairpin sequence 1 at 7, 9, 10, 11, and 12 pN of force (N = 16, 20, 45, 72, and 144 bursts, respectively). Hairpin position vs hairpin opening probability Popen (right) at 7 (purple), 9 (blue), 10 (red), 11 (green), and 12 (orange) pN. The data indicate that the helicase stalls when Popen dips below ∼0.1. The dashed lines represent the position at which this threshold is crossed as a function of force. This theoretical prediction matches well with the measured processivity.
Figure 6 with 1 supplement
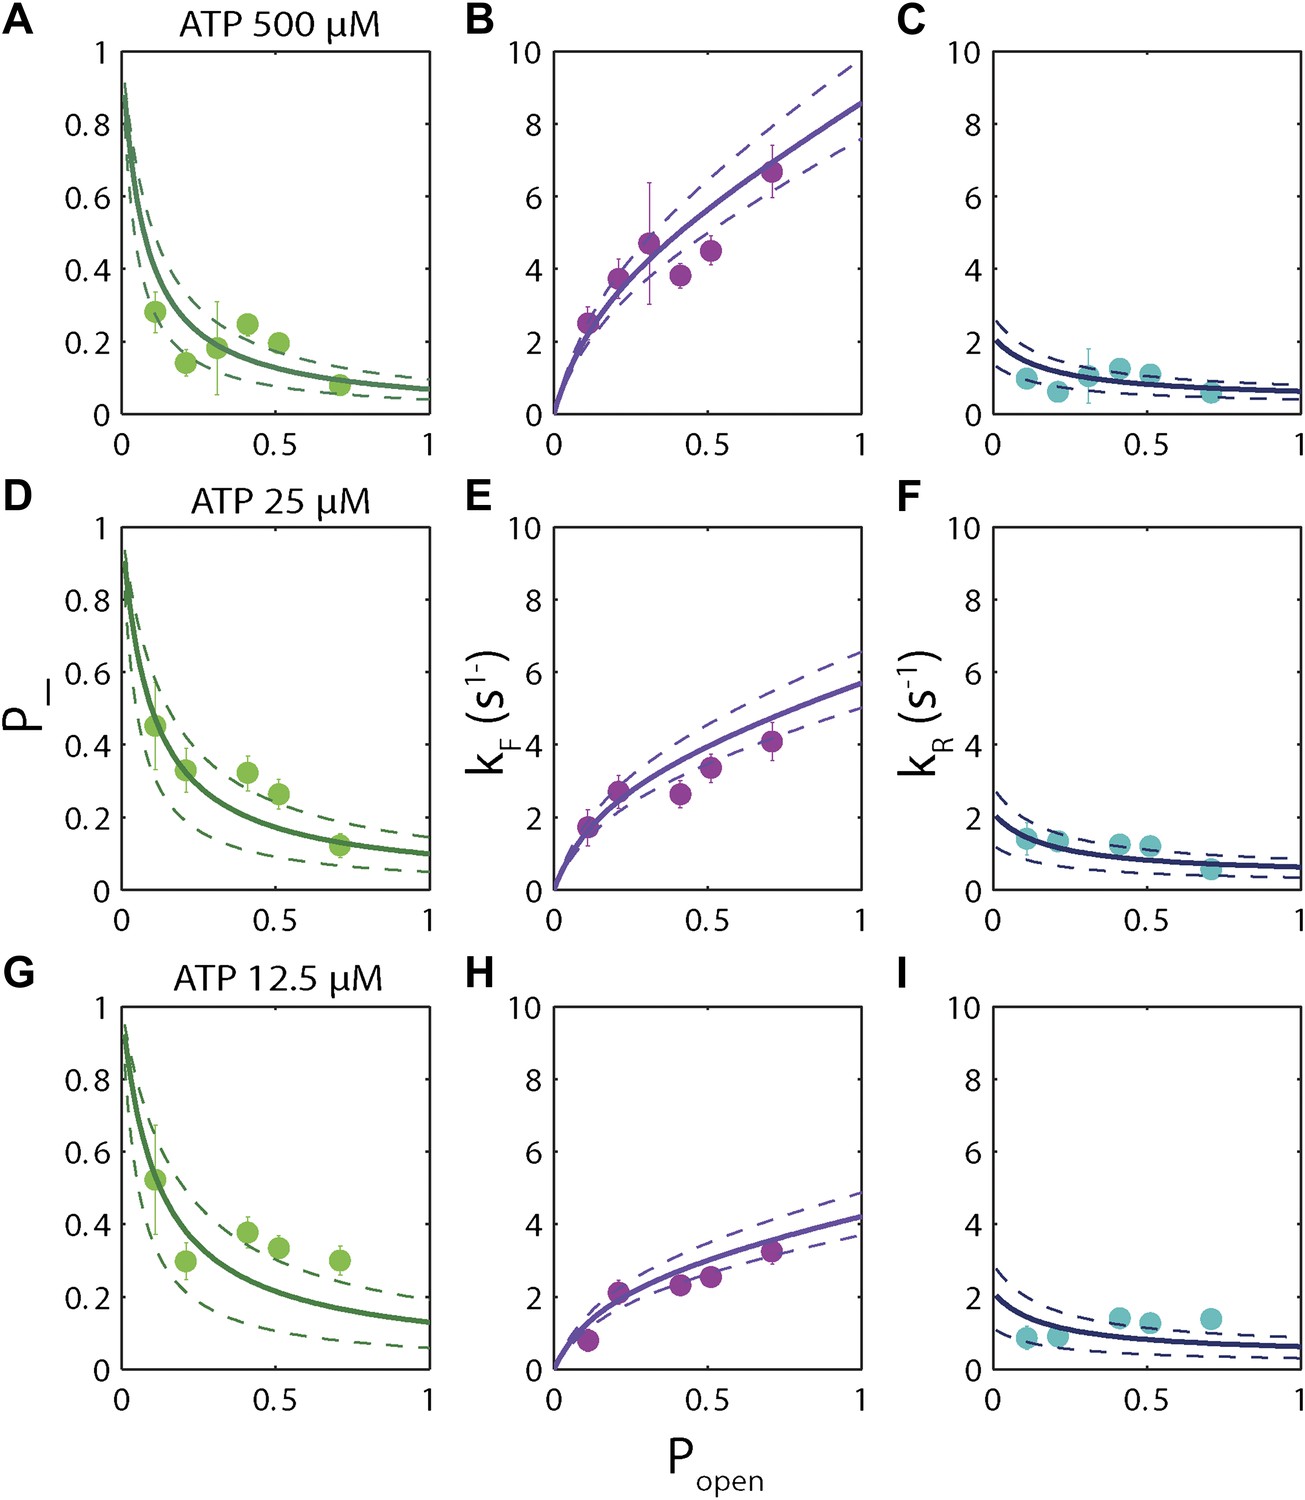
Dependence of kinetic parameters on DNA thermal opening probability.
(A) Backstepping probability p−, (B) Forward rate kF, and (C) reverse rate kR vs popen at [ATP] = 500 μM. The solid lines represent the global fit to the kinetic model described in the text and ‘Materials and methods’; dashed lines represent 95% confidence interval. The reduced χ2 value for the global fit to the data in panels (B), (C), (E), (F), (H) and (I) was 3.6. Error bars throughout denote SEM. (D–F) Same parameters at [ATP] = 25 μM. (G–I) Same parameters at [ATP] = 12.5 μM.
Figure 6—figure supplement 1
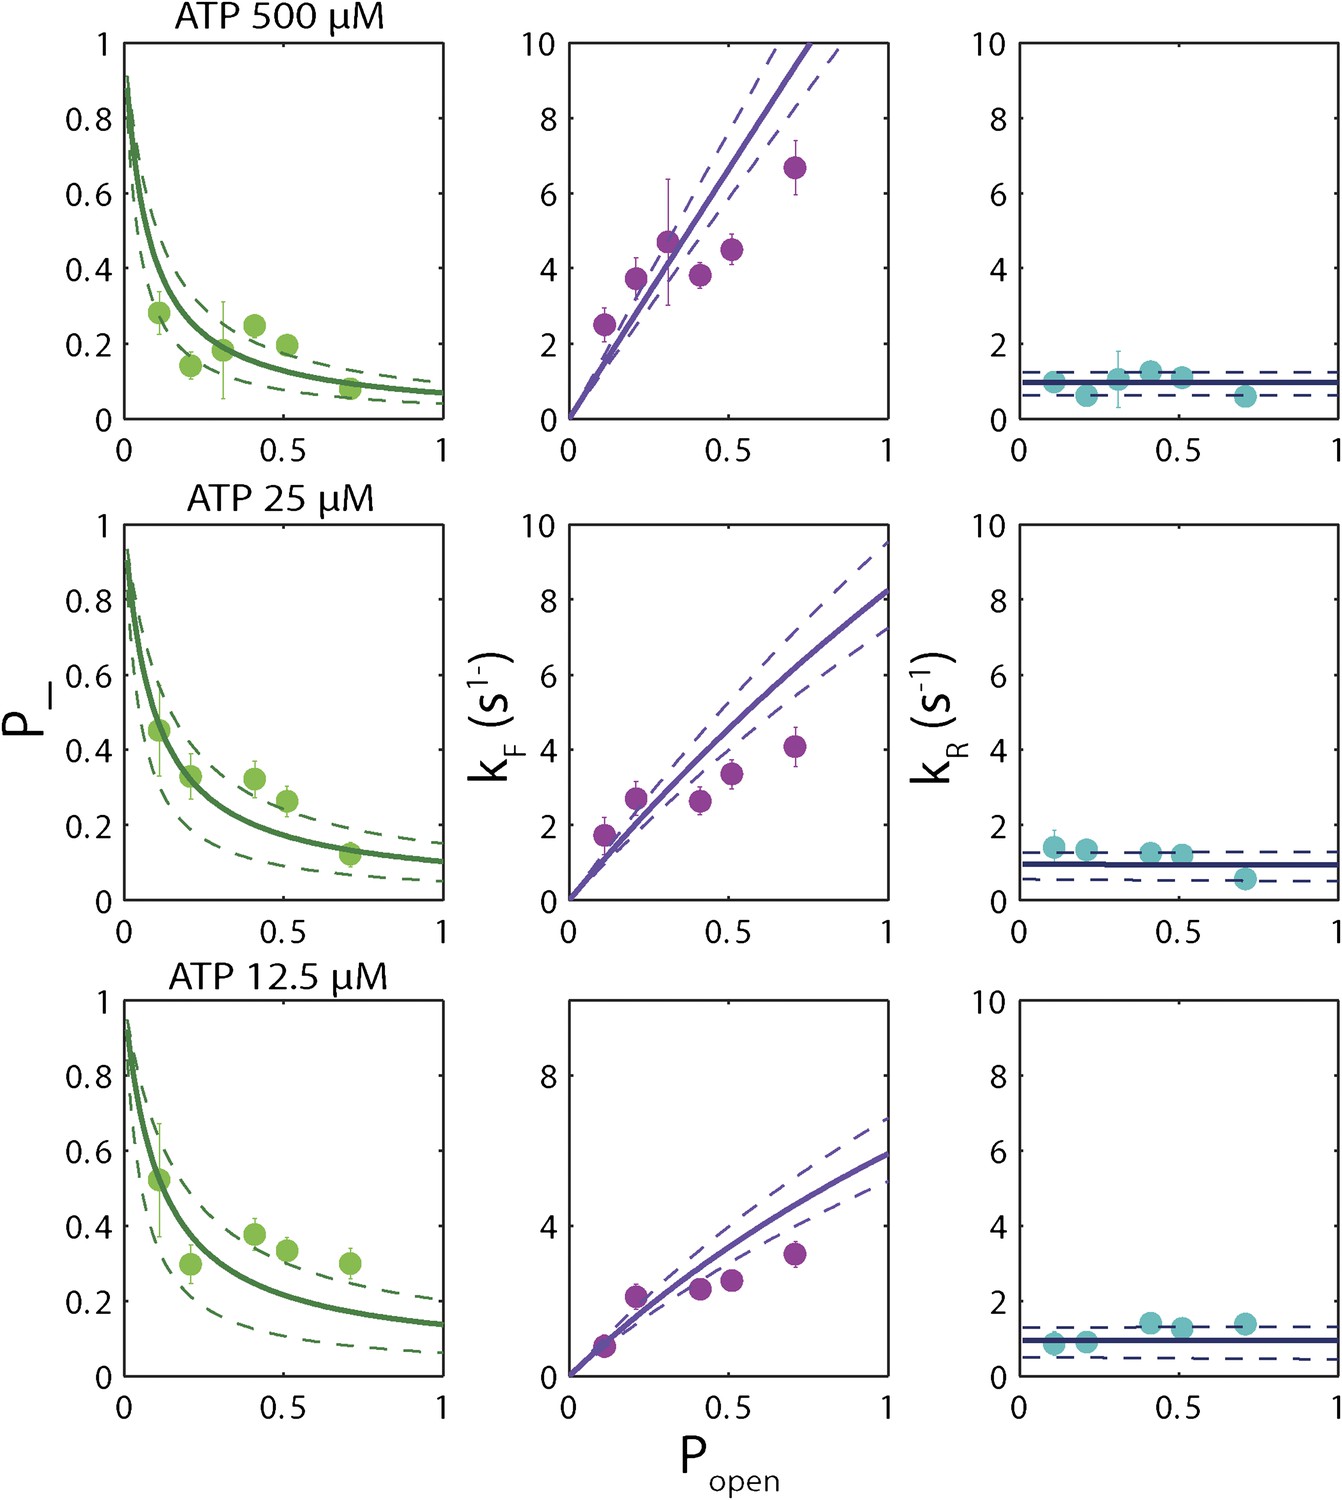
‘Strictly passive’ model fitting.
A strictly passive unwinding model used to fit the same data in Figure 6. The reduced χ2 value was 6.7, larger than that of 3.6 obtained with the model described in the text.
Figure 7 with 3 supplements
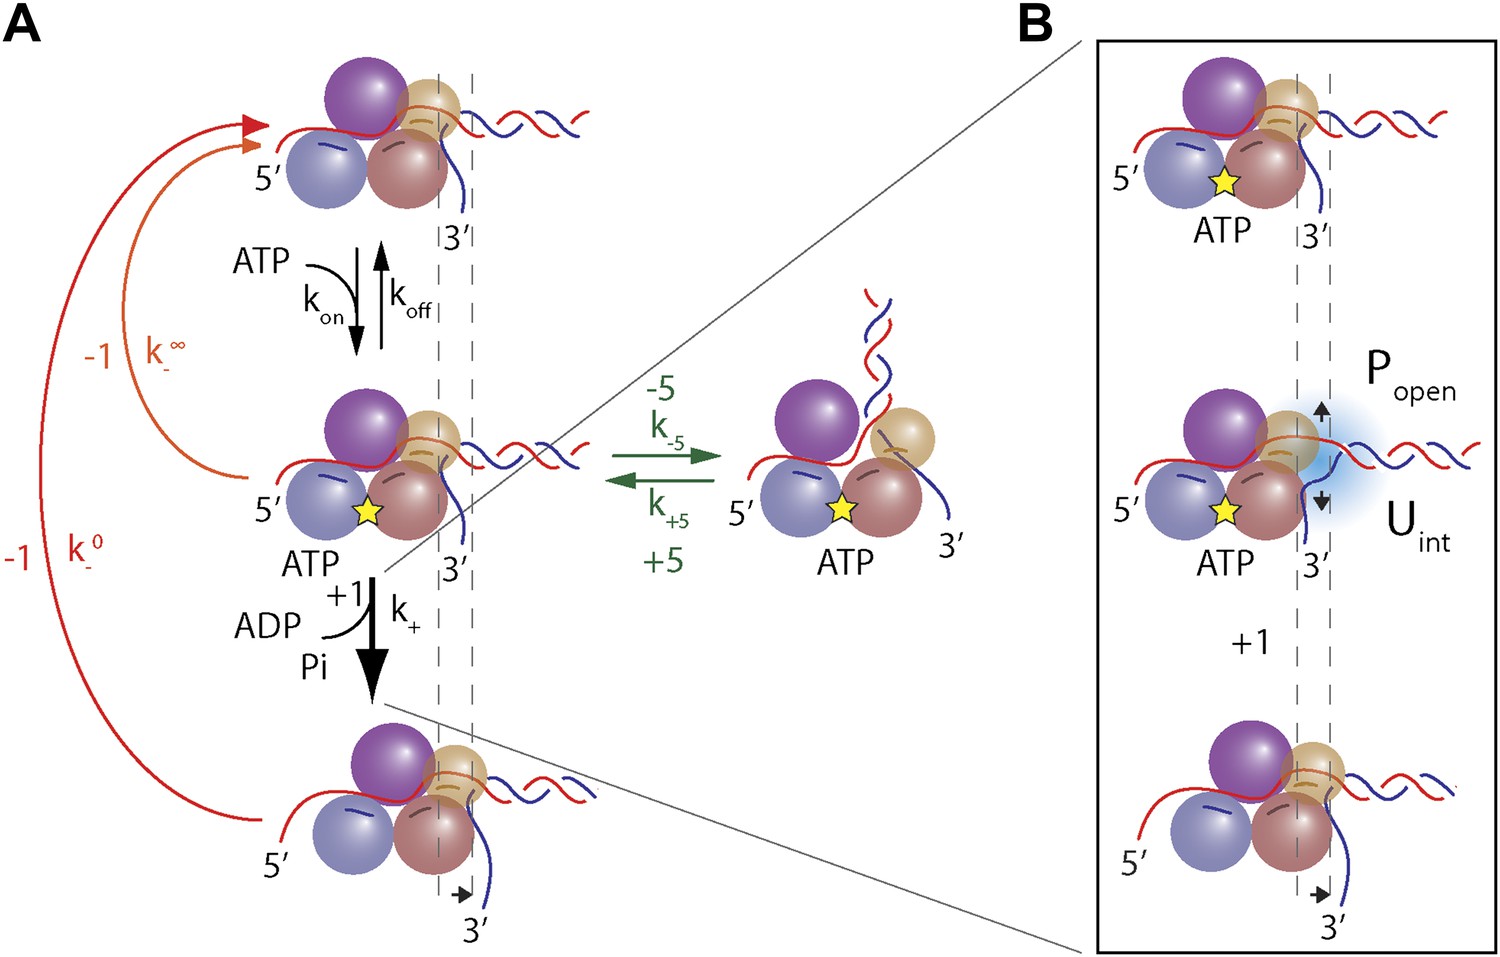
Model of XPD unwinding.
(A) Minimal kinetic scheme for XPD stepping and backstepping. The main mechanochemical pathway consists of two rate-limiting steps: ATP binding and 1-bp unwinding (black arrows). 1-bp backsteps occur while the helicase is in the apo state (red arrow), or in the ATP-bound state (orange arrow). Large 5-bp backsteps involve rearrangement of the nucleo-protein complex (green arrows). The thickness of the arrows schematically represents the probability for each pathway. (B) Mechanism of duplex unwinding. Although XPD helicase has a destabilizing effect on the fork, unwinding depends strongly on spontaneous opening of the duplex. See main text and ‘Materials and methods’ for details.
Figure 7—figure supplement 1
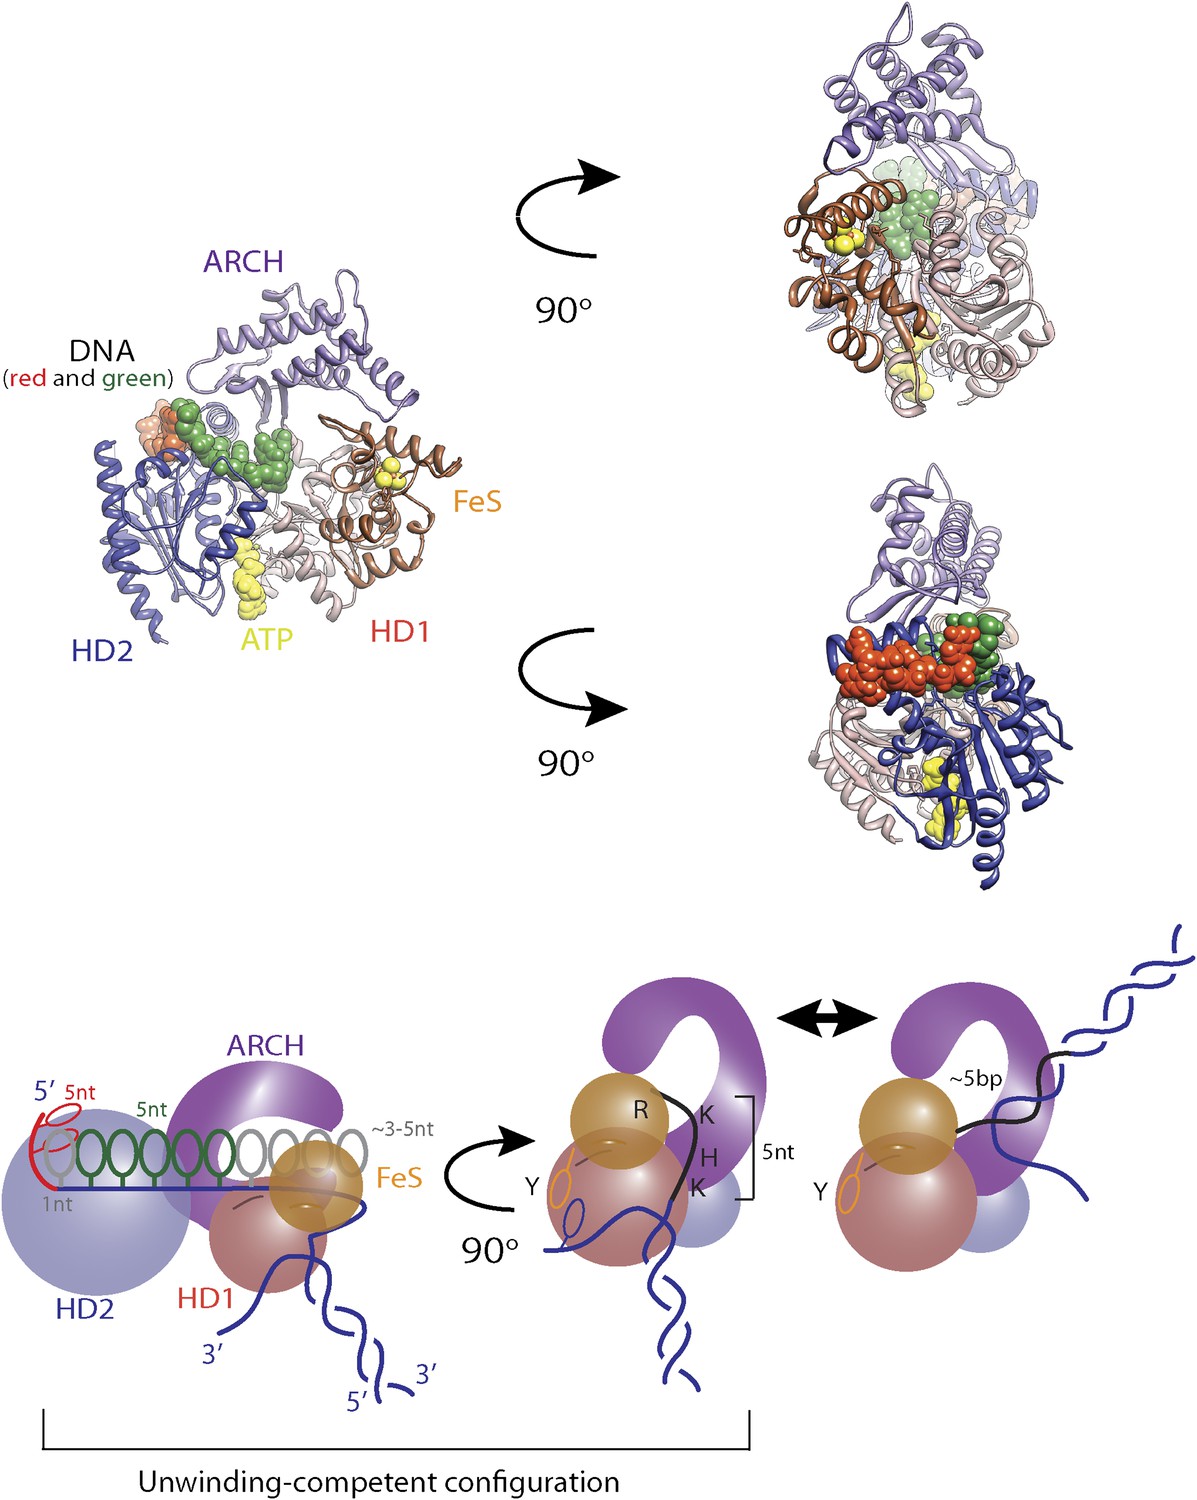
Structural model for regulatory secondary ssDNA binding site and large −5-bp backsteps.
Structure of XPD (PDB 4a15) with a 5-nt ssDNA fragment (elemental colors) bound to the non-canonical site on the HD2. In contrast to some SF2 helicases, the DNA binding site of XPD is longer and includes a regulatory secondary site. From the structural overlap between this XPD structure and that of a related SF2 helicase (Vasa DEAD-box RNA helicase bound to ssRNA, PDB 2db3), one can extend the ssDNA into HD2 up to its interface with HD1 (green) by an additional 5 nt (plus 1 nt between the two ssDNA fragments). The ssDNA is expected to lie along the top surface of HD1 through the opening under the ARCH. There is a space for additional 3–5 nt, for a total of ∼10 nt bound to the motor core, longer than expected from known SF2 structures. A secondary binding site on the back can accommodate ∼5 nt between the aperture of the hole and the wedge structure that splits the duplex. We propose that those 5 nt snap back to reform the duplex during the 5-bp backsteps.
Figure 7—figure supplement 2
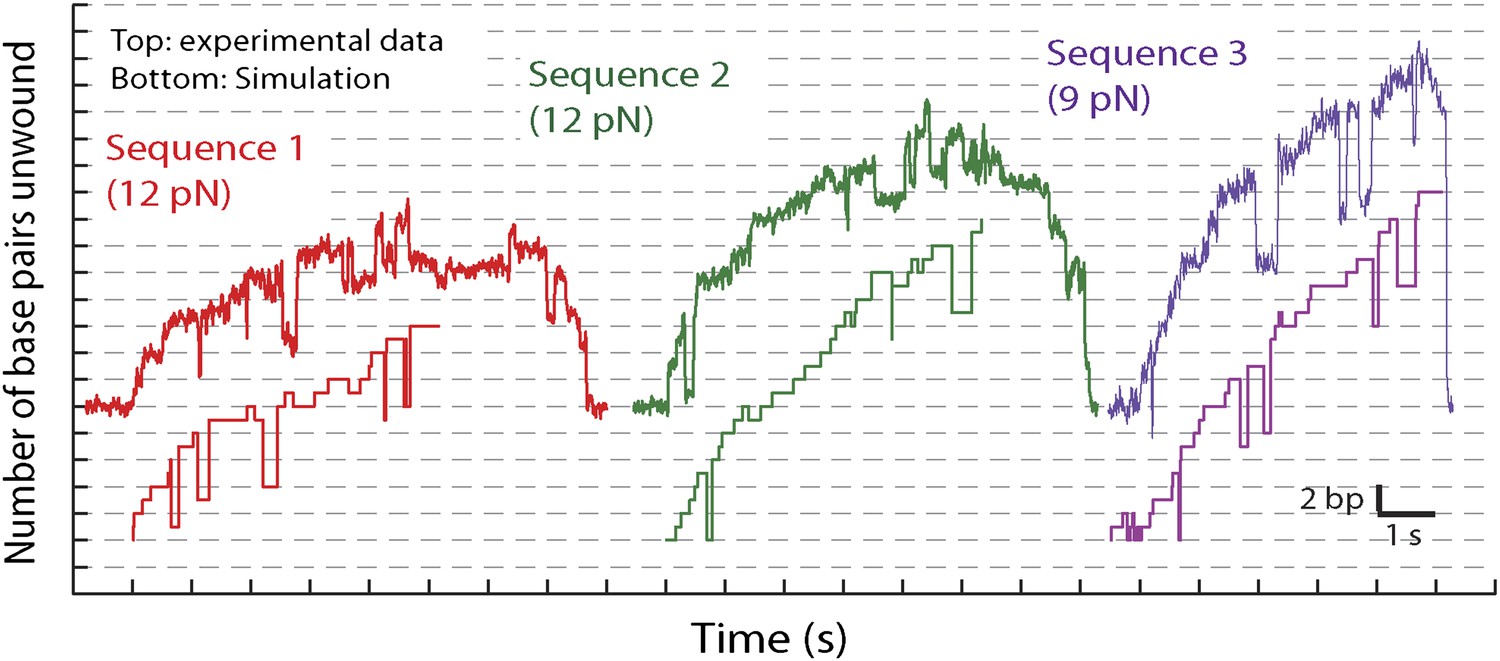
Representative traces and stochastic simulations of single XPD unwinding.
The kinetic model described in the text (see ‘Materials and methods’ and Table 2) was used to simulate single-XPD unwinding. Shown are representative data time traces and corresponding simulated traces for three conditions: sequence 1 at 12 pN (red), sequence 2 at 12 pN (green), and sequence 3 at 9 pN (purple). The ATP concentration is 500 μM.
Figure 7—figure supplement 3
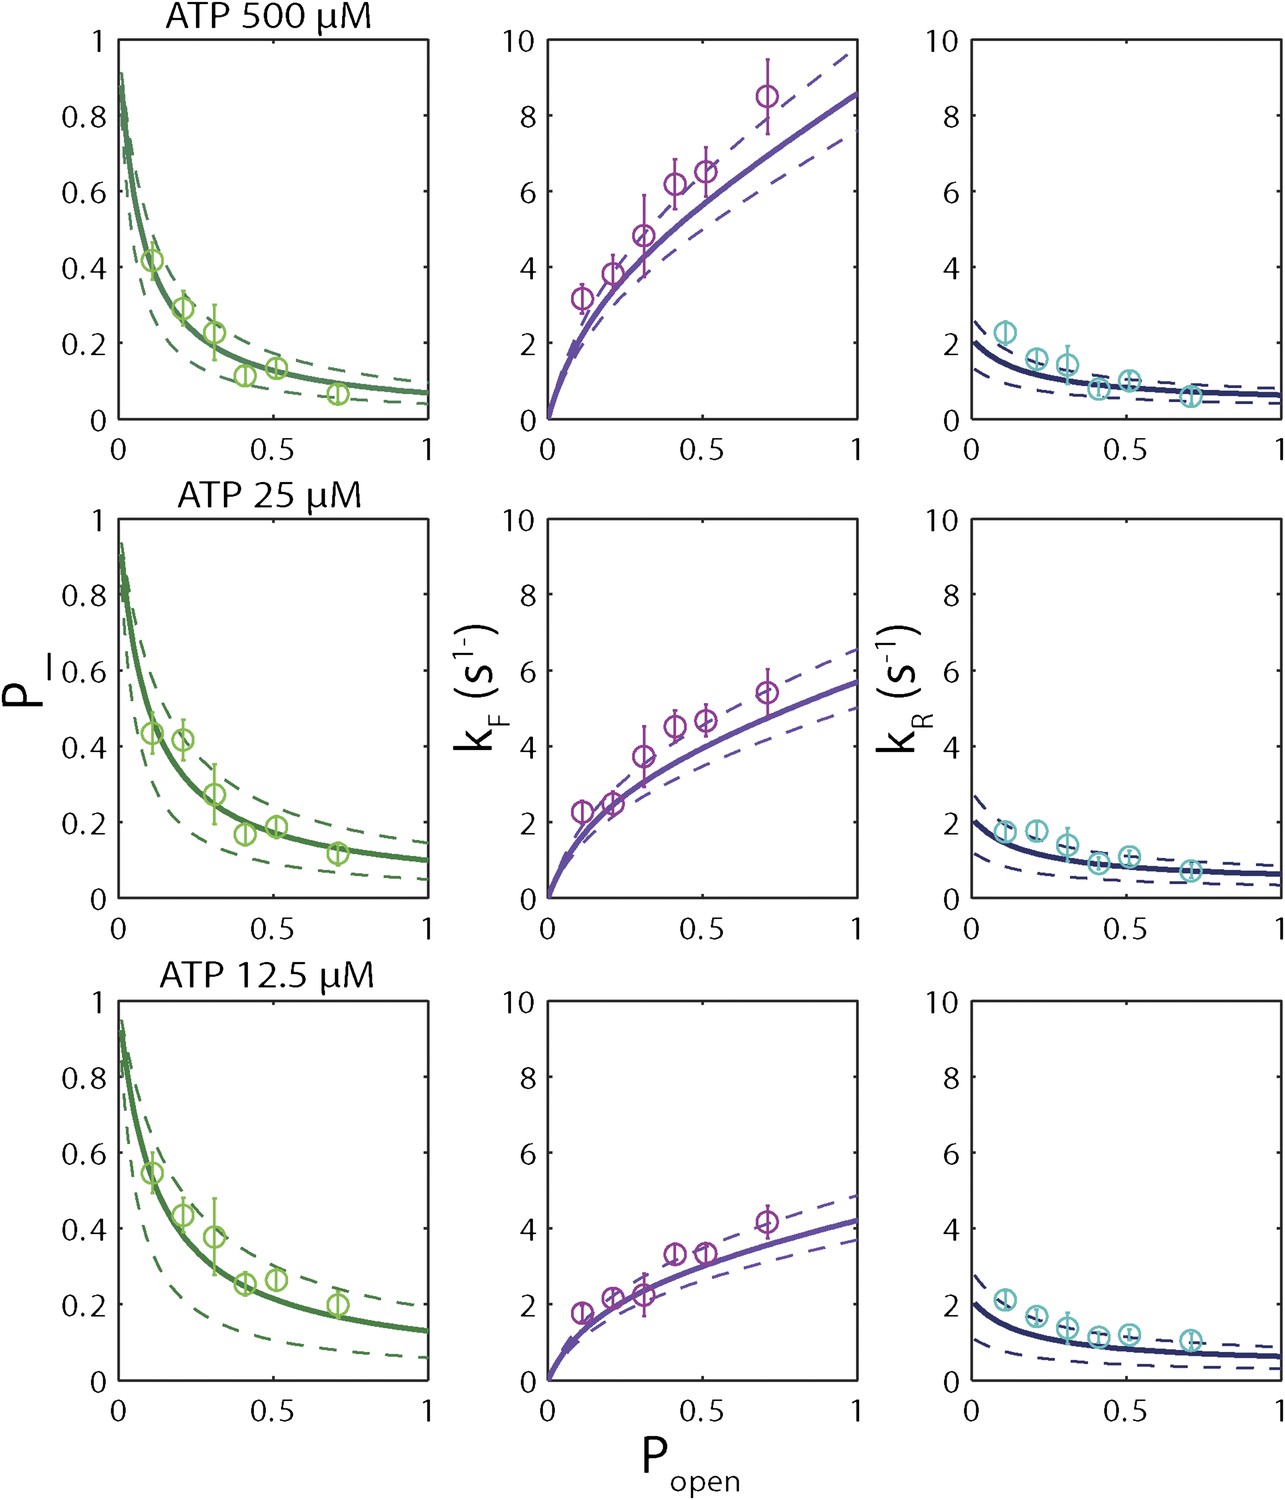
Sequence dependence of simulated unwinding traces.
Simulated single-XPD unwinding traces (open circles; see ‘Materials and methods’) were analyzed in the same manner as the data in Figure 6A–I. The solid lines represent the global fit to the kinetic model described in the text. Simulations were performed under the same conditions as the data (sequence 1 at 12 pN; [ATP] = 500, 25, and 12.5 μM).
Tables
Table 1
Summary of experimental data*
| Sequence | 1 | 1 | 1 | 1 | 1 | 1 | 2 |
| ATP [µM] | 6.25 | 12.5 | 25 | 50 | 250 | 500 | 12.5 |
| No. of traces | 5 | 50 | 31 | 13 | 12 | 40 | 11 |
| Total No. of bursts | 13 | 118 | 82 | 40 | 41 | 144 | 28 |
| Burst / trace | 2.0 ± 0.4 | 2.0 ± 0.3 | 2.6 ± 0.3 | 3.1 ± 0.4 | 3.7 ± 0.6 | 3.6 ± 0.5 | 4.7 ± 0.9 |
| Mean processivity (bp)† | 11 ± 2 | 11 ± 2 | 12 ± 3 | 13 ± 2 | 12 ± 3 | 12 ± 3 | 21 ± 6 |
| No. of bursts for PWD (%)‡ | 8 (61.5) | 58 (49.2) | 36 (43.9) | 11 (27.5) | 4 (9.8) | 48 (33.3) | 12(42.9) |
| No. of bursts for stepfitting§ | 11 | 64 | 70 | 17 | 16 | 126 | 12 |
| Total No. of steps | 186 | 827 | 1022 | 179 | 207 | 1612 | 559 |
| Non-fitting points (%) | 4.7 | 3.1 | 5.7 | 4.0 | 6.3 | 6.2 | 5.2 |
| No. of 1-bp steps# | 115 | 522 | 646 | 94 | 101 | 845 | 332 |
| Dwell time (ms)¶ | 370 ± 35 | 274 ± 12 | 212 ± 8 | 201 ± 21 | 183 ± 18 | 178 ± 6 | 281 ± 14 |
| Step size (bp)** | 1.1 ± 0.4 | 1.1 ± 0.5 | 1.1 ± 0.5 | 0.8 ± 0.2 | 1.1 ± 0.5 | 1.0 ± 0.4 | 0.9 ± 0.3 |
| No. of +1/+1 bp step pairs# | 54 | 271 | 351 | 62 | 69 | 643 | 169 |
| No. of +1/−1 bp step pairs# | 23 | 104 | 129 | 13 | 11 | 88 | 74 |
| No. of −1/+1 bp step pairs# | 26 | 99 | 117 | 7 | 15 | 87 | 62 |
| No. of −1/−1 bp step pairs# | 12 | 48 | 49 | 12 | 6 | 27 | 27 |
| No. of large steps# | 17 | 72 | 70 | 22 | 23 | 155 | 18 |
| Dwell time (ms)¶ | 158 ± 38 | 150 ± 18 | 149 ± 18 | 162 ± 34 | 139 ± 29 | 127 ± 10 | 132 ± 29 |
| Backstep size (bp)** | −4.5 ± 0.8 | −4.6 ± 1.1 | −4.5 ± 0.7 | −4.7 ± 0.8 | −5.0 ± 1.0 | −4.6 ± 0.9 | −3.8 ± 0.6 |
| Forward step size (bp)** | 4.0 ± 1.0 | 4.3 ± 0.9 | 4.5 ± 0.9 | 4.7 ± 1.1 | 4.5 ± 0.8 | 4.4 ± 0.9 | 3.6 ± 0.4 |
-
*
All data from hairpin “sequence 1” containing a 10-nt helicase binding site (see ‘Materials and methods’) at a 12 pN force.
-
†
Errors are SEM except where otherwise noted.
-
‡
Processivity is defined as the maximum number of base pairs unwound (mean ± SD).
-
§
A selection of bursts with low noise properties was used for PWD and step-fitting analysis (see ‘Materials and methods’).
-
#
Steps with size 0 ≤ d ≤ 2 were scored as +1-bp steps; −2 ≤ d ≤ 0 as −1-bp backsteps; 3 ≤ d ≤ 6 as large steps; −6 ≤ d ≤ −3 as large backsteps.
-
¶
Mean dwell times were determined by fitting dwell time histograms to an exponential (mean ± 95% confidence intervals).
-
**
Mean step sizes over the region of interest were determined by fitting step size histograms to a Gaussian (mean ± 95% confidence intervals).
Table 2
Summary of model parameters
| * | 0.67 ± 0.09† |
| (s−1) ‡ | 9.9 ± 1.0 |
| (s−1) ‡ | 0.7 ± 0.3 |
| (s−1) ‡ | 0.6 ± 0.5 |
| (s−1) ‡ | 6.8 ± 0.6 |
| (s−1) ‡ | 0.8 ± 0.2 |
| f | 0.36 |
| Uint (kBT) | 1.9 |
-
*
The global fit did not allow us to determine kon and koff individually. Instead, we estimated the ‘effective’ ATP binding rate constant .
-
†
Errors represent SD and were determined by bootstrapping.
-
‡
These rate constants represent the forward and backward translocation rate constants in the limit that popen = 1, that is, in the absence of a duplex to unwind.
Download links
A two-part list of links to download the article, or parts of the article, in various formats.
Downloads (link to download the article as PDF)
Open citations (links to open the citations from this article in various online reference manager services)
Cite this article (links to download the citations from this article in formats compatible with various reference manager tools)
Sequence-dependent base pair stepping dynamics in XPD helicase unwinding
eLife 2:e00334.
https://doi.org/10.7554/eLife.00334


