The ART-Rsp5 ubiquitin ligase network comprises a plasma membrane quality control system that protects yeast cells from proteotoxic stress
- Cornell University, United States
Figures
Figure 1 with 10 supplements
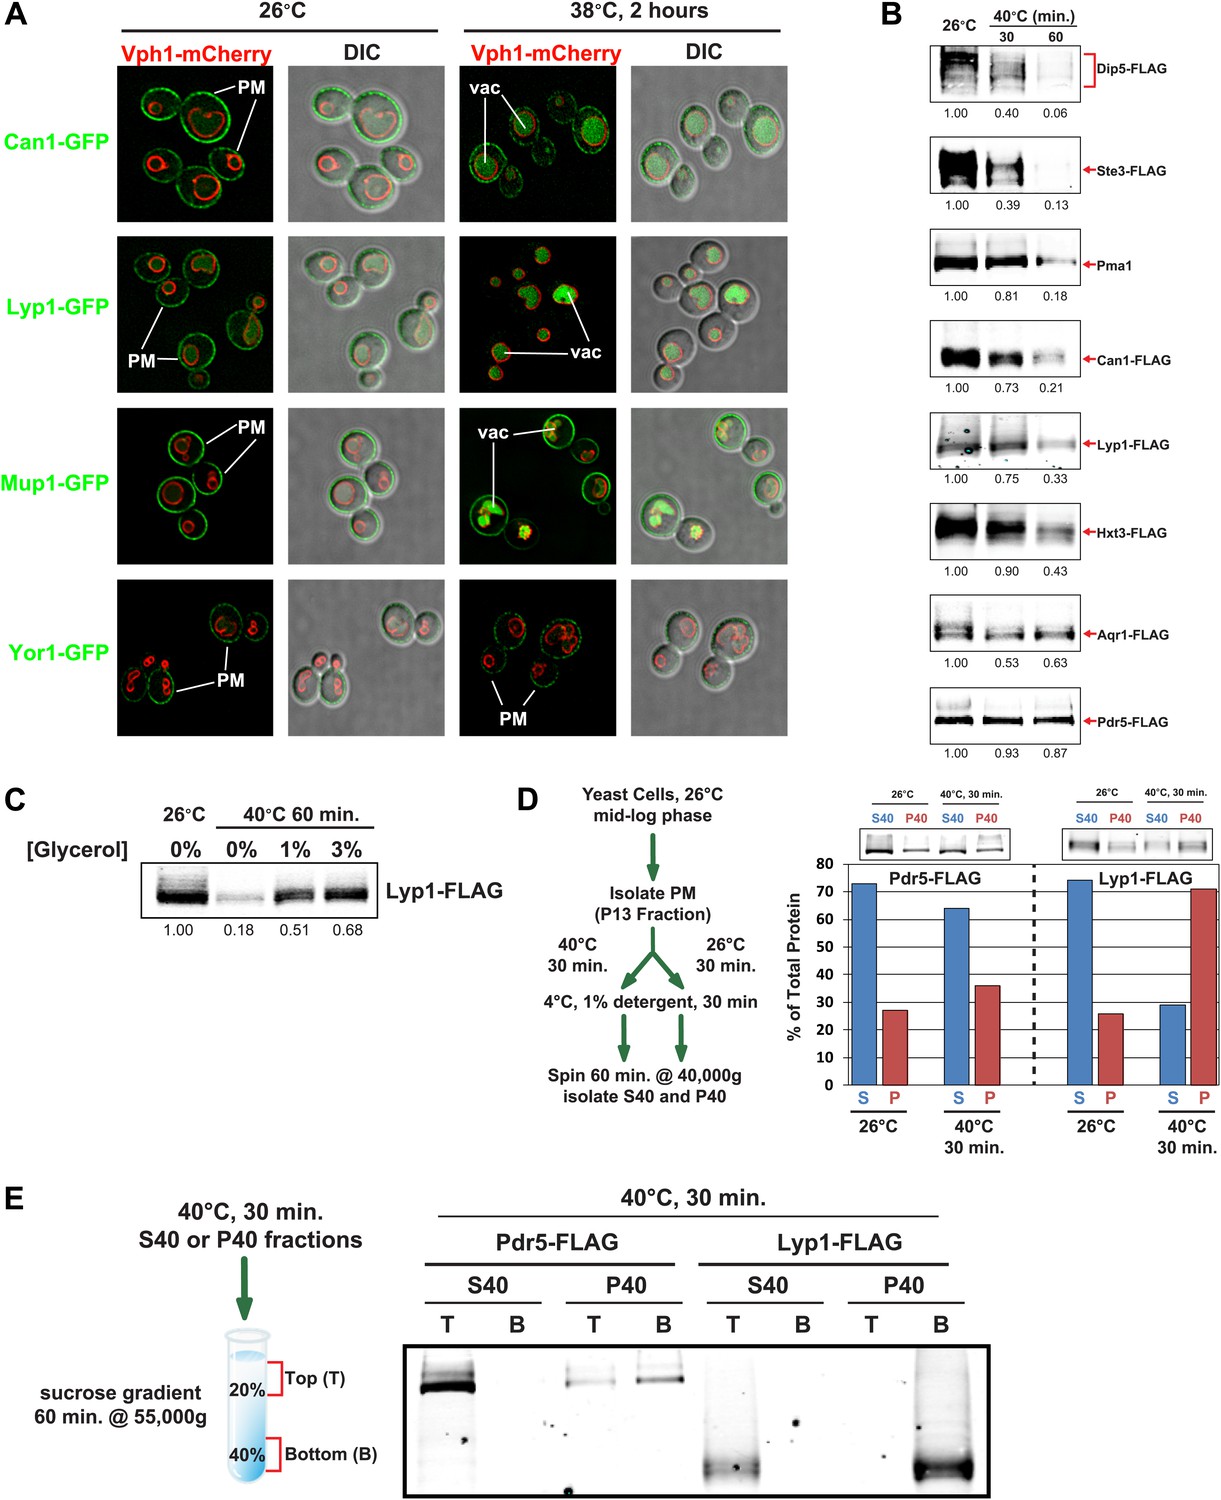
Heat stress triggers endocytic downregulation.
(A) Fluorescence distribution of GFP-tagged endocytic cargoes (green) was analyzed in wildtype yeast cells expressing the vacuolar marker Vph1-mCherry (red). Cells were grown to mid-log phase at 26°C (left panels) and then shifted to 38°C for 2 hr (right panels). Plasma membrane (‘PM’) and vacuole (‘vac’) localization are indicated. Note that the GFP moiety of cargo fusions resists hydrolysis and thus fluorescence signal accumulates in the vacuole even as the protein appears to be degraded as monitored by immunoblot. (B) Stability of affinity-tagged cargoes was analyzed following temperature shift from 26°C (left lane) to 40°C. The number beneath each lane indicates quantification of protein abundance (relative to 26°C, t = 0 and normalized to G6PDH as a loading control) determined using the Li-Cor system. (C) Analysis of heat-induced degradation of Lyp1 in the presence of glycerol, a chemical chaperone. (D) Detergent solubility of a thermostable cargo (Pdr5) and a thermolabile cargo (Lyp1) was analyzed at low and high temperature. A schematic representation for the experimental design is shown at the left. (E) Detergent soluble (S40) and insoluble (P40) fractions from membranes incubated at 40°C for 30 min were analyzed for mobility on sucrose step gradients. Top (T) fractions were immobile on the gradient, while bottom (B) fractions migrated through the gradient.
Figure 1—figure supplement 1
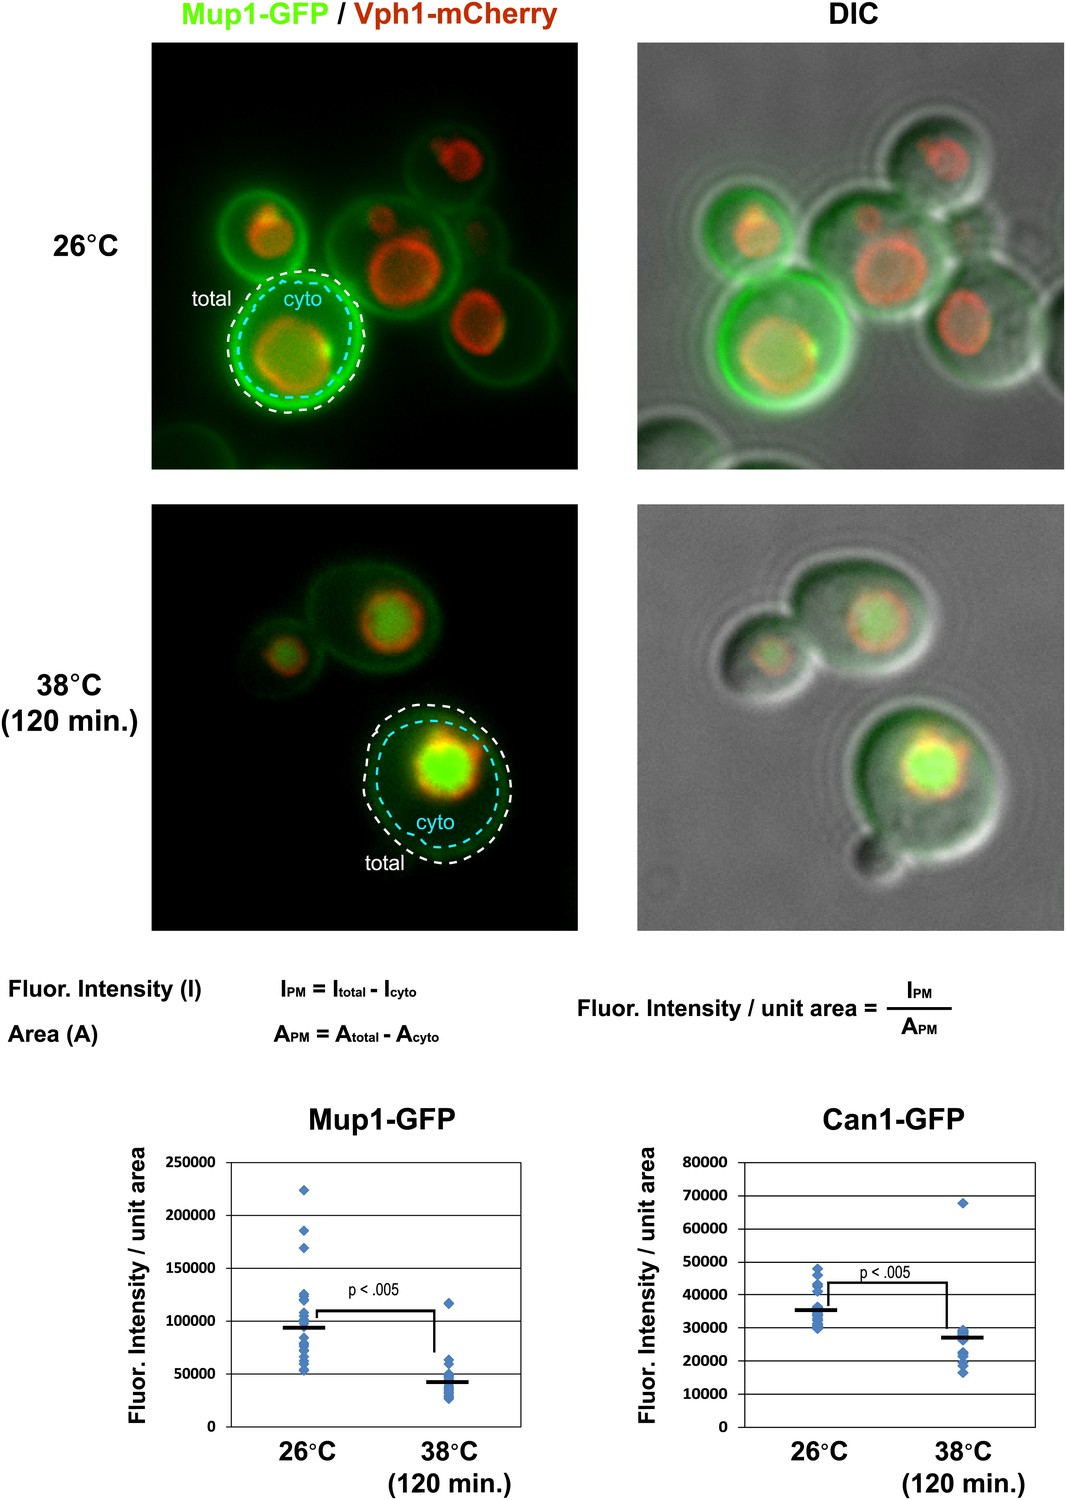
Cell surface fluorescence intensity was measured for Mup1-GFP and Can1-GFP following growth at 26°C or following a shift to 38°C for 2 hr.
Top panels illustrate how PM fluorescence intensity was measured and calculated and bottom panels depict fluorescence intensity measurements over many cells (n > 30 cells).
Figure 1—figure supplement 2
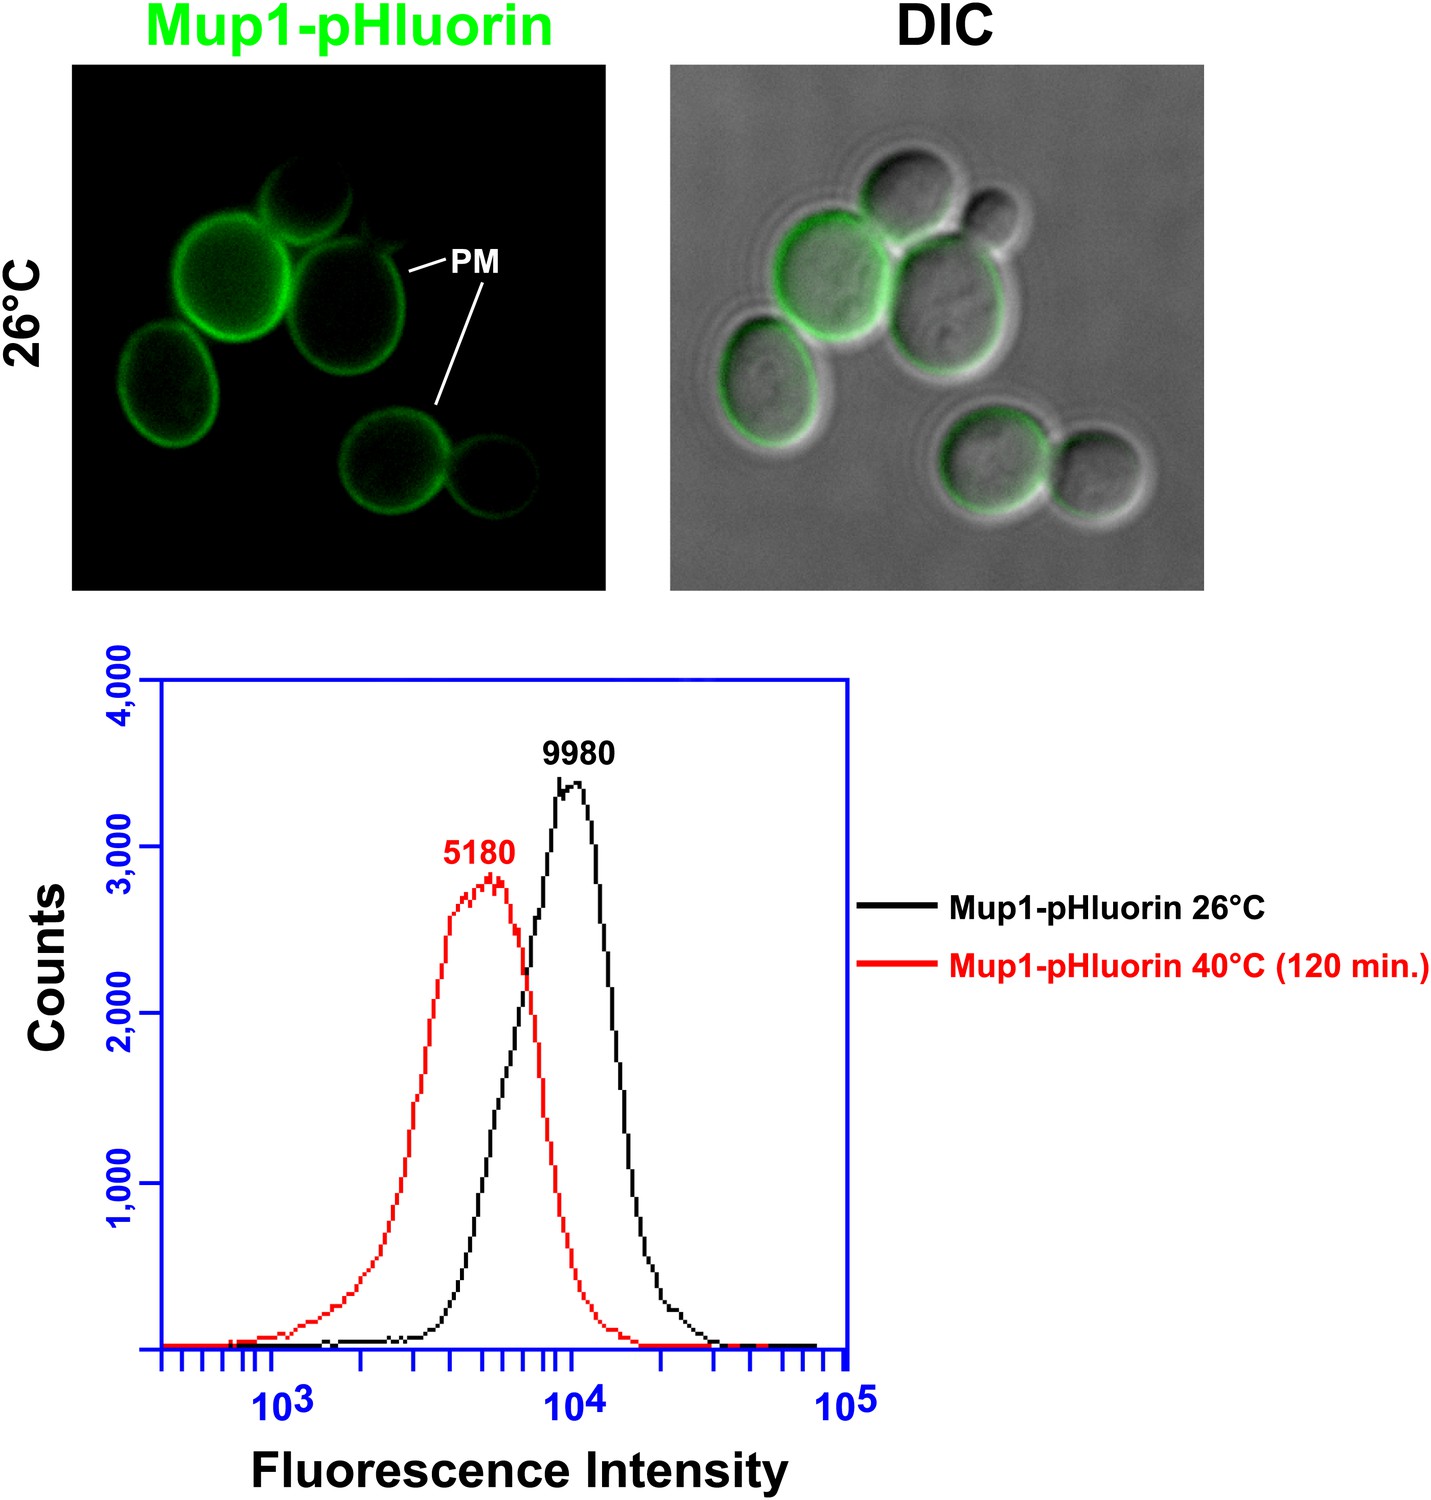
Mup1-pHluorin was used to quantify surface abundance of Mup1 for a population of yeast cells at 26°C or following a shift to 38°C for 2 hr (bottom panel).
Mup1 pHluorin signal originates almost exclusively from the PM (top panel).
Figure 1—figure supplement 3
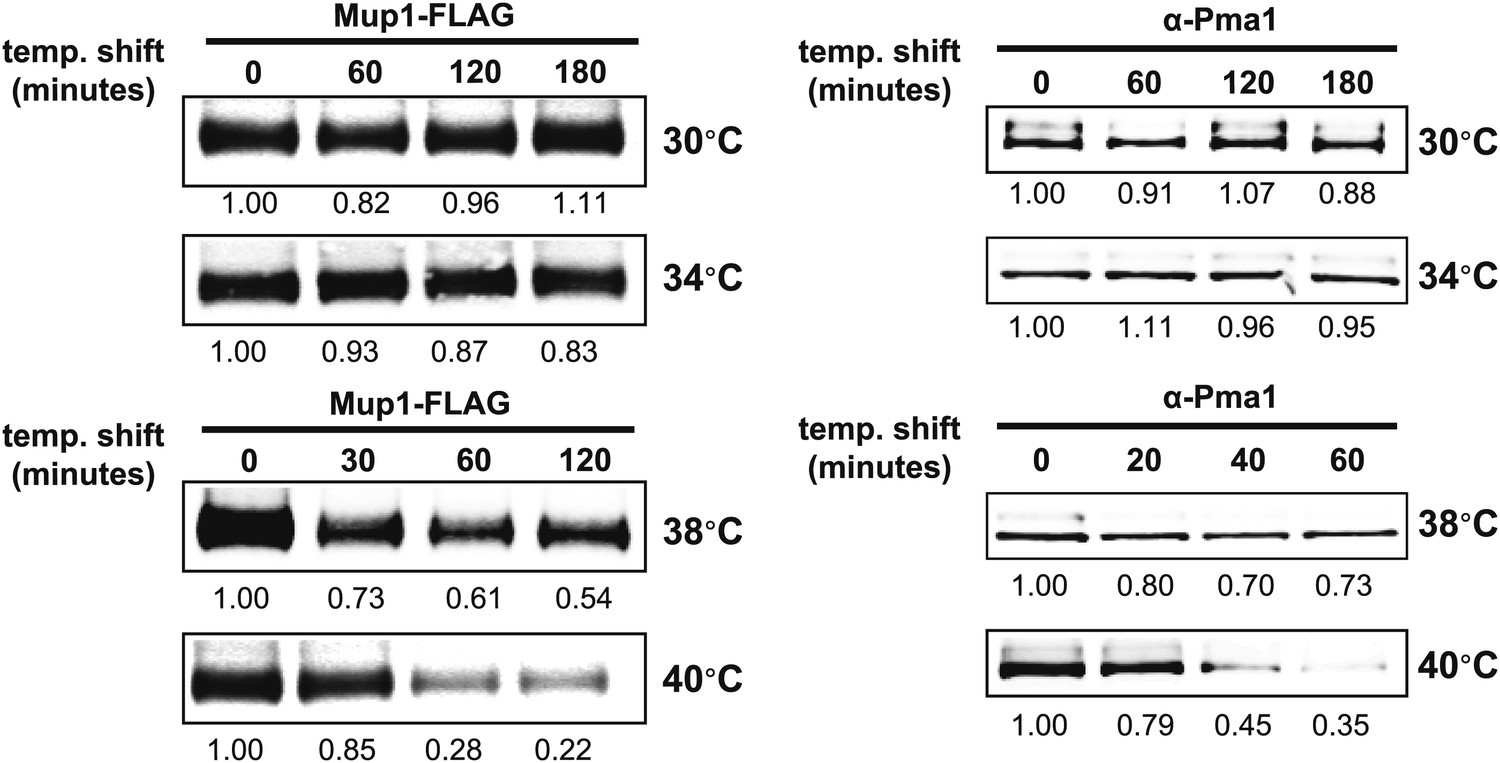
Stability of affinity-tagged Mup1 and Pma1 was analyzed following temperature shift from 26°C to indicated temperatures.
https://doi.org/10.7554/eLife.00459.006
Figure 1—figure supplement 4
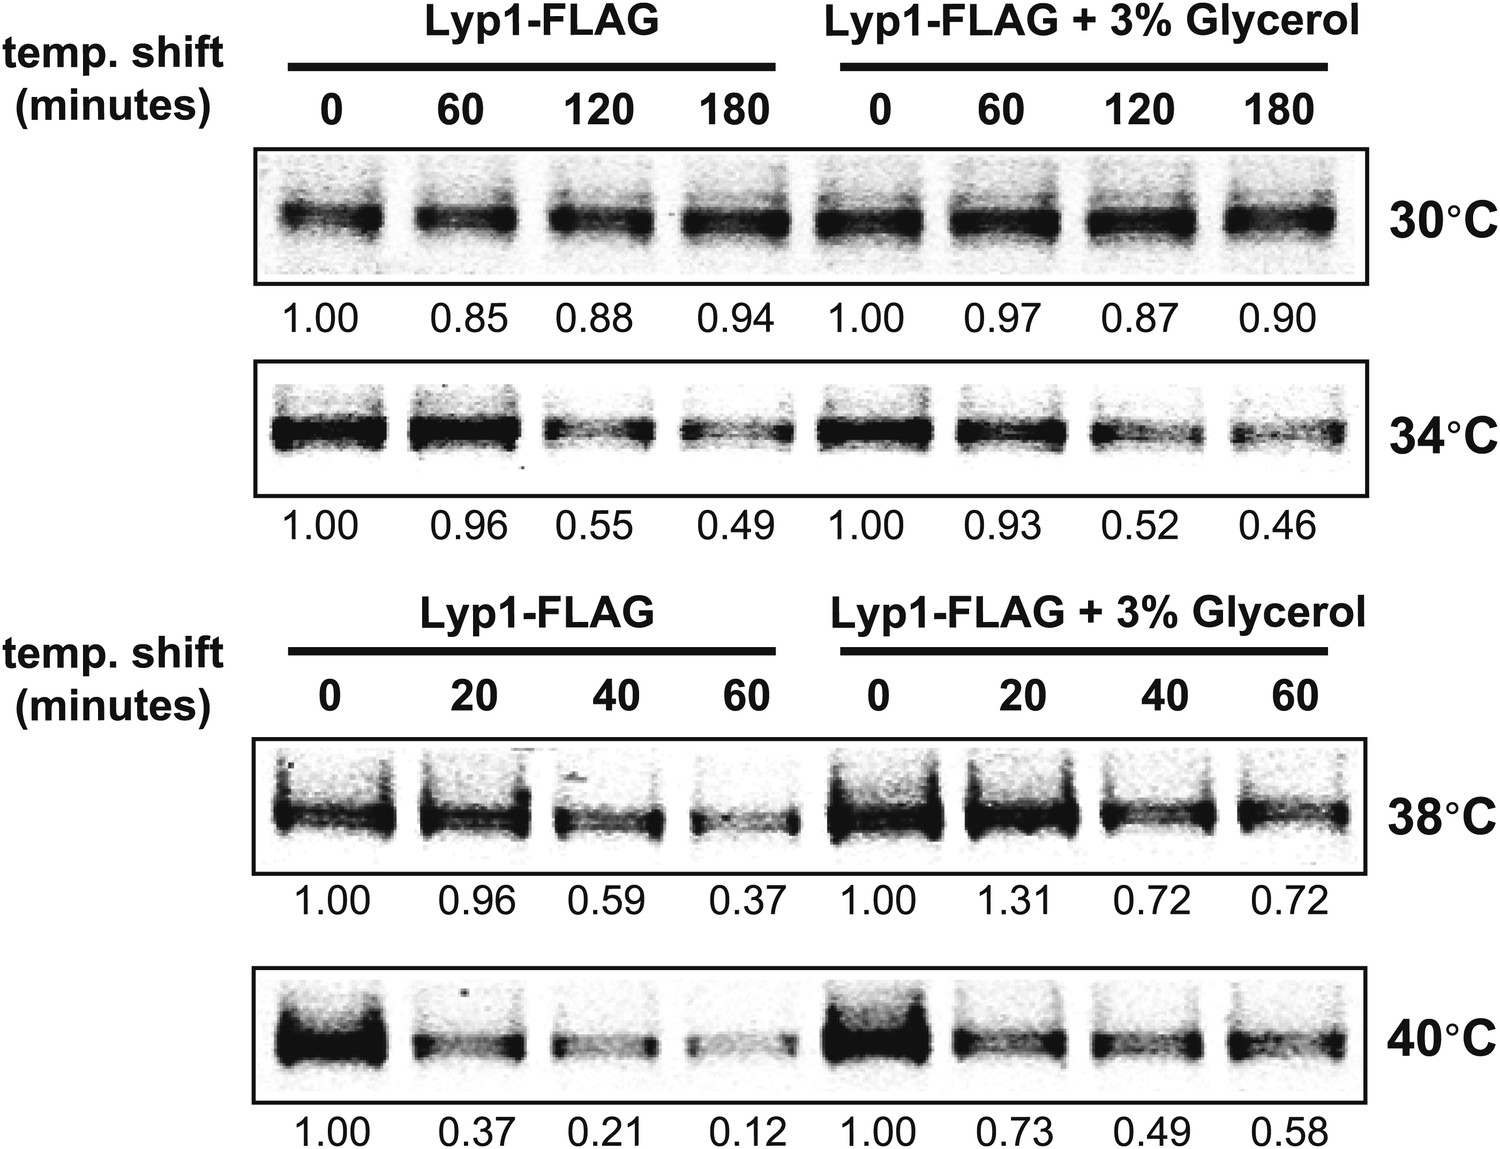
Stability of Lyp1 was analyzed following temperature shift from 26°C to indicated temperatures in the presence or absence of 3% glycerol.
https://doi.org/10.7554/eLife.00459.007
Figure 1—figure supplement 5
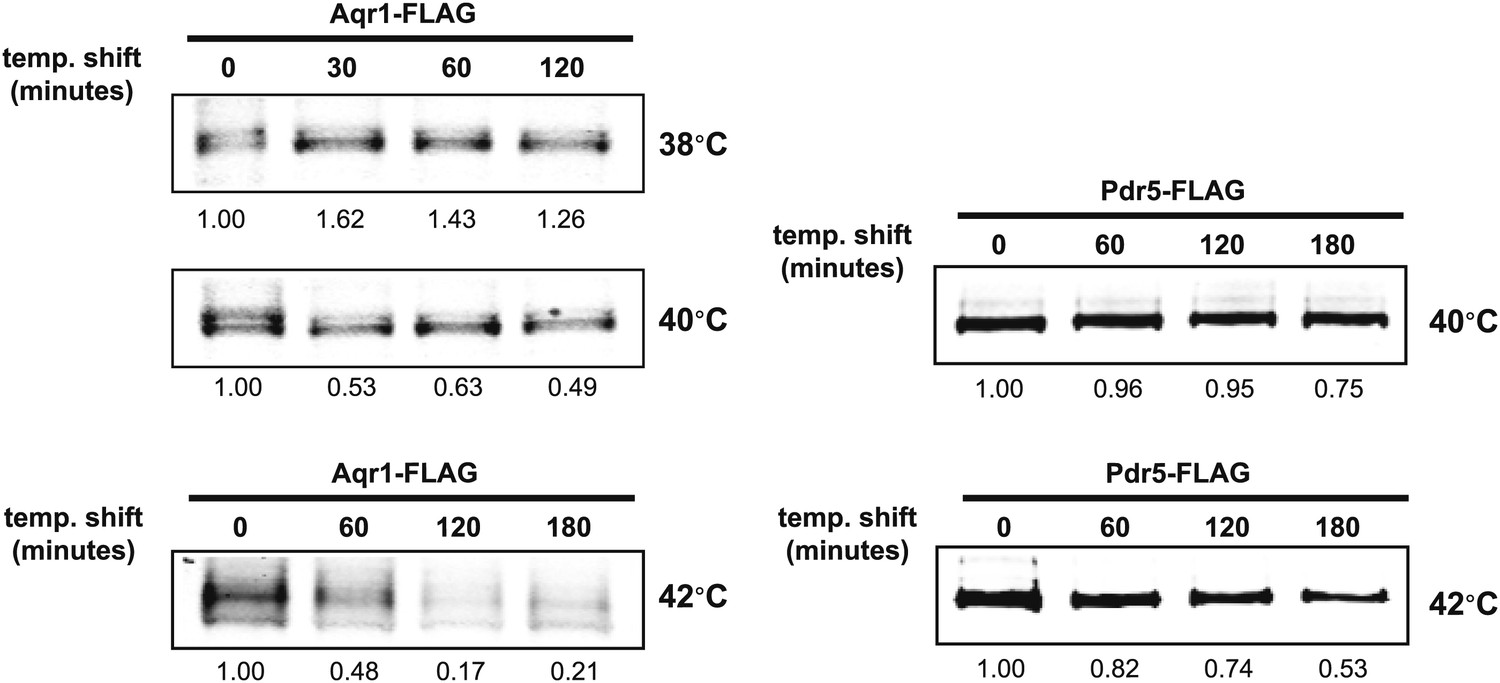
Stability of affinity-tagged Aqr1 and Pdr5 was analyzed following temperature shift from 26°C to indicated temperatures.
https://doi.org/10.7554/eLife.00459.008
Figure 1—figure supplement 6
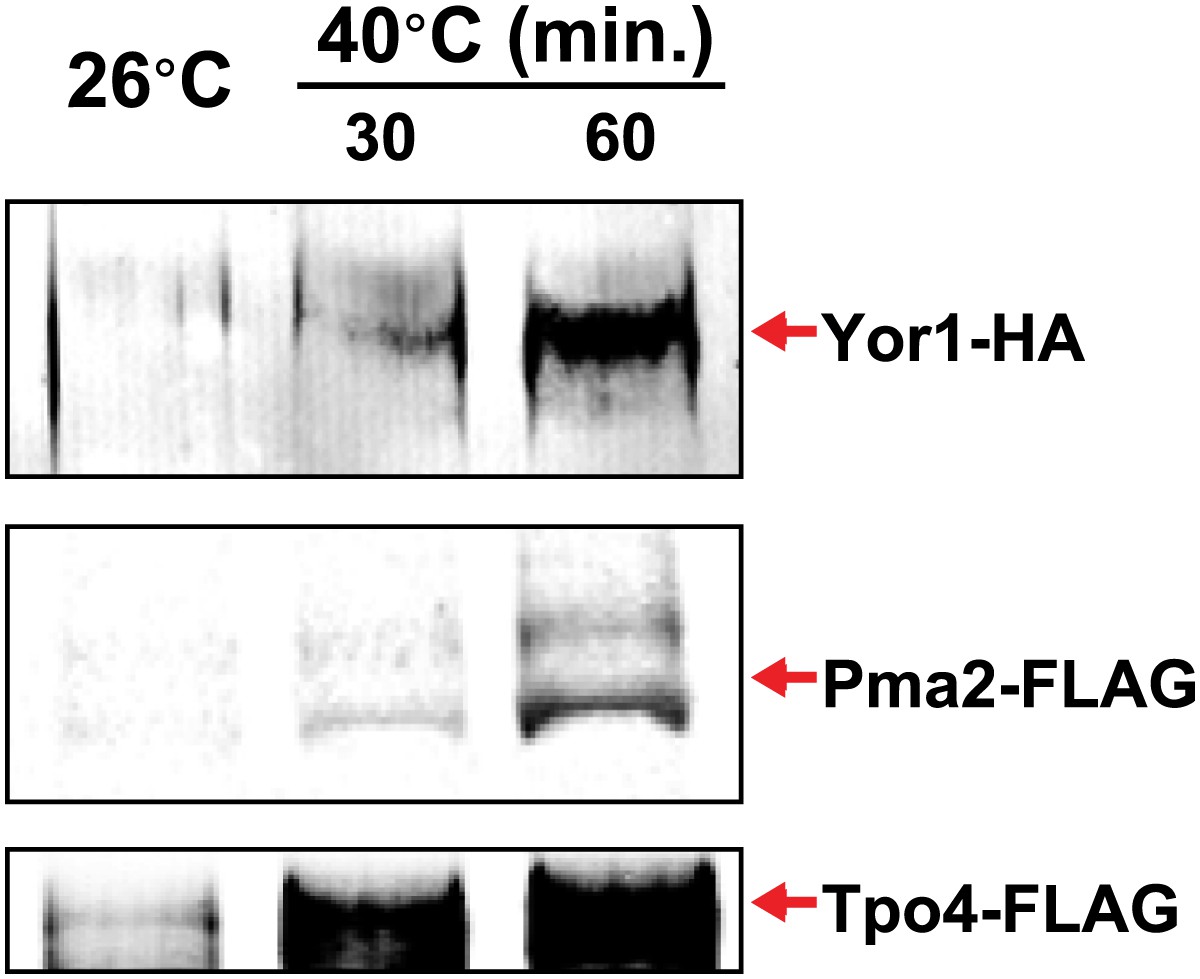
Identification of integral PM proteins induced by shifting cells to 40°C.
https://doi.org/10.7554/eLife.00459.009
Figure 1—figure supplement 7
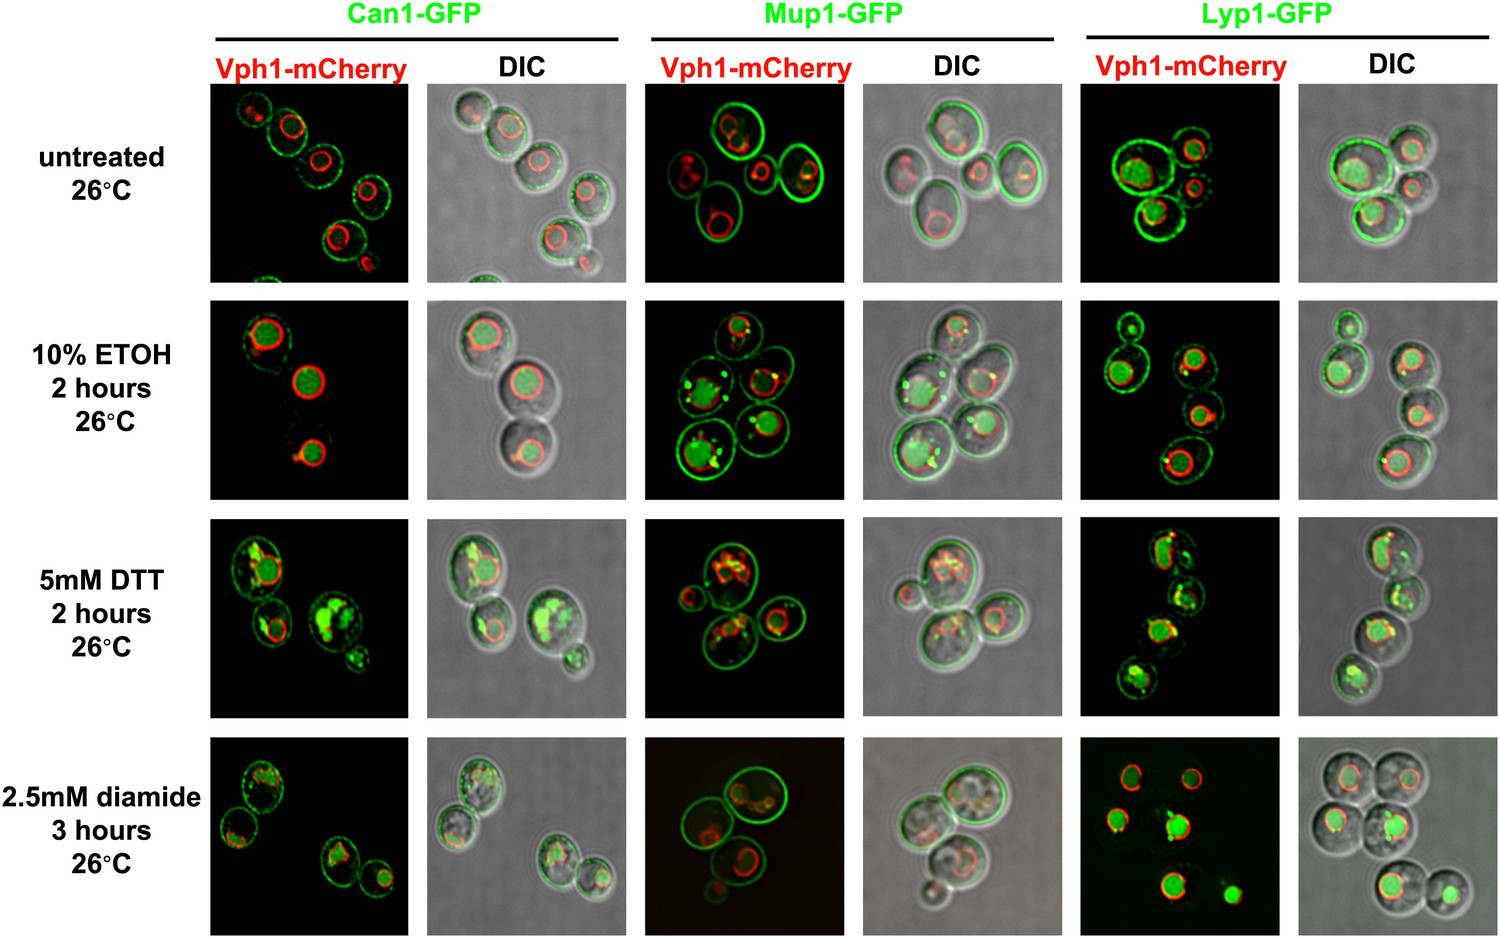
Various proteotoxic stresses trigger endocytic downregulation.
Fluorescence distribution of GFP-tagged endocytic cargoes (green) was analyzed in wildtype yeast cells expressing the vacuolar marker Vph1-mCherry (red). Cells were grown to mid-log at 26°C and then subject to the following types of proteotoxic stress: 10% ethanol for 2 hr, 5 mM DTT for 2 hr, or 2.5 mM diamide for 3 hr. Trafficking of Can1-GFP (left), Mup1-GFP (middle), and Lyp1-GFP (right) was analyzed. Plasma membrane (‘PM’) and vacuole (‘vac’) localization are indicated.
Figure 1—figure supplement 8
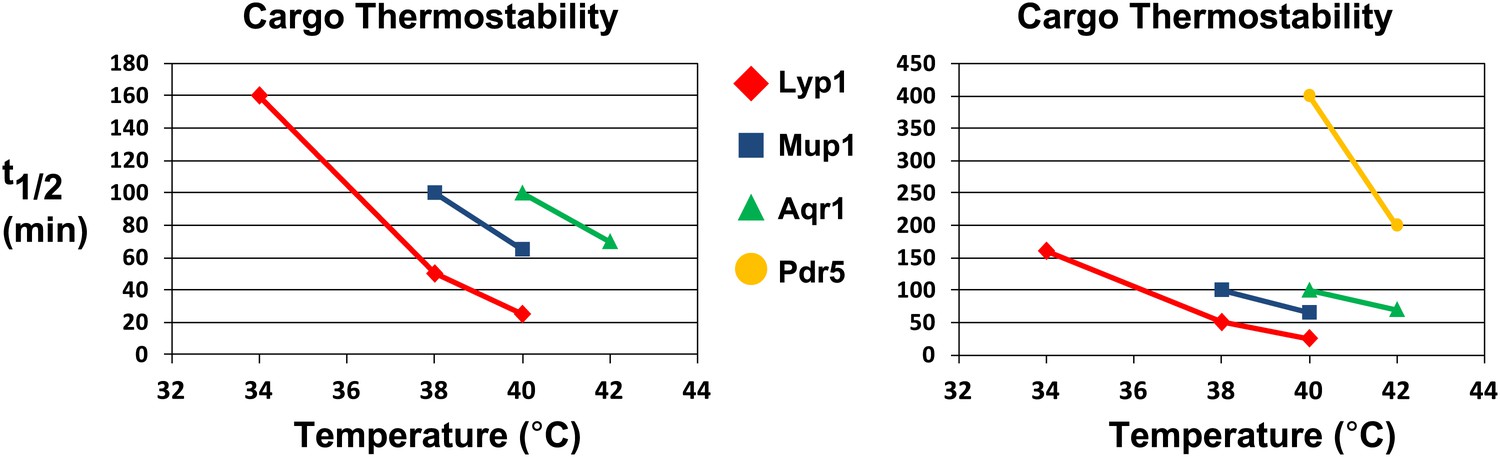
Analysis of cargo thermostability.
For each heat-induced degradation timecourse experiment, the half-life of each cargo was estimated at each temperature using linear regression. Cargo half-life is shown plotted as a function of temperature for each cargo, revealing different cargoes exhibit different thermostability profiles. The graph on the left shows the thermostability of Lyp1, Mup1, and Aqr1. The graph on the right includes the same data but is scaled to also include thermostability data for Pdr5.
Figure 1—figure supplement 9
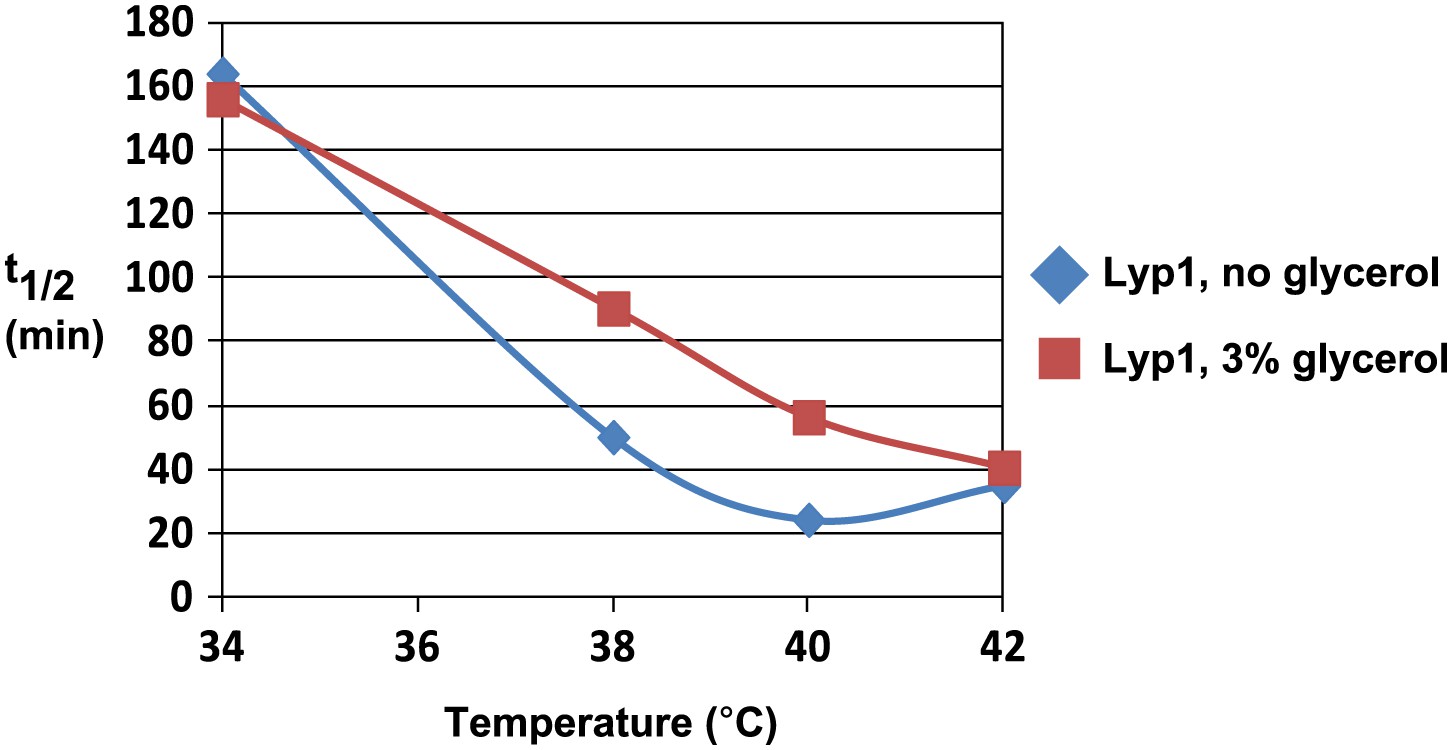
Analysis of Lyp1 thermostability in the absence or presence of 3% glycerol.
See also Figure 1—figure supplement 2.
Figure 1—figure supplement 10
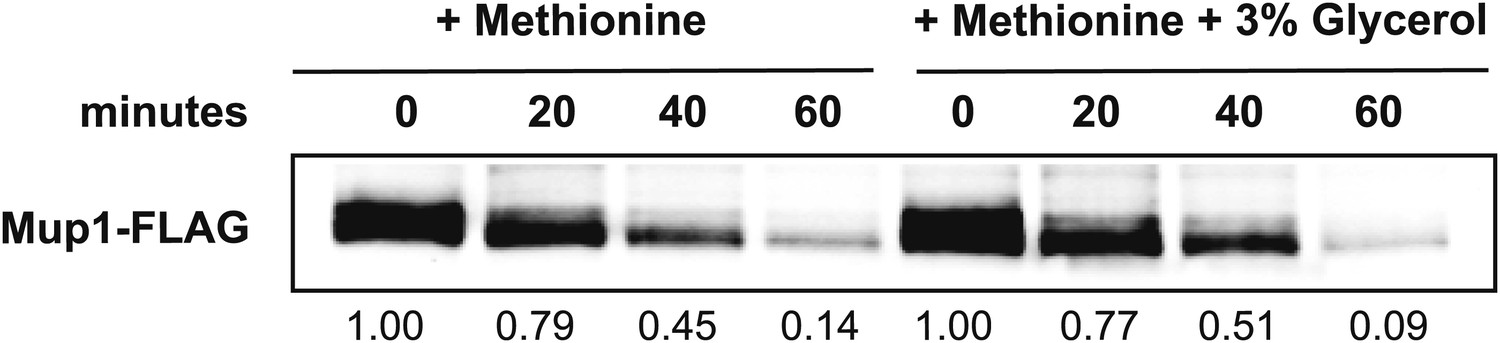
Analysis of the kinetics of Mup1 lysosomal degradation following the addition of methionine at 26°C in the absence or presence of 3% glycerol.
https://doi.org/10.7554/eLife.00459.013
Figure 2

Rsp5 mediates the heat-induced endocytic response.
(A) Fluorescence distribution of GFP-tagged endocytic cargoes (green) was analyzed in wildtype (left panels), rsp5-ww2 (middle panels), or rsp5-ww3 (right panels) yeast cells expressing the vacuolar marker Vph1-mCherry (red). Cells were grown to mid-log at 26°C and then shifted to 38°C for 2 hr. Plasma membrane (‘PM’) and vacuole (‘vac’) localization are indicated. (B) and (C) Stability of affinity-tagged cargoes was analyzed following temperature shift from 26°C (left lane) to 40°C. The number beneath each lane indicates quantification of protein abundance (relative to 26°C, t = 0 and normalized to G6PDH as a loading control) determined using the Li-Cor system. (D) Heat-sensitivity analysis of wildtype, rsp5-ww2, or rsp5-ww3 yeast cells.
Figure 3

Rsp5-mediated endocytic clearance protects PM integrity during heat stress.
(A) Yeast cells that were either grown at 26°C to mid-log phase (left), heated to 65°C for 10 min (middle), or treated with nystatin (right) were stained with propidium iodide (PI) and analyzed by fluorescence microscopy (top) and flow cytometry (bottom). (B) Wildtype (left), rsp5-ww2 (middle), or rsp5-ww3 (right) yeast cells were grown to mid-log at 26°C, shifted to 42°C for 2 hr, stained with PI, and analyzed by fluorescence microscopy (top) and flow cytometry (bottom). (C) Flow cytometry was used to analyze PI staining of the indicated strains at 26°C (blue bars) or following growth at 40°C for 3 hr (red bars).
Figure 4 with 3 supplements

ARTs protect plasma membrane integrity during heat stress.
(A) Heat-sensitivity analysis of wildtype and art mutant yeast cells. See Figure 4—figure supplement 1 for additional characterization of art mutant yeast cells. (B) Fluorescence distribution of GFP-tagged endocytic cargoes (green) was analyzed in wildtype (left panels) and Δart1 (right panels) yeast cells expressing the vacuolar marker Vph1-mCherry (red). Cells were grown to mid-log at 26°C and then shifted to 38°C for 2 hr. Plasma membrane (‘PM’) and vacuole (‘vac’) localization are indicated. (C) Stability of affinity-tagged Lyp1 was analyzed following temperature shift from 26°C (left lane) to 40°C. The number beneath each lane indicates quantification of protein abundance (relative to 26°C, t = 0) determined using the Li-Cor system. (D) Heat-sensitivity analysis of wildtype, Δart1, Δart2, and Δart1Δart2 mutant yeast cells. (E) Flow cytometry was used to analyze PI staining of the indicated strains at 26°C (blue bars) or following growth at 40°C for 3 hr (red bars). (F) Kinetic analysis of PI staining for a 40°C heat stress timecourse. (G) Fluorescence distribution of GFP-tagged Mup1 (green) was analyzed in wildtype (left panels) and Δart1Δart2Δart3Δart4Δart5Δart6Δart9 (right panels) yeast cells during heat stress.
Figure 4—figure supplement 1
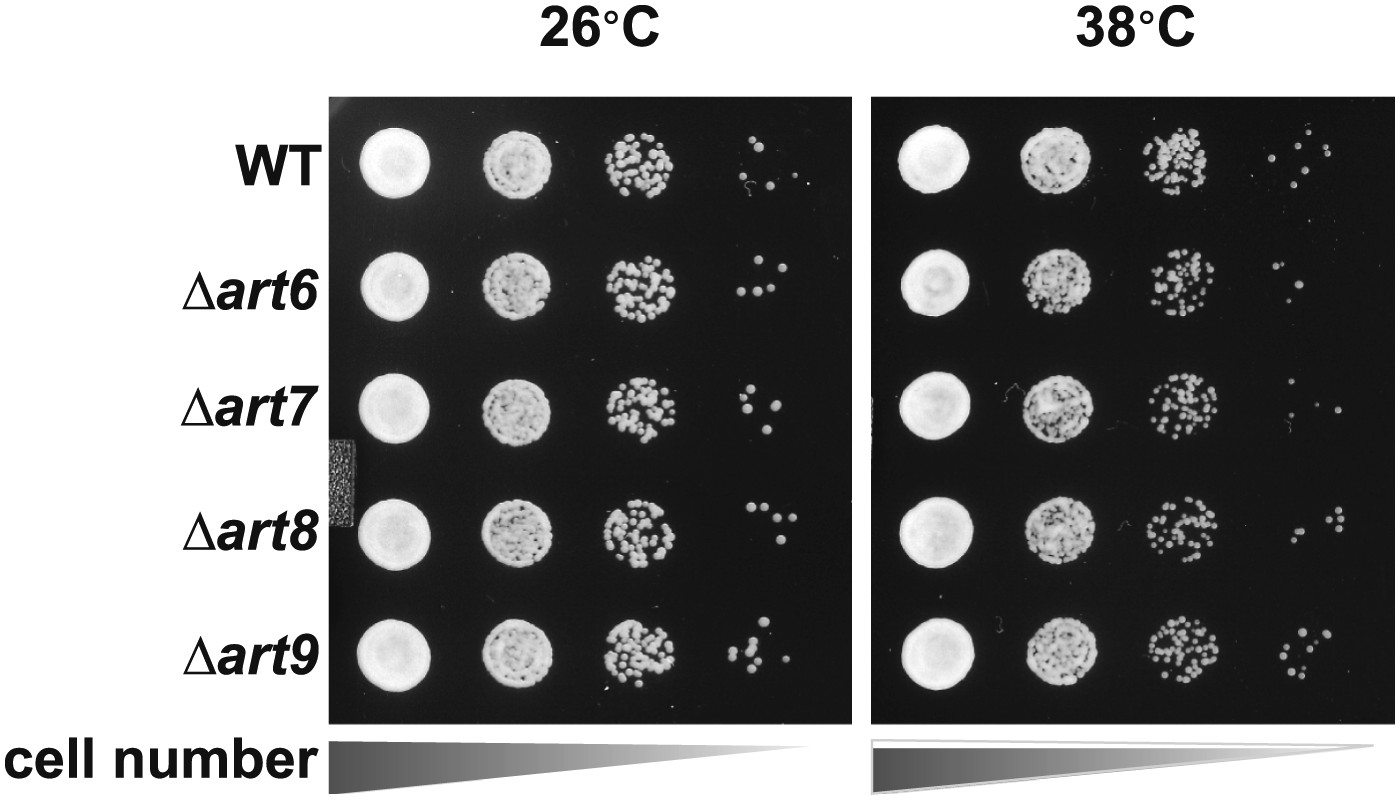
Heat-sensitivity analysis of wildtype and art mutant yeast cells.
https://doi.org/10.7554/eLife.00459.018
Figure 4—figure supplement 2
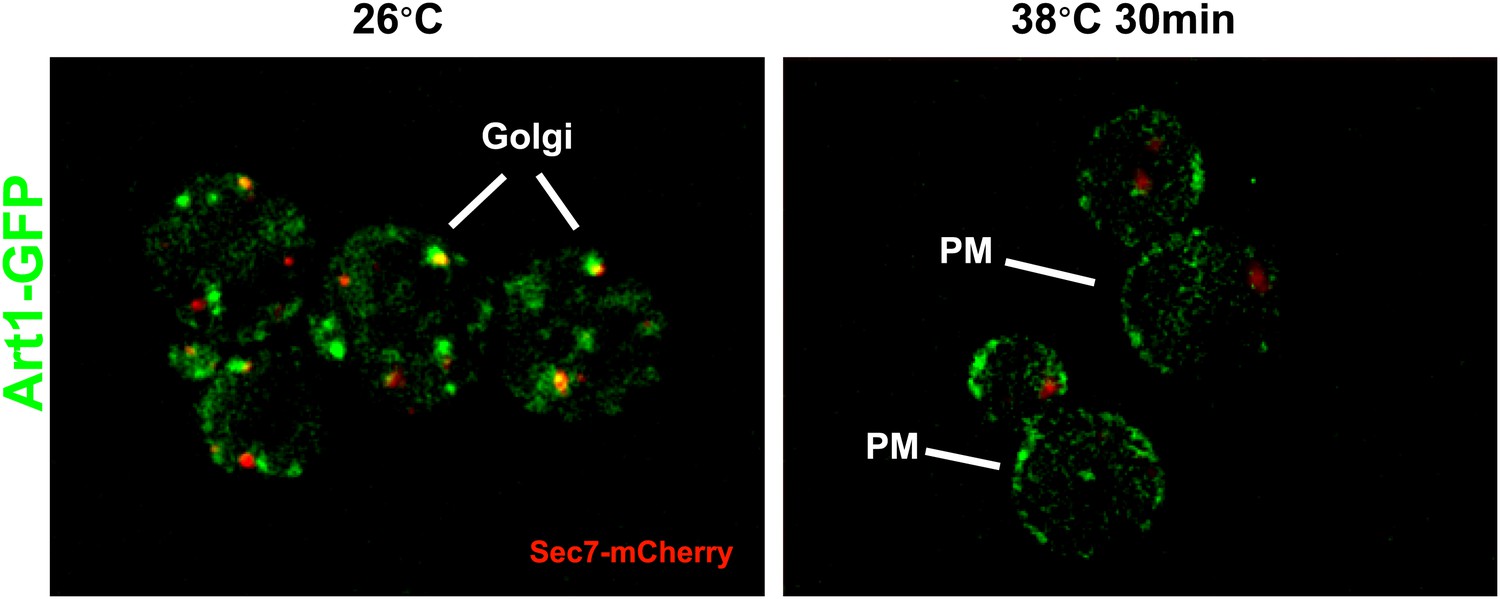
Fluorescence distribution of GFP-tagged Art1 (green) was analyzed at 26°C and 38°C in yeast cells expressing the vacuolar marker Vph1-mCherry (red).
Cells were grown to mid-log at 26°C and then shifted to 38°C for 2 hr. Plasma membrane (‘PM’) and Golgi localization are indicated.
Figure 4—figure supplement 3
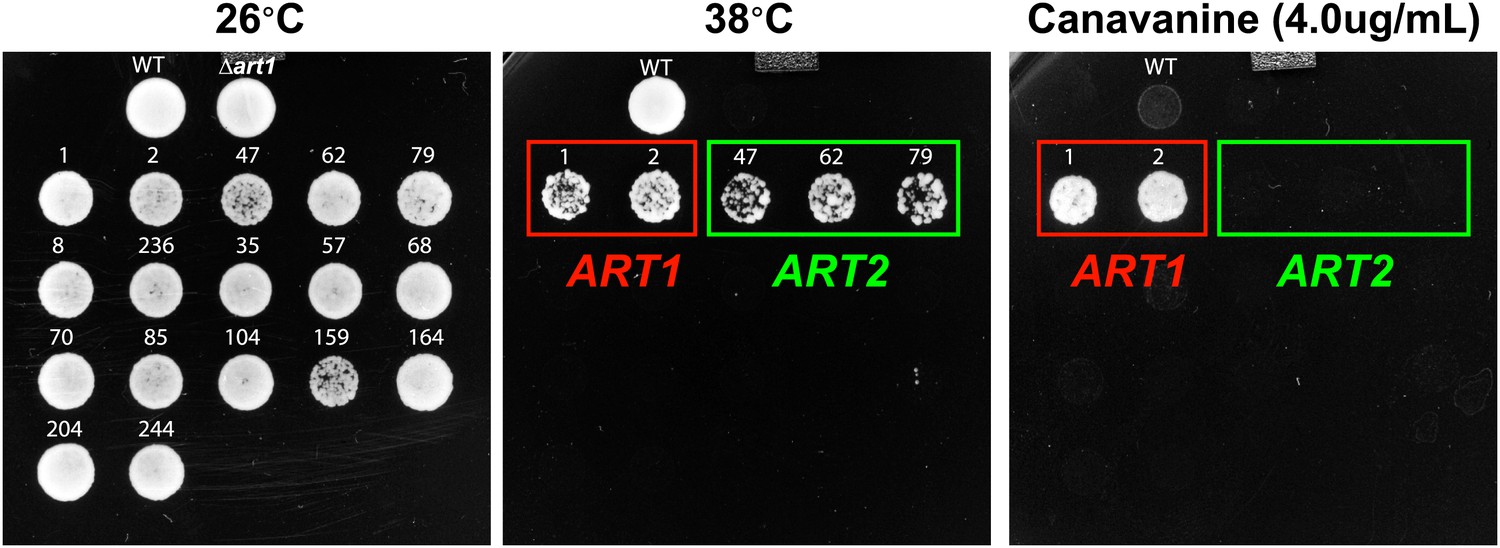
Results of a screen to identify multicopy bypass suppressors of the Δart1 ts phenotype.
Overexpression of ART2 can suppress the ts phenotype but not the canavanine hypersensitivity phenotype of Δart1 mutant cells.
Figure 5 with 3 supplements
Cargo accumulation at the PM is toxic during heat stress.
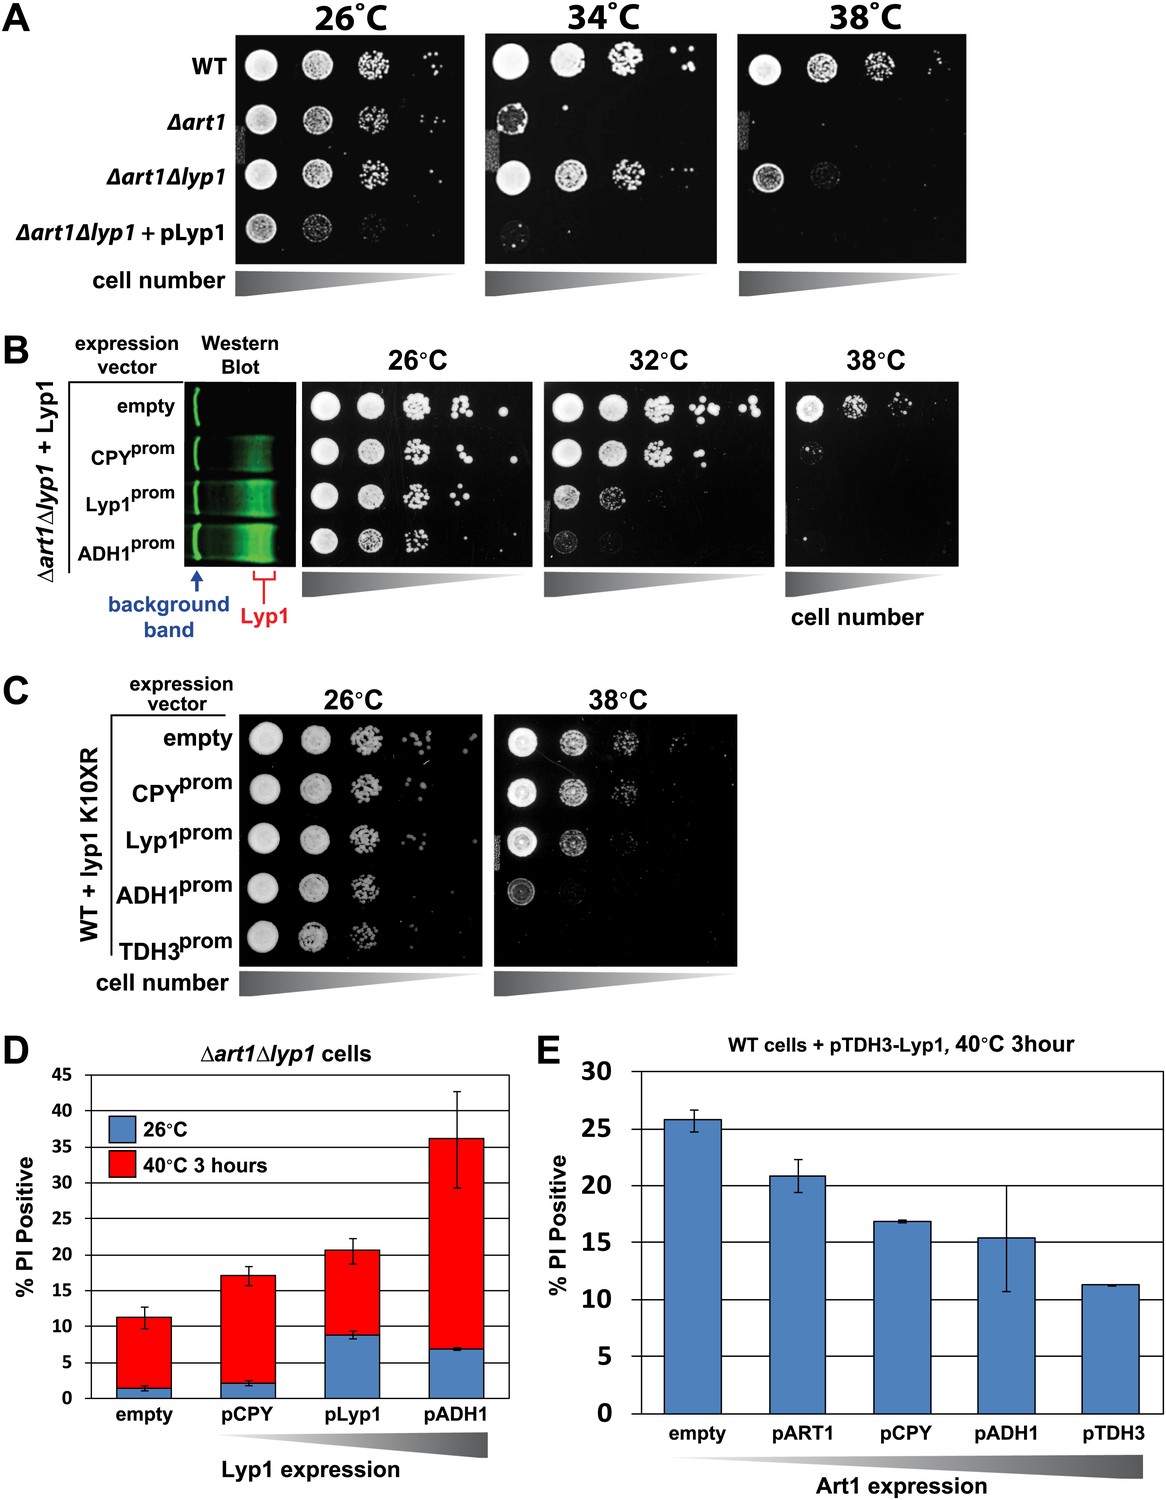
(A) heat-sensitivity analysis of wildtype, Δart1, Δlyp1, and Δart1Δlyp1 mutant yeast cells. (B) Empty vector or plasmids encoding Lyp1-FLAG expressed from different promoters (pCPY, pLYP1, pADH1) were transformed into Δart1Δlyp1 mutant yeast cells and the affect on heat tolerance was scored by growth at the indicated temperatures. Lyp1 expression level for each strain was analyzed by quantitative Western blot (Li-Cor). (C) Empty vector or plasmids encoding Lyp1-K10XR-FLAG (which lacks N-terminal lysine residues) expressed from different promoters (pCPY, pLYP1, pADH1, pTDH3) were transformed into wildtype yeast cells and the affect on heat tolerance was scored by growth at the indicated temperatures. (D) Flow cytometry was used to analyze PI staining of Δart1Δlyp1 mutant yeast cells expressing Lyp1 from different promoters (pCPY, pLYP1, pADH1) following growth at 40°C for 3 hr. (E) Flow cytometry was used to analyze PI staining of wildtype yeast cells coordinately expressing Lyp1 from the TDH3 promoter and Art1 from different promoters (pART1, pCPY, pADH1, pTDH3) following growth at 40°C for 3 hr.
Figure 5—figure supplement 1
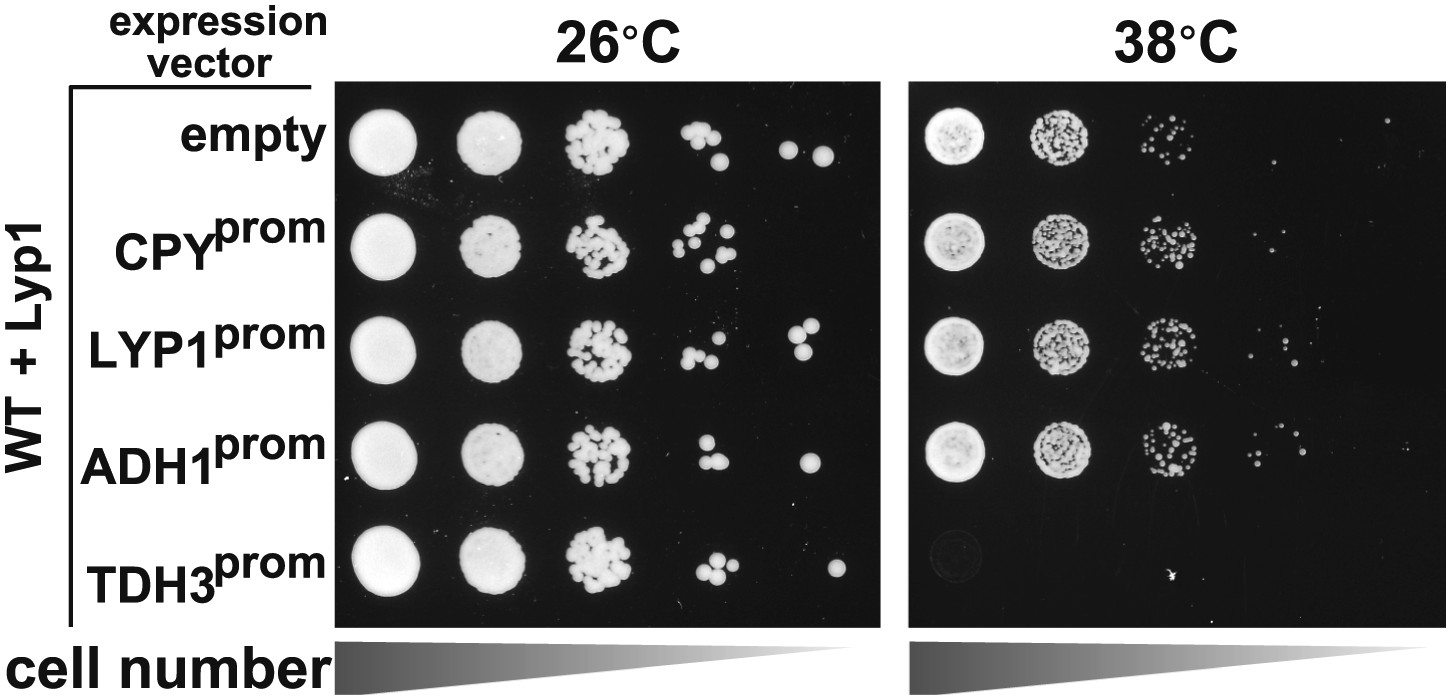
Heat-sensitivity analysis of wildtype yeast cells expressing titrated levels of Lyp1.
https://doi.org/10.7554/eLife.00459.022
Figure 5—figure supplement 2
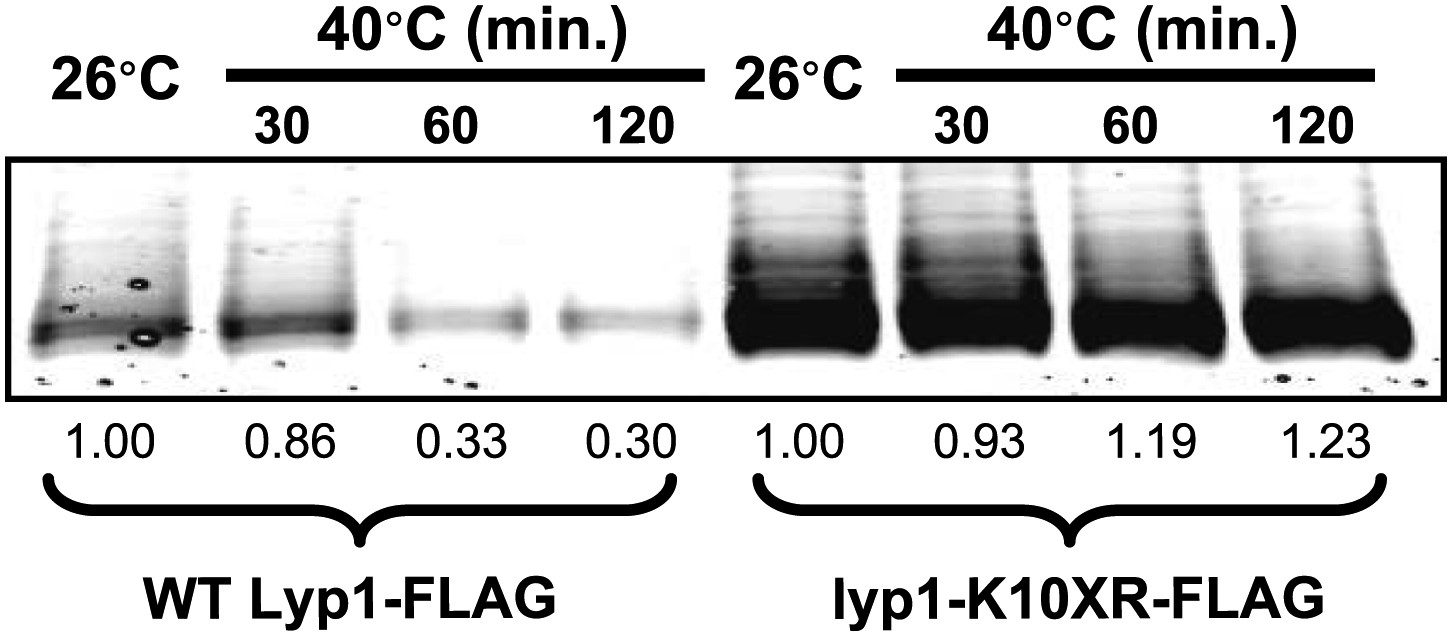
Stability of wildtype Lyp1 or the K10XR mutant, which cannot be ubiquitinated on its N-terminal cytosolic tail.
https://doi.org/10.7554/eLife.00459.023
Figure 5—figure supplement 3
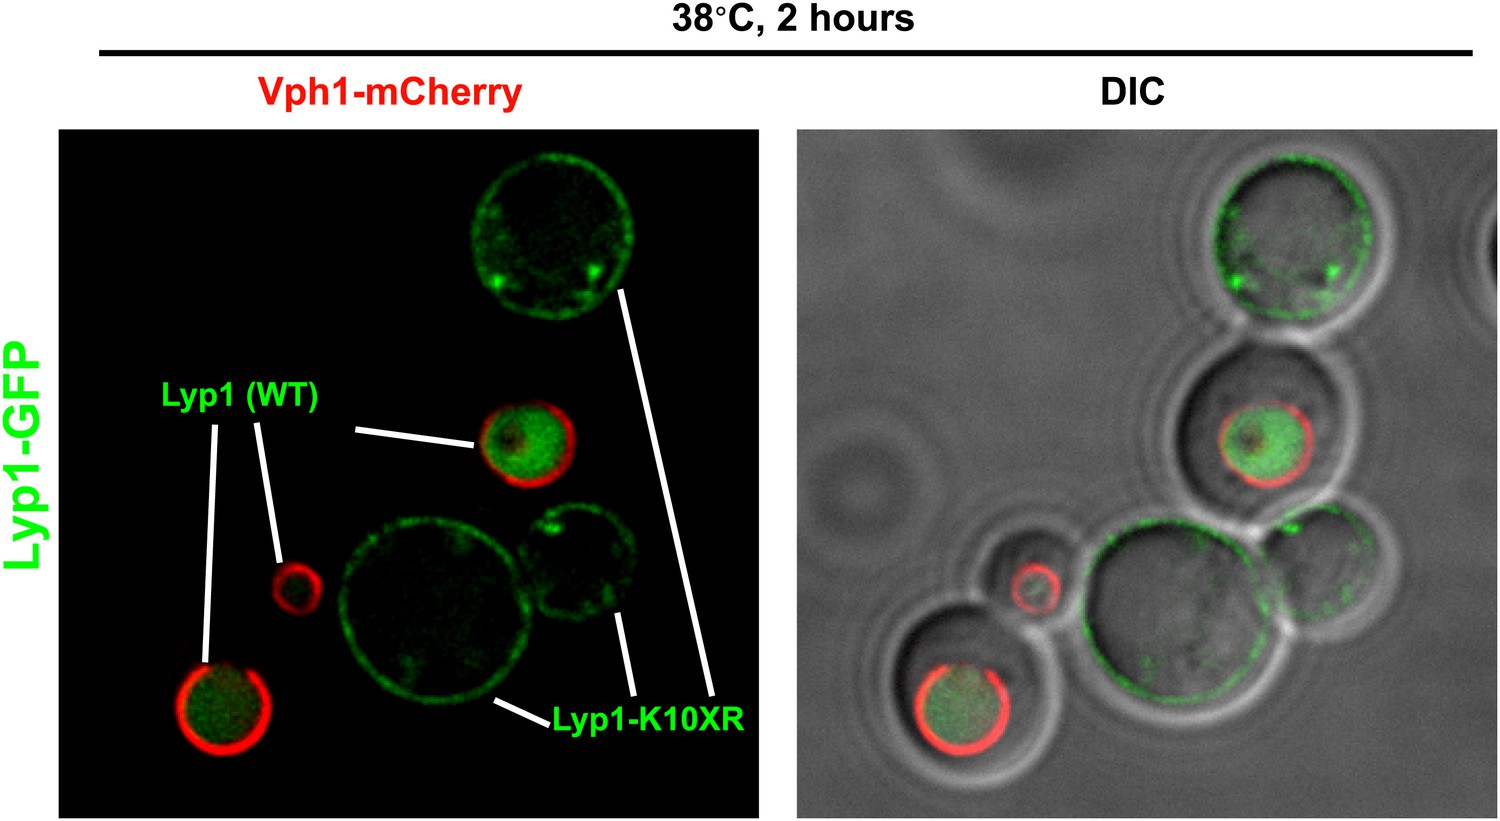
Fluorescence distribution of GFP-tagged wildtype Lyp1 (green, only in cells expressing Vph1-mCherry) or the K10XR mutant (green, only in cells without Vph1-mCherry) was analyzed following growth at 38°C for 2 hr.
https://doi.org/10.7554/eLife.00459.024
Figure 6 with 1 supplement
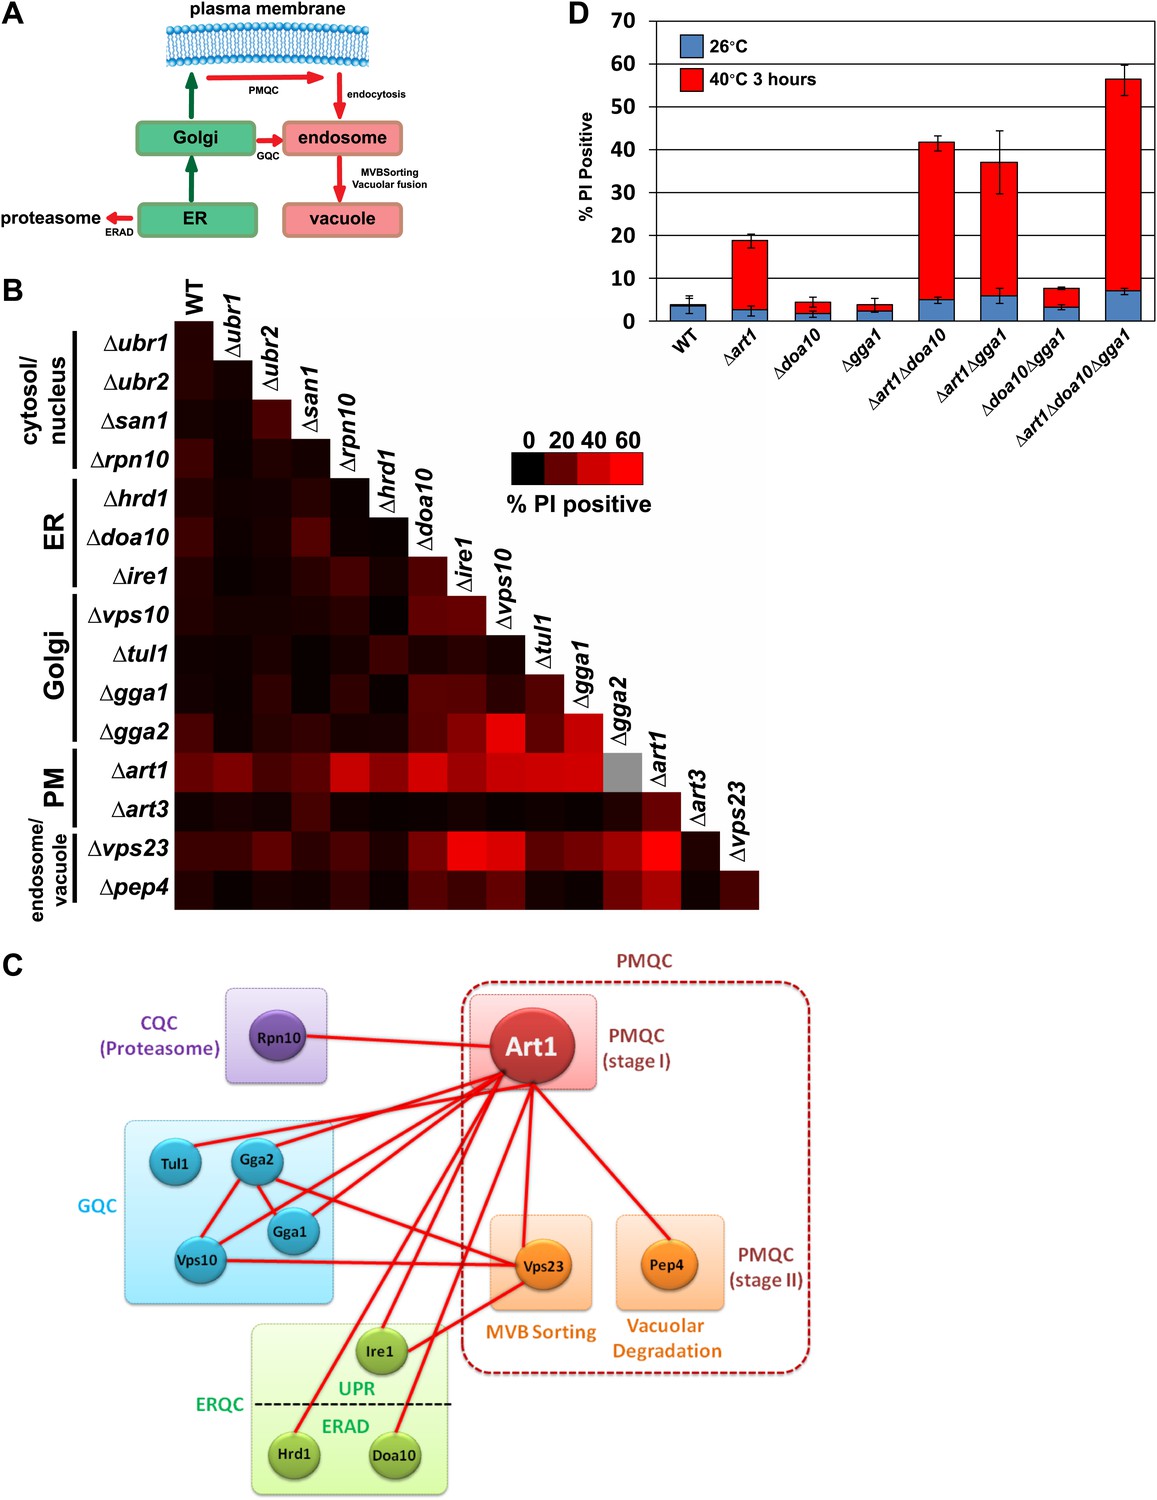
Systems level coordination of integral membrane protein quality control.
(A) Model illustrating the major quality control mechanisms for integral membrane proteins: ERAD (proteasomal degradation), Golgi quality control (GQC; vacuolar/lysosomal degradation), and plasma membrane quality control (PMQC; vacuolar/lysosomal degradation). (B) Genetic array constructed for known quality control systems in the cell. Red color indicates the percentage of yeast cells staining PI positive following growth at 40°C for 3 hr (see key inset). Gray box indicates a strain which could not be obtained due to synthetic lethality in the SEY6210 background. (C) Node network illustrating all genetic interactions observed for protein quality control systems (cytosolic quality control, CQC; ER quality control, ERQC; Golgi quality control, GQC; PM quality control, PMQC) in Figure 6B. (D) Flow cytometry was used to analyze PI staining of the indicated strains following growth at 40°C for 3 hr.
Figure 6—figure supplement 1
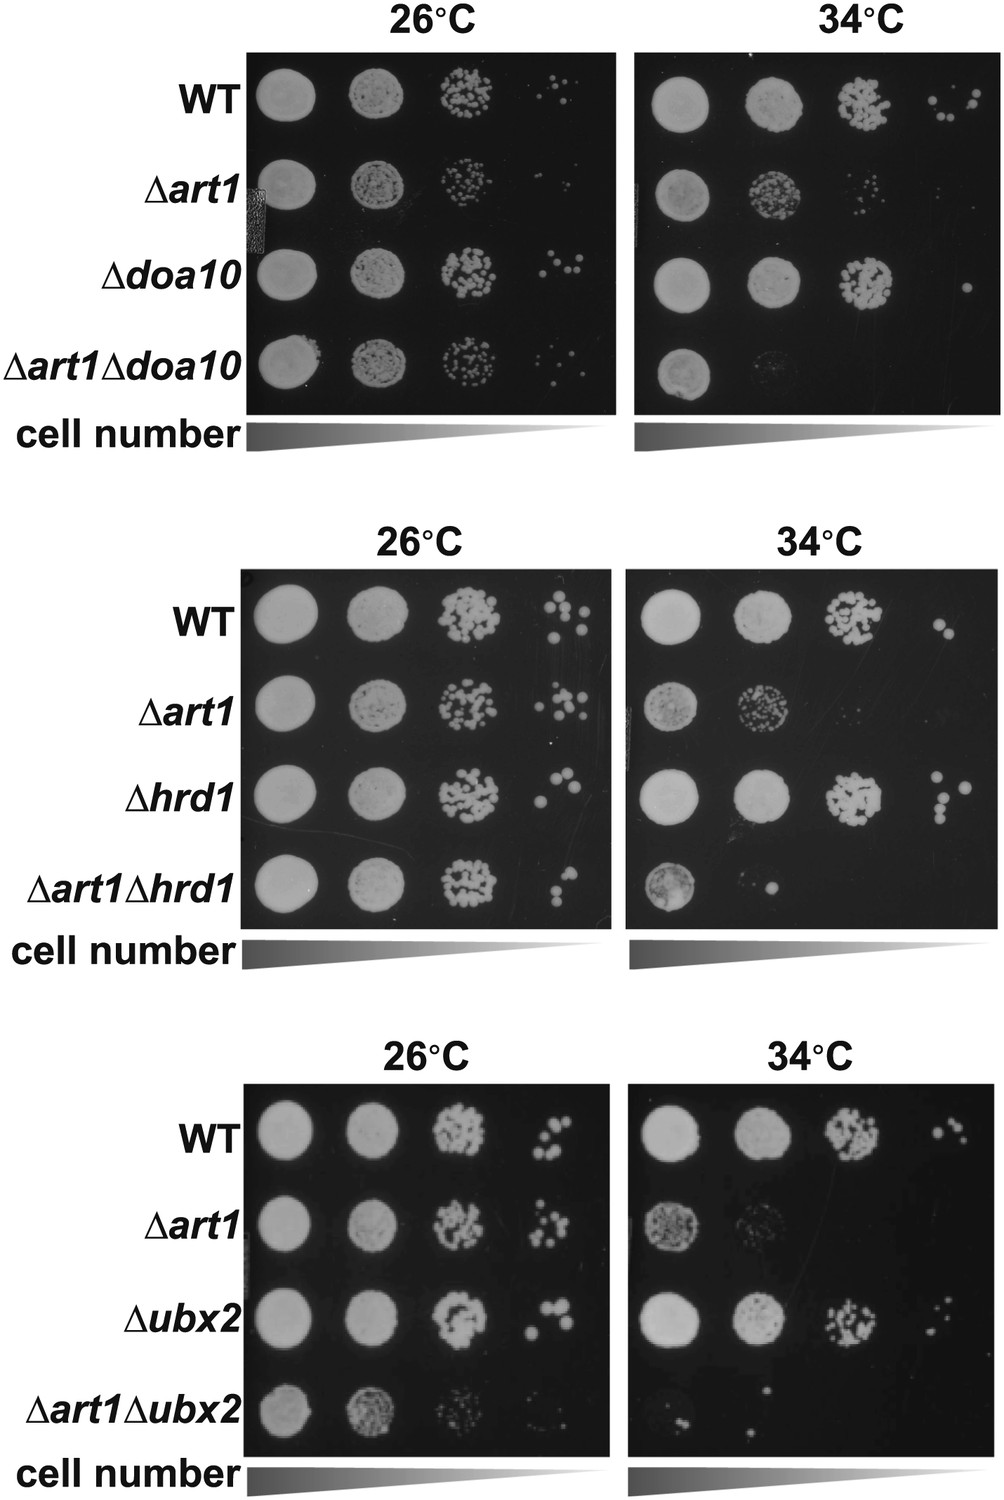
Heat-sensitivity analysis of wildtype and mutant yeast cells.
https://doi.org/10.7554/eLife.00459.026
Figure 7

Cellular mechanisms of integral membrane protein quality control.
Integral membrane proteins are subject to sequential quality control mechanisms including ERAD in the ER (I), GQC in the Golgi (II), and ART-Rsp5 mediated PMQC at the PM (III).
Tables
Table 1
Cargo thermostability
| Cargo | 34°C | 38°C | 40°C | 42°C |
| Lyp1 | 160 | 50 | 25 | – |
| Pma1 | Stable | 95 | 45 | – |
| Mup1 | Stable | 100 | 65 | – |
| Aqr1 | – | Stable | 100 | 70 |
| Pdr5 | – | Stable | 400 | 200 |
-
Kinetic analysis of heat-induced cargo degradation (Figure 1—figure supplements 3 and 4) was used to estimate half-lives of each cargo at each temperature tested. Half-lives are indicated in minutes. ‘–’ indicates half-life not determined.
Download links
A two-part list of links to download the article, or parts of the article, in various formats.
Downloads (link to download the article as PDF)
Open citations (links to open the citations from this article in various online reference manager services)
Cite this article (links to download the citations from this article in formats compatible with various reference manager tools)
The ART-Rsp5 ubiquitin ligase network comprises a plasma membrane quality control system that protects yeast cells from proteotoxic stress
eLife 2:e00459.
https://doi.org/10.7554/eLife.00459


