MicroRNA-146a acts as a guardian of the quality and longevity of hematopoietic stem cells in mice
- California Institute of Technology, United States
- University of California, Los Angeles, United States
- University of Utah, United States
Figures
Figure 1 with 1 supplement

Accelerated HSC decline and myeloproliferation in miR-146a–deficient mice during chronic inflammation.
(A) MiR-146a and miR-146b expression in FACS-sorted HSPC populations by Taqman RT-qPCR. Lin-BM, lineage negative bone marrow cells; L−S+K+ (LSK), Lin−Sca1+cKit+; HSC, LSK CD150+CD48−; L−S−K+, Lin−Sca1−cKit+; L−S+K−, Lin−Sca1+cKit−; miR-146a KO BM, total bone marrow cells from Mir146a−/− mice. (B). Representative FACS plots of LSK cells and CD150+CD48− or EPCR+ HSCs from BM of 8-month-old wild-type (WT) and miR-146a KO mice. Quantification of number of BM CD45+ cells, LSK cells, LSK CD150+CD48− HSCs, LSK EPCR+ HSCs and percent of LSK CD150+CD48− HSCs of total BM from 8-month-old (C) and 12-month-old (D) WT and miR-146a KO mice by FACS. (E) Quantification of percent of LSK cells of total BM and percent of HSCs of LSK gate from BM of 8-month-old WT and miR-146a KO mice by FACS. (F) Quantification of number of LSK cells and LSK CD150+CD48− HSCs from spleen of 8-month-old WT and miR-146a KO mice by FACS. (G). Total number of LSK CD150+CD48− or LSK CD150+CD48− HSCs from BM and spleen of 6-month-old WT and miR-146a KO mice. (H)–(J) 8-Week-old WT and miR-146a KO (miR KO) mice were subjected to repeated low-dose of intraperitoneal LPS stimulation (1 mg LPS/kg of body weight for 8 times) or PBS control spread over a month. At the end the month, four groups of mice were harvested for FACS analysis. (H) Quantification of percent of LSK cells of total BM, CD150+CD48− HSCs of LSK gate, and number of CD11b+ myeloid cells in BM. I. Number of myeloid cells (CD11b+ or Gr1+) in peripheral blood. (J) Quantification of total number of LSK CD150+CD48− HSCs, LSK EPCR+ HSCs and LSK cells in spleen.
Figure 1—figure supplement 1
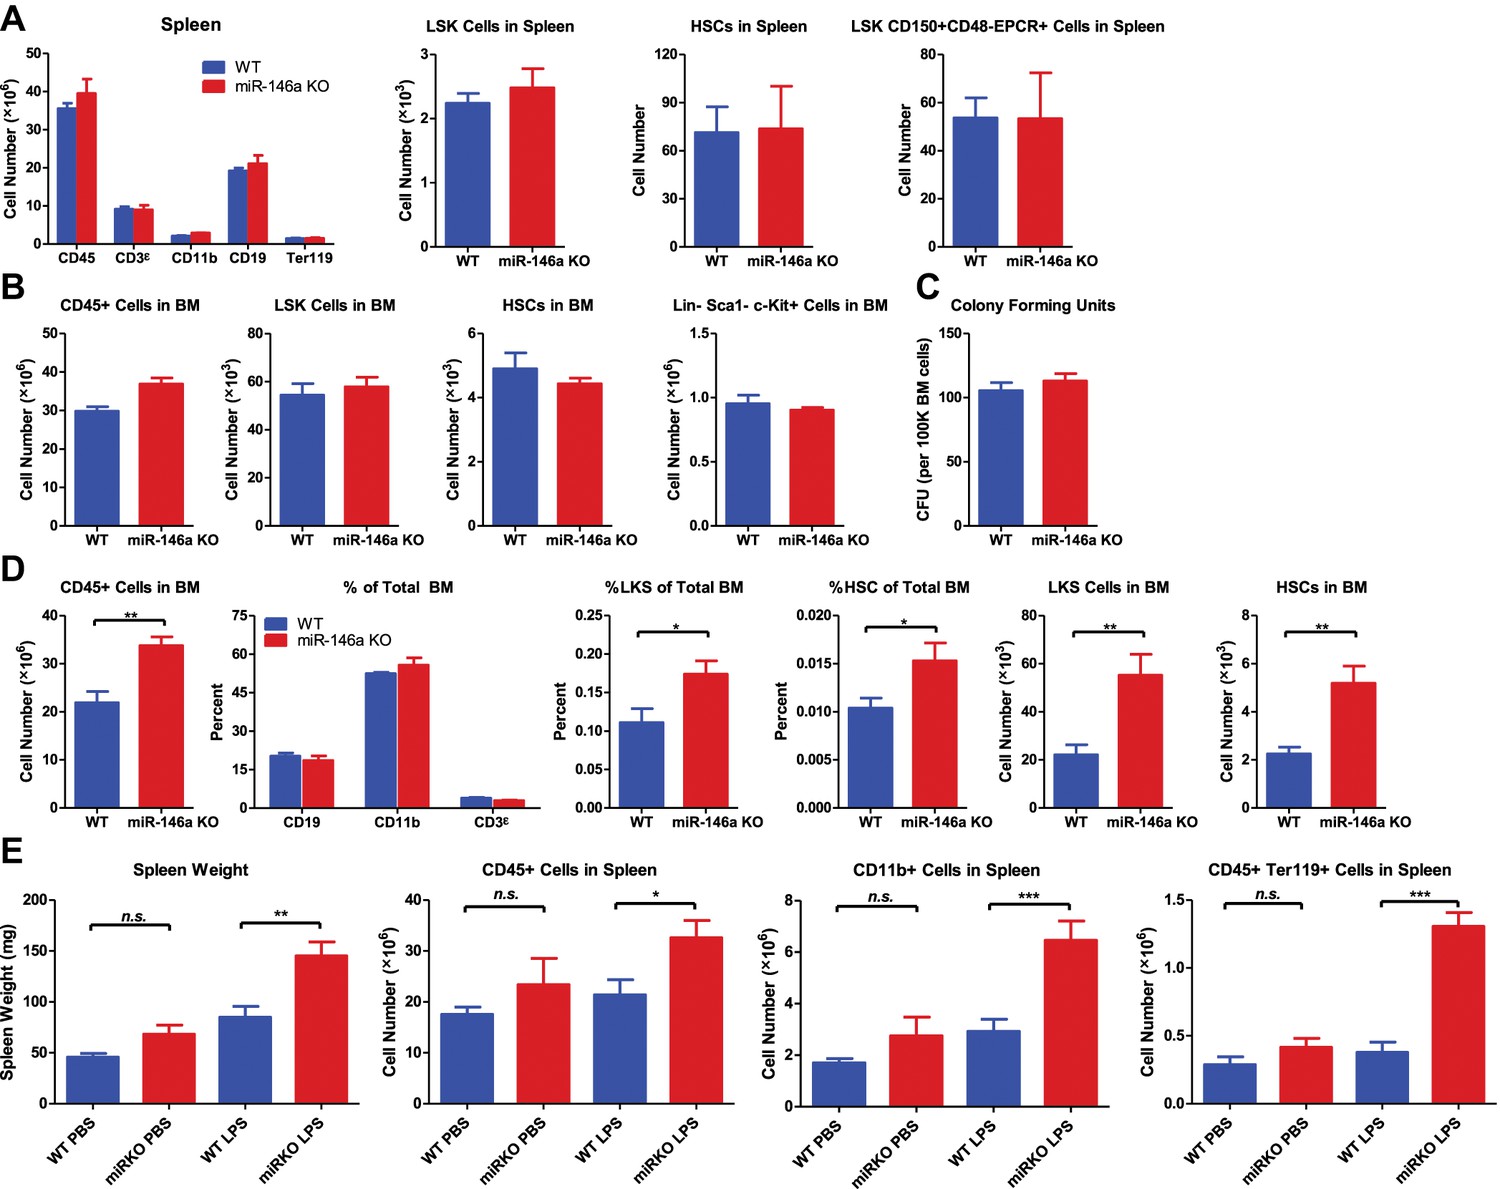
HSPC FACS analysis and colony-forming ability in 6-week-old and 4-month-old WT and miR-146a KO mice.
(A) Quantification of number of white blood cells (CD45), T cells (CD3ε), myeloid cells (CD11b), B cells (CD19), nucleated erythrocytes (Ter119), LSK cells, LSK CD150+CD48− HSCs and LSK CD150+CD48−EPCR+ HSCs from spleen of 6-week-old WT and miR-146a KO mice by FACS. (B) Quantification of number of white blood cells (CD45), LSK cells, LSK CD150+CD48− HSCs, Lin-cKit+Sca1− myeloid progenitors from BM of 6-week-old WT and miR-146a KO mice by FACS. (C) Colony forming units (CFU) in vitro in methylcellulose medium per 100,000 total BM cells from 6-week-old WT and miR-146a KO mice. (D) Quantification of number or percent of white blood cells (CD45), T cells (CD3ε), myeloid cells (CD11b), B cells (CD19), LSK cells and LSK CD150+CD48− HSCs from BM of 4-month-old WT and miR-146a KO mice by FACS. (E) (related to Figure 1H–J) 8-Week-old WT and miR-146a KO (miR KO) mice were subjected to repeated low-dose of intraperitoneal LPS stimulation (1 mg LPS/kg of body weight for 8 times) spread over a month. WT and miR KO mice receiving phosphate-buffered saline (PBS) injection were included as controls. At the end the month, four groups of mice (WT PBS, miR KO PBS, WT LPS, and miR KO LPS) were harvested for FACS analysis. Spleen weight, number of CD45+, CD11b+, and Ter119+ cells in spleen were shown.
Figure 2 with 1 supplement

Progressive functional decline of miR-146a-deficient HSCs.
(A) Ratio of CD45.2+ over CD45.1+ cells of various lineages in pretransplanted bone marrow (BM) mixtures consisted of equal numbers of CD45.2+ WT and CD45.1+ WT total BM cells (blue bar, CD45.2 WT:CD45.1 WT) or equal numbers of CD45.2+ miR-146a KO and CD45.1+ WT total BM cells (red bar, CD45.2 KO:CD45.1 WT). FACS analysis was performed on the BM mixtures before transplantation to determine the starting ratios of various lineages. (B) Ratio of CD45.2+ over CD45.1+ cells of various lineages in peripheral blood (PB), spleen (SP) and BM 6 months after transplantation. Blue bar, CD45.2 WT:CD45.1 WT, represents mice received CD45.2 WT:CD45.1 WT BM cells; red bar, CD45.2 KO:CD45.1 WT, represents mice received CD45.2 KO:CD45.1 WT BM cells. All donor mice were 6-week-old female and recipient mice were 2-month-old CD45.1+ WT female. Ratio of CD45.2+ over CD45.1+ of BM LSK cells and HSCs (C) and total white blood (CD45+) cells (D) 10-month after transplantation. (E) Number of total HSCs, CD45.2+ HSCs and CD45.1± HSCs in recipient chimera mice. WT:WT, CD45.2 WT:CD45.1 WT; KO:WT, CD45.2 KO:CD45.1 WT. n = 8 for each group. (F)–(K) A repeat of the above experiment with age-and-sex-matched 4-month-old WT and miR-146a KO female mice. (F) Representative FACS plots of BM mixtures before transplantation showing CD45.2/CD45.1 ratio close to 1 for both WT:WT and KO:WT BM mixtures. (G) Ratio of CD45.2+ over CD45.1+ cells of various lineages before transplantation. (H) Percentage of CD45.2+ cells of CD45+ peripheral blood nucleated cells at 1, 2, 3 and 6 months. (I) Ratio of CD45.2+ over CD45.1+ cells of various lineages in PB, SP, and BM 6 months after transplantation. All ratios of CD45.2 WT:CD45.1 WT are normalized to 1. Number of total, CD45.2+ and CD45.1+ LSK cells (J) and HSCs (K) in recipient chimera mice. LSK, Lin-cKit+Sca1+; HSC, LSK CD150+CD48−; L−S−K+, Lin−Sca1−cKit+.
Figure 2—figure supplement 1
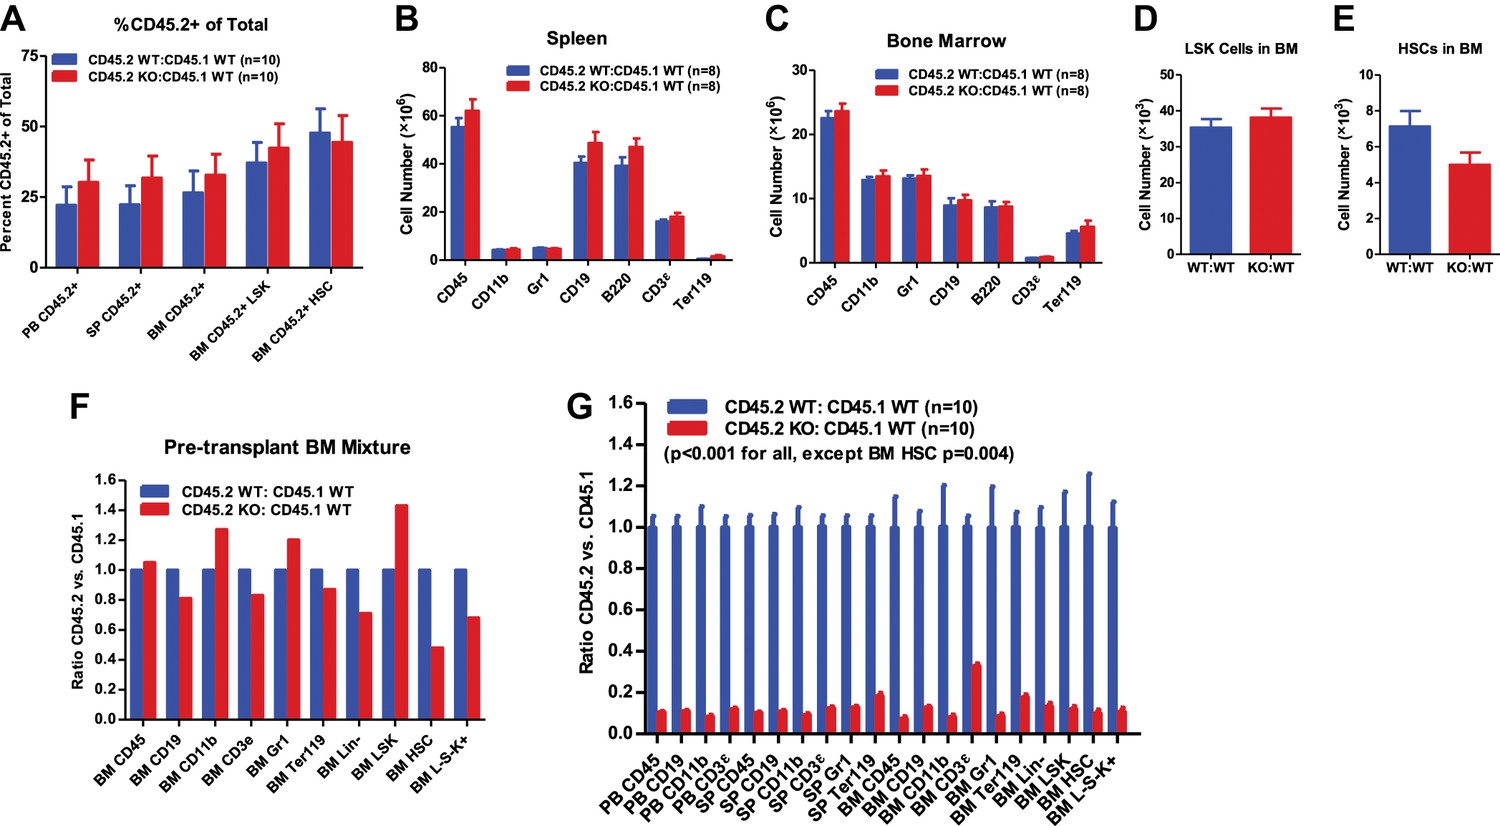
Functional decline of miR-146a-deficient HSCs.
(A) Related to Figure 2C–E. Equal numbers of BM HSCs (LSK CD150+CD48−) were sorted from 8-week-old CD45.2+ WT and CD45.2+ miR-146a KO mice. Fifty WT or KO HSCs were mixed with 500,000 CD45.1+ WT total BM cells and transplanted into a CD45.1+ WT recipient mouse. Percentage of CD45.2+ cells in various lineages in peripheral blood (PB), spleen (SP), and bone marrow (BM) was analyzed by FACS 8 months after transplantation. (B)–(E) Related to Figure 2F–K. Quantification of total number of cells (including both CD45.2+ and CD45.1+ cells) in various lineages in SP and BM of CD45.2 WT:CD45.1 WT and CD45.2 KO:CD45.1 WT recipient mice 6 months after transplantation. (F)–(G) A repeat of the experiment described in Figure 2A with sex- and age-matched 6-month-old WT and miR-146a KO female mice. (F) Ratio of CD45.2+ over CD45.1+ cells of various lineages in BM mixtures before transplantation. (G) Ratio of CD45.2+ over CD45.1+ cells of various lineages in PB, SP, and BM 3 months after transplantation. All ratios of CD45.2 WT:CD45.1 WT are normalized to 1. LSK, Lin−cKit+Sca1+; HSC, LSK CD150+CD48−;L⁻S⁻K⁺, Lin-Sca1⁻cKit⁺.
Figure 3 with 1 supplement
Hematopoietic-intrinsic and hematopoietic-extrinsic contribution to hematopoietic defects.
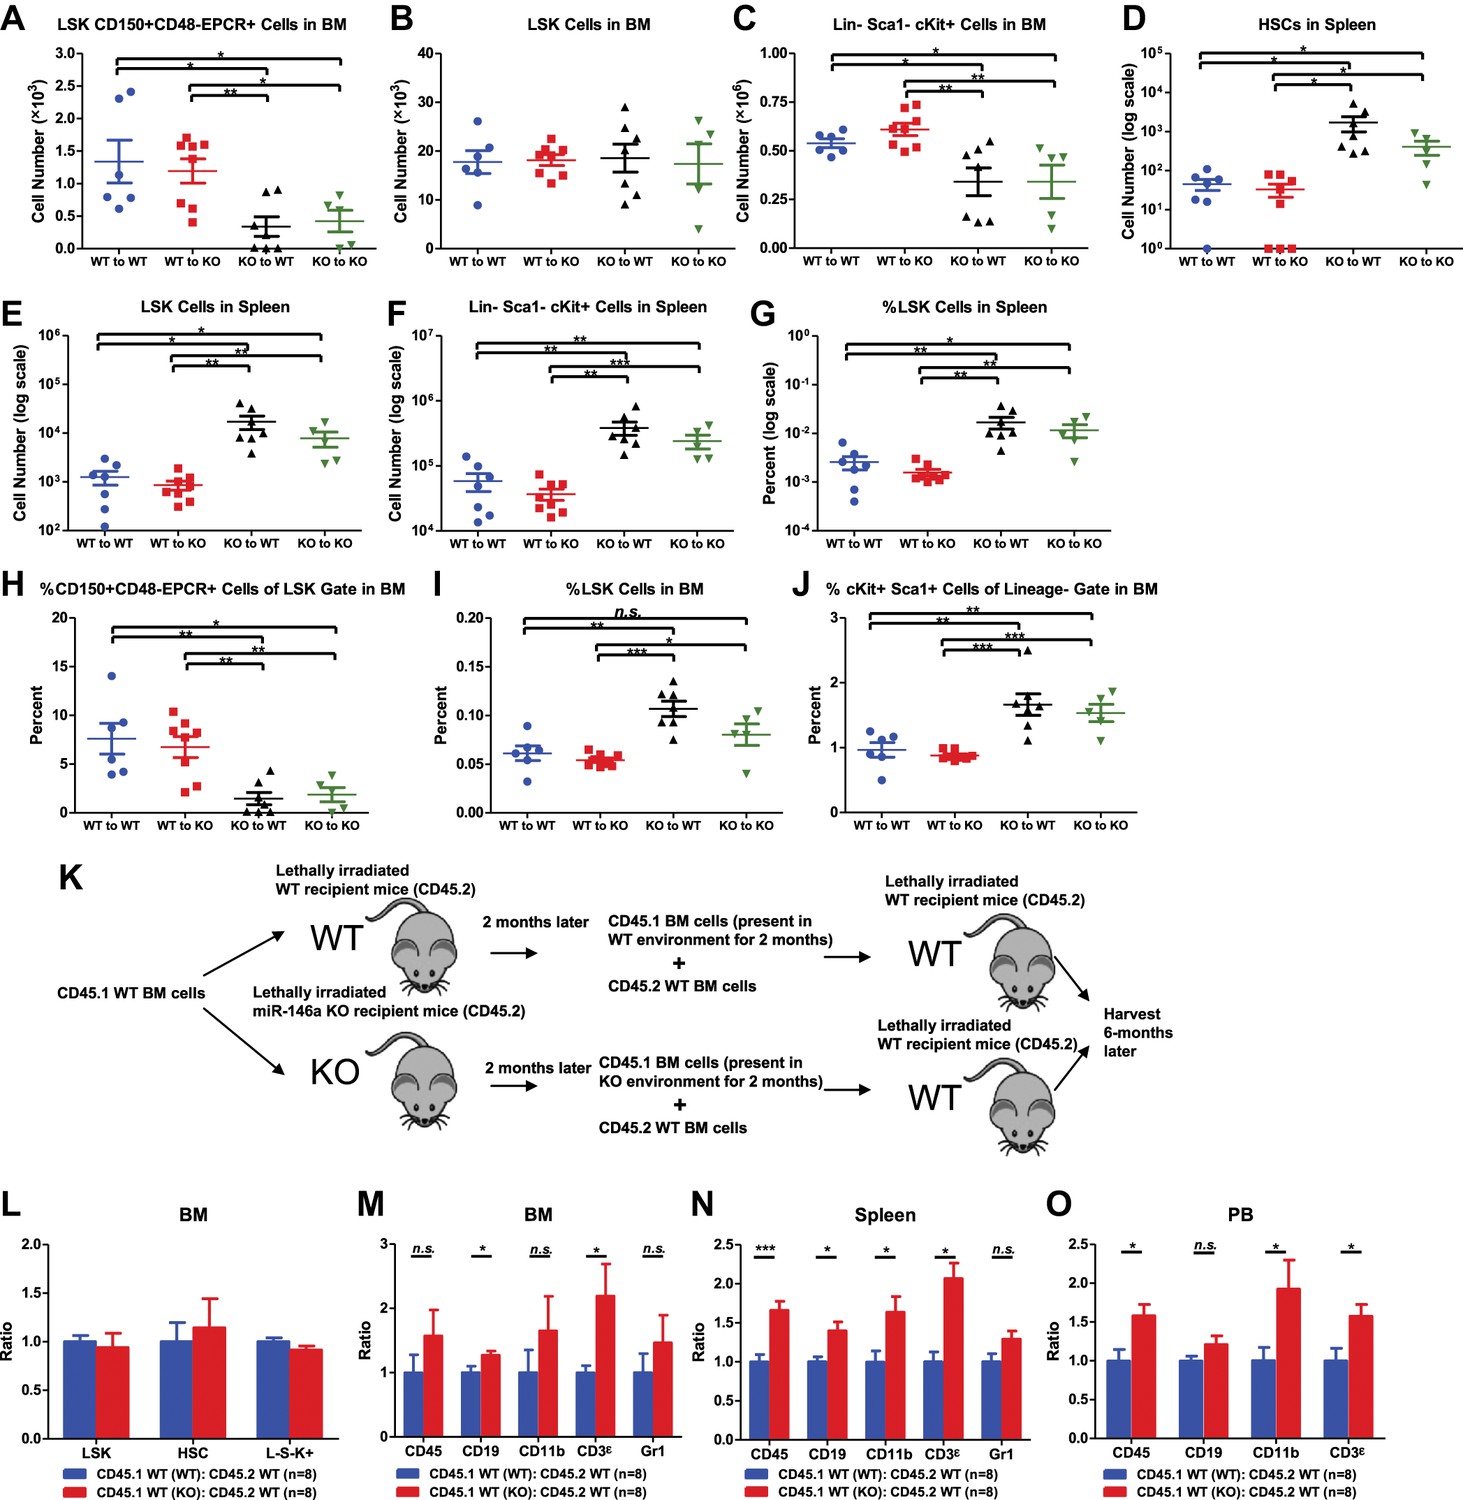
(A)–(J) Reciprocal bone marrow (BM) transplant performed by transferring WT donor BM cells to WT recipient mice (WT to WT), WT donor BM cells to miR-146a KO recipient mice (WT to KO), miR-146a KO donor BM cells to WT recipient mice (KO to WT), and miR-146a KO donor BM cells to miR-146a KO recipient mice (KO to KO). All donor and recipient mice were 8-week-old female mice. Mice were harvested for analysis at the end of 5 months. Quantification of total number of HSPCs in spleen and BM, including LSK CD150+CD48−EPCR+ HSCs (A), LSK (Lin−cKit+Sca1+) cells (B), Lin−cKit+Sca1− cells (C) in BM, and LSK CD150+CD48− HSCs (D), LSK cells (E), and Lin−cKit+Sca1− cells (F) in spleen. Quantification of percent of HSPCs in spleen and BM, including percent LSK cells in spleen (G), percent of CD150+CD48−EPCR+ HSCs in LSK gate in BM (H), percent of LSK cells in total BM (I), and percent of cKit+Sca1+ in Lin− gate in BM (J). (K)–(O). Serial BM transplant performed by first transplanting CD45.1+ WT BM cells into either CD45.2+ WT or miR-146a KO recipient mice for 2 months, which were then harvested and mixed with CD45.2+ WT BM cells for second transplantation into CD45.2+ WT recipient mice. Mice received CD45.1 WT (WT):CD45.2 WT or CD45.1 WT (KO):CD45.2 WT cells were harvested 6 months later for FACS analysis. (K) Schematic diagram of the experimental setup. (L) Ratio of CD45.1+ over CD45.2+ cells of BM HSPCs, including LSK cells, LSK CD150+CD48− HSCs and L−K+S− cells. Ratio of CD45.1+ over CD45.2+ cells of various lineages in BM (M), spleen (N), and PB (O), including CD45+, CD19+, CD11b+, CD3ε+ and Gr1+ cells.
Figure 3—figure supplement 1
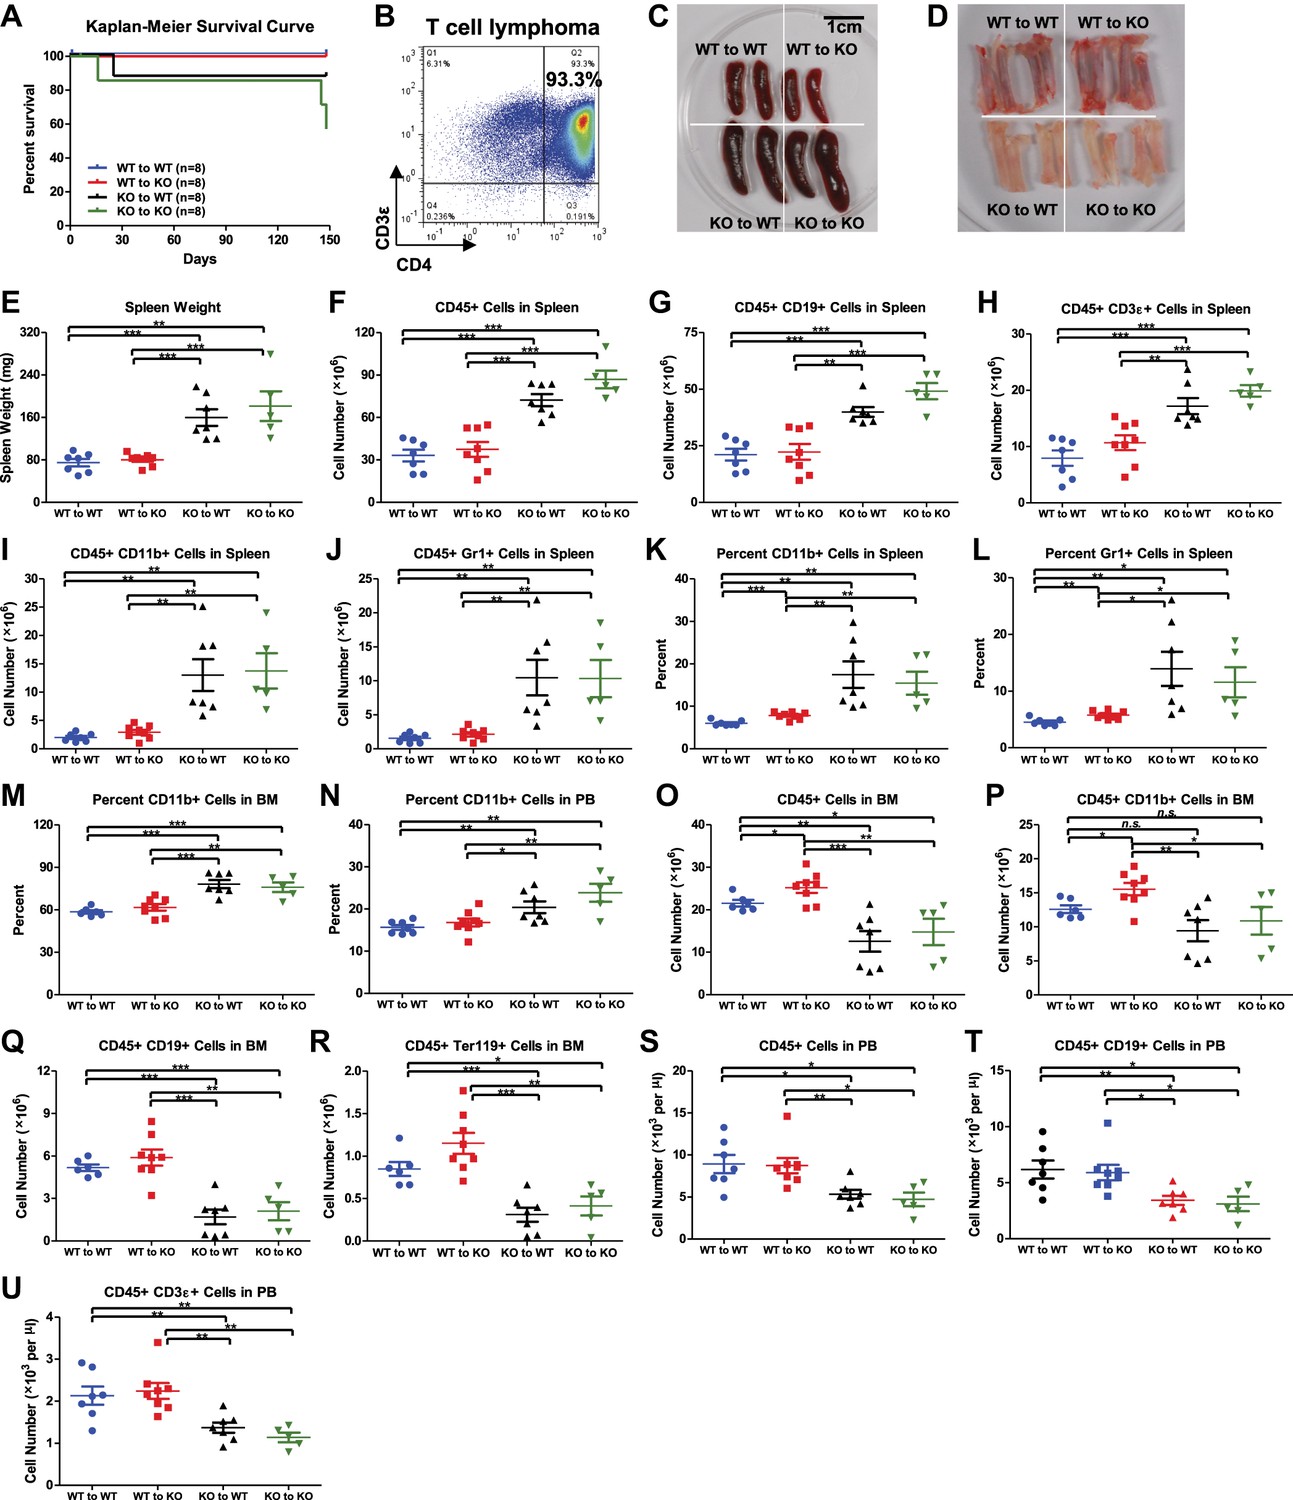
Hematopoietic-intrinsic and hematopoietic-extrinsic contribution to hematopoietic defects.
(A)–(U) The same reciprocal BM transplant experiment as Figure 3A–J. (A) Kaplan–Meier survival curve of the four transplant groups (WT to WT, WT to KO, KO to WT, and KO to KO). (B) FACS plot of a CD4+ T-cell lymphoma from thymus of a moribund KO to KO mouse. Representative photographs of spleens (C) and bone marrows (D). (E) Spleen weights. Quantification of total number of CD45+ (F), CD19+ (G), CD3ε+ (H), CD11b+ (I), and Gr1+ (J) cells in spleen, percentage of CD11b+ (K) and Gr1+ (L) cells in spleen, percentage of CD11b+ cells in BM (M), percentage of CD11b+ cells in PB, number of CD45+ (O), CD11b+ (P), CD19+ (Q), Ter119+ (R) cells in BM and number of CD45+(S), CD19+ (T), and CD3ε+ (U) cells in PB by FACS.
Figure 4

MiR-146a-deficient lymphocytes contribute to the HSC defect and myeloproliferation.
(A)–(M) Age-and-sex-matched WT, miR-146a KO (miR KO), Rag1 KO and miR-146a/Rag1 double KO (miR/Rag1 DKO) mice were allowed to age to 10-month-old before harvested for analysis. (A) Representative FACS plots of CD150+CD48− HSCs of the LSK gate. Quantification of total number of HSCs (B), LSK cells (C), and Lin−cKit+Sca1− myeloid progenitor cells (D) in BM. Quantification of total number of CD45+ (E), CD11b+ (F), and Ter119+ (G) cells in BM. (H) Representative histological pictures (H&E stain) of femur bones. Scale bar, 40 μm. (I). Representative photograph of spleens and spleen weight. Total number of CD45+ (J), CD11b+ (K), and Gr1+ (L) cells in spleen. (M) For comparison, various cell lineages in spleen of only Rag1 KO and miR/Rag1 DKO mice were regraphed from (J–L).
Figure 5 with 2 supplements
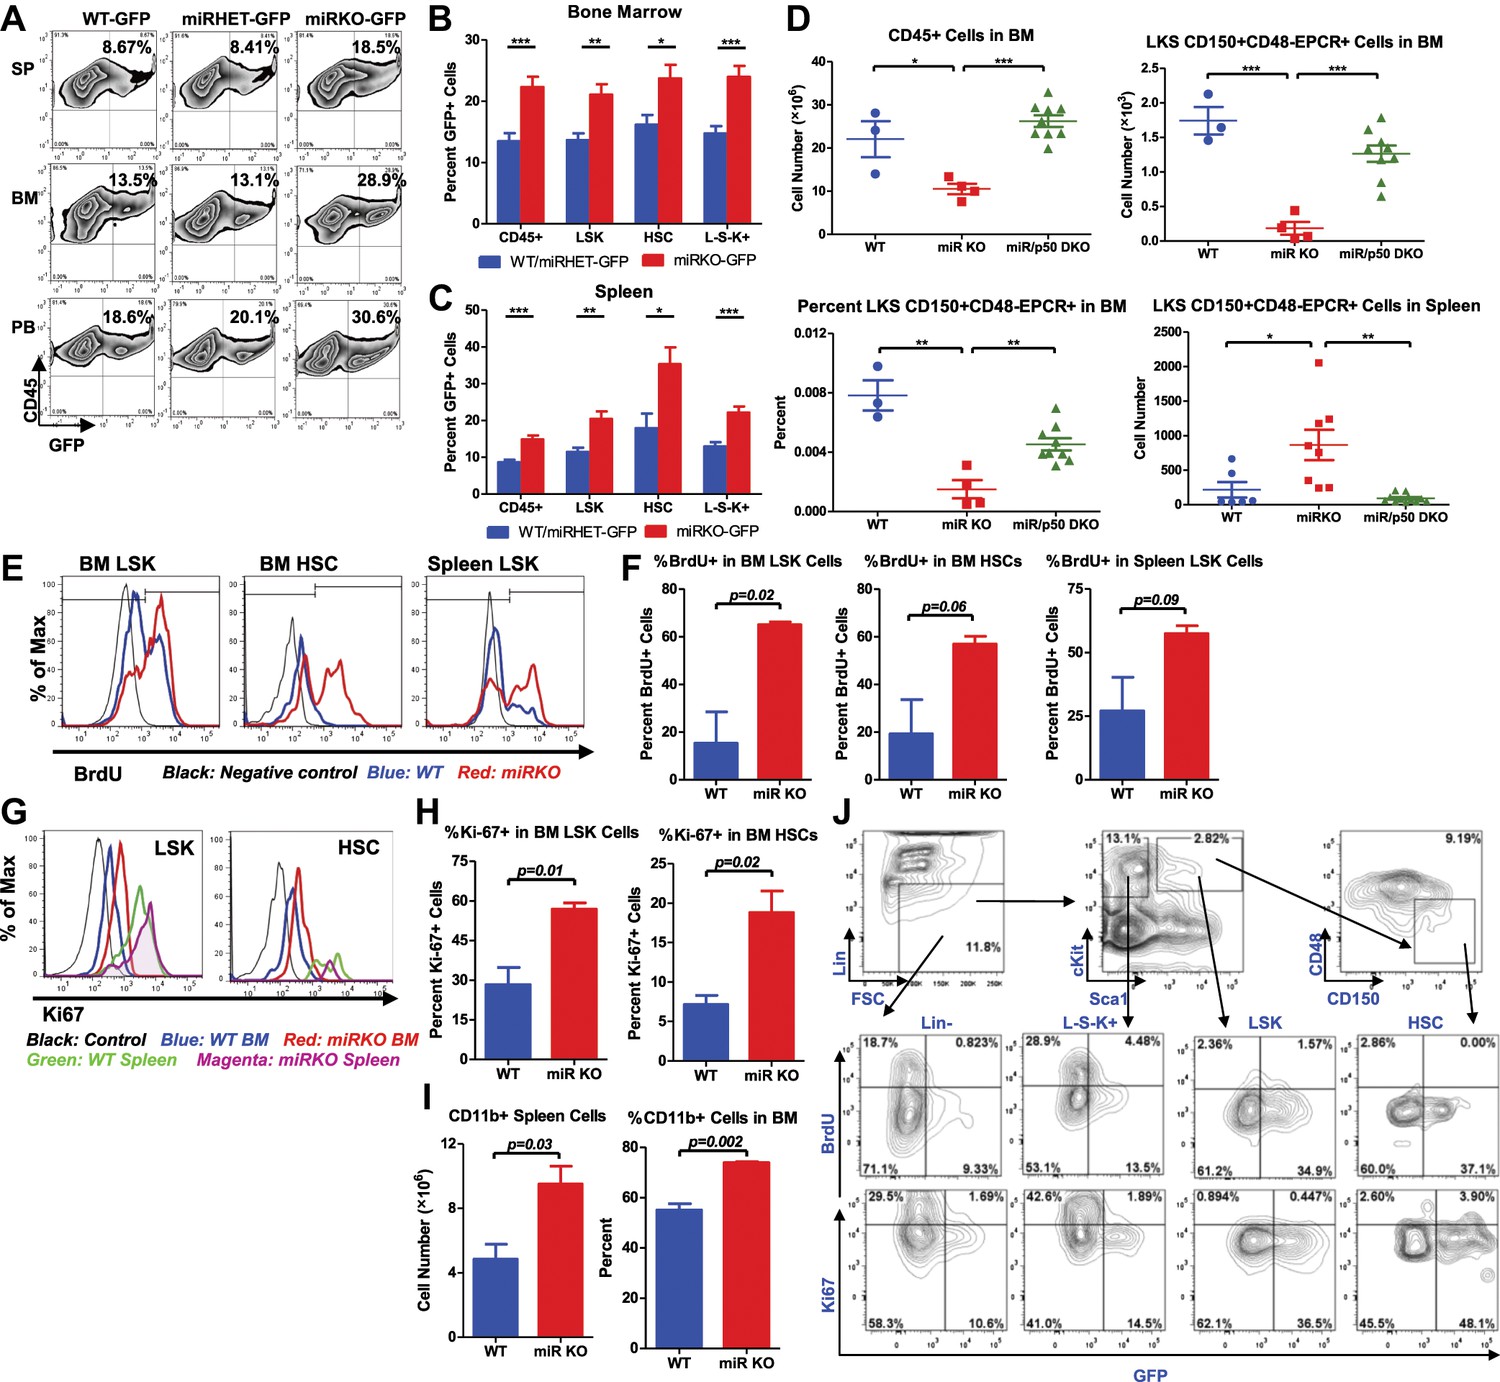
NF-κB regulates HSC homeostasis during chronic inflammation.
(A)–(C) 8-Week-old WT (WT-GFP), Mir146a+/− (miRHET-GFP), and Mir146a−/− (miRKO-GFP) NF-κB-GFP reporter mice were subjected to repeated intraperitoneal LPS stimulation (3 mg LPS/kg of body weight every other day) for 1 week. Percent of GFP+ cells in various lineages were quantified by FACS. (A) Representative FACS plots of GFP+ white blood cells (CD45+) in spleen (SP), bone marrow (BM), and peripheral blood (PB). Quantification of percent GFP+ cells of HSPCs in bone marrow (B) and spleen (C), including CD45+, LSK cells, HSCs (LSK CD150+CD48−) and L−S−K+ myeloid progenitor cells. (D) Age- and sex-matched WT, miR-146a KO (miR KO), and miR-146a/p50 double knockout (miR/p50 DKO) mice were allowed to age to 8–9 months before harvested for analysis. Quantification of total number of CD45+, LSK CD150+CD48−EPCR+ HSCs in BM, percent of LSK CD150+CD48−EPCR+ HSCs of total BM, and total number of LSK CD150+CD48−EPCR+ HSCs in spleen by FACS. (E)–(I) 8-Week-old WT and miR-146a KO (miR KO) mice were subjected to repeated low-dose of intraperitoneal LPS stimulation (1 mg LPS/kg of body weight) daily for 3 days. 1 mg of BrdU was injected intraperitoneally daily. BrdU+ and Ki-67+ HSPCs were quantified by FACS. (E) Representative FACS histograms of BrdU+ LSK cells and HSCs in BM and BrdU+ LSK cells in spleen. Blue: WT mice; red: miR KO mice. (F) Quantification of percent of BrdU+ cells in BM LSK cells, HSCs, and spleen LSK cells. (G) Representative FACS histograms of Ki-67+ LSK and HSCs in BM and spleen. Black: negative control; blue: WT BM; red: miR KO BM; green: WT spleen; magenta: miR KO spleen. (H) Quantification of Ki-67+ cells in BM LSK cells and HSCs. (I) Quantification of number and percent of CD11b+ myeloid cells in spleen and BM. (J) Representative FACS plots of BrdU+ or Ki-67+ and GFP+ cells of Lin−, L−S−K+, LSK and HSC in BM of 8-week-old WT-GFP mice stimulated with LPS (one dose, 1 mg/kg of body weight) for 4 hr.
Figure 5—figure supplement 1
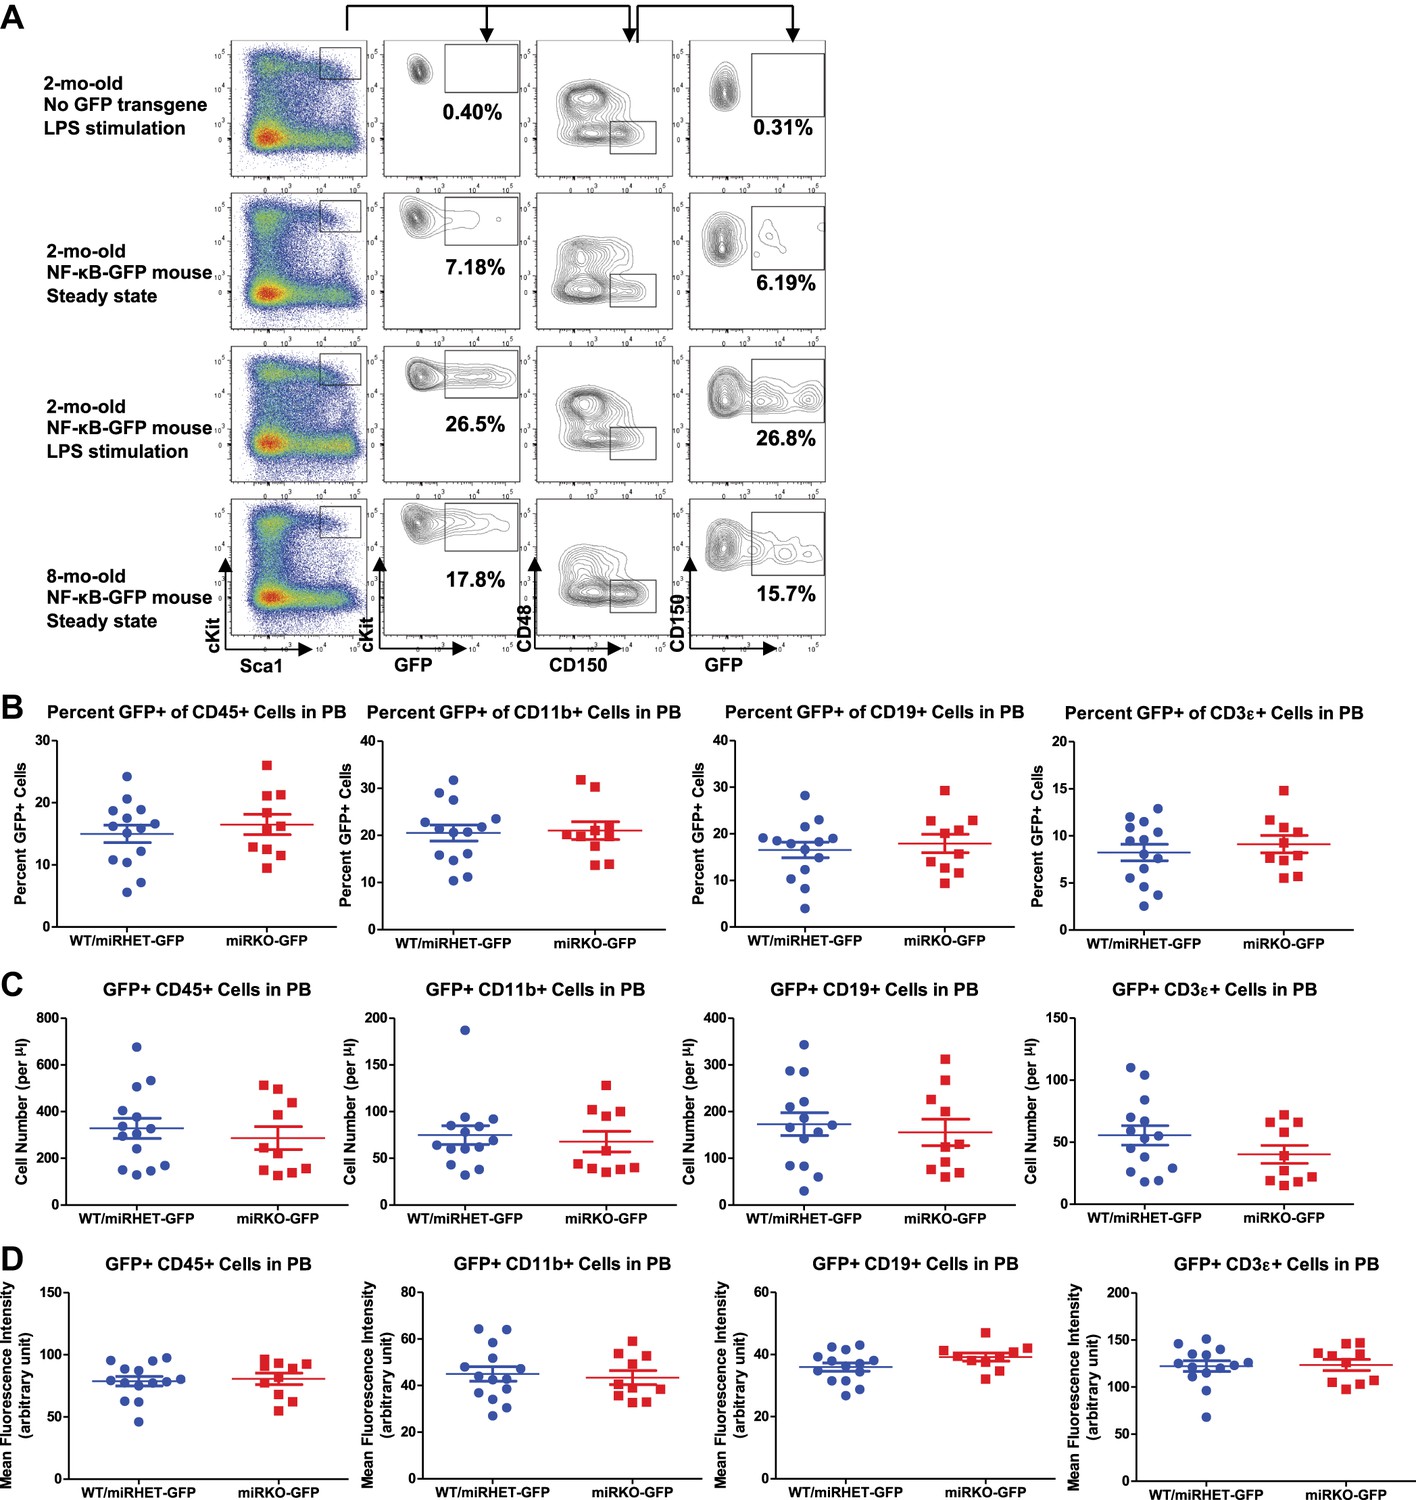
NF-κB activity in HSPCs and peripheral blood of NF-κB-GFP reporter mice.
(A) Regular WT mice and WT NF-κB-GFP reporter mice were challenged with one dose of LPS intraperitoneally (2 mg LPS/kg body weight). GFP+ cells in various lineages were quantified by FACS 6 hr after injection. Representative FACS plots of 2-month-old regular WT mouse (without NF-κB-GFP transgene) with LPS stimulation, 2-month-old WT NF-κB-GFP reporter mouse at basal state, 2-month-old WT NF-κB-GFP reporter mouse with LPS stimulation, and 8-month-old WT NF-κB-GFP reporter mouse at basal state. Percent of GFP+ cells in LSK cells and HSCs were shown. Basal level of percent (B), number (C), and mean fluorescence intensity (MFI) (D) of GFP+ cells in various lineages in peripheral blood (PB) of 2-month-old WT (WT-GFP), Mir146a+/− (miRHET-GFP), and Mir146a−/− (miRKO-GFP) NF-κB-GFP reporter mice were quantified by FACS.
Figure 5—figure supplement 2
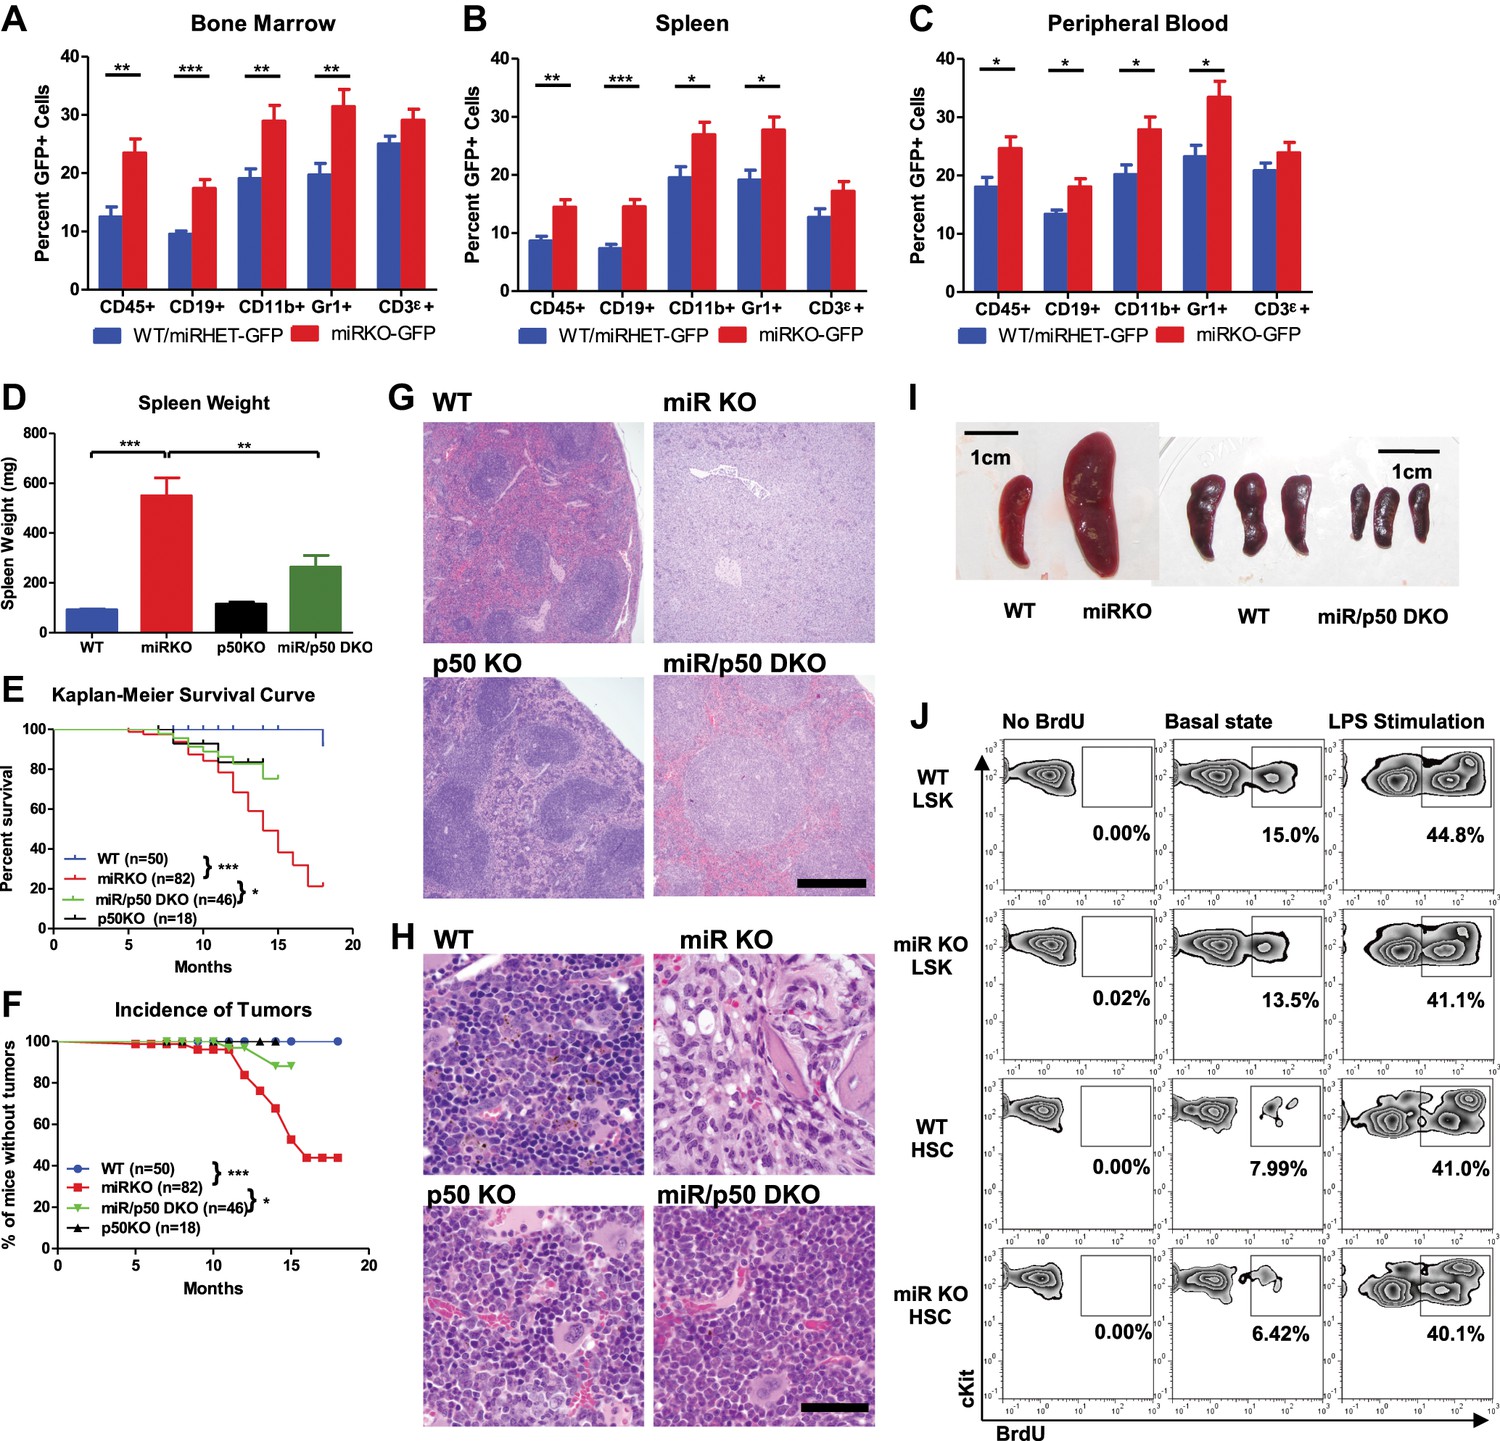
NF-κB regulates HSPC homeostasis during chronic inflammation.
(A)–(C) Related to Figure 5A–C. 8-Week-old WT-GFP, miRHET-GFP, and miRKO-GFP reporter mice were subjected to repeated intraperitoneal LPS stimulation (3 mg LPS/kg of body weight every other day) for 1 week. Percent of GFP+ cells in various lineages were quantified by FACS. Quantification of GFP+ cells in various lineages, including CD45+, CD19+, CD11b+, Gr1+, and CD3ε+, in bone marrow (A), spleen (B), and peripheral blood (C). (D)–(H) Age- and sex-matched WT, miR KO, p50 KO, and miR/p50 DKO mice were allowed to age to up to 18 months. Mice were harvested as they became moribund or at the end of the experiment. Spleen weight (D), Kaplan–Meier survival curve (E), and incidence of tumors (F). Representative histological images (H&E staining) of spleen (G) and femur bones (H) from 12-month-old female WT, miR KO, p50 KO, and miR/p50 DKO mice. Spleen from a miR-146a KO mouse with myeloid sarcoma was shown. Scale bars, 400 μm for spleens and 40 μm for bones. (I) Representative photographs of spleens from Rag2−/− Il2rg−/− mice transplanted with WT, miR KO, or miR/p50 DKO spleen cells. Scale bar, 1 cm. (J) 8-Week-old WT and miR KO mice were challenged with one dose of LPS (2 mg LPS/kg of body weight) intraperitoneally for 12 hr. 1 mg of BrdU was injected intraperitoneally. BrdU+ HSPCs were quantified by FACS. Representative FACS plots of BrdU+ LSK cells and LSK CD150+CD48− HSCs in bone marrow of WT and miR KO mice. No BrdU, no BrdU injection; basal state, no LPS injection; LPS stimulation, BrdU, and LPS injection.
Figure 6 with 1 supplement
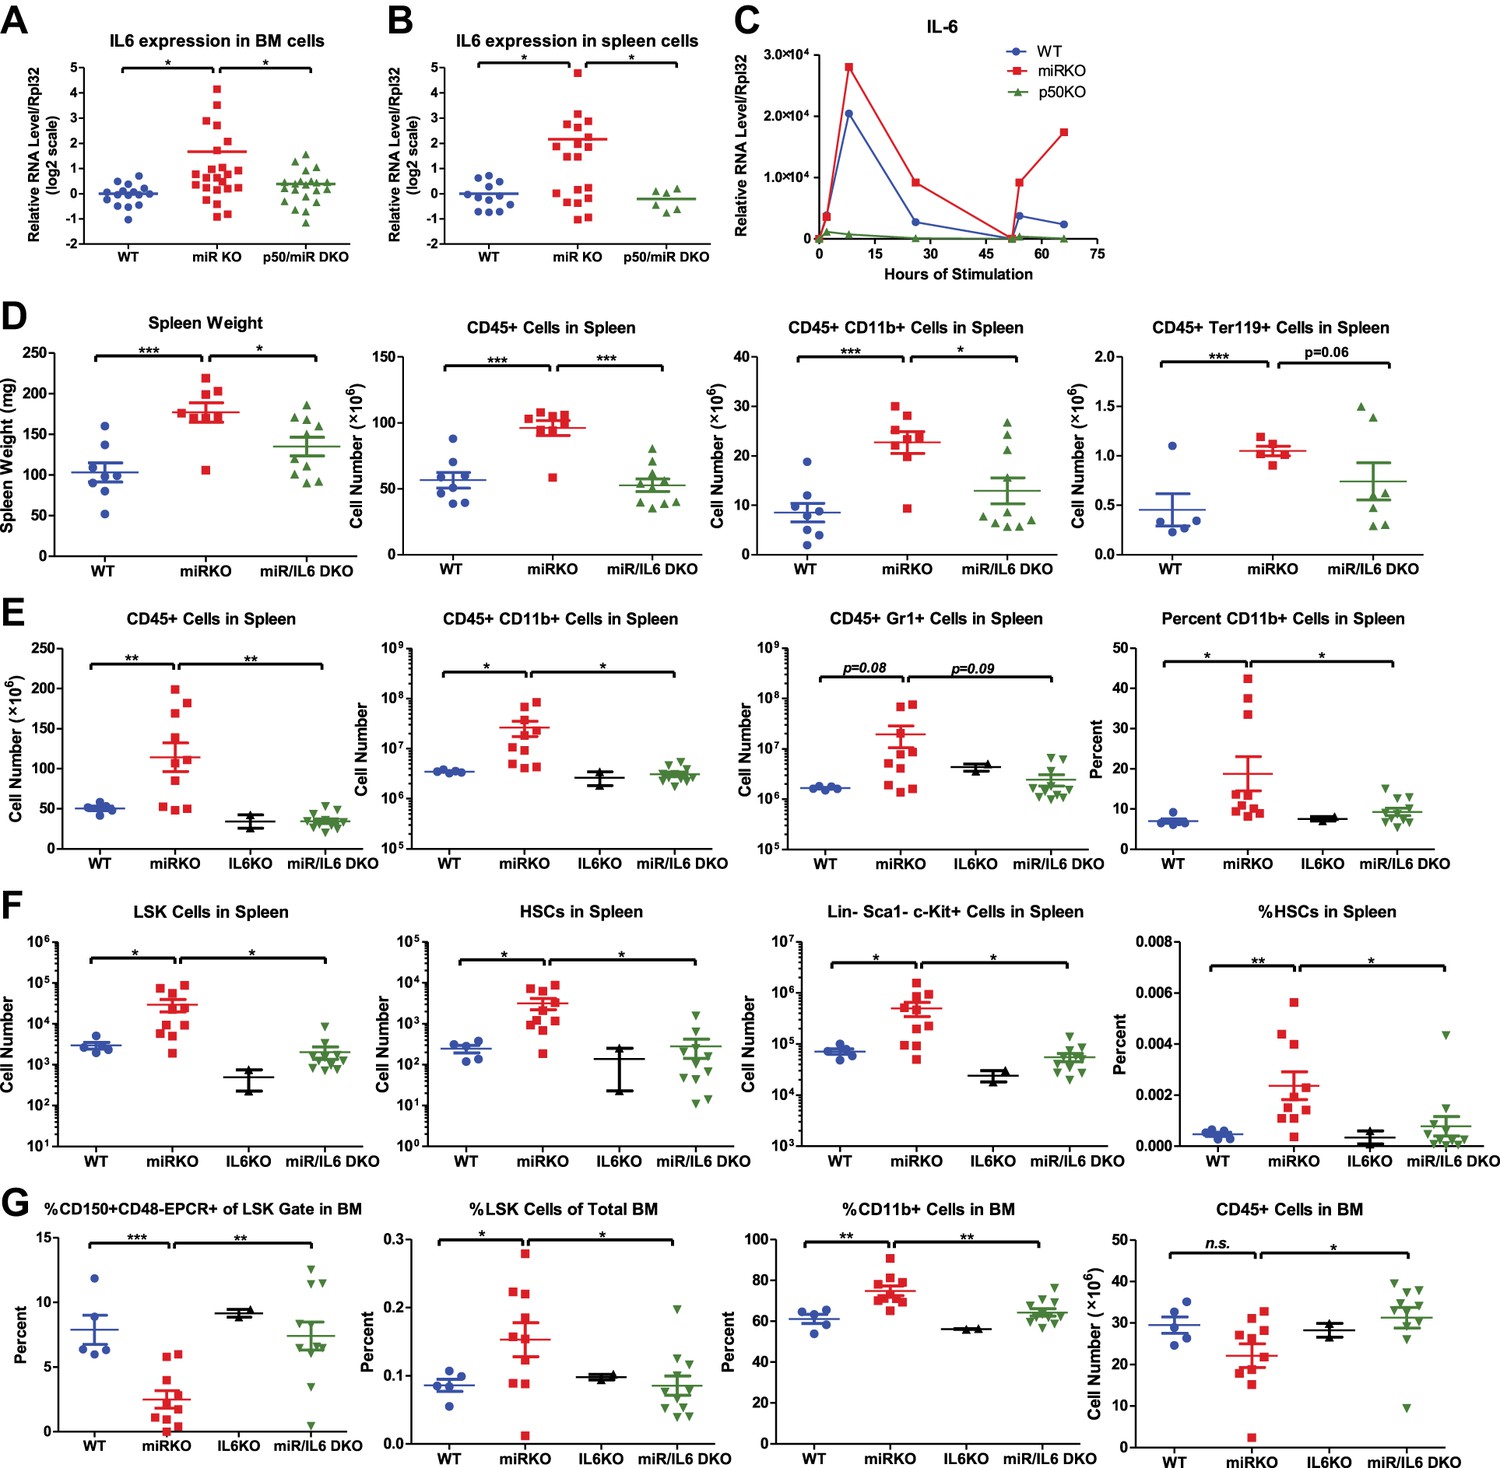
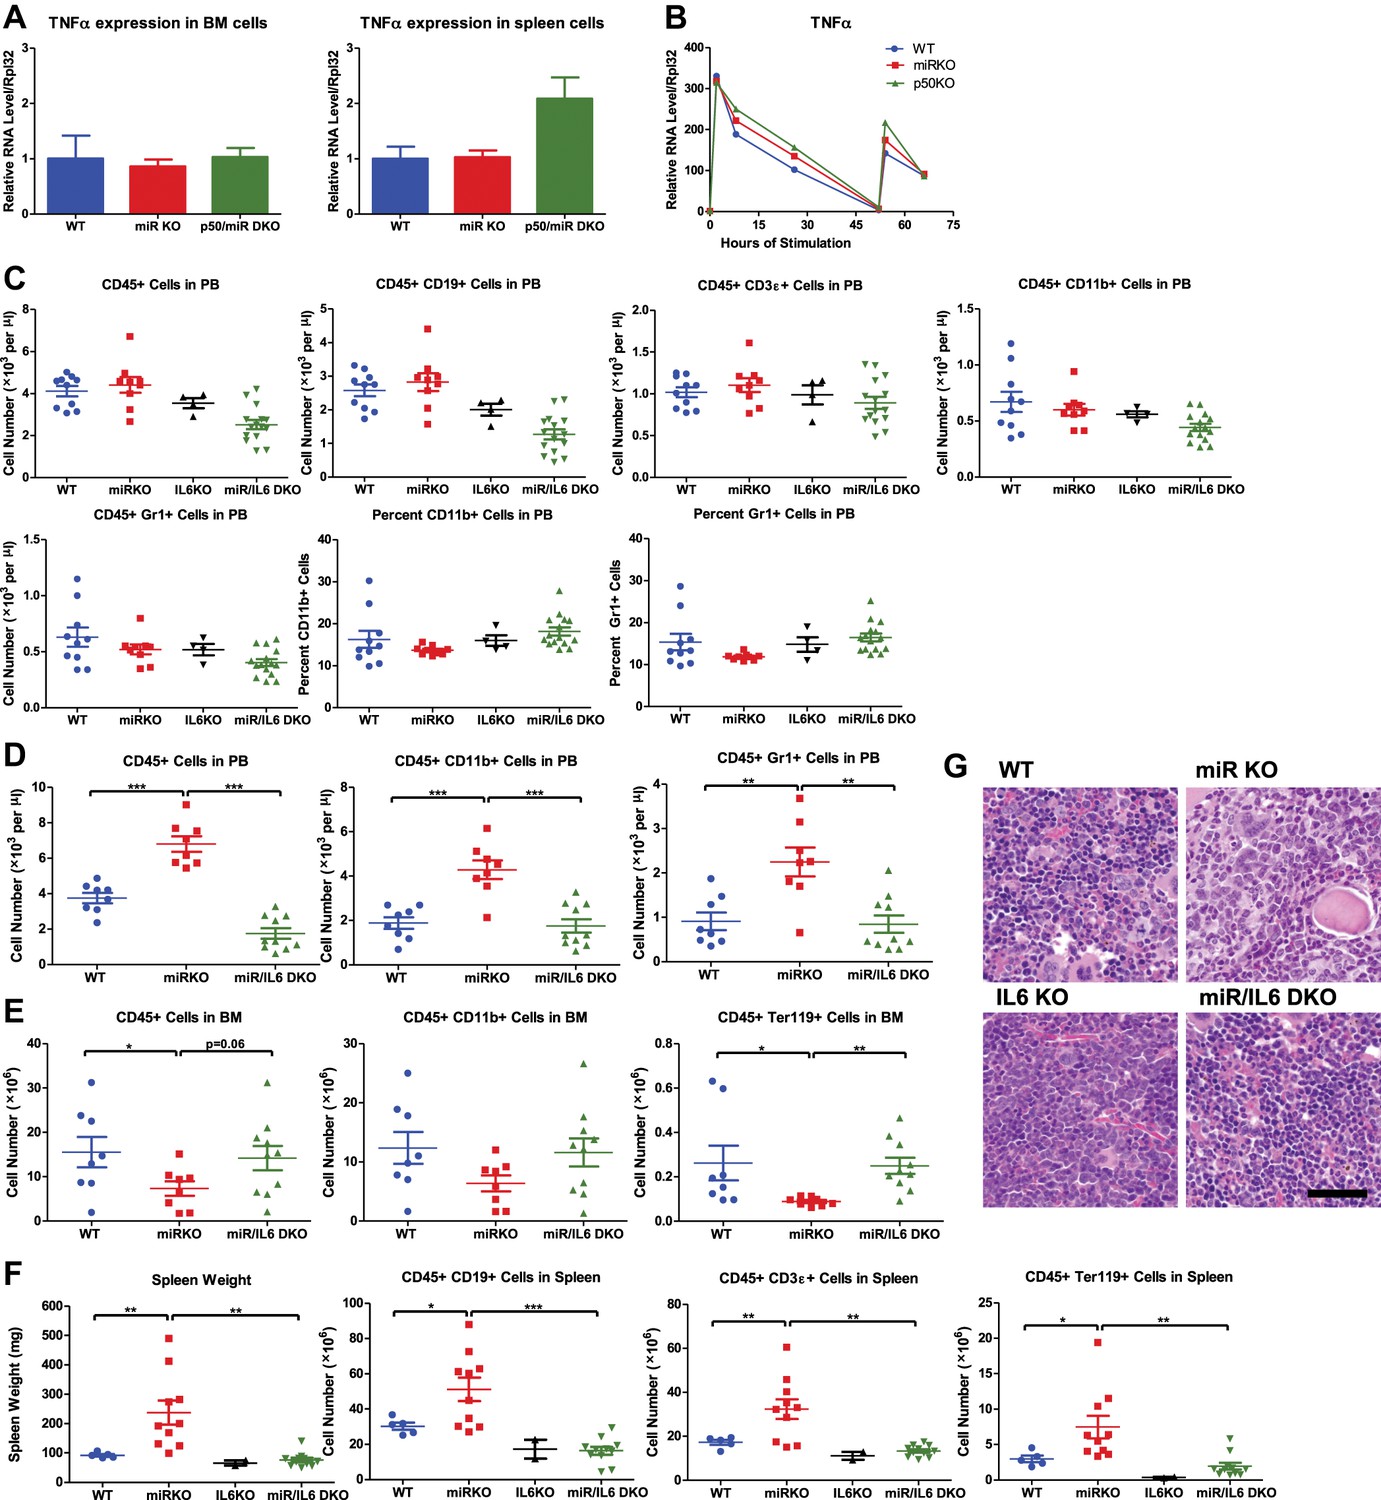
NF-κB-regulated pro-inflammatory cytokine IL-6 is an important driver of HSC depletion and myeloproliferation.
Gene expression of IL-6 in bone marrow cells (BM) (A) and spleen cells (B) of aging WT, miR KO, and miR/p50 DKO mice measured by RT-qPCR. All mice are age- and sex-matched 6- to 10-month-old female mice. Gene expression of IL-6 (C) in bone marrow–derived macrophages (BMMs) stimulated in vitro with LPS (100 ng/ml) measured by RT-qPCR. First stimulation with LPS was given at 0 hr and restimulation at 48 hr. BMMs are generated from 8-week-old WT, miR KO, and p50 KO mice. (D) 2-month-old WT, miR KO, and miR/IL6 DKO mice after repeated intraperitoneal injection of LPS (3 mg LPS/kg body weight on day 1, 3, 5, and 7) and mice were harvested on day 8. Spleen weight and total number of CD45+, CD45+CD11b+, and CD45+ Ter119+ cells in spleen were shown. (E)–(G) Age- and sex-matched WT, miR KO, IL6 KO, and miR/IL6 DKO mice were allowed to age to 6–7 months before harvested for FACS analysis. (E) Quantification of number of CD45+, CD45+CD11b+, CD45+Gr1+, and percent of CD11b+ cells in spleen. (F) Quantification of number of HSPCs, including LSK cells, LSK CD150+CD48− HSCs and Lin−cKit+Sca1− myeloid progenitor cells, in spleen and percent of HSCs in spleen. (G) Quantification of percent of CD150+CD48−EPCR+ HSCs of LSK gate, LSK cells of total BM, and CD11b+ cells of total BM and total number of CD45+ cells in BM.
Figure 6—figure supplement 1
NF-κB–regulated proinflammatory cytokine IL-6 is an important driver of HSC depletion and myeloproliferation.
(A) Related to Figure 6A,B. Gene expression of TNFα in BM cells and spleen cells of aging WT, miRKO, and miR/p50 DKO mice measured by RT-qPCR. All mice are age- and sex-matched 6- to 10-month-old female mice. (B) Related to Figure 6C. Gene expression of TNFα in bone marrow–derived macrophages (BMMs) stimulated in vitro with LPS (100 ng/ml) measured by RT-qPCR. First stimulation with LPS was given at 0 hr and restimulation at 48 hr. BMMs are generated from 8-week-old WT, miR KO, and p50 KO mice. (C) Unperturbed 2-month-old WT, miR KO, IL6 KO, and miR/IL6 DKO mice were bled for FACS analysis. Quantification of total number and percent of various cell lineages in peripheral blood under steady state. (D) and (E) Related to Figure 6D. 2-Month-old WT, miR KO, and miR/IL6 DKO mice after repeated intraperitoneal injection of LPS (3 mg LPS/kg body weight on day 1, 3, 5, and 7) and mice were harvested on day 8. (D) Quantification of total number of CD45+, CD45+CD11b+, and CD45+Gr1+ cells in peripheral blood (PB). (E) Quantification of total number of CD45+, CD45+CD11b+, and CD45+Ter119+ cells in bone marrow (BM). (F) and (G) (related to Figure 6E–G. Age- and sex-matched WT, miR KO, IL6 KO, and miR/IL6 DKO mice were allowed to age to 6–7 months before harvested for FACS analysis. (F) Quantification of spleen weight and total number of CD45+CD19+, CD45+CD3ε+, and CD45+Ter119+ cells in spleen. (G) Representative histological pictures (H&E stain) of femur bones. Scale bar, 40 μm.
Figure 7
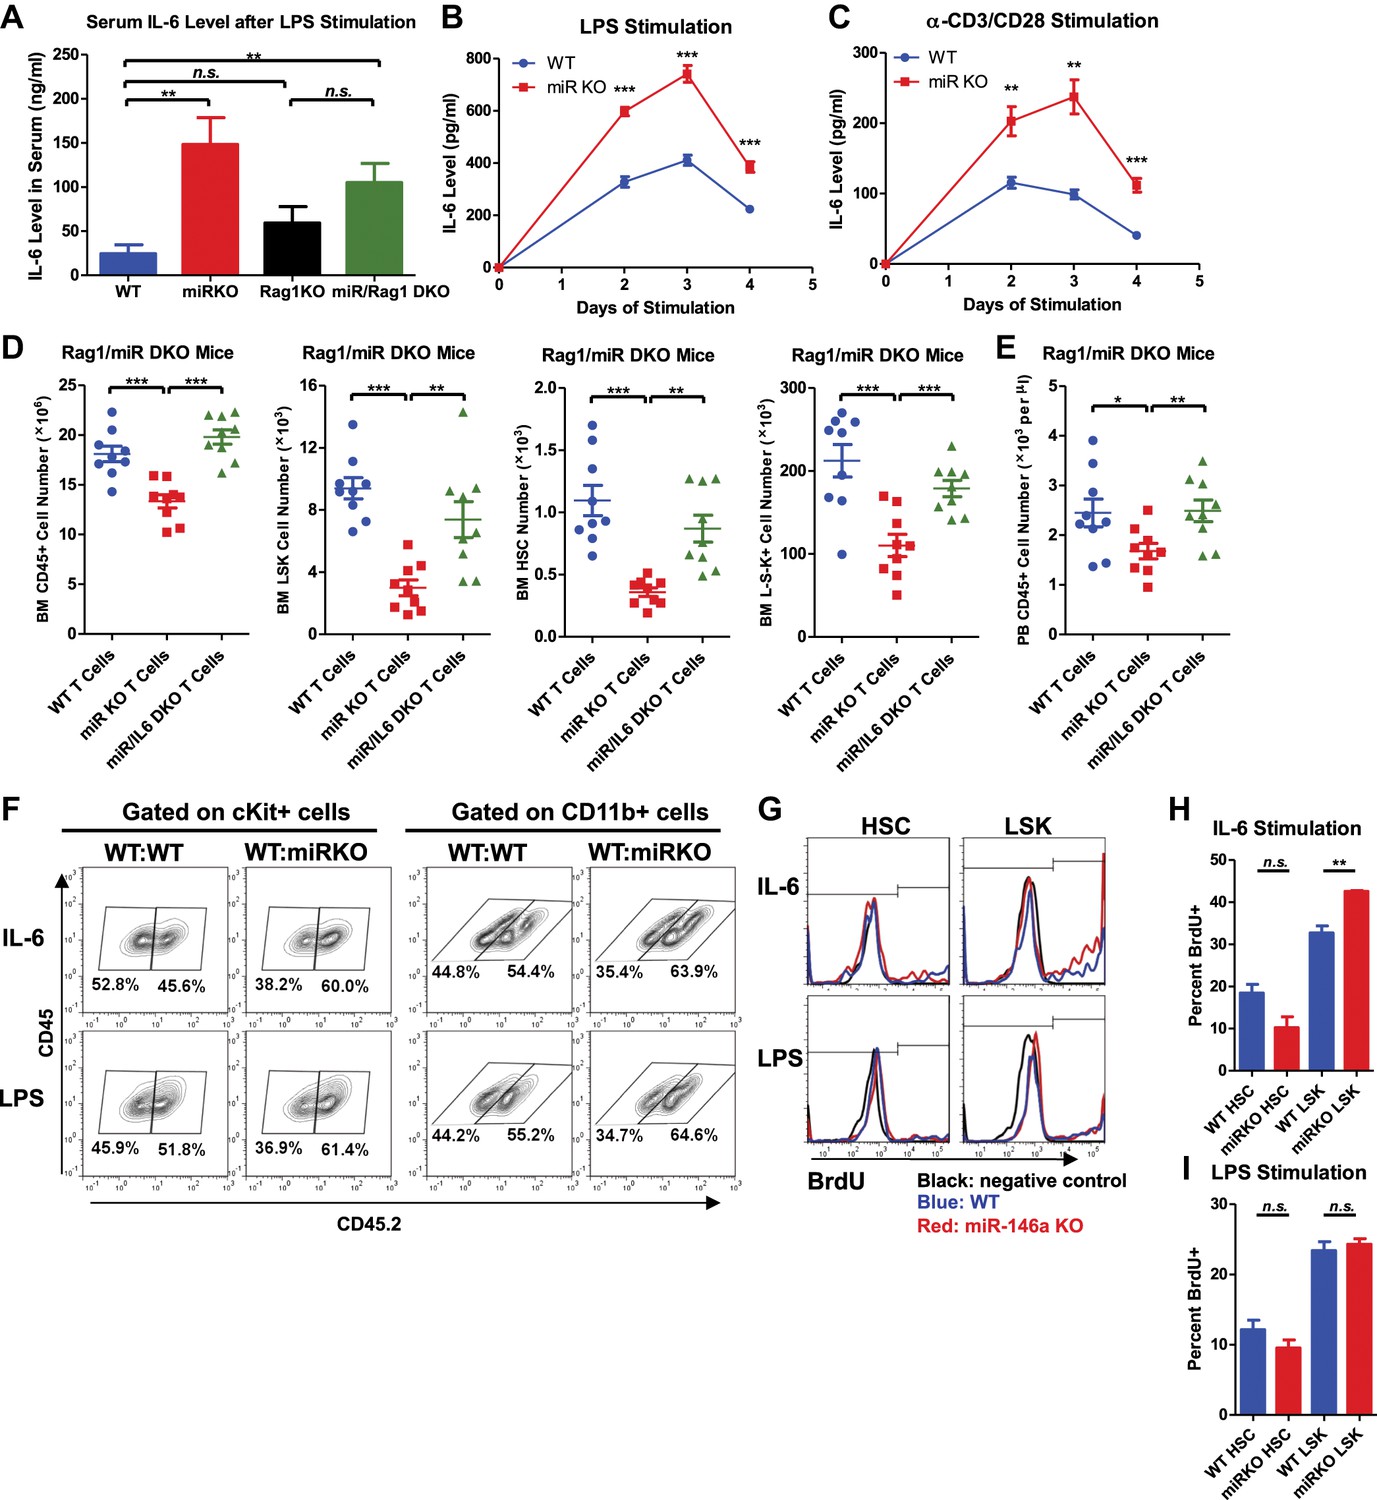
Analysis of cellular source and direct cellular target of IL-6.
Serum level of IL-6 measured by ELISA in 2-month-old WT, miR KO, Rag1 KO, and miR/Rag1 DKO mice stimulated with LPS (1 mg LPS /kg body weight) intraperitoneally for 6 hr (A) IL-6 concentration measured by ELISA in the culture medium of splenocytes stimulated in vitro with LPS (10 μg/ml) (B) or anti-CD3 (1 μg/ml)/anti-CD28 (0.5 μg/ml) antibodies (C) for 4 days. (D) and (E) CD3ε+ T cells were purified from spleens of 10-month-old WT, miR-146a KO (miR KO), or miR/IL-6 DKO mice. 4 million T cells per mouse were transplanted into 10-month-old miR/Rag1 DKO mice intravenously. miR/Rag1 DKO mice were harvested 1 month after transplant for FACS analysis of white blood cells and HSPCs of bone marrow (D) and/or peripheral blood (E). (F) cKit+ cells were purified from bone marrow of 8-week-old CD45.1+ WT and CD45.2+ WT or miR-146a KO mice. A 1:1 mixture of CD45.1 WT/CD45.2 WT or CD45.1 WT/CD45.2 KO cKit+ cells were co-cultured under IL-6 (50 ng/ml) or LPS (100 ng/ml) stimulation for 3 days. Percentages of CD45.2+ cKit+ or CD11b+ were analyzed by FACS. (G)–(I) LSK cells or long-term HSCs (LSK CD150+CD48−) were sorted from 8-week-old WT or miR-146a KO mice and were cultured in separate wells with IL-6 (50 ng/ml) or LPS (1 μg/ml) stimulation in the presence of BrdU (50 μM). After 18 hr, cells were analyzed for cell surface marker expression and BrdU incorporation by FACS. Representative FACS histograms of BrdU status of HSCs or LSK cells. Negative control represents identically gated and stained cells in the absence of BrdU pulse (G). Quantification of percent BrdU+ HSCs or LSK cells under IL-6 (H) or LPS (I) stimulation.
Figure 8 with 1 supplement
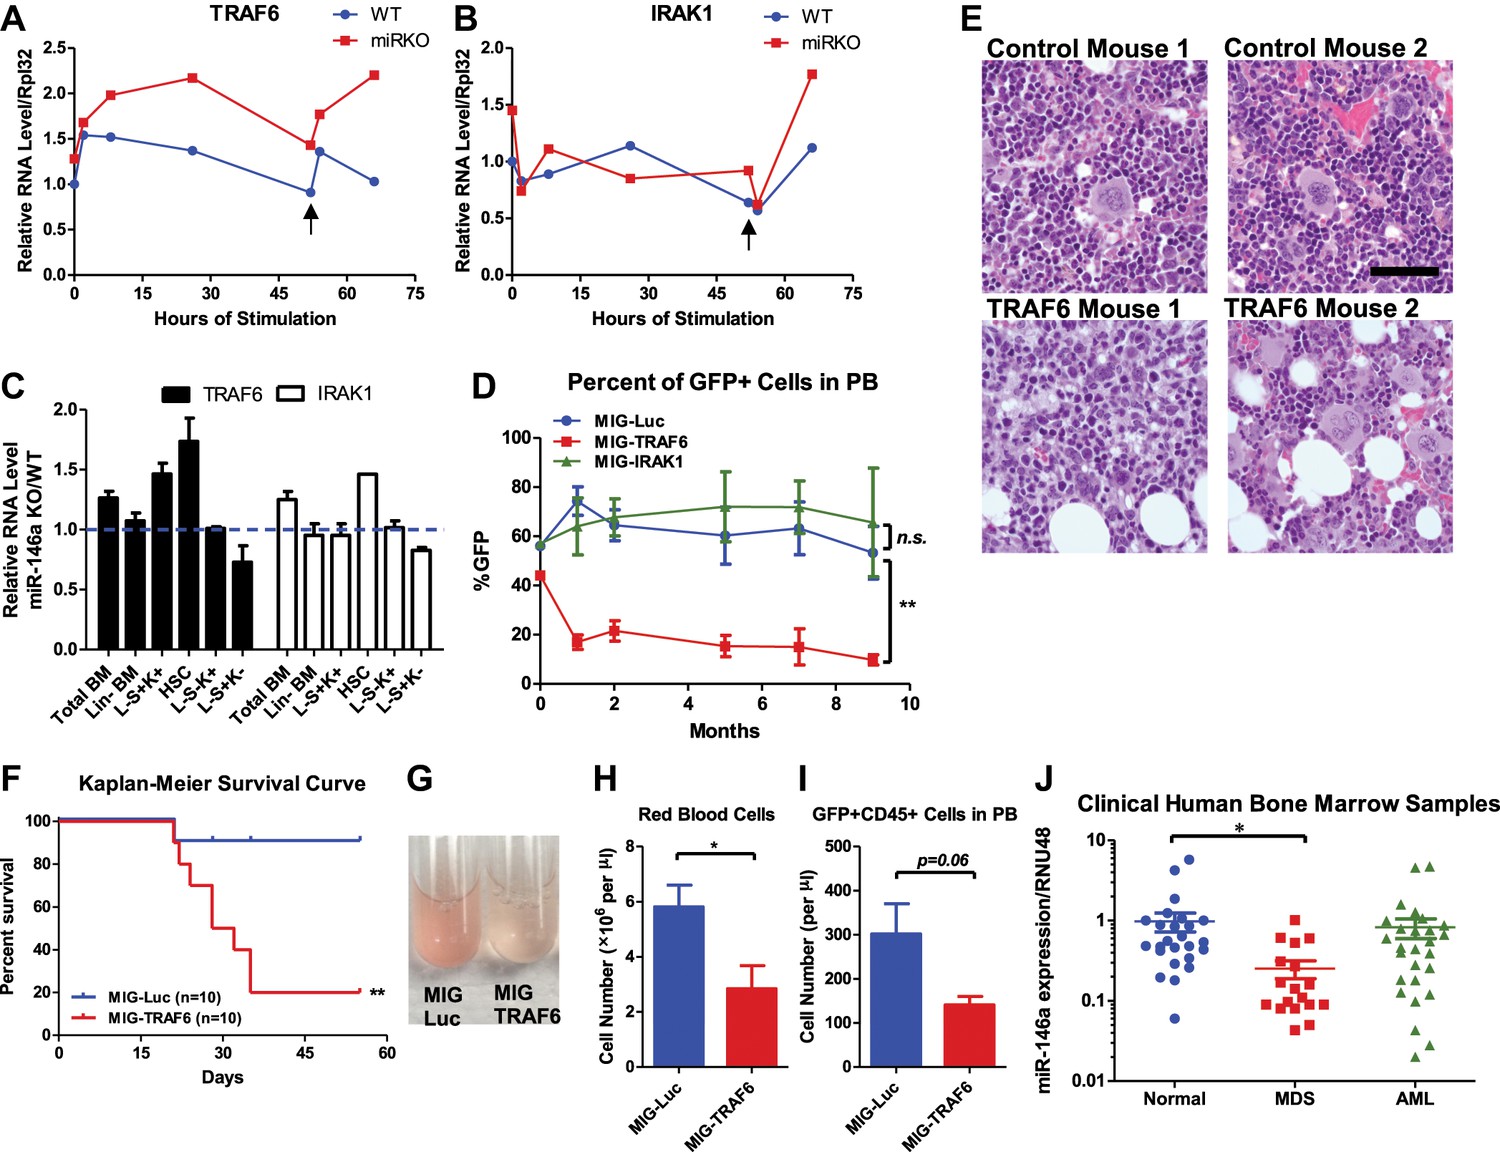
Derepression of TRAF6, a miR-146a target, is responsible for bone marrow failure.
Transcript levels of TRAF6 (A) and IRAK1 (B) in WT and miR-146a KO (miR KO) bone marrow–derived macrophages (BMMs) stimulated with LPS, which was added to the culture medium at 0 and 48 hr (black arrow). (C) Transcript levels of TRAF6 and IRAK1 in total BM, Lin− BM, and FACS-sorted LSK cells, LSK CD150+CD48− HSCs, L−K+S− cells, and L−K−S+ cells from 8-week-old WT and miR-146a KO mice. Fold change of miR-146a KO over WT cells was graphed. (D) and (E) BM HSPCs overexpressing luciferase (MIG-Luc), TRAF6 (MIG-TRAF6), or IRAK1 (MIG-IRAK1) were transplanted into lethally irradiated WT recipient mice. Transduction efficiency was about 50% in all groups as measured by FACS before transplantation. (D) Percent of GFP+ cells in transduced HSPCs before transplantation and in peripheral blood of reconstituted mice at month 1, 2, 5, 7, and 9 were analyzed by FACS. (E) Representative photographs of histological analysis (H&E stain) of femur bones of MIG-Luc control and MIG-TRAF6 mice harvested 9-month after transplantation. Scale bar, 40 μm. (F)–(I) BM HSPCs overexpressing luciferase (MIG-Luc) or TRAF6 (MIG-TRAF6) were transplanted into lethally irradiated WT recipient mice. Transduced HSPCs were sorted for GFP expression to ensure the transplanted HSPCs were 100% GFP+. (F) Kaplan–Meier survival curve of WT recipient mice reconstituted with BM HSPCs overexpressing luciferase (MIG-Luc) or TRAF6 (MIG-TRAF6). Peripheral blood (PB) analysis of MIG-Luc and MIG-TRAF6 mice at 1 month after transplantation. (G) Representative photograph of 1:1000 diluted PB in phosphate-buffered saline (PBS). Red blood cells in PB were counted with hemocytometer (H) and total number of GFP+CD45+ cells in PB (I) were measured by FACS. (J) Downregulation of miR-146a in human myelodysplastic syndromes (MDS) samples. Expression level of miR-146a in bone marrow samples from healthy donors (normal), MDS and acute myelogenous leukemia (AML) patients by Taqman RT-qPCR. RNU48 was used as the normalization gene.
Figure 8—figure supplement 1
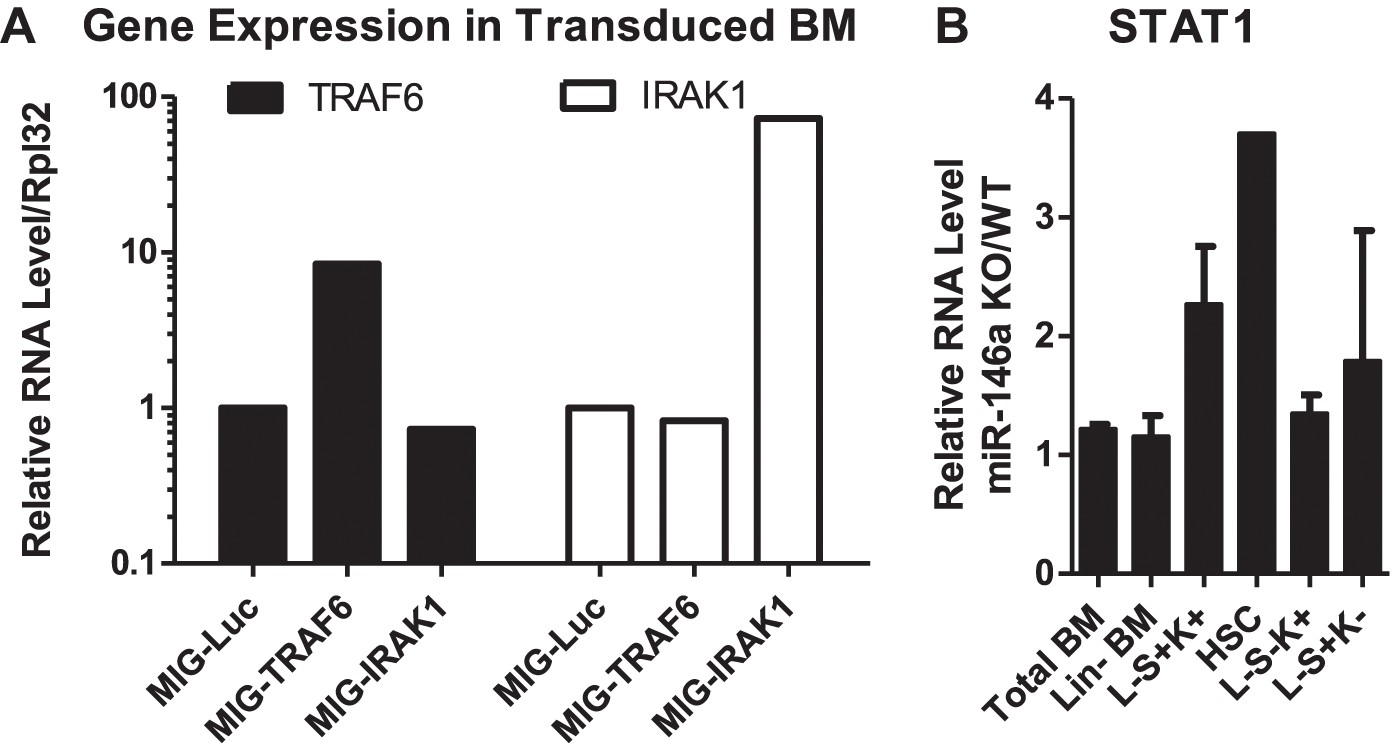
Gene expression analysis of miR-146a targets in BM HSPCs.
(A) Related to Figure 8D. Expression of TRAF6 and IRAK1 in BM HSPCs tranduced with pMIG-Luc, pMIG-TRAF6, or pMIG-IRAK viruses (∼50% GFP+). (B) Related to Figure 8C. Gene expression of STAT1 in various BM HSPC lineages from 2-month-old miR-146a KO and WT mice. Fold change of miR-146a KO over WT cells was graphed.
Download links
A two-part list of links to download the article, or parts of the article, in various formats.
Downloads (link to download the article as PDF)
Open citations (links to open the citations from this article in various online reference manager services)
Cite this article (links to download the citations from this article in formats compatible with various reference manager tools)
MicroRNA-146a acts as a guardian of the quality and longevity of hematopoietic stem cells in mice
eLife 2:e00537.
https://doi.org/10.7554/eLife.00537


