The insulin receptor cellular IRES confers resistance to eIF4A inhibition
- Brandeis University, United States
Figures
Figure 1
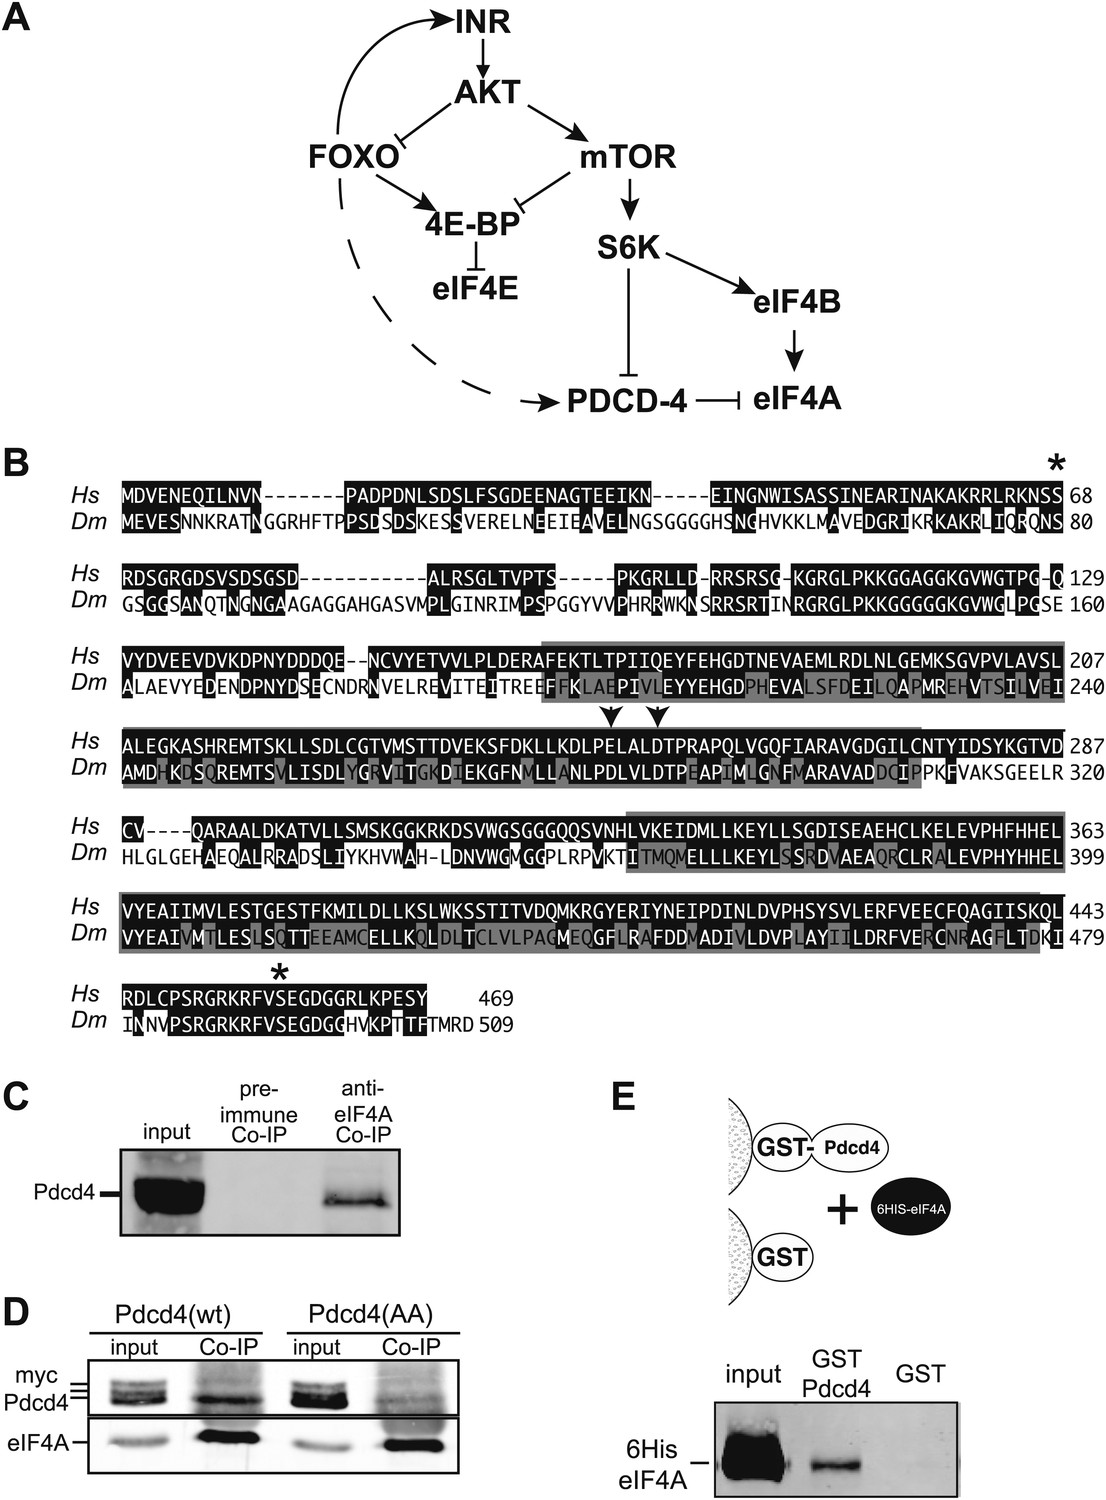
Simplified insulin/insulin-like growth factor signaling diagram.
(A) When Insulin receptor or Insulin-like growth factor receptor is active signaling through AKT inhibits Foxo transcription factors and activates mTOR. mTOR in turn inhibits 4E-BP and activates S6K. S6K in turn inhibits Pdcd4 and activates eIF4B. When insulin signaling is low inhibition of Foxo is relieved and Foxo activates the transcription of Insulin receptor and 4E-BP. The broken line indicates the proposed activation of Pdcd4 by Foxo. (B) Alignment of human (Hs top) and Drosophila (Dm bottom) Pdcd4 proteins. Conserved Akt and S6K phosphorylation sites are indicated by asterisk. Conserved MA3 domains are indicated by shaded boxes. Arrowheads indicate conserved acidic residues important for eIF4A binding in humans. (C) eIF4A interacts with Pdcd4 in Drosophila cells. Cytoplasmic extracts from a saturated culture of S2 cells were subjected to immunoprecipitation with antisera directed against eIF4A or preimmune serum. Pdcd4 was detected with antisera against Pdcd4. (D) Mutant Pdcd4 binds less efficiently to eIF4A than wildtype. Cytoplasmic extracts from cultures of S2 cells expression wild-type Myc-Pdcd4 or mutant Myc-Pdcd4 (AA) were subjected to immunoprecipitation with antisera directed against eIF4A. Myc-Pdcd4 was detected with mouse monoclonal antibody to the Myc tag. Immunoprecipitated eIF4A was detected with rabbit antisera. (E) Immobilized Drosophila Pdcd4 interacts with Drosophila eIF4A. On the top is a cartoon of approach. On the bottom is an immnoblot of proteins eluted from the affinity columns. Position of the recombinant eIF4A is indicated.
Figure 2
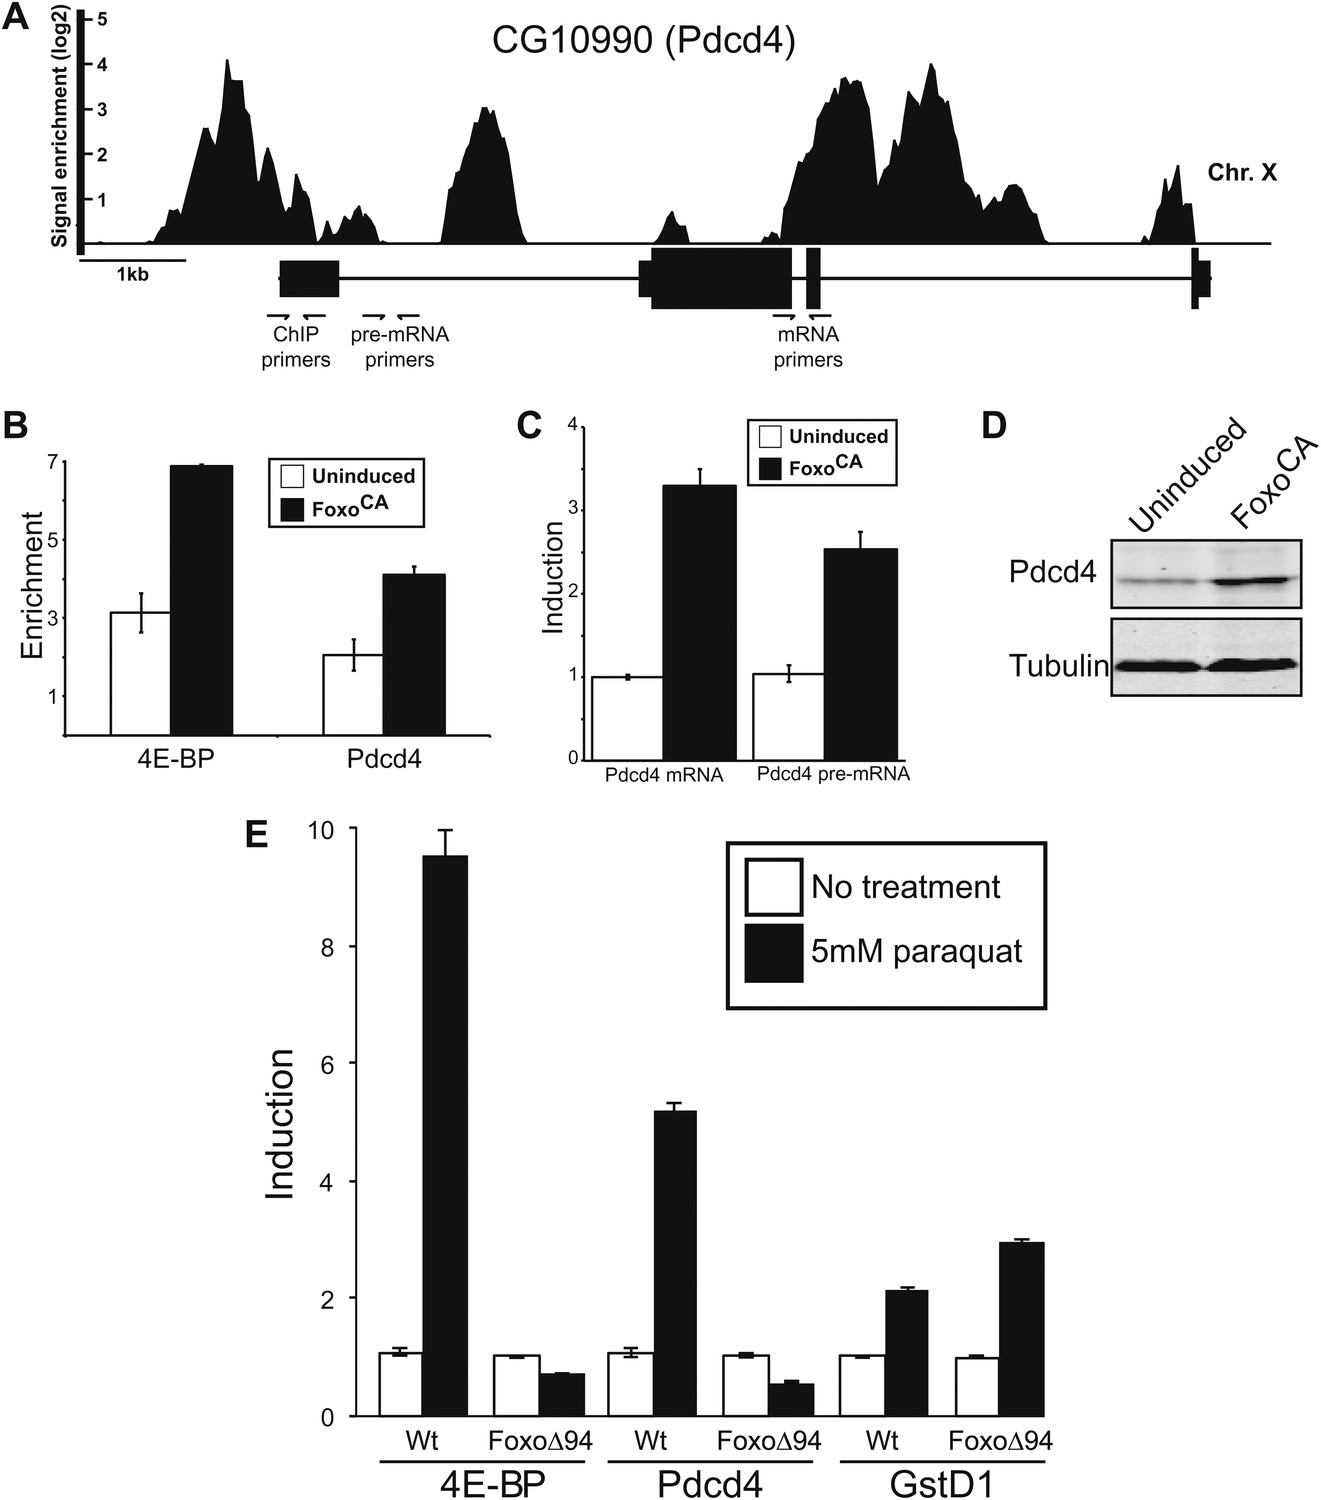
Foxo activates Pdcd4 in Drosophila cells.
(A) Reanalysis of ChIP-chip data from Teleman et al. (2008). Genomic Browser view of Foxo binding to the Pdcd4 locus in starved larva. The data are plotted as the enrichment (log2) over mock precipitated samples. Primers used for ChIP and qPCR are indicated. (B) ChIP of Foxo at 4E-BP promoter and Pdcd4 locus in Drosophila S2 cells expressing constitutively active Foxo (FoxoCA). The data are plotted as fold enrichment over a background region 1 kb downstream of 4E-BP. Uninduced samples are plotted in white, induced samples in black (error bars indicate SD). (C) RT-qPCR of Pdcd4 mRNA and pre-mRNA in Drosophila S2 cells expressing FoxoCA. Data are plotted as fold-induction (error bars indicate SD). (D) Immunoblot of total protein from Drosophila S2 cells expressing FoxoCA. Positions of Pdcd4 and tubulin are indicated. (E) 4E-BP, GstD1, and Pdcd4 RNA levels in untreated and paraquat-treated animals. The levels of RNA were normalized to RP49 and are plotted as fold-induction relative to untreated animals (error bars indicate SEM).
Figure 3
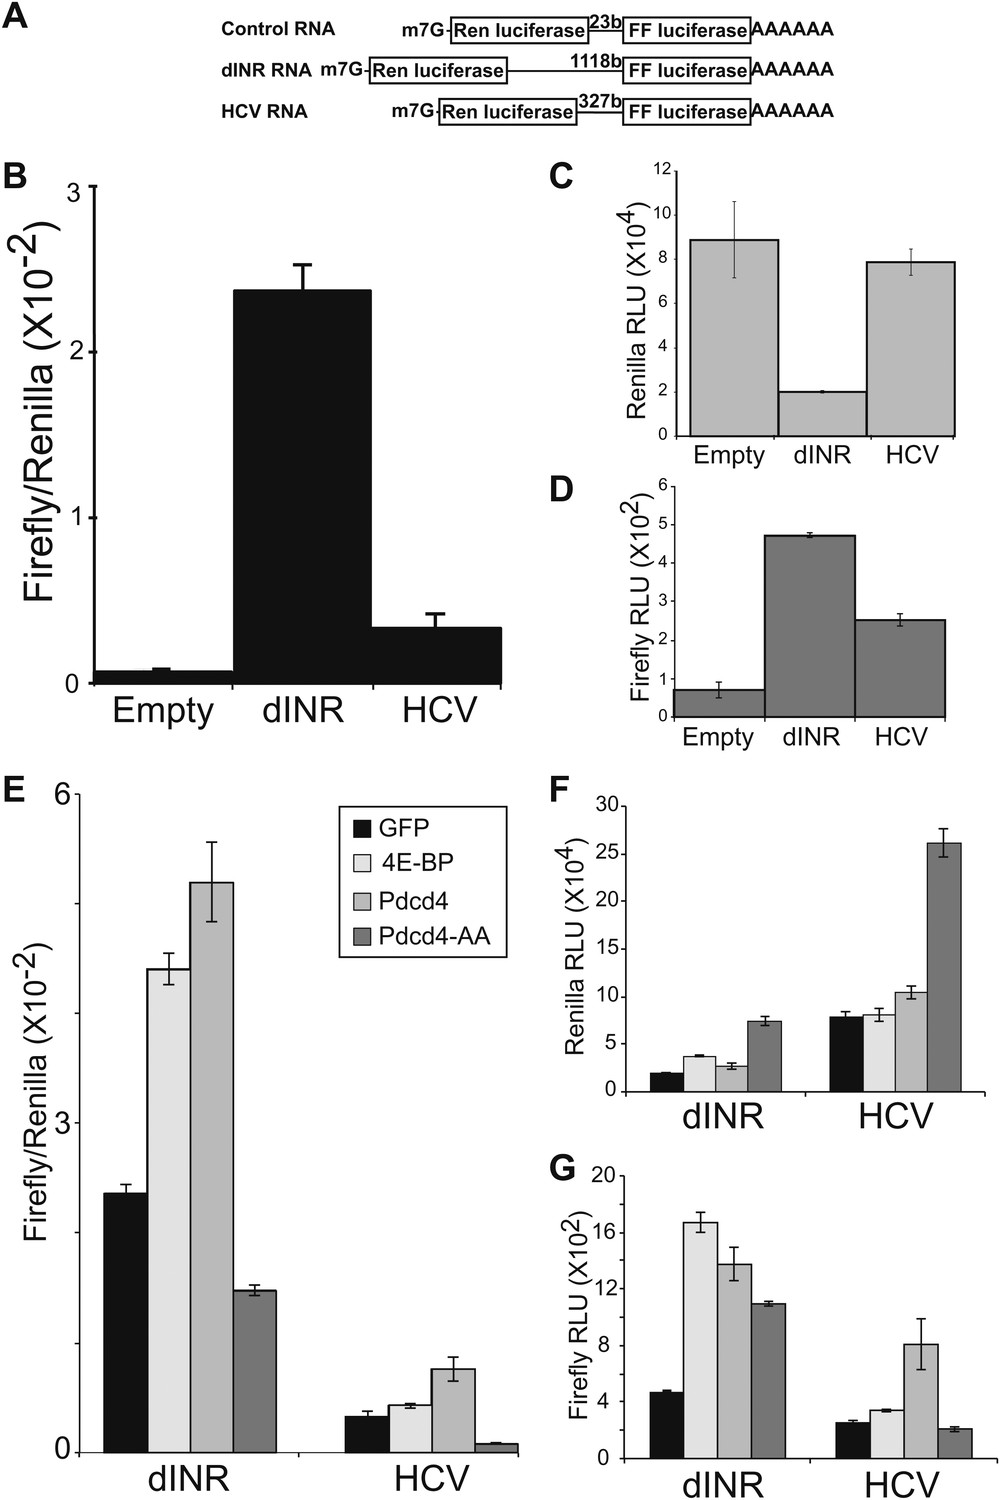
Drosophila insulin receptor 5′UTR provides resistance to Pdcd4.
(A) Diagram of dicistronic reporters. Translation of the Firefly ORF requires internal ribosome entry. Firefly to renilla activity ratio provides an indication of IRES activity. (B) The Drosophila Insulin receptor UTR provides IRES activity comparable to the activity of HCV. (C) Renilla activity of the reporters. (D) Firefly activity of the reporters. (E) Dicistronic reporter activities in the presence of 4E-BP or Pdcd4 expression. 4E-BP and Pdcd4 stimulate the IRES activity of the insulin receptor UTRs. Mutation of the critical acidic residues of Pdcd4 prevents the stimulation. (F) Renilla activity of the reporters in the presence of expressed proteins. (G) Firefly activity of the reporters in the presence of the expressed proteins (error bars indicate SEM).
Figure 4
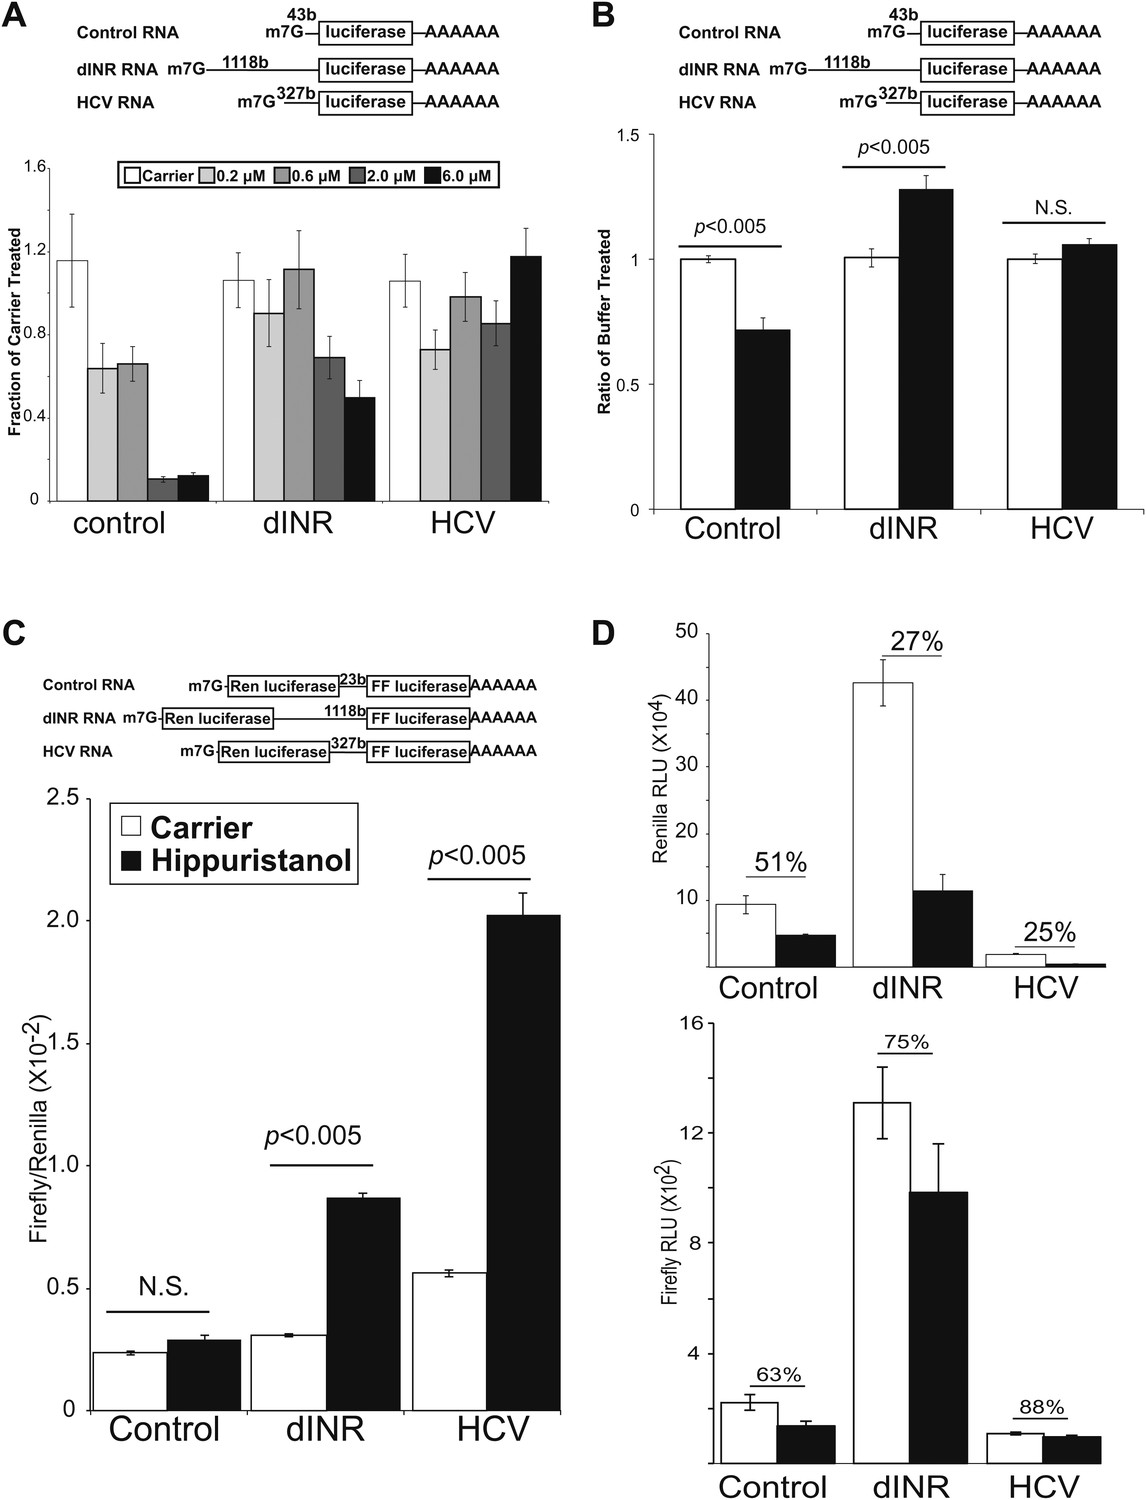
Drosophila insulin receptor 5′UTR provides resistance to eIF4a inhibition.
(A) Top: Diagram of RNAs used in the in vitro translation assays. Bottom: Titration of hippuristanol in in vitro translation assays. The shade of the bars indicates the final concentration of hippuristanol in the assay. The legend appears above the graph. Data are plotted as the fraction activity of the carrier treated extracts (error bars indicate SEM). (B) Top: Diagram of RNAs used in the in vitro translation assays. Bottom: Activity of these RNAs in in vitro translation assays in the absence (white bars) and presence (black bars) of Drosophila Pdcd4 (error bars indicate SEM). (C) Dicistronic RNA translation in vitro. Top: Diagram of RNAs used in the in vitro translation assays. Bottom: Firefly to renilla ratio in the absence (white bars) and presence (black bars) of hippuristanol. (D) Top: Renilla activity in the dicistronic assay. Bottom: Firefly activity in the dicistronic assay. Shading as in C. Percentage above the bars indicates activity after hippuristanol addition relative to carrier treated samples.
Figure 5

Mammalian insulin receptor and insulin-like growth factor receptor 5′UTR provide resistance to eIF4a inhibition.
(A) Diagram of RNAs used in the in vitro translation assays. (B) In vitro Translation in the absence (white bars) and presence (black bars) of excess m7G analogue. Data are plotted as the fraction activity of the mock treated extracts (error bars indicate SEM). (C) Titration of hippuristanol in in vitro translation assays. Data are plotted as the fraction activity of the mock treated extracts (error bars indicate SEM).
Additional files
-
Supplementary file 1
Oligonucleotides used in this study.
All primers written 5′ to 3′.
- https://doi.org/10.7554/eLife.00542.008
Download links
A two-part list of links to download the article, or parts of the article, in various formats.
Downloads (link to download the article as PDF)
Open citations (links to open the citations from this article in various online reference manager services)
Cite this article (links to download the citations from this article in formats compatible with various reference manager tools)
The insulin receptor cellular IRES confers resistance to eIF4A inhibition
eLife 2:e00542.
https://doi.org/10.7554/eLife.00542


