Mechanism of synergistic activation of Arp2/3 complex by cortactin and N-WASP
- University of Oregon, United States
Figures
Figure 1
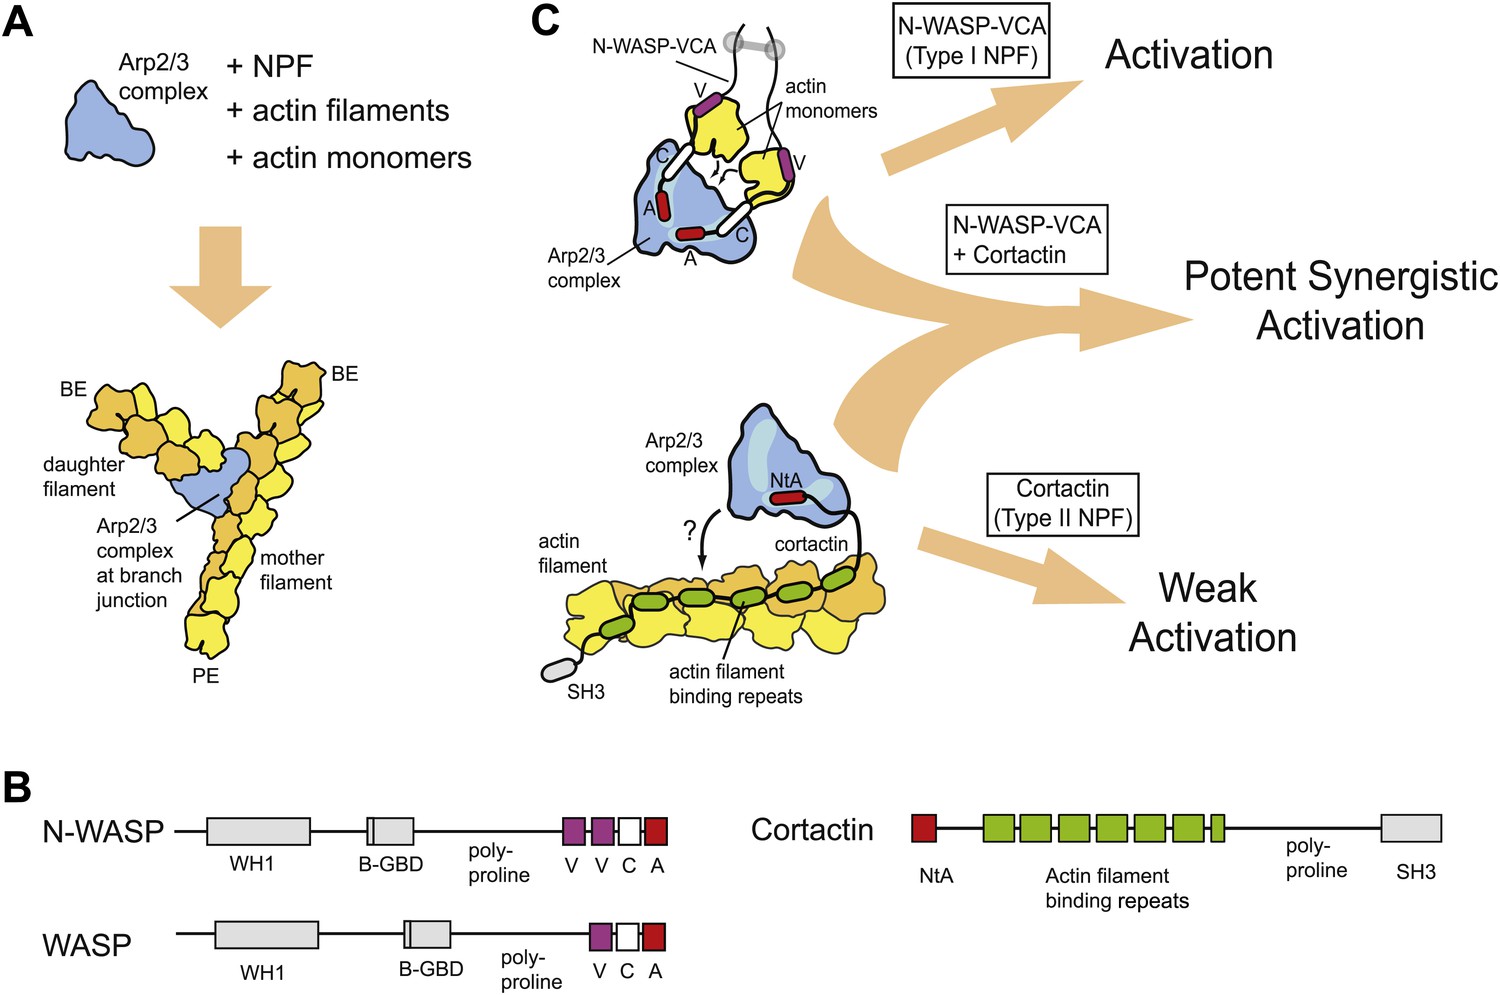
Schematic overview of branching nucleation and the proteins involved.
(A) Overview of branching nucleation depicting the required reaction components (Arp2/3 complex, NPF, actin monomers and actin filaments) and the resultant Y-shaped branches. The barbed and pointed ends of the actin filaments are labeled BE and PE, respectively. (B) Domain organization of prototypical type I (WASP/N-WASP) and type II (Cortactin) NPFs. WH1, WASP homology 1; B-GBD, Basic region and GTPase binding domain; V, verprolin homology (also known as WH2, WASP homology 2); C, central; A, acidic; NtA, N-terminal acidic region; SH3, Src homology 3. (C) Schematic overview of activation of Arp2/3 complex by two classes of nucleation promoting factors. Gray barbell indicates a generic N-WASP dimerization mechanism. Small black arrows indicate either recruitment of actin monomers to Arp2/3 complex by VCA, or recruitment of Arp2/3 complex to actin filaments by cortactin. Light blue areas on Arp2/3 complex indicate the two proposed CA binding sites. The SH3 domain of cortactin is shown here but is omitted in other figures for clarity.
Figure 2
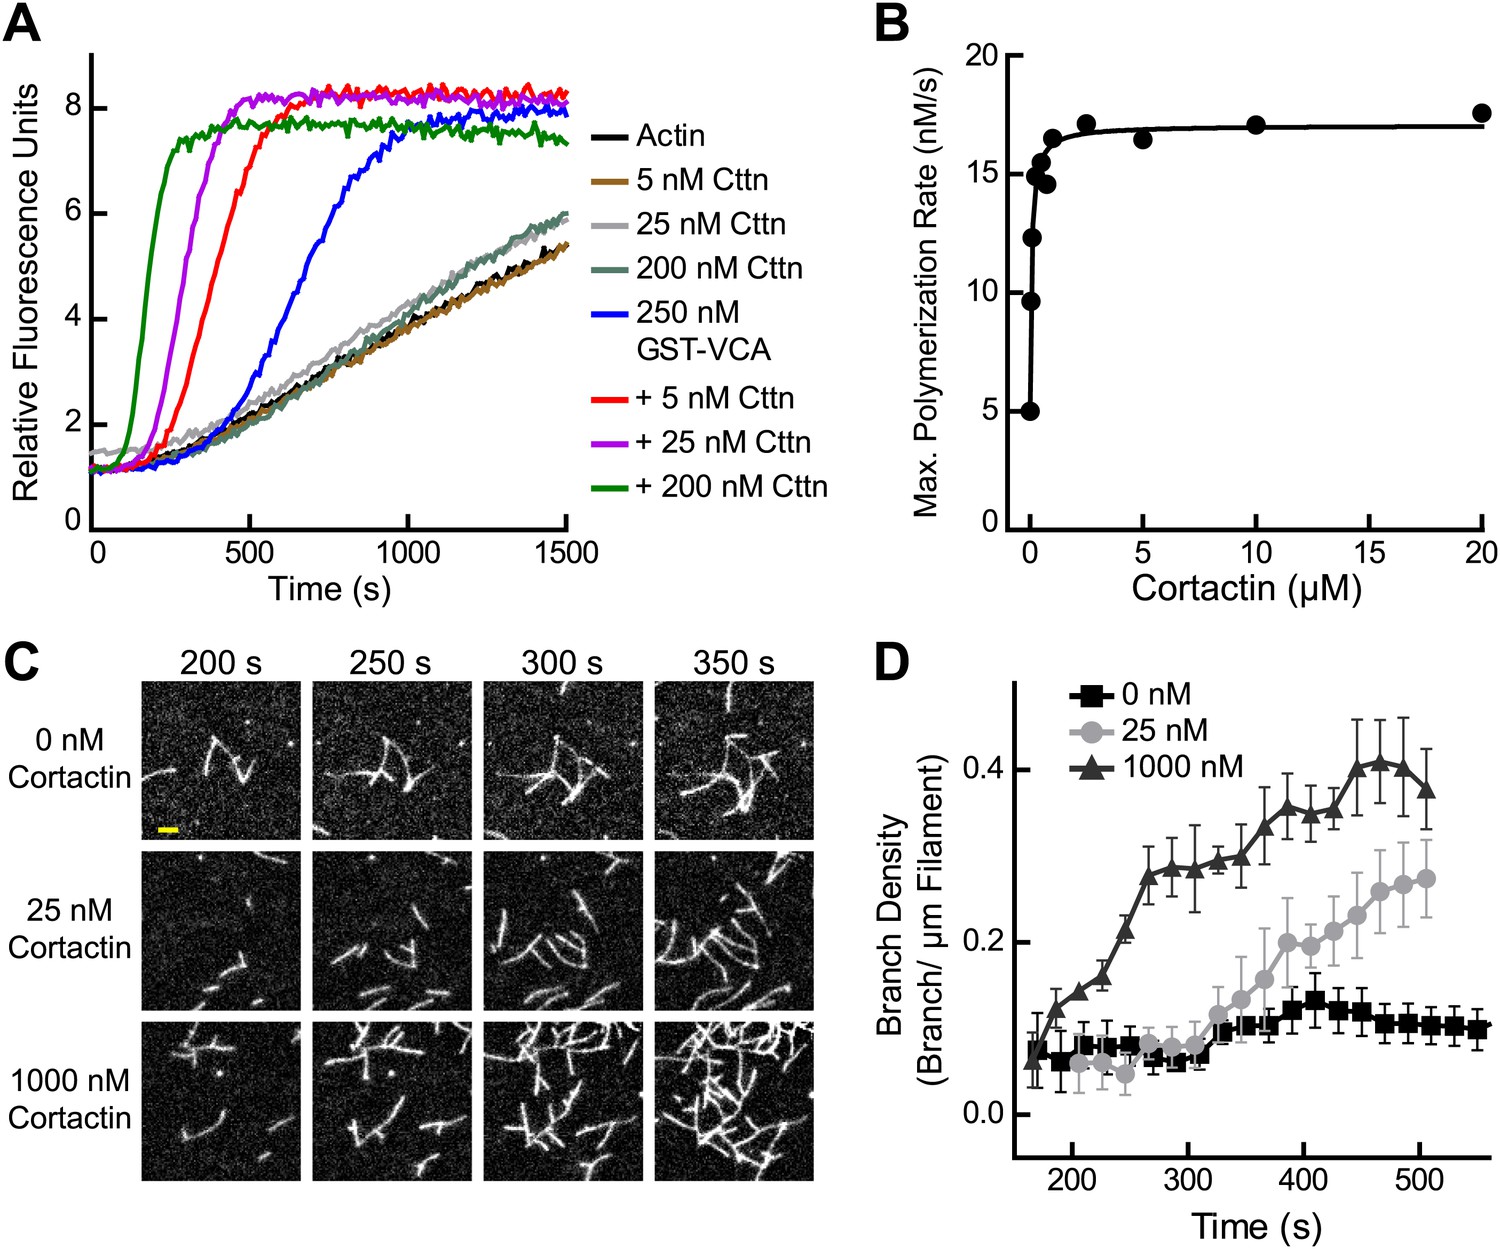
Cortactin synergizes with GST-N-WASP-VCA.
(A) Time course of pyrene-actin polymerization showing synergistic activation of Arp2/3 complex by cortactin and GST-VCA. Reactions contain 2 µM 15% pyrene-actin, 20 nM Arp2/3 complex and cortactin (Cttn) and/or 250 nM GST-VCA as indicated. (B) Plot of maximum polymerization rate vs cortactin concentration for reactions conditions as in panel A with 150 nM GST-VCA. Data were fit as described in ‘Materials and methods’. (C) TIRF microscopy images of reactions containing 1 µM 33% Oregon-Green actin, 10 nM Arp2/3 complex, 50 nM GST-VCA and indicated concentrations of cortactin. (D) Branch density time vs time for TIRF data from panel C. Error bars are the standard error of the mean for at least three regions of interest from an acquisition period. Scale bar: 2 µm.
Figure 3 with 1 supplement
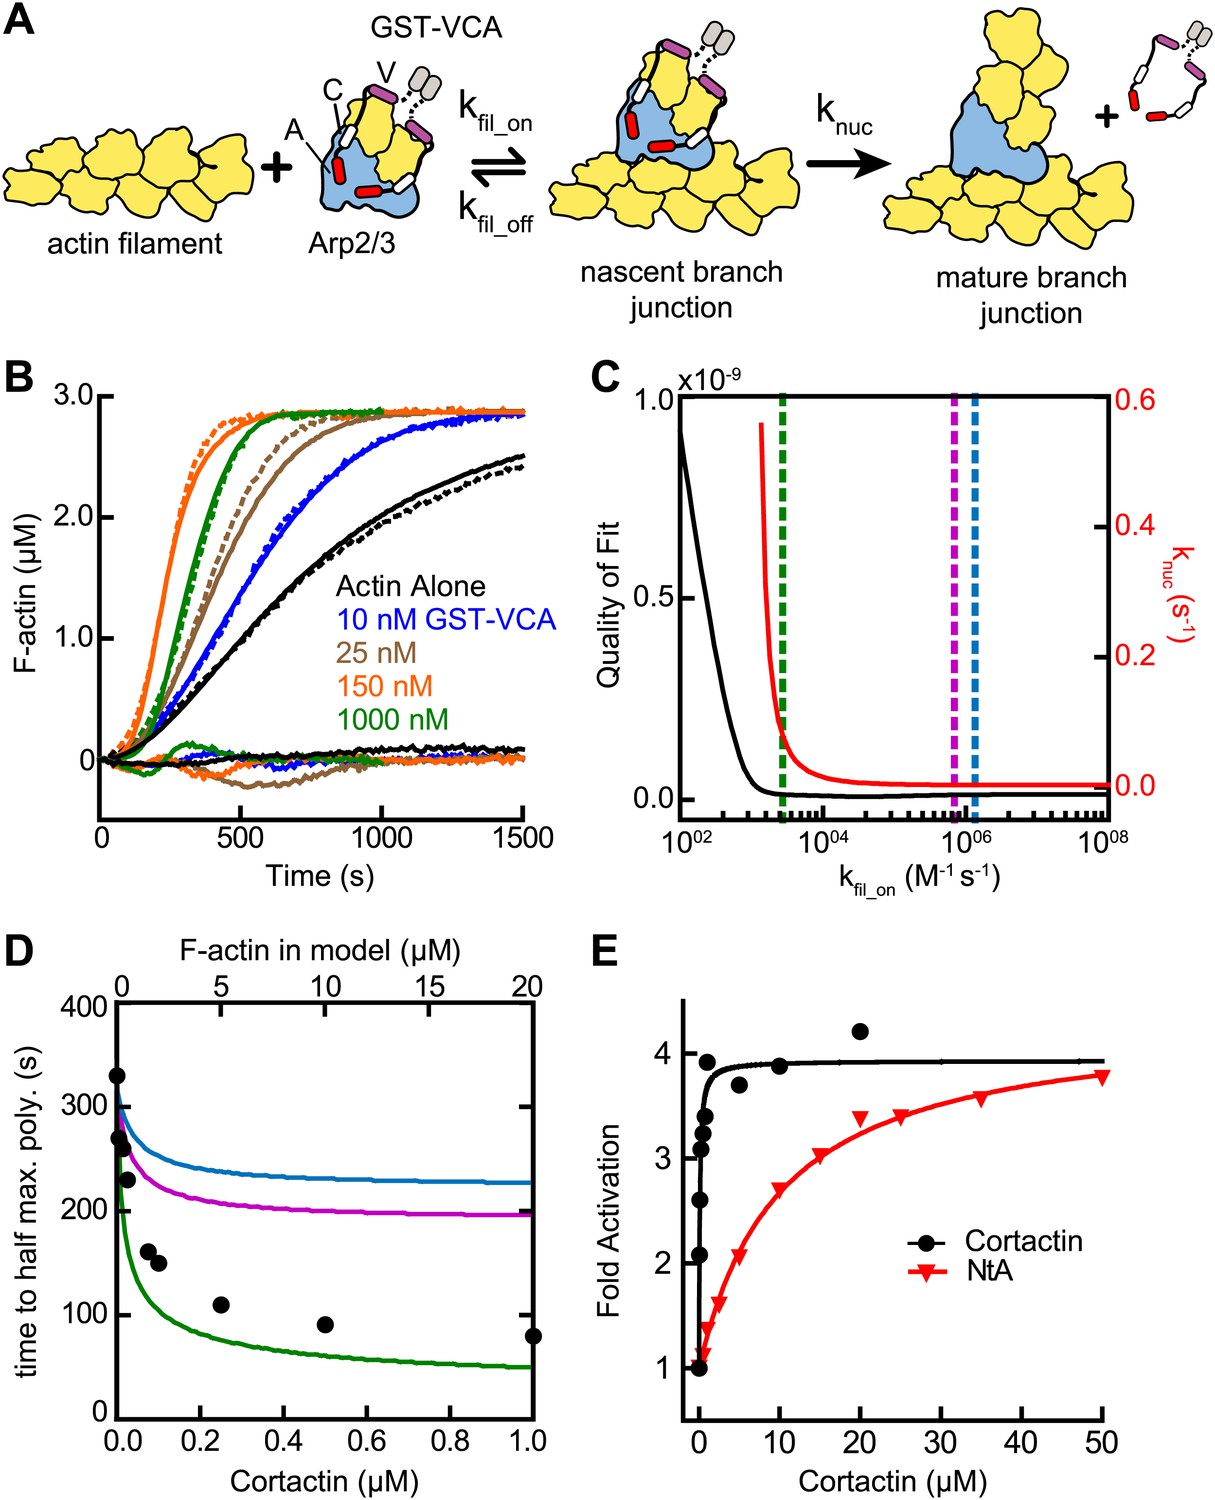
Actin filament recruitment cannot explain cortactin-mediated synergy.
(A) Cartoon pathway of steps optimized in the kinetic model of branching nucleation. (B) Representative pyrene-actin polymerization time courses of Arp2/3 complex activated by GST-VCA (dashed lines) with simulated fits (solid lines). Residuals are shown below as solid lines. Reactions contained 3 µM 15% pyrene-actin, 50 nM Arp2/3 complex and indicated concentrations of GST-VCA. (C) Plot showing the relationship between the quality of fit (black line) and the optimized value of knuc (red line) for simulations at a range of fixed values of kfil_on. Dashed purple and blue lines show kfil_on values supported by our analysis in Figure 7 (blue line) or by empirically measured koff and KD values (purple line) (Hetrick et al., 2013; Smith et al., 2013). The dashed green line indicates the minimum value of kfil_on that fits the data with a quality of fit better than 1.3 × 10⁻¹¹. Quality of fit was calculated by a mean-weighted residual sum of squares. (D) Simulations showing the effect of increased actin filament side binding sites on the half time to reach equilibrium. Simulations were run using the three different kfil_on values indicated in panel C. Empirical data from actin polymerization time courses with 3 µM 15% pyrene-actin, 20 nM Arp2/3 complex, 100 nM GST-VCA and the indicated concentrations of cortactin are shown as black circles (bottom axis). Initial concentrations of modeled actin filaments in the simulation are indicated on the top axis. (E) Plot of the fold activation over GST-VCA alone for a range of concentrations of full-length cortactin or NtA. Reactions contain 2 µM 15% pyrene-actin, 20 nM Arp2/3 complex, 250 nM GST-VCA and indicated concentrations of cortactin or NtA. Fold activation is calculated as the maximum polymerization rate for each reaction divided by the maximum polymerization rate for the reaction without cortactin. Data were fit (solid lines) as described in ‘Materials and methods’.
Figure 3—figure supplement 1
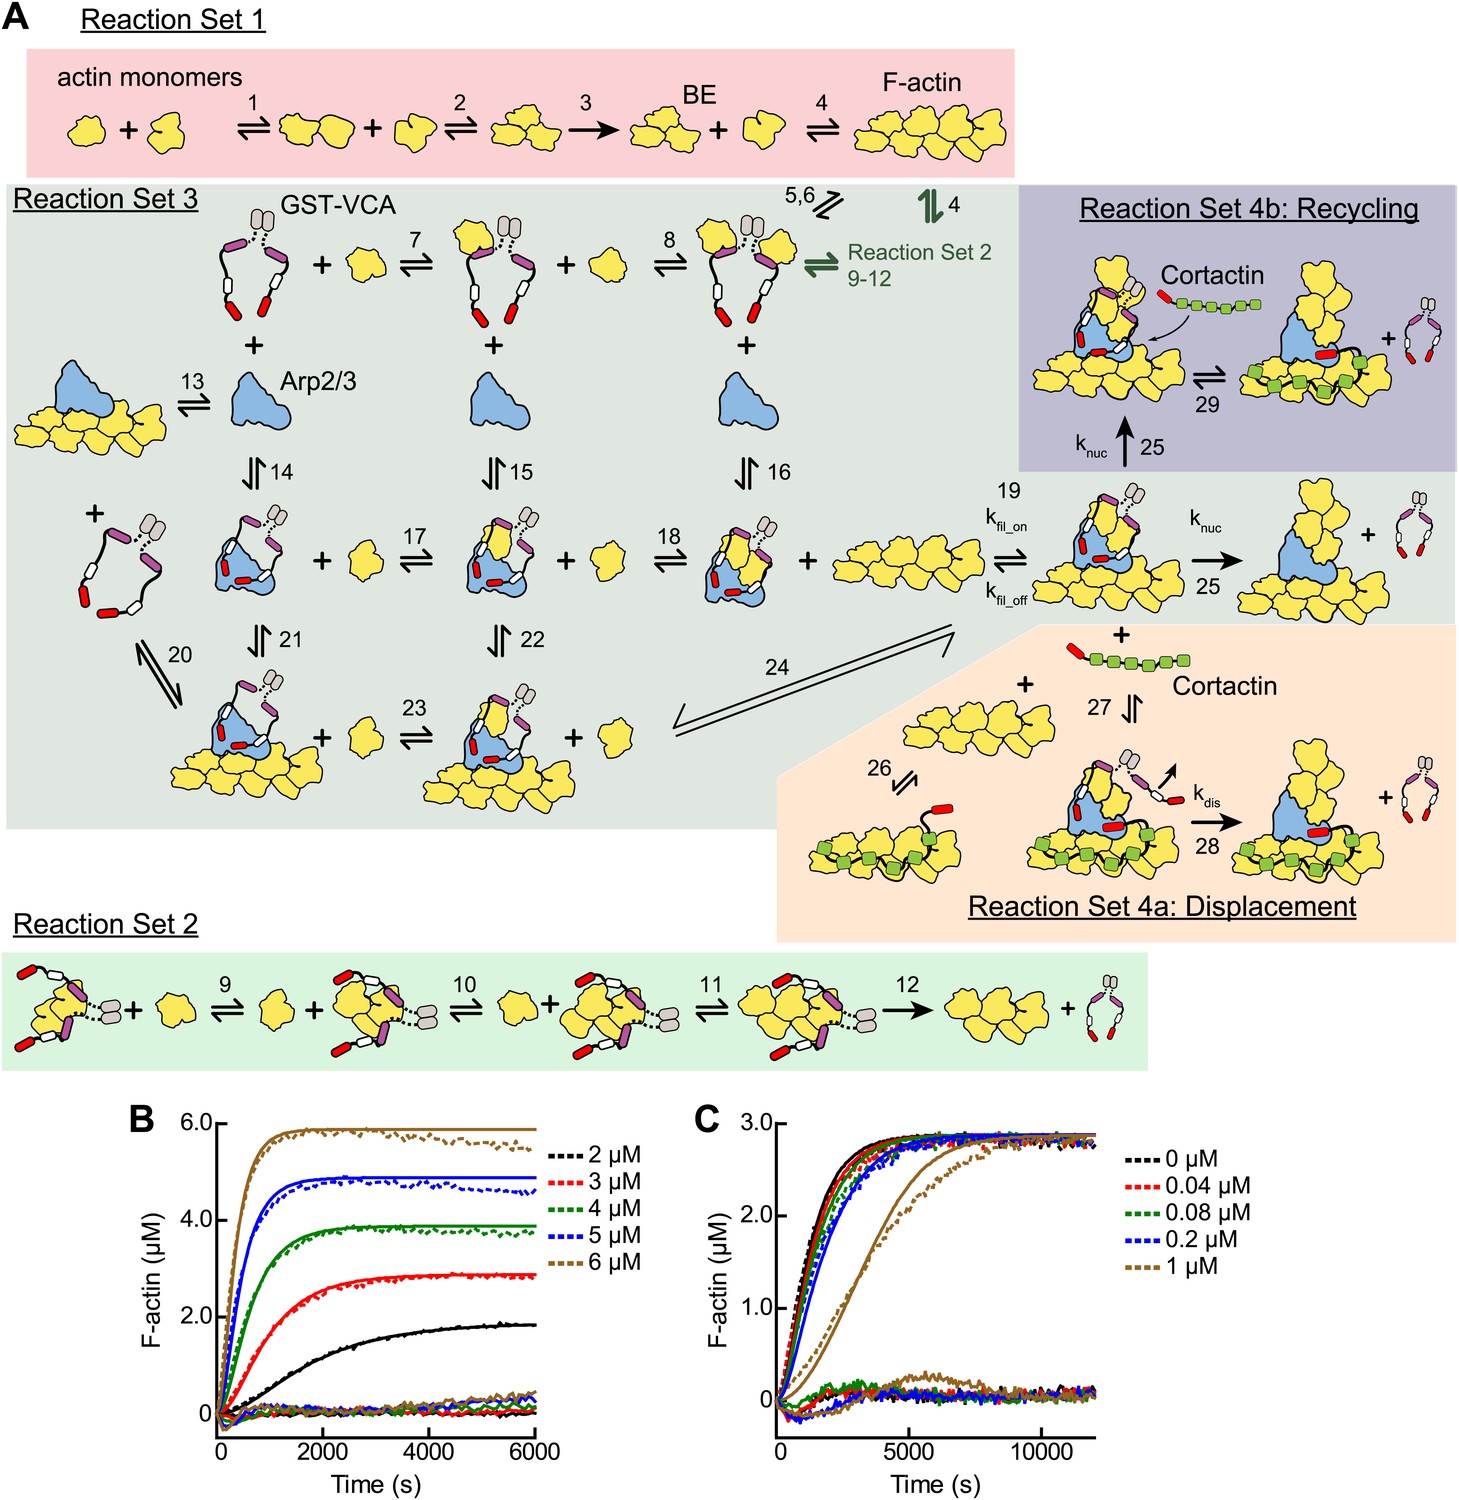
Mathematical modeling of actin polymerization in the presence or absence of GST-VCA, Arp2/3 complex and cortactin.
(A) Cartoon pathway of mathematical models used to fit four independent sets of pyrene-actin polymerization assays. The conditions of each reaction set and its associated model are described in Table 2. (B and C) Pyrene-actin polymerization time courses run at different initial actin concentrations (B) or at 3 µM 15% pyrene-actin and varying GST-VCA concentrations (C). Dashed lines show experimental data and solid lines show simulated fits after optimization of the floating parameters indicated in Table 2. Residuals are shown below as solid lines. All reactions used 15% pyrene-labeled actin. Indicated GST-VCA concentrations are monomeric.
Figure 4 with 1 supplement
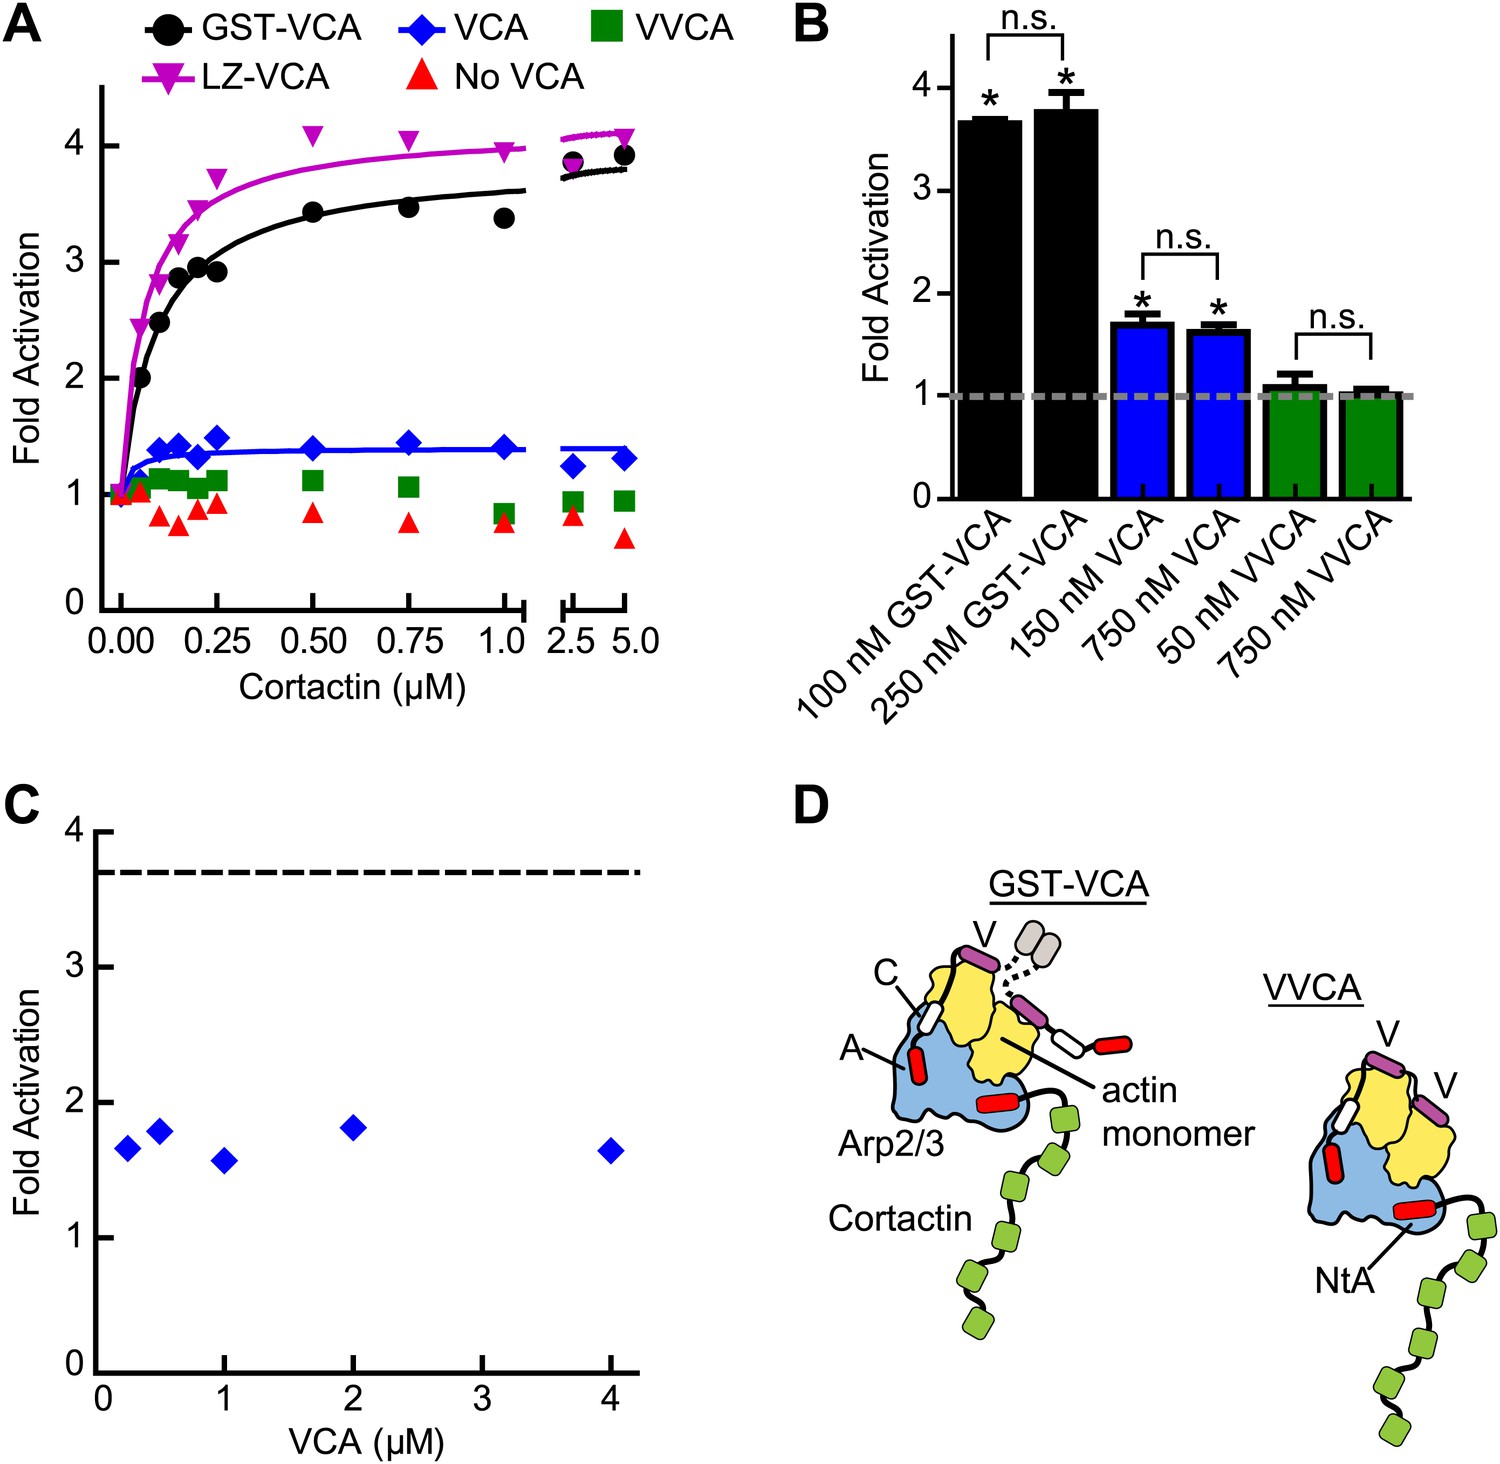
The oligomerization state of VCA is an important determinant of synergy.
(A) Plot of the fold activation vs cortactin concentration for reactions containing 2 µM 15% pyrene-actin, 20 nM Arp2/3 complex and 250 nM GST-VCA (black), 750 nM VCA (blue), 750 nM VVCA (green), 250 nM Leucine-zipper VCA (LZ-VCA, magenta) or no N-WASP (red). Monomer concentrations are listed. Fold activation is calculated as described in Figure 3E. (B) Plot of the average fold activation for reactions containing 1 µM cortactin and the indicated concentration of GST-VCA, VCA or VVCA. Dashed line indicates no synergy. p-values were calculated by two-tailed Student’s t-test. Error bars are S.E.M. n.s. = not significant, p>0.05. Asterisks indicate average fold activation values are significantly different (p<0.05) than a fold activation value of 1 (no synergy). (C) Fold activation vs concentration of monomeric VCA for pyrene actin polymerization assays containing 0 to 4 μM N-WASP-VCA, 500 nM cortactin and Arp2/3 complex and actin as in panel A. Dashed line shows average fold activation for a reaction containing 250 nM GST-VCA and saturating cortactin. (D) Cartoon showing hypothetical branching intermediates with the potential to recruit two actin monomers to Arp2/3 complex with bound cortactin.
Figure 4—figure supplement 1
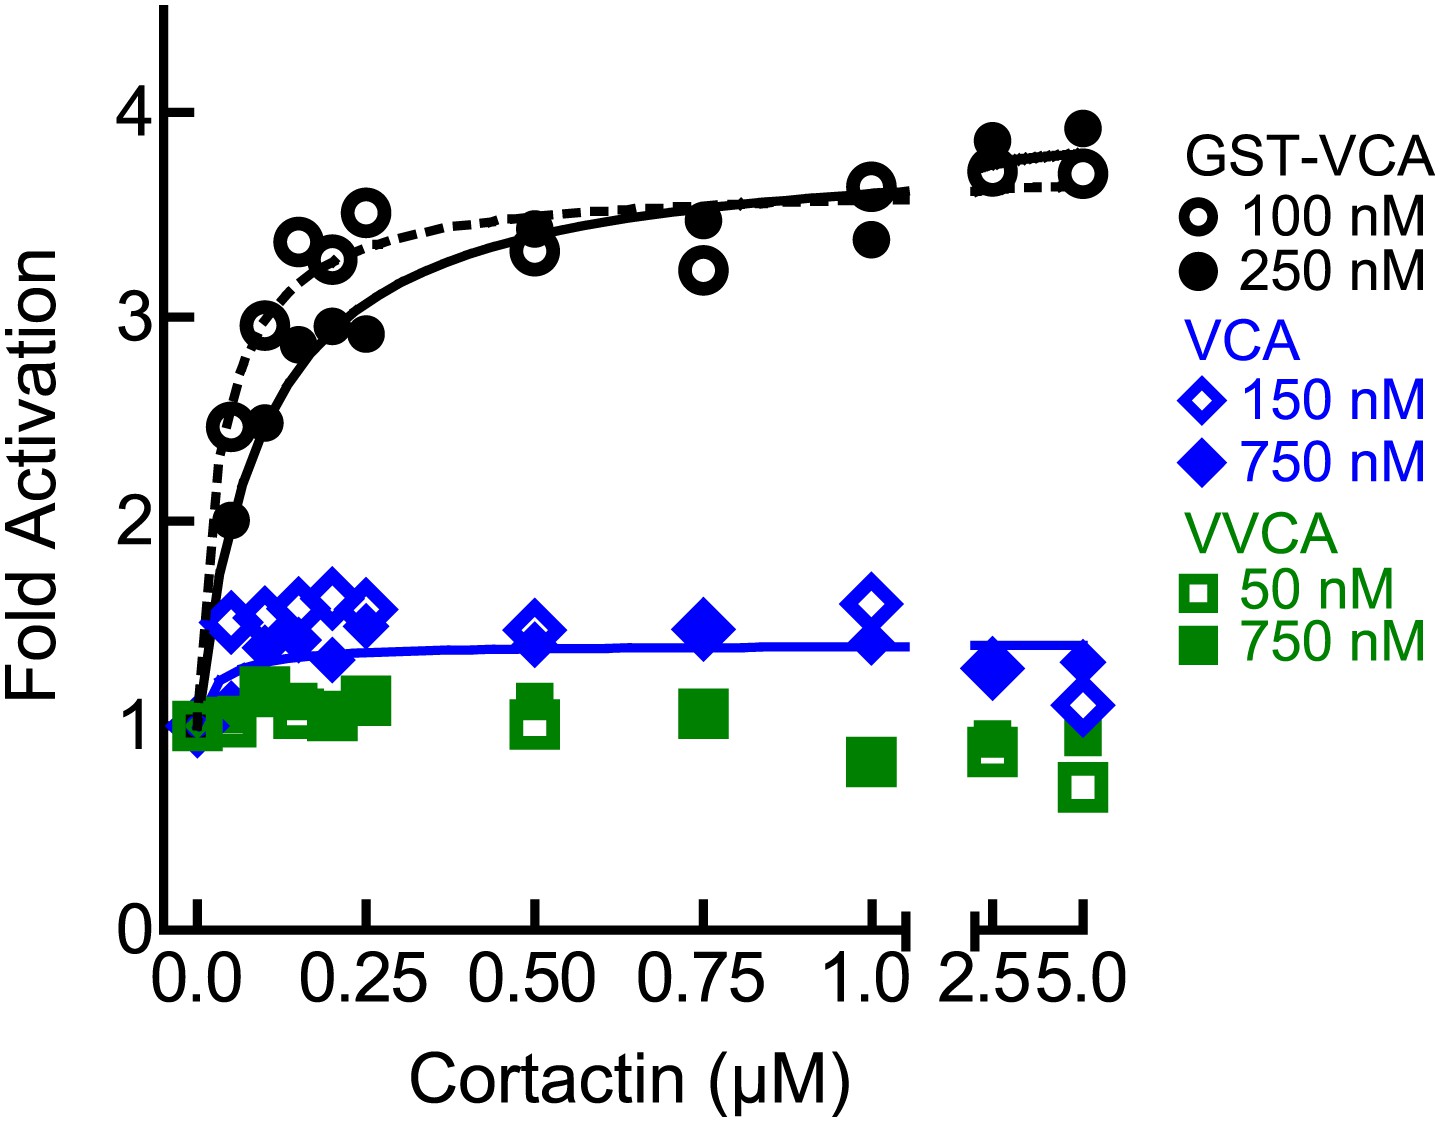
The level of synergy is the same at saturating and subsaturating concentrations of the type I NPF.
Plot of fold activation vs cortactin concentration for reactions containing 2 µM 15% pyrene-actin, 20 nM Arp2/3 complex and subsaturating (open symbols and dotted fit line) or saturating (closed symbols and solid fit line) concentrations of the indicated VCA constructs. Saturating data is the same as Figure 4A and fits were performed as described in ‘Materials and methods’. The concentration of each construct required to saturate Arp2/3 complex activity is based on data in Figure 5A.
Figure 5 with 1 supplement
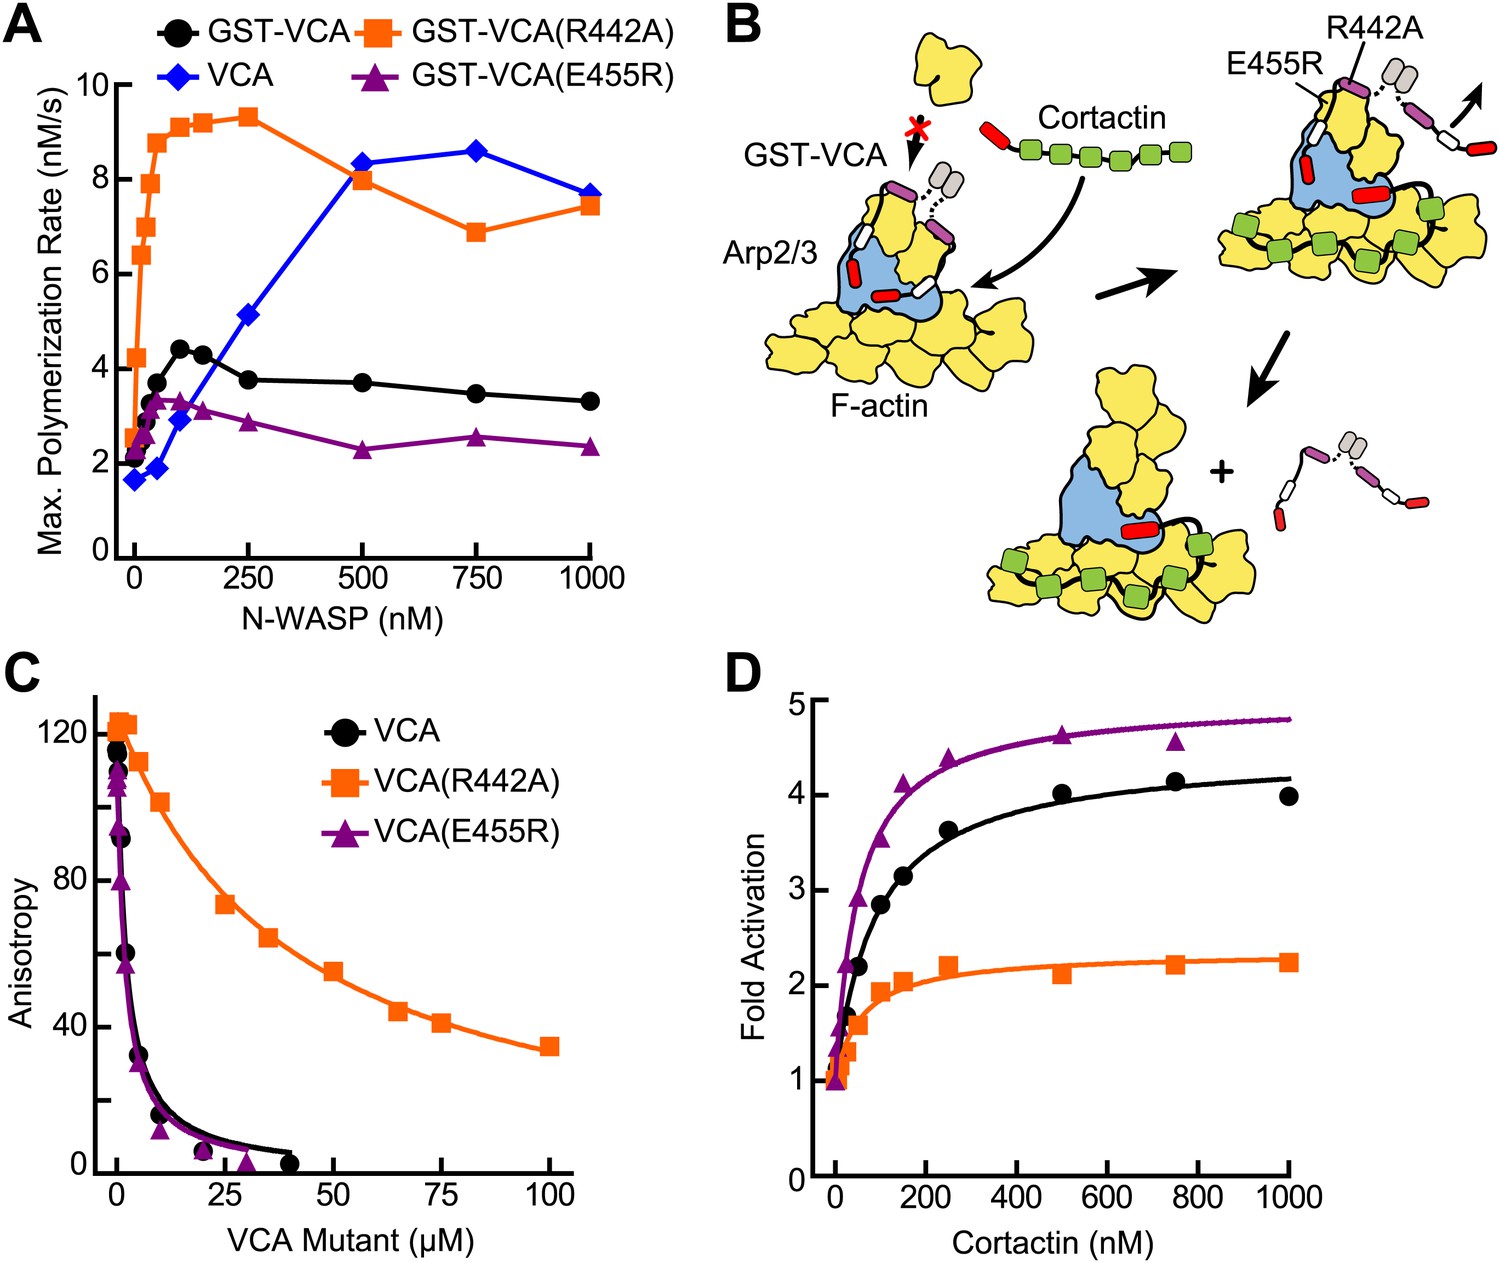
VCA affinity for the nascent branch junction is an important determinant of synergy.
(A) Maximum polymerization rates verses (monomer) concentration of N-WASP constructs for reactions containing 20 nM Arp2/3 complex and 2 µM 15% pyrene-actin. (B) Cartoon depicting obligatory displacement model of cortactin-mediated synergy. Approximate location of residues (based on 2A41.pdb and 2VCP.pdb) (Chereau et al., 2005; Gaucher et al., 2012) mutated in the V region of GST-VCA are indicated in one V region. (C) Fluorescence anisotropy binding measurements showing competition between wild type rhodamine-VCA and unlabeled VCA constructs for actin monomers. KD, WT = 0.56 ± 0.03 µM (black) KD, R442A = 11.2 ± 1.3 µM, (orange) KD, E455R = 0.63 ± 0.06 µM (purple). (D) Plot of fold activation vs cortactin concentration for reactions containing 20 nM Arp2/3 complex, 2 µM 15% pyrene-actin and 250 nM of a GST-VCA construct, colors as in panel A. Fold activation is calculated as described in Figure 3E.
Figure 5—figure supplement 1
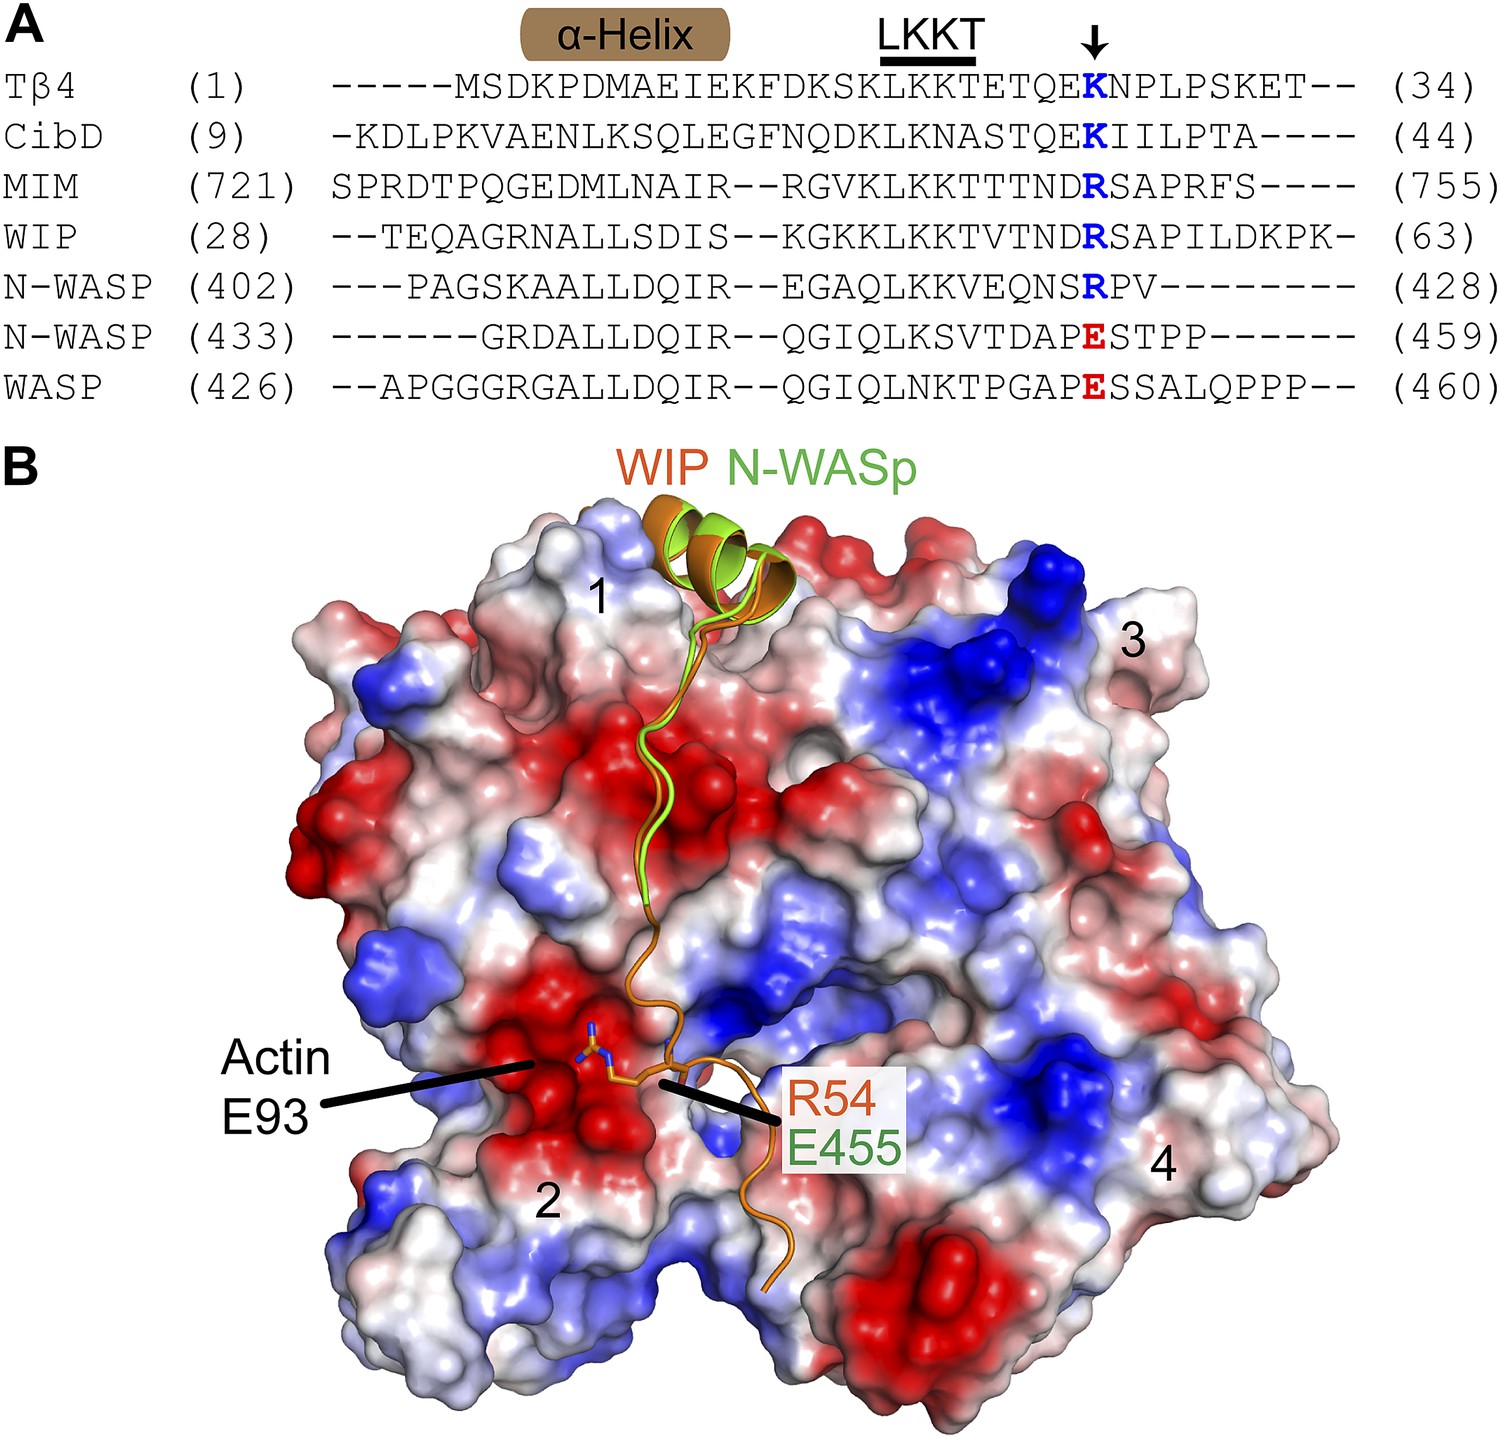
The E455R mutation in N-WASP is predicted to provide additional favorable electrostatic interactions with actin monomers.
(A) Alignment of WH2/V sequences (sequence accession numbers): Tβ4 (NP_001106702.1), Ciboulot isoform D (NP_001245516.1), MIM (O43312.2), WIP (O43516.3), N-WASP (Q95107.1) and WASP (P42768.4). Residue E455 in N-WASP and homologous residues in other V regions are colored based on charge conservation. (B) Structural alignment (RMSD = 0.458 Å) of WIP-V (orange—2A41.pdb) and N-WASP-V (green—2VCP.pdb) bound to an actin monomer showing the fifth residue beyond the LKKT in WIP, Arg54, interacts with an acidic pocket of actin that includes Glu93. Electrostatic surface representation shows acidic (red) and basic (blue) regions on actin.
Figure 6 with 1 supplement

Cortactin binds statically to actin filaments.
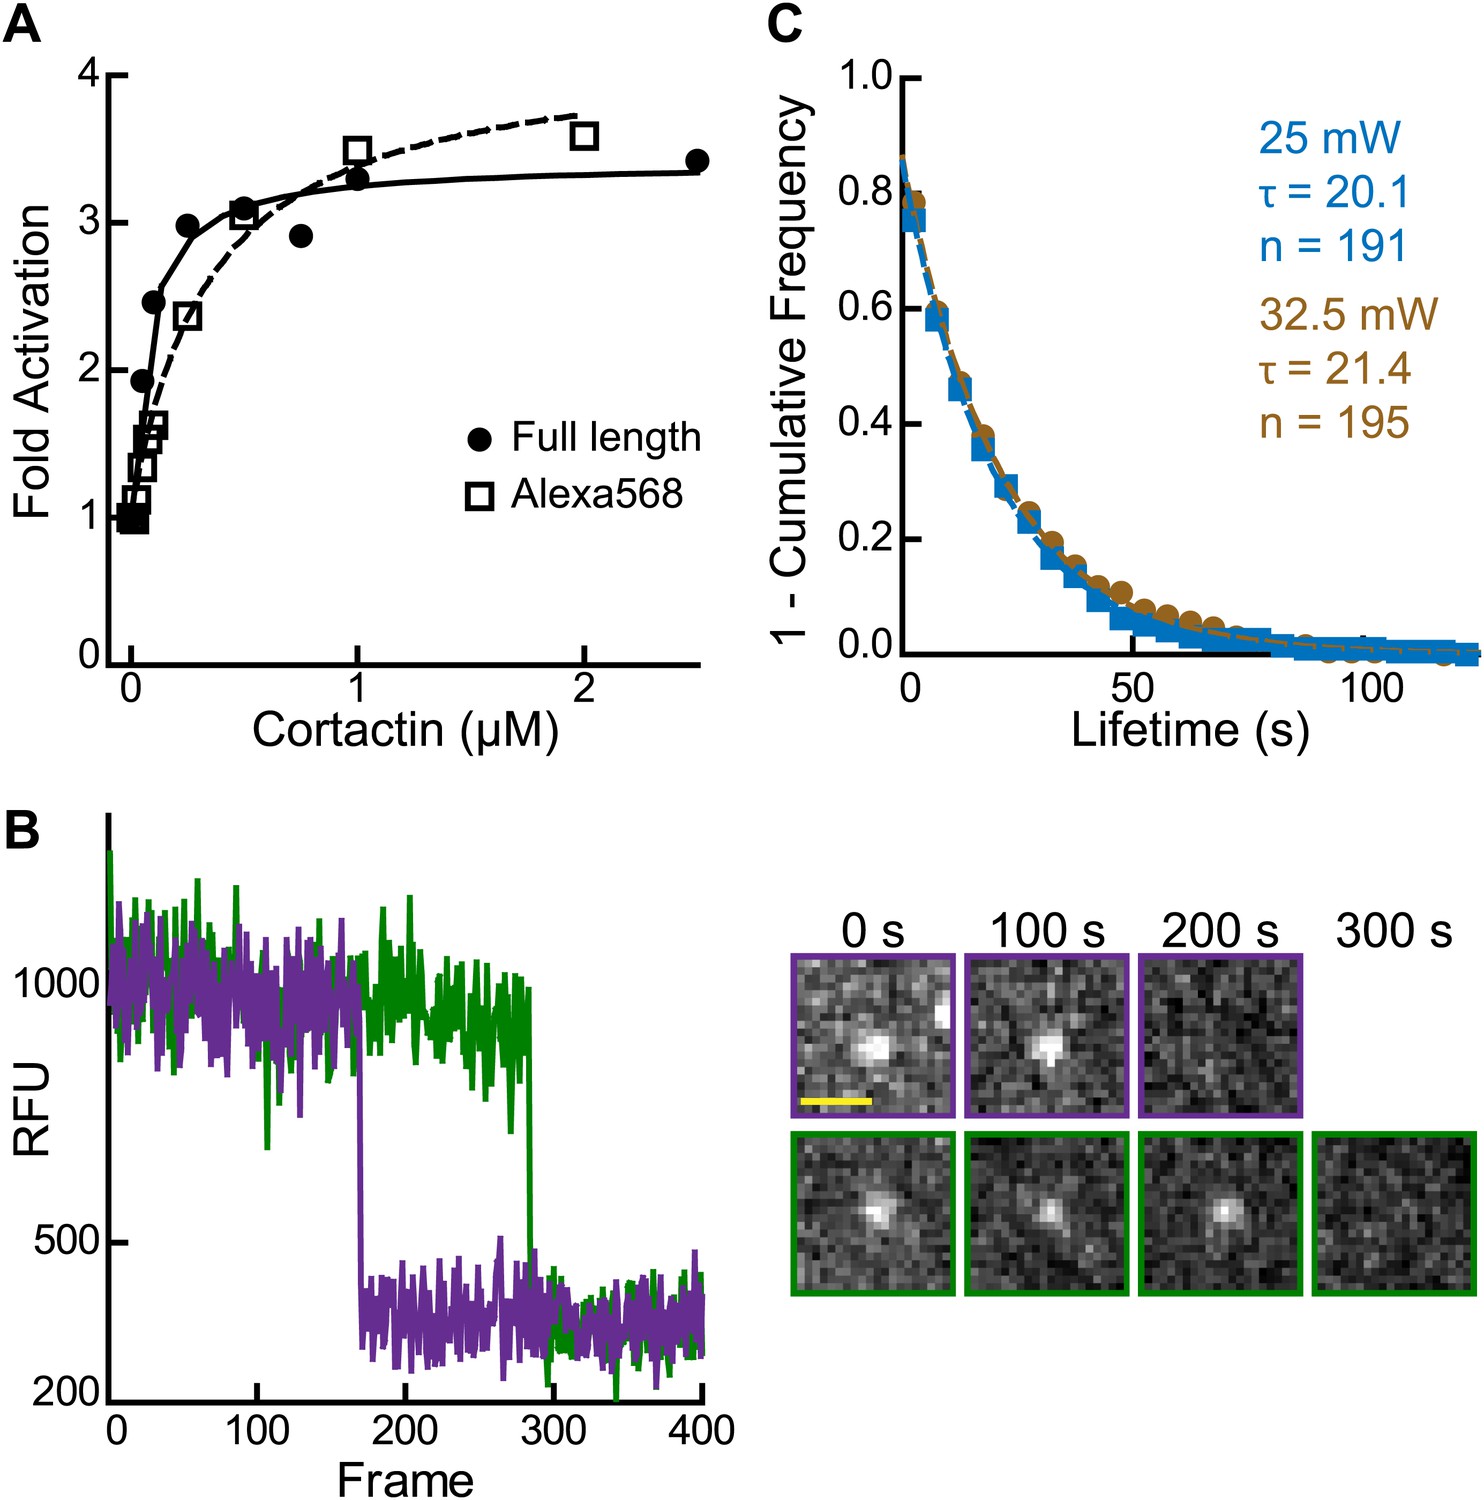
(A) smTIRF microscopy images of single cortactin molecules (red) bound to polymerizing actin filaments (green). TIRF reactions contained 1 µM 33% Oregon-Green actin and 2 nM Alexa568-cortactin (residues 1–336). Scale bar: 1 µm. (B) Kymograph showing cortactin molecules bound statically to a polymerizing filament. The barbed end (BE) and pointed end are indicated. Vertical scale bar: 10 s, horizontal scale bar: 1 µm. (C) Histogram showing binned lifetimes of single molecules of cortactin on actin filament sides. Counts were transformed into 1-cumulative frequency plot (inset) and fit with a single-exponential decay equation to determine the off rate, 0.050 s−1 n = 191.
Figure 6—figure supplement 1
Validation of single molecule data.
(A) Plot of fold activation vs cortactin concentration for reactions containing 20 nM Arp2/3 complex and 250 nM GST-VCA and either full length cortactin (circle) or Alexa568-cortactin residues 1–336 (square). (B) Plot of fluorescence intensity vs frame number (left) plus still images (right) for two representative spots in the 561 channel. Biotinylated Alexa568-cortactin (1–336) at 1 nM was flowed into a streptavidin-PEG reaction chamber and imaged at 5.5 frames per second. Scale bar = 1 µm. Single-step photobleaching indicates that both signals tracked are single molecules of cortactin. (C) Lifetime plots of single cortactin molecules bound to the sides of polymerizing actin filaments, with data collected at two different laser intensities (measured at laser head). Data were fit with a single exponential to determine the binding lifetime (τ). The lifetime does not decrease at higher laser intensity, indicating that photobleaching does not significantly influence the measurements. Data for all other figures were collected (only) at 25 mW.
Figure 7
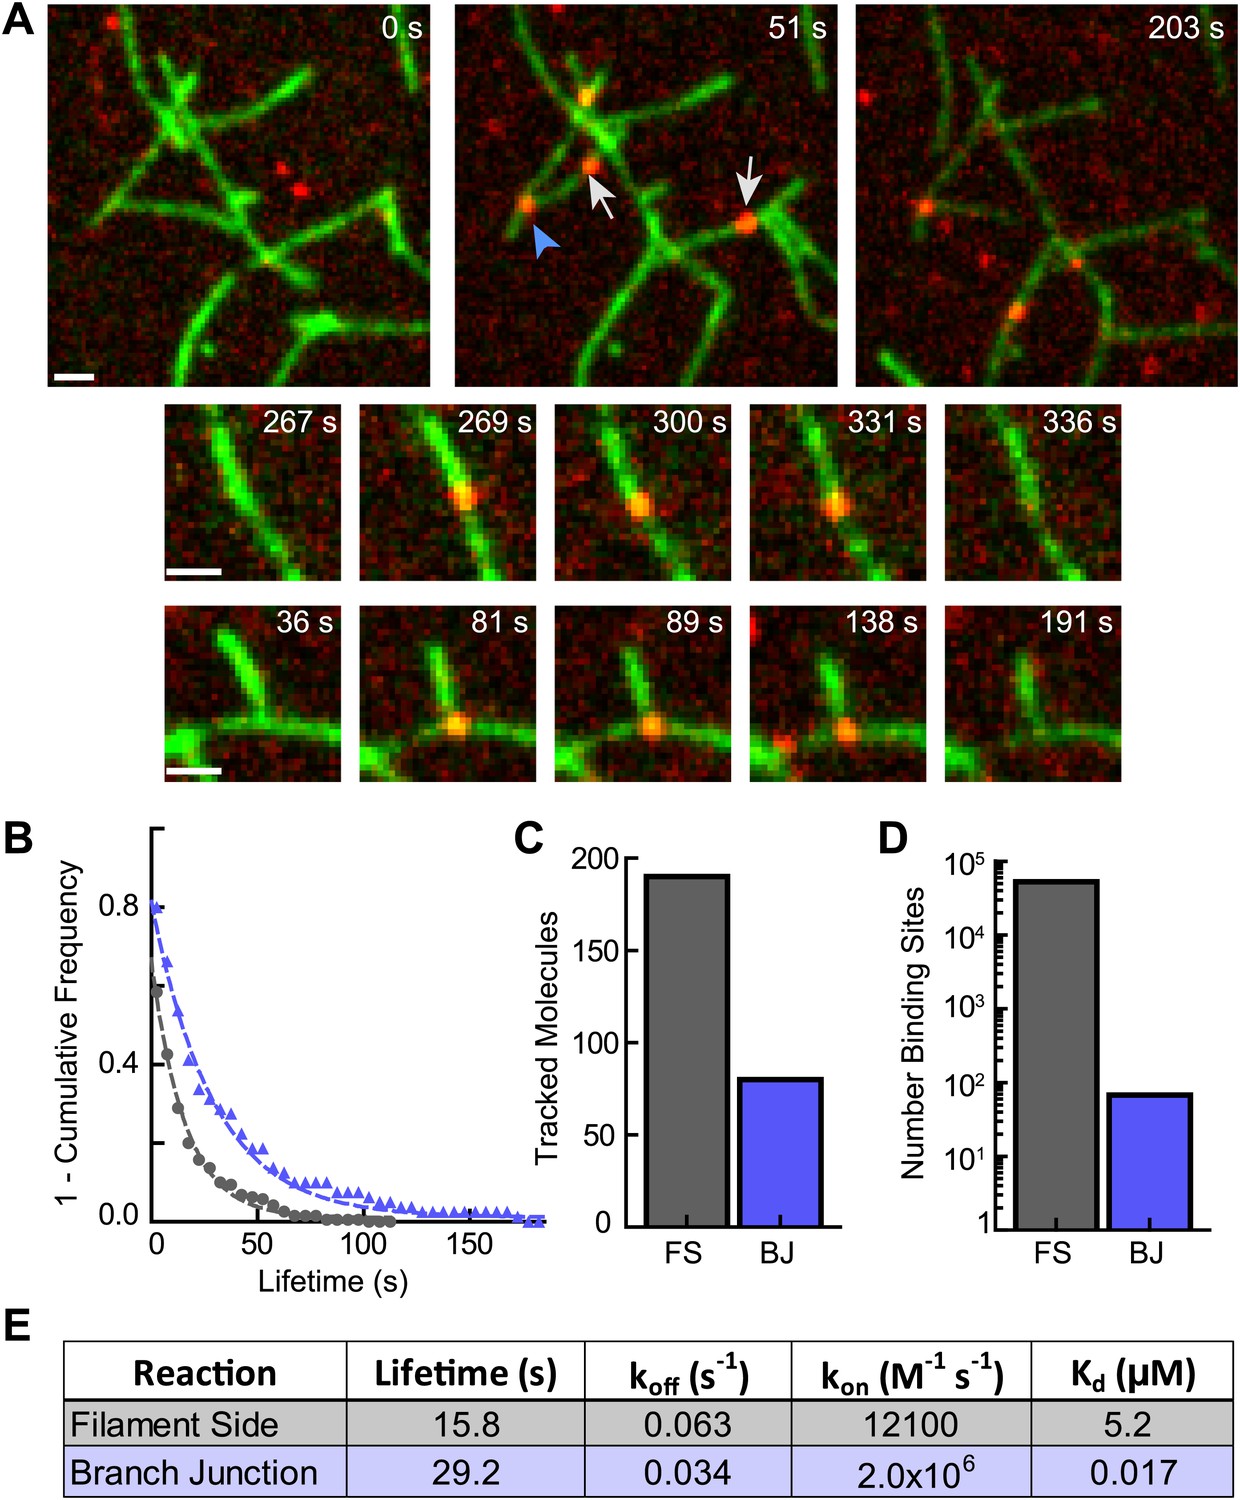
Cortactin directly targets branch junctions with a fast on rate.
(A) smTIRF microscopy images showing interaction of cortactin with preformed branched networks. Reactions were initiated using 1 µM 33% Oregon-Green actin, 5 nM Arp2/3 complex and 30 nM VCA and allowed to proceed for ∼6 min before flushing a solution containing 1.5 nM Alexa568-cortactin and 0.1 µM actin monomers into the reaction chamber. Single cortactin molecules (red) bound actin filament sides (gray arrows) and branch junctions (blue arrowhead). Large images show a single region of interest with both side and branch binding events. Time after cortactin addition is indicated. Smaller images show examples of complete filament side and branch junction binding events. Scale bars: 1 µm. (B) Frequency plot of tracked cortactin lifetimes for molecules bound to filament sides (gray) or branch junctions (blue) and fit with a single exponential decay function. (C) Plot of the total number of tracked cortactin molecules on filament sides (FS) or branch junctions (BJ). (D) Plot of the average number of cortactin filament side or branch binding sites across all analyzed frames. (E) Summary of kinetic and thermodynamic binding constants for each class of binding event.
Figure 8
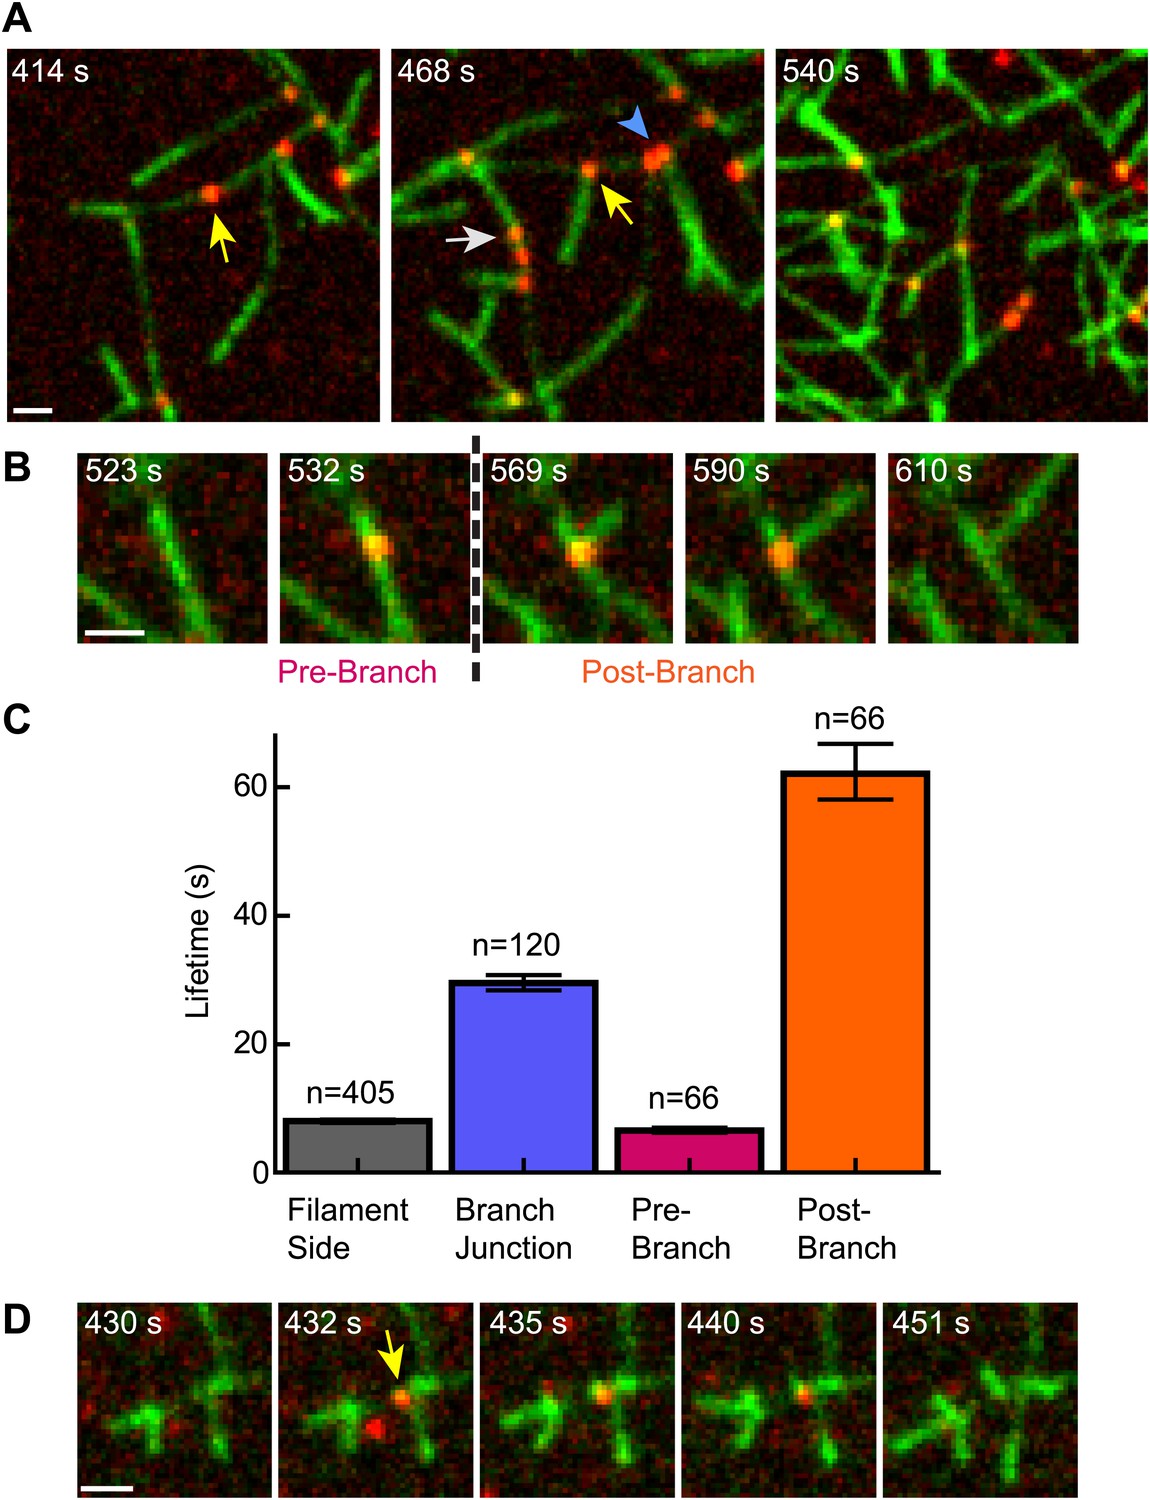
Cortactin remains at the branch junction during daughter filament elongation.
(A) smTIRF microscopy images of polymerizing branch networks containing 1 µM 33% Oregon-Green actin, 5 nM Arp2/3 complex, 50 nM VCA and 2 nM Alexa568-cortactin (red). Images show filament side (gray arrow), existing branch junction (blue arrowhead) and nascent branch junction (yellow arrow) cortactin binding events. (B) Montage from reaction described in panel A showing a single event in which cortactin binds to a filament side, a new branch is nucleated, and cortactin remains bound during elongation. (C) Average lifetimes for each binding class from reaction described in panel A. Error bars represent error of the fit. (D) Image montage showing NtA (yellow arrow) remains bound for ∼4.5 s after daughter filament nucleation before dissociating. The reaction contained 1 µM 33% Oregon-Green actin, 10 nM Arp2/3 complex, 350 nM VCA and 10 nM Alexa568-NtA(1-48). Scale bars: 1 µm.
Figure 9
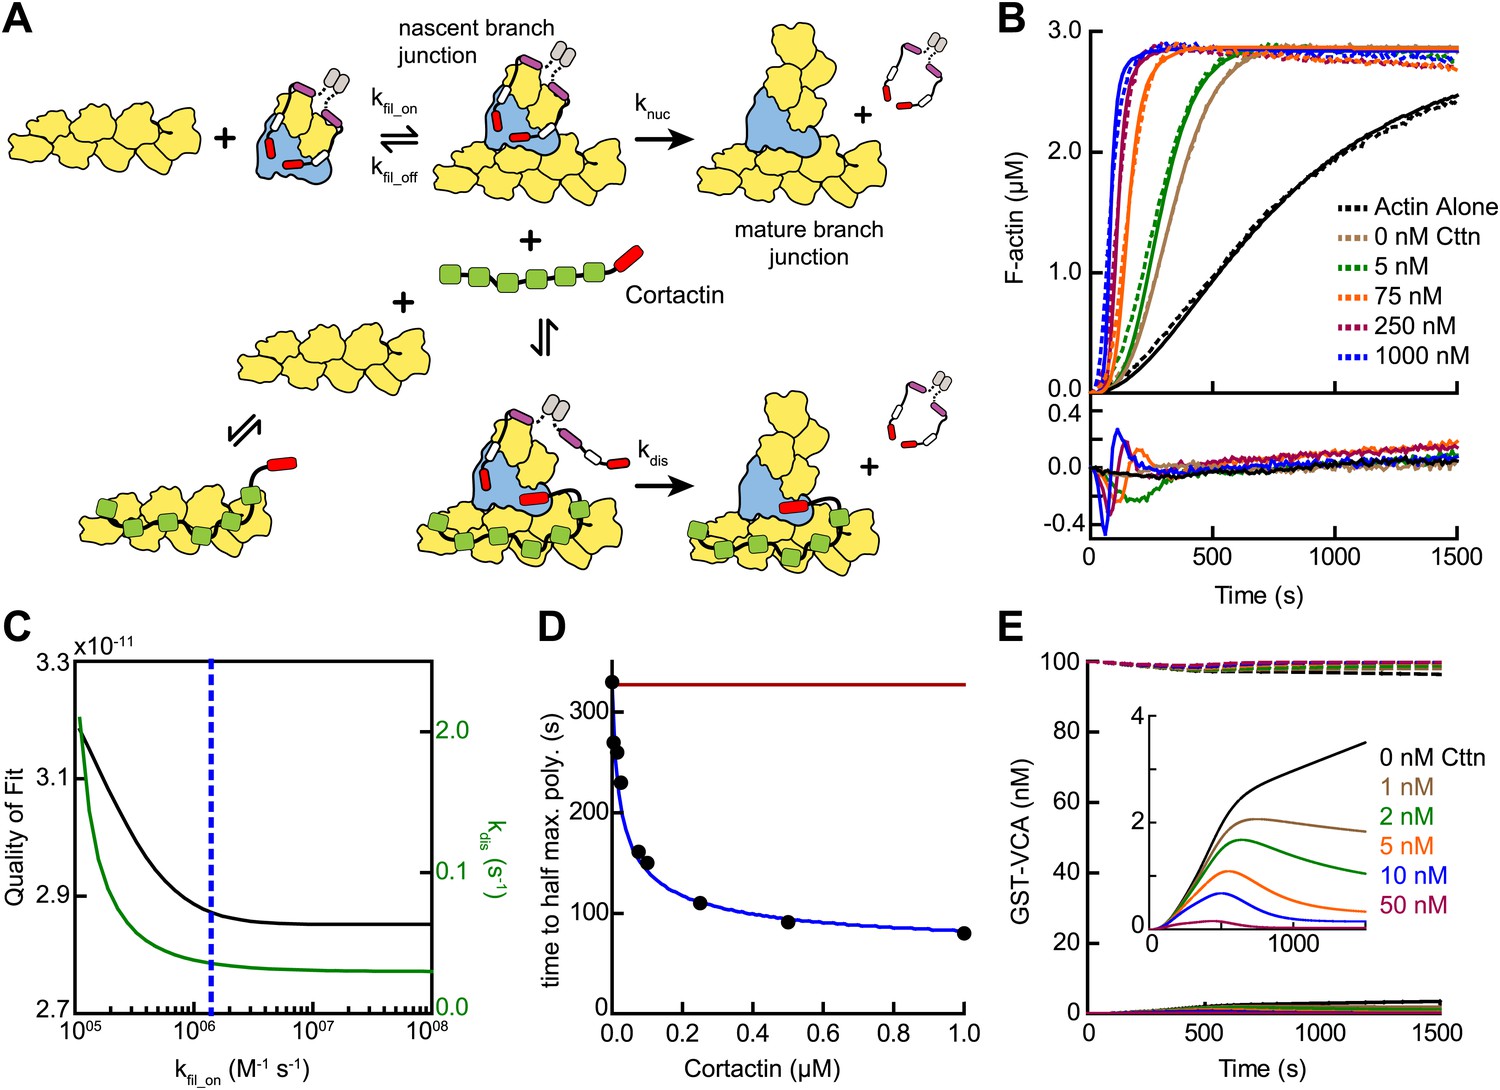
Mathematical model of the obligatory displacement mechanism of cortactin-mediated synergy.
(A) Cartoon pathway of key reactions describing cortactin-mediated displacement of GST-VCA (see ‘Materials and methods’ for full model). (B) Pyrene-actin polymerization time courses of Arp2/3 complex activated by GST-VCA and cortactin with simulated fits based on an obligatory displacement mechanism of synergy. Dashed lines show experimental data and solid lines show simulated fits after optimization of the two floating parameters, kfil_on and kdis. Residuals are shown in lower panel. Reactions contained 3 µM 15% pyrene-actin, 20 nM Arp2/3 complex, 100 nM GST-VCA and indicated concentrations of cortactin. (C) Plot of quality of fit (black) and resulting optimized kdis (green) vs kfil_on. Blue dashed line indicates minimum threshold kfil_on value of 1.4 × 10⁶ M−1 s−1. Quality of fit was calculated by a mean-weighted residual sum of squares. (D) Plot of half time to equilibrium for reactions in panel B (black circles) vs a simulation of the obligatory displacement model (blue line) or the recycling model (red line). (E) Plot showing concentration of free GST-VCA (dashed lines, includes any species of GST-VCA not bound to a nascent or mature branch junction) and sequestered GST-VCA (solid lines, includes any species bound at nascent or mature branch junction) vs time in simulations of the recycling model run at a range of cortactin concentrations. Insert shows magnification of a section of the plot, highlighting the concentration of sequestered GST-VCA as a function of cortactin concentration.
Videos
Video 1
Synergistic activation of Arp2/3 complex by GST-VCA and high concentrations of cortactin.
Video corresponds to images in Figure 2C. Reaction contains 1 µM 33% Oregon-Green actin, 10 nM Arp2/3 complex, 50 nM GST-VCA and 1 µM cortactin. Single-wavelength (488 nm) images were acquired at a final magnification of 100× with an exposure time of 100 ms and a frame rate of 1 fps (frames per second).
Video 2
Single molecules of cortactin interacting with polymerizing actin filaments.
Reaction contains 1 µM 33% Oregon-Green actin (green) and 2 nM Alexa568-cortactin (red). Images from both channels were acquired using a 50 ms exposure at a ratio of 5:1 and a frame rate of 3.7 frames per second (fps) and 1.6 fps for the 488- and 561-channels, respectively.
Video 3
Single molecules of cortactin binding to preformed branch junctions and filament sides.
Preformed branched filament networks were created by polymerizing 1 µM 33% Oregon-Green actin (green), 5 nM Arp2/3 complex and 30 nM VCA for 6.4 min, then flowing into the reaction chamber a solution containing 1.5 nM Alexa568-cortactin (red) and 0.1 µM actin monomers. Out of focus frames (at ∼1 s in video) represents when cortactin was flowed into the chamber. Exposure time for each channel was 50 ms with a 561:488 image ratio of 6:1. The frame rate of the 561-channel was 5 fps.
Video 4
Single molecules of cortactin binding to branching networks.
Reaction contains 1 µM 33% Oregon-Green actin (green), 5 nM Arp2/3 complex, 50 nM VCA and 2 nM Alexa568-cortactin (red). 561- and 488-channel images were exposed for 50 ms and 30 ms, respectively, at a 561:488 image ratio of 8:1, with a frame rate of 5 fps for the 561-channel and 2.6 fps for the 488 channel.
Video 5
Single molecule of cortactin binding to a nascent branch junction.
Visible in the video are nascent branch (left-center at 3 s), branch junction and filament side binding cortactin molecules. Reaction conditions are the same as video 4.
Video 6
Single molecule of NtA binding to a nascent branch junction.
Reaction contains 1 µM 33% Oregon-Green actin (green), 10 nM Arp2/3 complex, 350 nM VCA and 10 nM Alexa568-NtA(1-48) (red). 561- and 488-channel images were exposed for 50 ms and 30 ms, respectively, at a 561:488 image ratio of 15:1, with a frame rate of 11 fps for the 561 channel and 1.7 fps for the 488-channel.
Tables
Table 1
Mathematical modeling parameters
| Reaction # | Description | kon (M−1s−1) | koff (s−1) | KD (µM) | Reference |
|---|---|---|---|---|---|
| 1 | Actin dimerization | 1.98 × 10⁷ | 5.26 × 10⁷ | 2.6 × 10⁶ | Mullins 1998, This study |
| 2 | Actin trimerization | 1.16 × 10⁷ | 4.07 × 10⁵ | 3.5 × 10⁴ | Mullins 1998, This study |
| 3 | Spontaneous nucleation | 1110 − 1220*,† | This study | ||
| 4 | Barbed end elongation | 1.16 × 10⁷ | 1.4 | Pollard 1986 | |
| 5 | Barbed end elongation, actin monomer bound to GST-VCA | 1.16 × 10⁷ | 1.4 | Pollard 1986, Higgs 1999 | |
| 6 | Barbed end elongation, two actin monomers bound to GST-VCA | 1.16 × 10⁷ | 1.4 | Pollard 1986, Higgs 1999 | |
| 7 | Actin monomer binds GST-VCA | 5 × 10⁶ | 3 | 0.6 | Marchand 2001, Beltzner 2008 |
| 8 | Actin monomer binds GST-VCA with bound actin | 5 × 10⁶ | 3 | 0.6 | Marchand 2001, Beltzner 2008 |
| 9 | Actin monomer binds GST-VCA:actin2 | 4.2 × 10⁴ | 74.4 | 1.8 × 10³ | This study |
| 10 | Actin monomer binds GST-VCA:actin3 | 1.5 × 10⁷ | 1.04 | 0.069 | This study |
| 11 | Actin monomer binds GST-VCA:actin4 | 2 × 10⁷ | 0.062 | 0.003 | This study |
| 12 | GST-VCA nucleation | 6.1 × 10⁻⁸* | This study | ||
| 13 | Arp2/3 binds actin filament | 1.37 × 10⁶ | 1.23 | 0.9 | Hetrick 2013 |
| 14 | GST-VCA binds Arp2/3 | 0.8 × 10⁶ | 0.072 | 0.009 | Padrick 2008 |
| 15 | GST-VCA:actin binds Arp2/3 | 0.8 × 10⁶ | 0.014 | 0.018 | Padrick 2008, Beltzner 2008, Kelly 2006 |
| 16 | GST-VCA:actin2 binds Arp2/3 | 0.8 × 10⁶ | 0.029 | 0.028 | Padrick 2008, Beltzner 2008, Kelly 2006 |
| 17 | Actin monomer binds GST-VCA:Arp2/3 | 2.5 × 10⁶ | 3 | 1.2 | Marchand 2001, Beltzner 2008 |
| 18 | Actin monomer binds GST-VCA:actin:Arp2/3 | 2.5 × 10⁶ | 3 | 1.2 | Marchand 2001, Beltzner 2008 |
| 19 | GST-VCA:actin2:Arp2/3 binds actin filament (kfil_on) | 1.37 × 10⁶ | 1.23 | 0.9 | Hetrick 2013 |
| 20 | GST-VCA binds Arp2/3:F-actin | 0.8 × 10⁶ | 0.072 | 0.009 | Padrick 2008 |
| 21 | GST-VCA:Arp2/3 binds F-actin | 1.37 × 10⁶ | 1.23 | 0.9 | Hetrick 2013 |
| 22 | GST-VCA:Arp2/3:actin binds F-actin | 1.37 × 10⁶ | 1.23 | 0.9 | Hetrick 2013 |
| 23 | GST-VCA:Arp2/3:F-actin binds actin monomer | 2.5 × 10⁶ | 3 | 1.2 | Marchand 2001, Beltzner 2008 |
| 24 | GST-VCA:Arp2/3:actin:F-actin binds actin monomer | 2.5 × 10⁶ | 3 | 1.2 | Marchand 2001, Beltzner 2008 |
| 25 | Arp2/3 complex nucleation (knuc) | 0.004 − 0.006* | This study | ||
| 26 | Cortactin binds actin filament | 1.21 × 10⁴ | 0.063 | 5.21 | This study |
| 27 | Cortactin binds nascent branch junction | 2.0 × 10⁶ | 0.034 | 0.017 | This study |
| 28 | Synergy displacement activation of Arp2/3 complex (kdis) | 0.036* | This study | ||
| 29 | Synergy recycling, cortactin dissociates sequestered GST-VCA | 2.0 × 10⁶ | 0.034 | 0.017 | This study |
-
*
Units are s−1.
-
†
This value was adjusted for each full set of reactions.
-
Underlined values were allowed to float during some optimizations, see Table 2.
Table 2
Mathematical modeling reaction sets
| Reaction set | Reactions | Initial concentrations | Variable concentrations (µM) | Floated parameters | Quality of fit |
|---|---|---|---|---|---|
| 1 | 1–4 | – | 2.0, 3.0, 4.0, 5.0, 6.0 actin monomers | k1, k−1, k2, k−2, k3 | 1.75 × 10⁻¹¹ |
| 2 | 1–12 | 3 µM actin monomers | 0, 0.02, 0.04, 0.08, 0.1, 0.2, 0.6, 0.8, 1.0 GST-VCA | k9, k−9, k10, k−10, k11, k−11, k12 | 2.32 × 10⁻¹¹ |
| 3 | 1–25 | 3 µM actin monomers, 50 nM Arp2/3 complex | 0, 0.01, 0.025, 0.050, 0.1, 0.15, 0.25, 0.5, 1.0 GST-VCA | k25 (knuc) | 1.28 × 10⁻¹¹ |
| 4a | 1–28 | 3 µM actin monomers, 20 nM Arp2/3 complex, 100 nM GST-VCA | 0, 0.005, 0.025, 0.075, 0.1, 0.25, 1.0 cortactin | kfil_on(k13= k19=k21=k22)*†, k25†, k28 (kdis) | 2.87 × 10⁻¹¹ |
| 4b | 1–25, 29 | 3 µM actin monomers, 20 nM Arp2/3 complex, 100 nM GST-VCA | 0, 0.005, 0.025, 0.075, 0.1, 0.25, 1.0 cortactin | k29, k−29 | 4.26 × 10⁻¹⁰ |
-
*
kfil_on is a single global variable used for the indicated reaction rates.
-
†
Only optimized for the 0 µM cortactin reaction.
Download links
A two-part list of links to download the article, or parts of the article, in various formats.
Downloads (link to download the article as PDF)
Open citations (links to open the citations from this article in various online reference manager services)
Cite this article (links to download the citations from this article in formats compatible with various reference manager tools)
Mechanism of synergistic activation of Arp2/3 complex by cortactin and N-WASP
eLife 2:e00884.
https://doi.org/10.7554/eLife.00884


