Caveolae internalization repairs wounded cells and muscle fibers
- University of Maryland, United States
- Brazil Ministry of Education, Brazil
- National Institute on Deafness and Other Communication Disorders, National Institutes of Health, United States
Figures
Figure 1 with 1 supplement
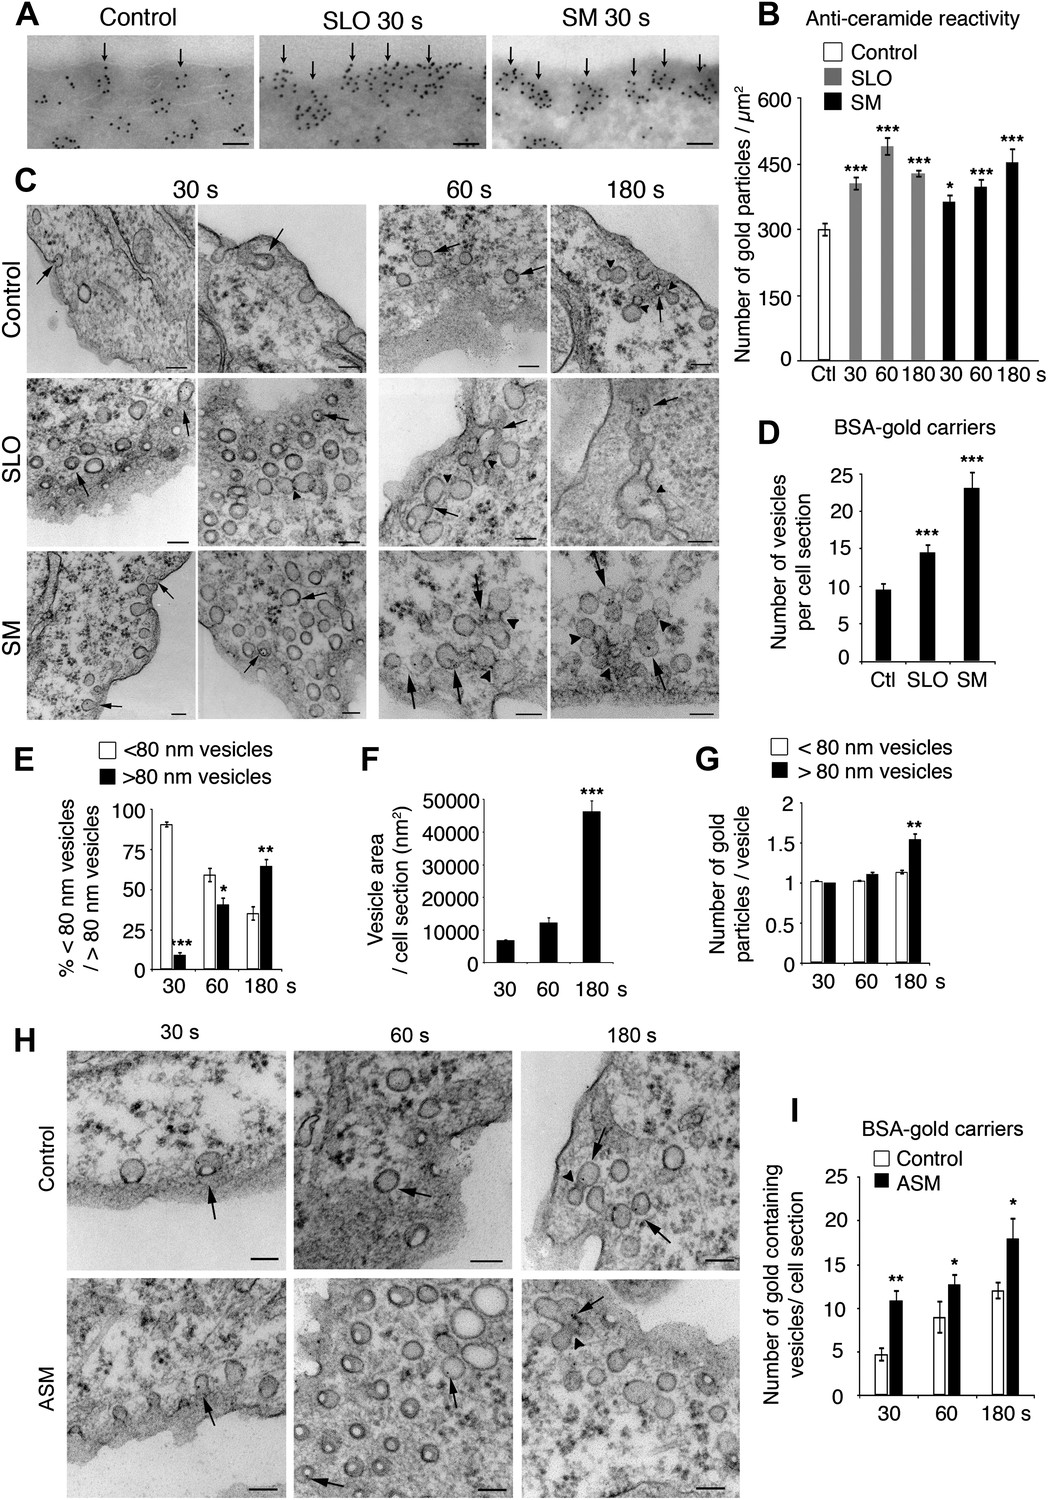
Caveolae-like vesicles accumulate in cells exposed to SLO and sphingomyelinase.
(A) Cryo-immuno EM with anti-ceramide in NRK cells untreated or exposed to SLO or SM for 30 s. Bars: 100 nm. Arrows: patches of ceramide staining near the PM. (B) Quantification of anti-ceramide label in cells treated as in (A). All gold particles (2522–6876) within an area of 200 nm along the PM were counted in 14–31 cell sections. Data represent mean ± SEM of gold particles/cell section. *p=0.023, ***p<0.001. The results are representative of two independent experiments. (C) TEM of NRK cells exposed or not to SLO+Ca2+ or SM in the presence of BSA-gold. Arrows: <80 nm vesicles with BSA-gold. Arrowheads: merged vesicles. Bars: 100 nm. (D) Quantification of vesicles with BSA-gold in control, SLO or SM-treated cells after 30 s. All vesicles containing BSA-gold (191–485) were counted in 20 cell sections/sample. Data represent mean ± SEM of BSA-gold-containing vesicles/cell section. ***p<0.001. The results are representative of two independent experiments. (E) Numbers of BSA-gold positive <80 nm and >80 nm vesicles over time in SLO treated cells. Data represent mean ± SEM of vesicles/cell section. *p=0.033, **p=0.004, ***p<0.001 (comparison with <80 nm vesicles in the same time point). (F) Average area of BSA-gold positive vesicles over time. Data represent mean ± SEM of vesicle area/cell section. ***p<0.001 (comparison with 30 s time point). (G) BSA-gold particles detected within <80 nm and >80 nm vesicles over time. Data represent mean ± SEM of gold particles. **p=0.0019 (comparison with <80 nm vesicles in the same time point). From (E) to (G), all gold-containing vesicles (73–142) were quantified in 14–47 cell sections. (H) TEM of NRK cells untreated (control) or treated with ASM in the presence of BSA-gold as an endocytic tracer. Arrows point to <80 nm vesicles containing BSA-gold; arrowheads point to vesicle fusion profiles. Bars: 100 nm. (I) Quantification of BSA-gold containing vesicles over time in cells treated or not with ASM. All BSA-gold carriers (58–309) were counted in 10–20 sections. Data represent mean ± SEM of BSA-gold-containing vesicles/cell section. *p=0.03–0.04, **p=0.005 (comparison with controls in each time point). All datasets were compared using an unpaired Student’s t test.
Figure 1—figure supplement 1
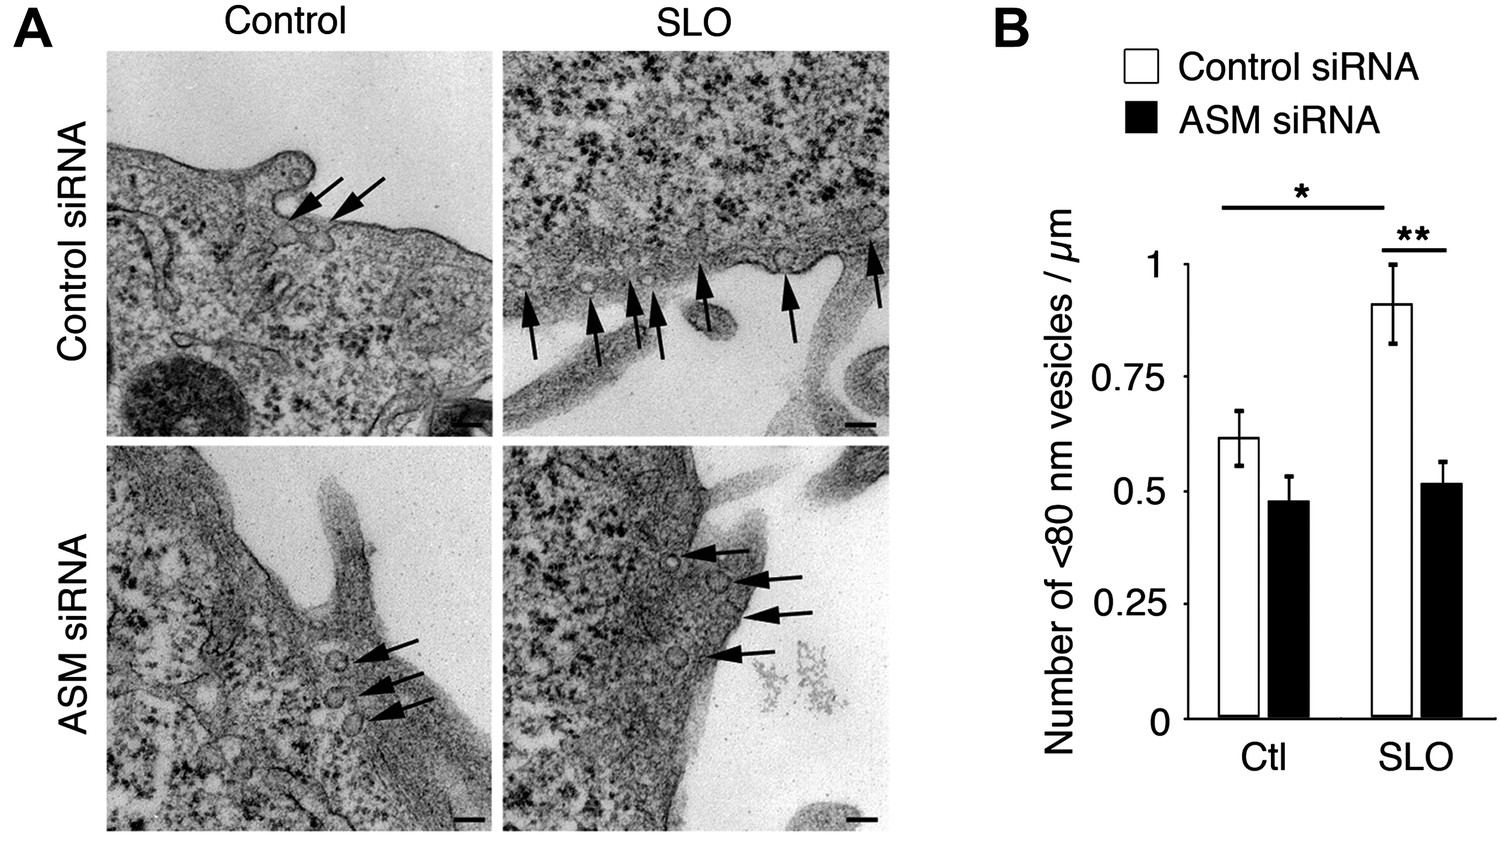
Transcriptional silencing of ASM inhibits intracellular accumulation of caveolae-like vesicles after SLO injury.
(A) TEM of control and ASM siRNA-treated HeLa cells incubated or not with SLO for 60 s. Arrows: <80 nm profiles. Bars: 100 nm. (B) Number of <80 nm vesicular profiles/µm in H. All vesicles (127–216) <80 nm diameter were counted in 40 random fields/sample and normalized by PM length. Data represent mean ± SEM of vesicles/cell section. *p=0.021; **p=0.004 (comparisons with control condition or control siRNA), unpaired Student's t test. The results are representative of two independent blinded quantifications performed by two independent investigators.
Figure 2
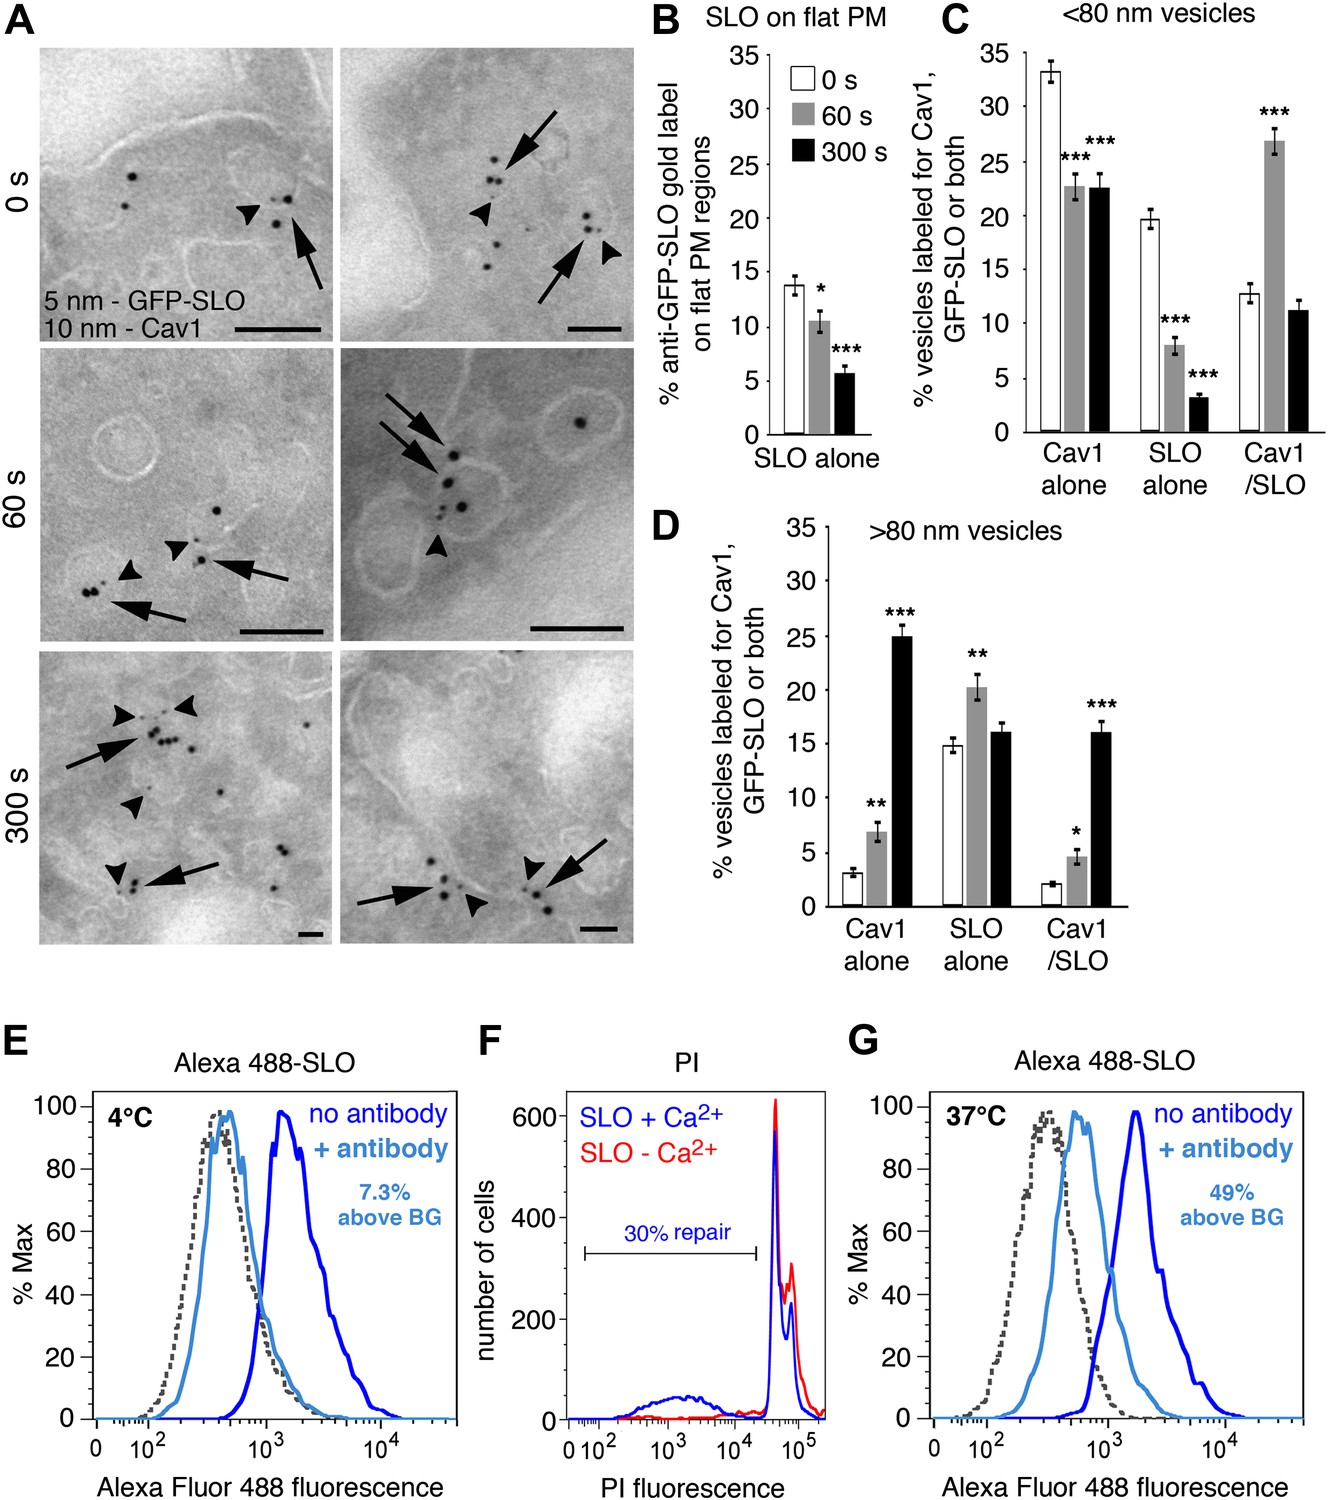
SLO is internalized in Cav1-positive caveolae-like vesicles that separate from the PM.
(A) Cryo-immuno EM localization of GFP-SLO and Cav1 in NRK cells. 5 nm gold: anti-GFP (arrowheads); 10 nm gold: anti-Cav1 (arrows). Bars: 100 nm. (B–D) Quantification of the relative amount of GFP-SLO and/or Cav1 on flat PM structures (B), vesicular profiles <80 nm (C) or vesicular profiles >80 nm (D). All labeled structures (17–280) in 80 random fields were counted and the data expressed as % of total antibody-stained structures. Data represent mean ± SEM of labeled structures/cell section. *p=0.039–0.052, **p=0.006–0.007, ***p<0.001, unpaired Student’s t test. The results are representative of two independent experiments. (E) FACS analysis of NRK cells exposed to Alexa 488-SLO at 4°C for 5 min, followed by anti-Alexa Fluor 488 quenching antibodies for 2 min. The percentage of quench-protected toxin fluorescence above the endogenous cellular background level (BG) is indicated. (F) FACS analysis of NRK cells exposed to Alexa 488-SLO ± Ca2+ at 37°C for 5 min, followed by PI staining. The percentage of PI-negative cells is indicated. (G) FACS analysis of NRK cells exposed to Alexa 488-SLO + Ca2+ at 37°C for 5 min, followed by anti-Alexa Fluor 488 quenching antibodies for 2 min. The profile shown corresponds to the PI-negative cell population shown in (F). The percentage of quench-protected toxin fluorescence above the endogenous cellular background level (BG) is indicated. Dashed lines, no Alexa 488-SLO background controls. The results are representative of at least five independent experiments.
Figure 3
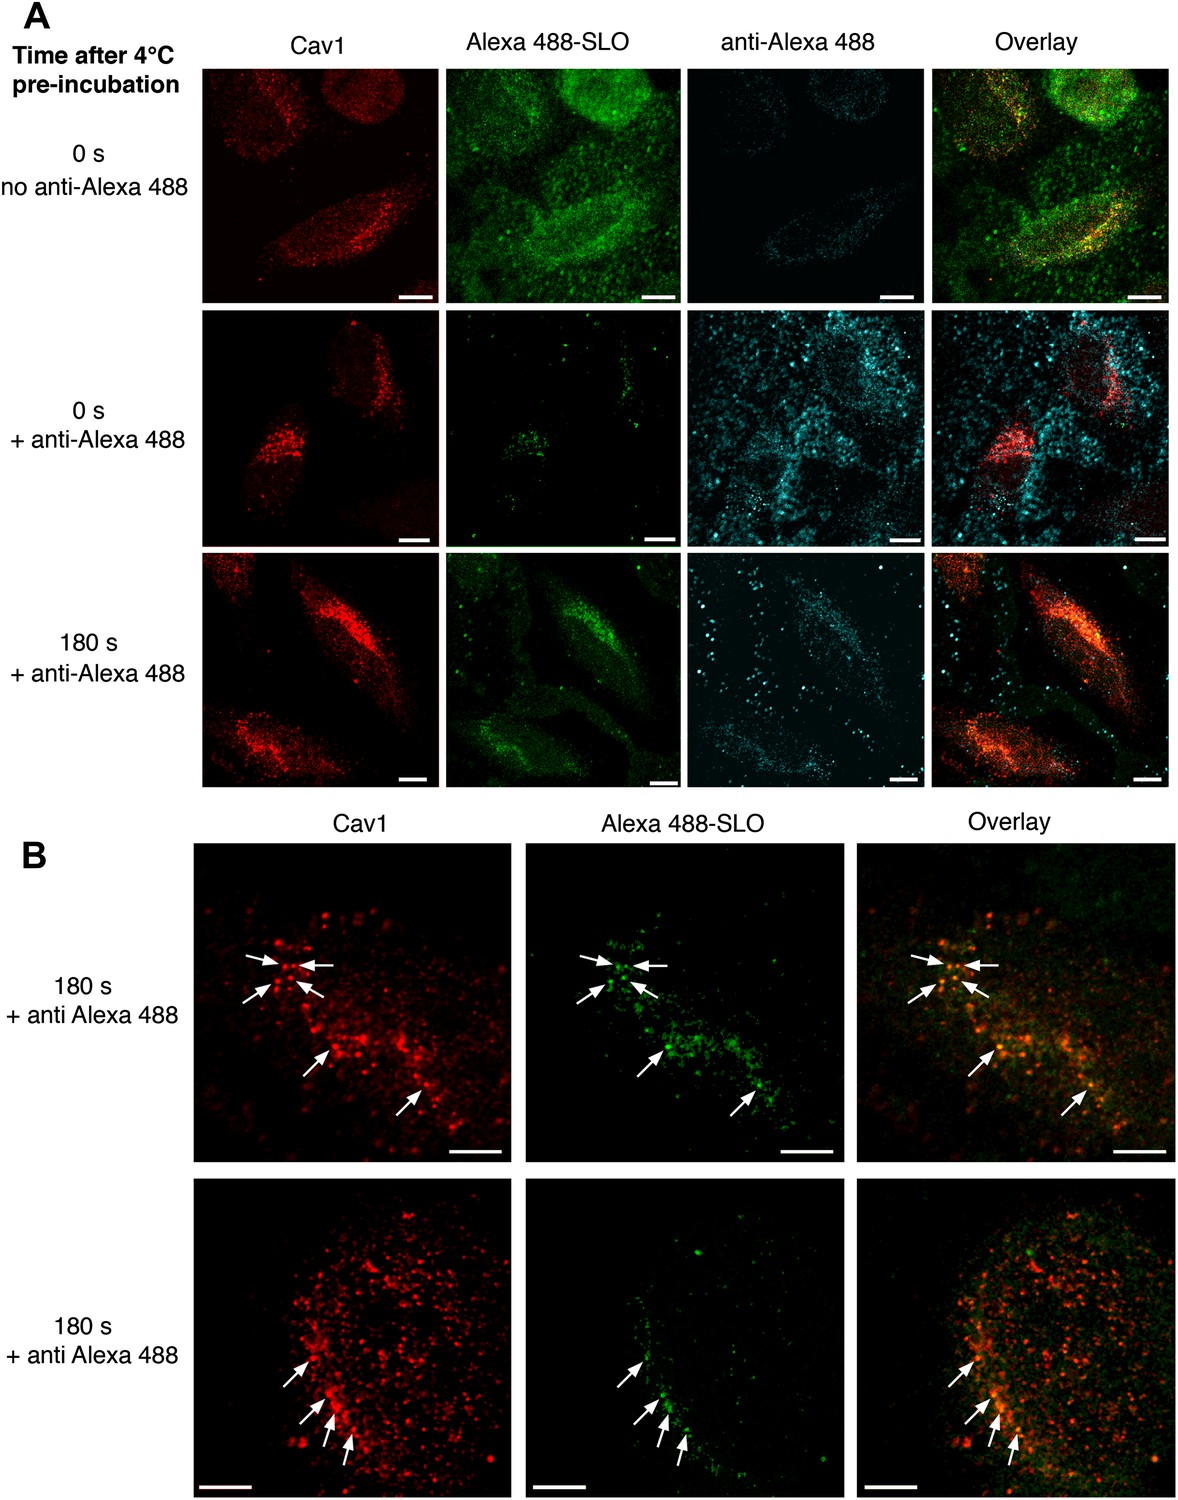
Internalized SLO colocalizes with Cav1.
(A) HeLa cells were pre-incubated with 3 µg/ml Alexa 488-SLO (green) for 5 min at 4°C, washed and either kept at 4°C (0 s) or incubated at 37°C in DME+Ca2+ (180 s), followed or not by anti-Alexa Fluor 488 quenching antibodies (blue) for 30 min at 4°C. After fixation cells were permeabilized, labeled with anti-Cav1 antibodies (red) and analyzed by confocal microscopy (single optical sections are shown). Bars: 10 µm. (B) Higher magnification images of cells treated as in A and incubated for 180 s at 37°C with quenching antibodies. Arrows: Vesicular carriers positive for both Cav1 and Alexa 488-SLO. Bars: 5 µm.
Figure 4
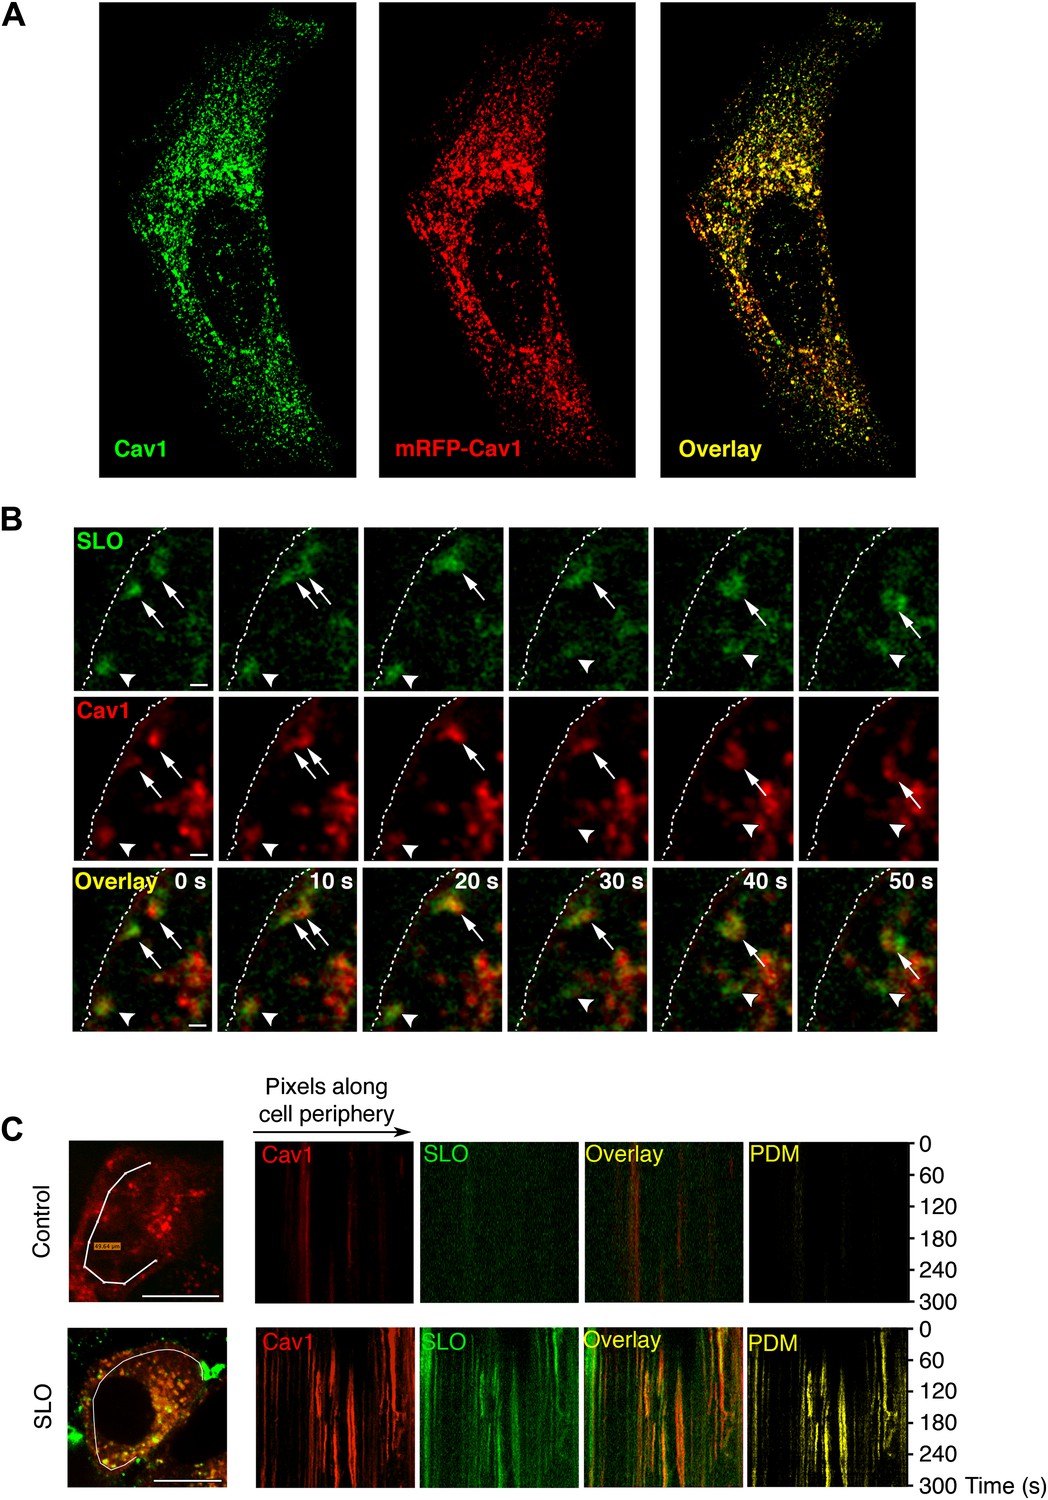
SLO enters cells associated with Cav1-positive carriers.
(A) Confocal optical section at the bottom surface of a HeLa cell transfected with mRFP-Cav1 (red) and stained with anti-Cav1 antibodies (green). (B) Time-lapse images of HeLa cells expressing mRFP-Cav1 and imaged for 300 s after incubation with GFP-SLO+Ca2+. Dotted line: PM. Arrowheads: Cav1/SLO carrier moving rapidly into cell. Arrows: Cav1/SLO carriers that merge after internalization. Bars: 1 µm. See also Figure 2 and Videos 1, 2, 3. (C) Kymographs of mRFP-Cav1 and GFP-SLO fluorescence along a line at the cell periphery. PDM: Positive Difference of the Mean (co-localization index). Bars: 10 µm. The results are representative of seven independent experiments.
Figure 5

EHD2-Cav1 colocalization is decreased after caveolar endocytosis triggered by SLO or sphingomyelinase.
(A) TIRF images of Cav1 and EHD2 immunostaining in HeLa cells treated or not with SLO or SM for 30 or 60 s. Bars : 50 µm. Arrows: Cav1 positive, EHD2 negative puncta corresponding to internalized caveolar vesicles. (B) Quantification of Cav1 fluorescence intensity in cells treated as in C. Quantifications were performed on 53–79 cells/sample. **p=0.002, ***p<0.001, unpaired Student’s t test. (C) Colocalization of Cav1 with EHD2 in cells treated as in B. Quantifications were performed on 65–82 cells/sample. Data represent mean ± SEM of values/cell. **p=0.009, ***p<0.001, unpaired Student’s t test. The results in A–C are representative of four independent experiments.
Figure 6

PM repair and endocytosis of SLO in caveolar vesicles are Cav1-dependent.
(A) Western blot with anti-Cav1 and anti-actin (loading control) in NRK cell lysates treated with control or Cav1 siRNA. (B) Live imaging of FM1–43 influx in NRK cells treated with control or Cav1 siRNA, with and without SLO ± Ca2+. Bars: 10 μm. See Video 4. (C) Quantification of intracellular FM1–43 fluorescence in B. Data represent mean ± SEM of fluorescence intensity/cell. The results are representative of four independent experiments. (D) TEM of control and Cav1 siRNA-treated NRK cells incubated or not with SLO or SM for 30 s. Bars: 100 nm. (E) Number of <80 nm vesicular profiles/µm in cells treated as in D. All vesicles <80 nm diameter (1411–3912) were counted in 20–30 sections/sample and normalized by PM length. Data represent mean ± SEM of vesicles/cell section. **p=0.003, ***p<0.001, unpaired Student’s t test. The results are representative of two independent blinded quantifications performed by two independent investigators. (F) Cryo-immuno EM localization of Cav1 in NRK cells. All labeled structures (281–418) in 80 random fields were counted and the data expressed as % of total antibody stained structures. Data represent mean ± SEM of gold particles/cell section. ***p<0.001 (comparison with 0 s condition), unpaired Student’s t test. The panels on the left show representative images of Cav1 staining (arrows, 10 nm gold label) on PM and <80 nm vesicular profiles. Bars: 100 nm. The results are representative of two independent experiments.
Figure 7
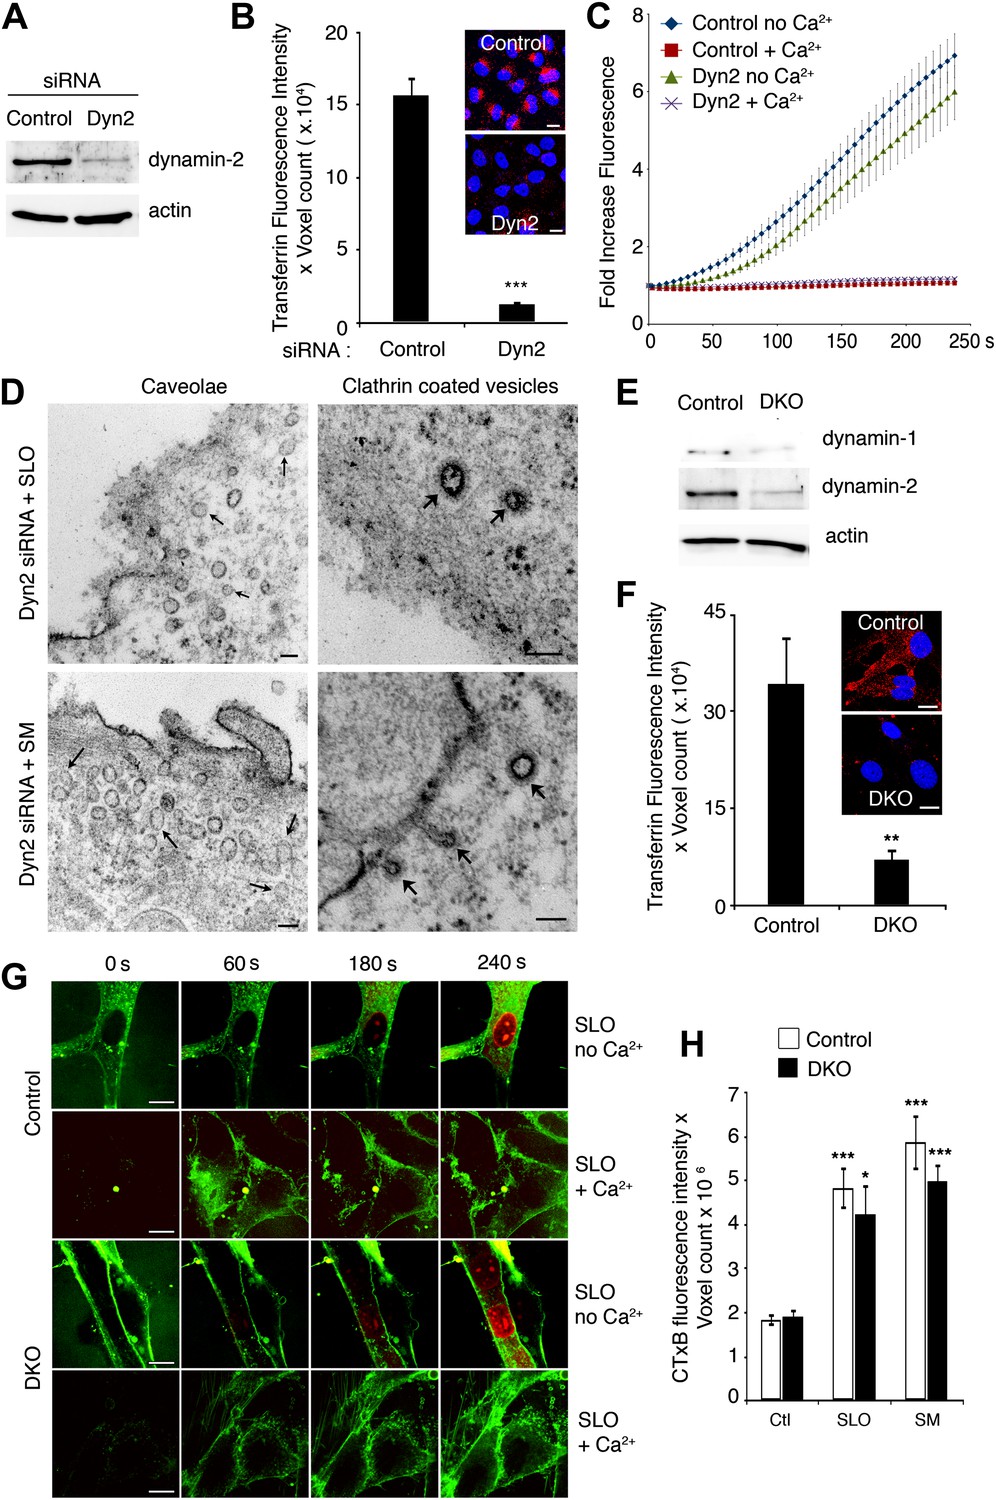
Depletion in dynamin-1 and -2 does not inhibit PM repair and SLO or SM-induced internalization of caveolar vesicles.
(A) Western blot with anti-dynamin-2 and anti-actin (loading control) in lysates of NRK cells treated with control or Dyn2 siRNA. (B) Quantification of transferrin uptake in NRK cells treated with control or Dyn2 siRNA. Data represent mean ± SEM of fluorescence intensity/microscopic field. ***p<0.001. Inset images: red, transferrin; blue, DAPI-stained nuclei. (C) Quantification of FM1–43 influx in NRK cells treated with control or Dyn2 siRNA, and exposed or not to SLO ± Ca2+. Data represent mean ± SEM of fluorescence intensity/cell. The results are representative of three independent experiments. (D) TEM of Dyn2 siRNA-treated cells exposed to SLO or (SM) for 60 s, fixed and stained with ruthenium red. Small arrows: unstained caveolae. Wide arrows: stained clathrin-coated vesicles and elongated endocytic structures connected to the PM. Bars: 100 nm. (E) Western blot with anti-dynamin-1, anti-dynamin-2, and anti-actin (loading control) in lysates of cells derived from dynamin-1 and -2 conditional double knockout mice, induced with tamoxifen (DKO) or not induced (Control). (F) Quantification of transferrin uptake in control or dynamin-1-2 DKO cells. Data represent mean ± SEM of fluorescence intensity/microscopic field. **p=0.003. Inset images: red, transferrin; blue, DAPI-stained nuclei. (G) Time-lapse imaging of FM1–43 and PI influx during permeabilization with SLO ± Ca2+ in control and dynamin-1 and -2 DKO cells, (H) Quantification of CTxB-A488 uptake by control and dynamin-1-2 DKO cells exposed or not to SLO or SM for 180 s. Data represent mean ± SEM of fluorescence intensity/microscopic field. *p=0.014, ***p<0.001 (comparison with respective control conditions), unpaired Student’s t test. All results in this figure are representative of three or more independent experiments.
Figure 8 with 1 supplement
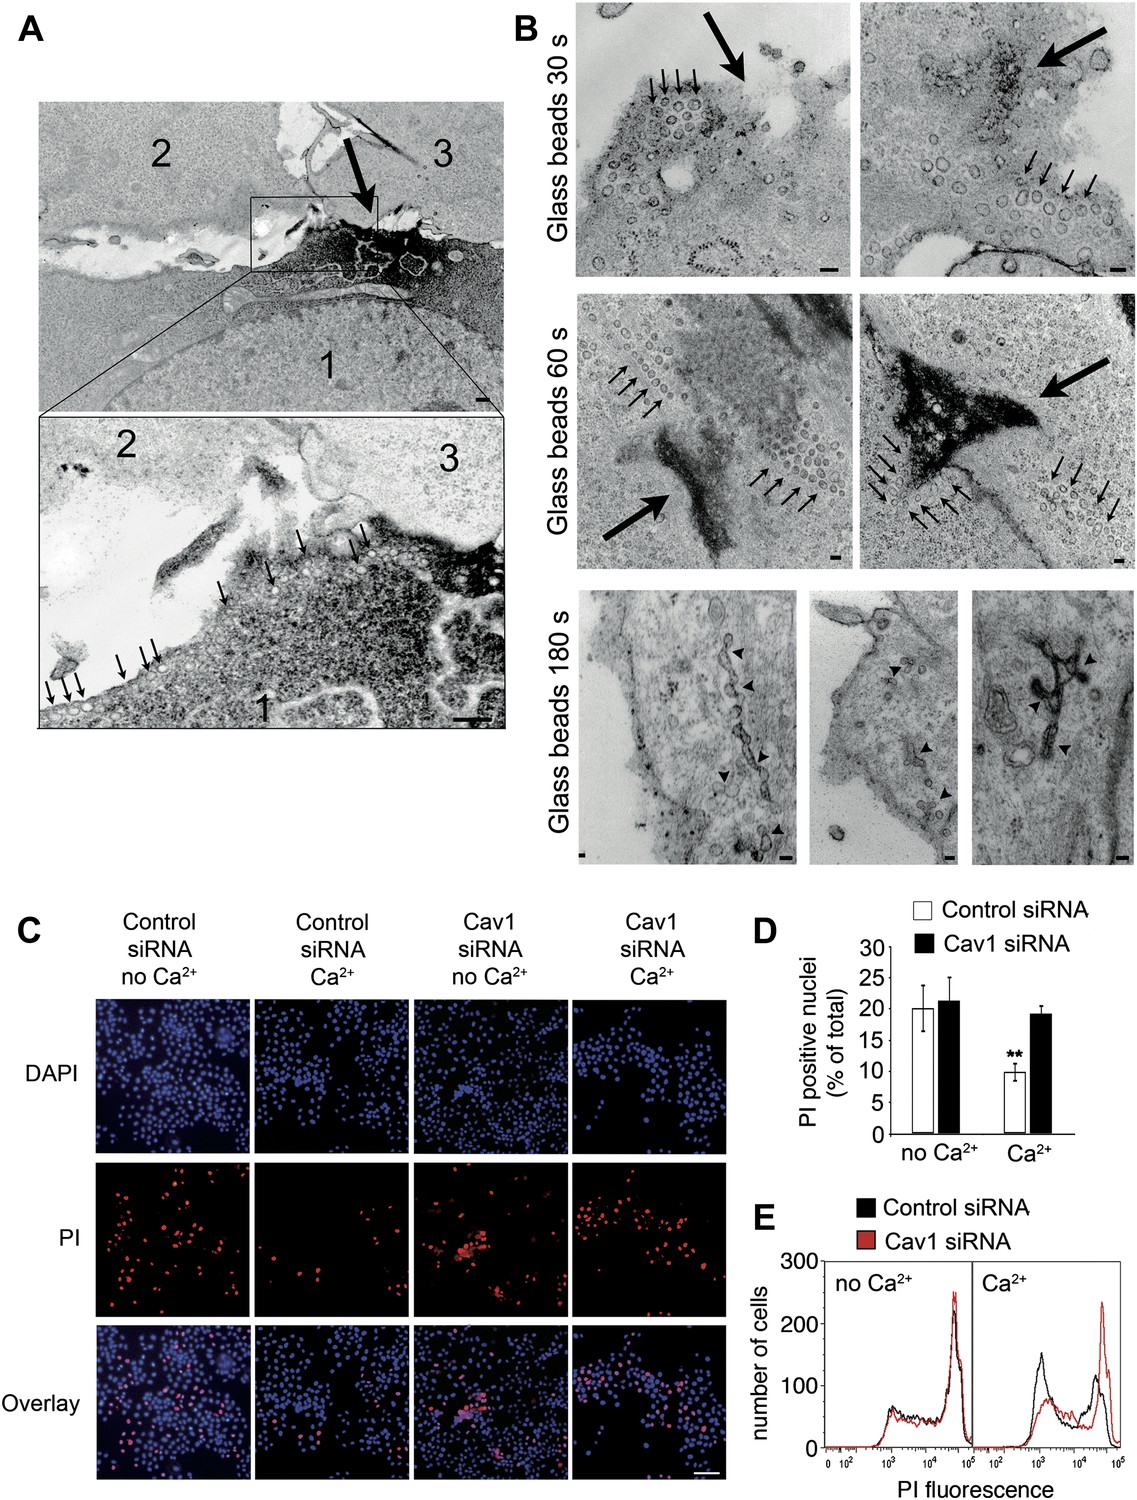
Caveolae accumulate at sites of mechanical wounding, and Cav1 is required for mechanical wound repair.
(A) TEM of NRK cells wounded with glass beads and stained with ruthenium red during fixation. Numerous caveolae-like vesicles (arrows, lower magnified image) are visible near the wound, identified by ruthenium red influx in cell #1 (large arrow, upper image). Two non-wounded cells are present in the same field (#2 and #3, upper image). Bar: 500 nm. (B) TEM of NRK cells wounded with glass beads and stained with ruthenium red. Small arrows: clusters of caveolae-like vesicles. Large arrows: wound sites. Arrowheads: merged caveolae-like vesicles connected to the PM. Bars: 100 nm. (C) NRK cells treated with control or Cav1 siRNA, wounded with glass beads ± Ca2+ and stained with PI (red) and (blue). Bar: 50 μm. (D) Quantification of PI positive nuclei in D. Data represent the mean ± SEM of the %PI positive cells/field. **p=0.0012 (compared to no Ca2+ conditions), unpaired Student’s t test. The results are representative of two independent experiments. (E) FACS quantification of PI staining in NRK cells treated with control or Cav1 siRNA, mechanically wounded by scraping from the dish ± Ca2+. The results are representative of two independent experiments.
Figure 8—figure supplement 1
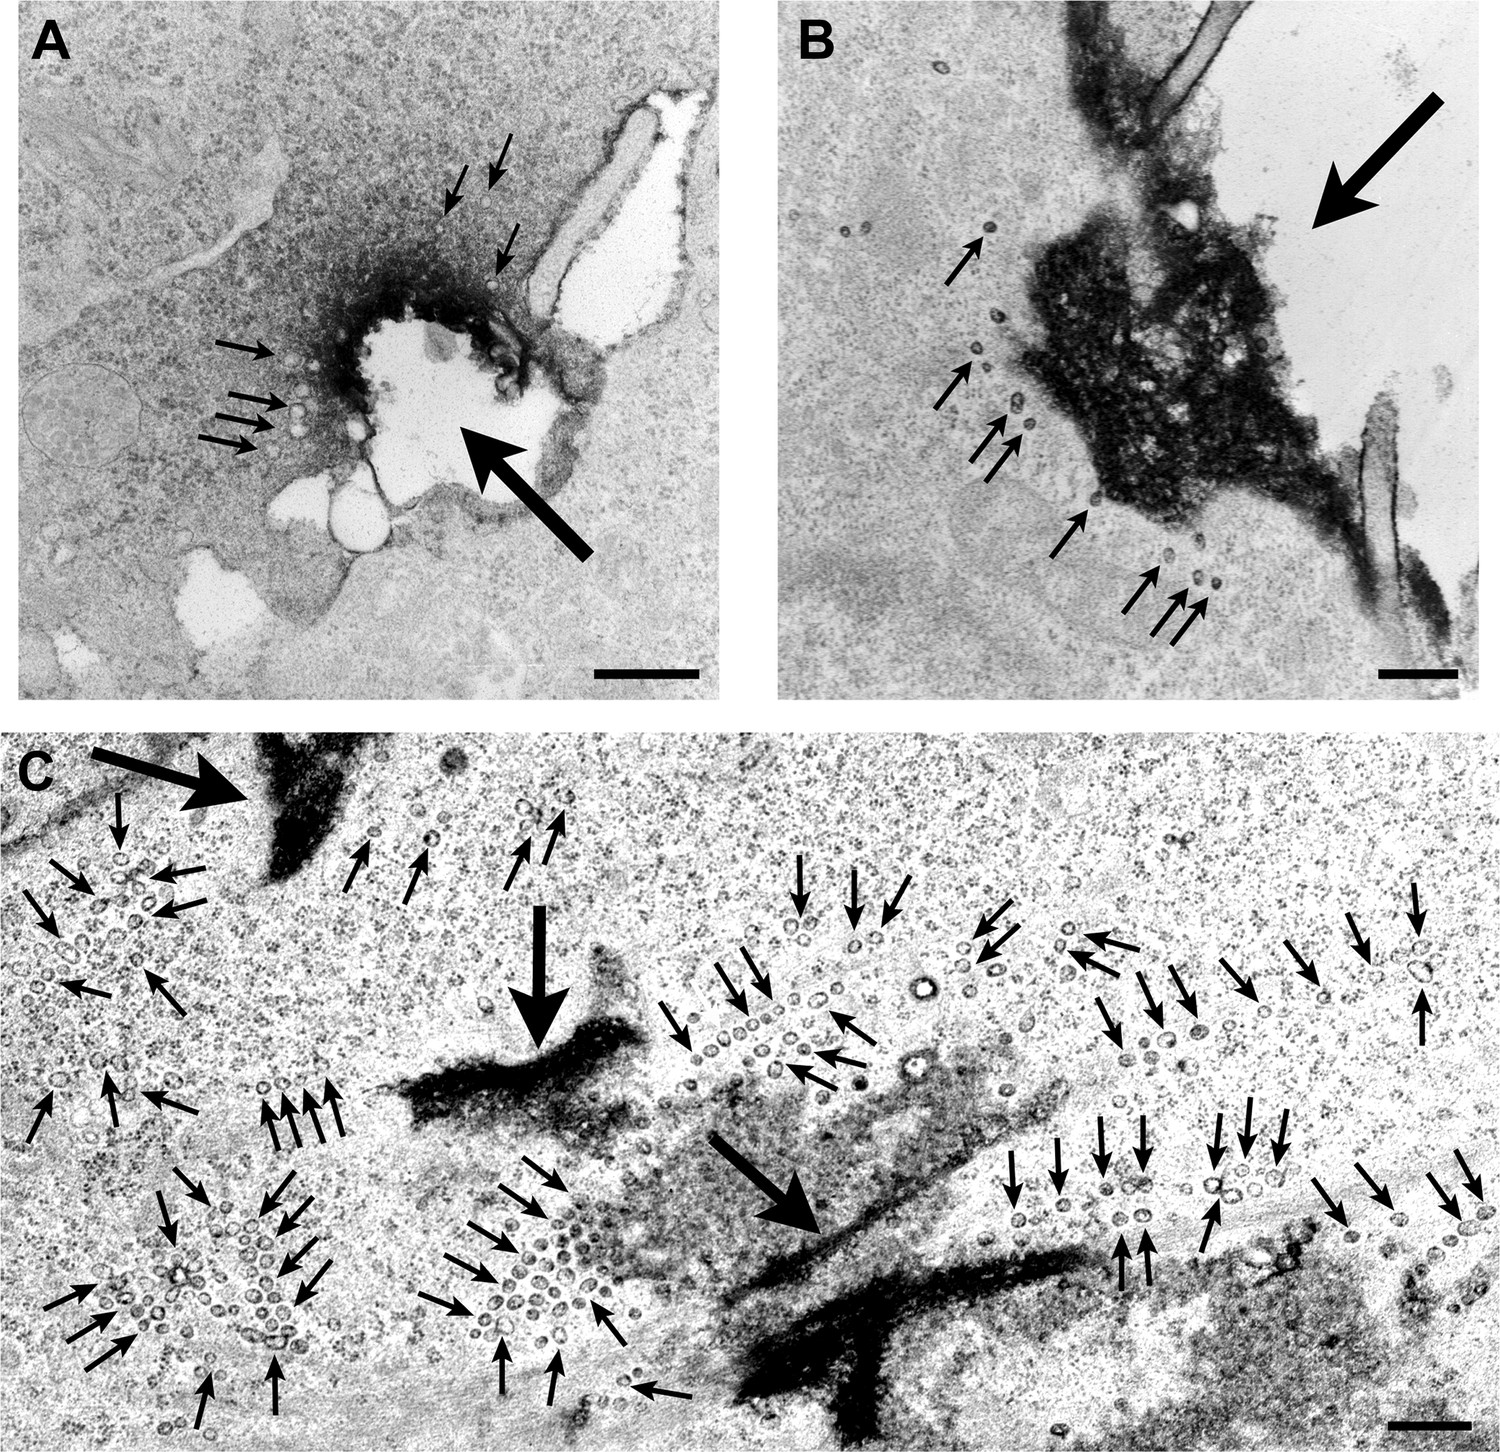
Clusters of caveolae are observed next to sites of mechanical wounding.
TEM of NRK cells injured with glass beads for 30 s (A) or 60 s (B and C) and stained with ruthenium red after fixation to label sites of PM injury. Bars: 500 nm. Large arrows: injury sites; small arrows: caveolae-like vesicular profiles.
Figure 9
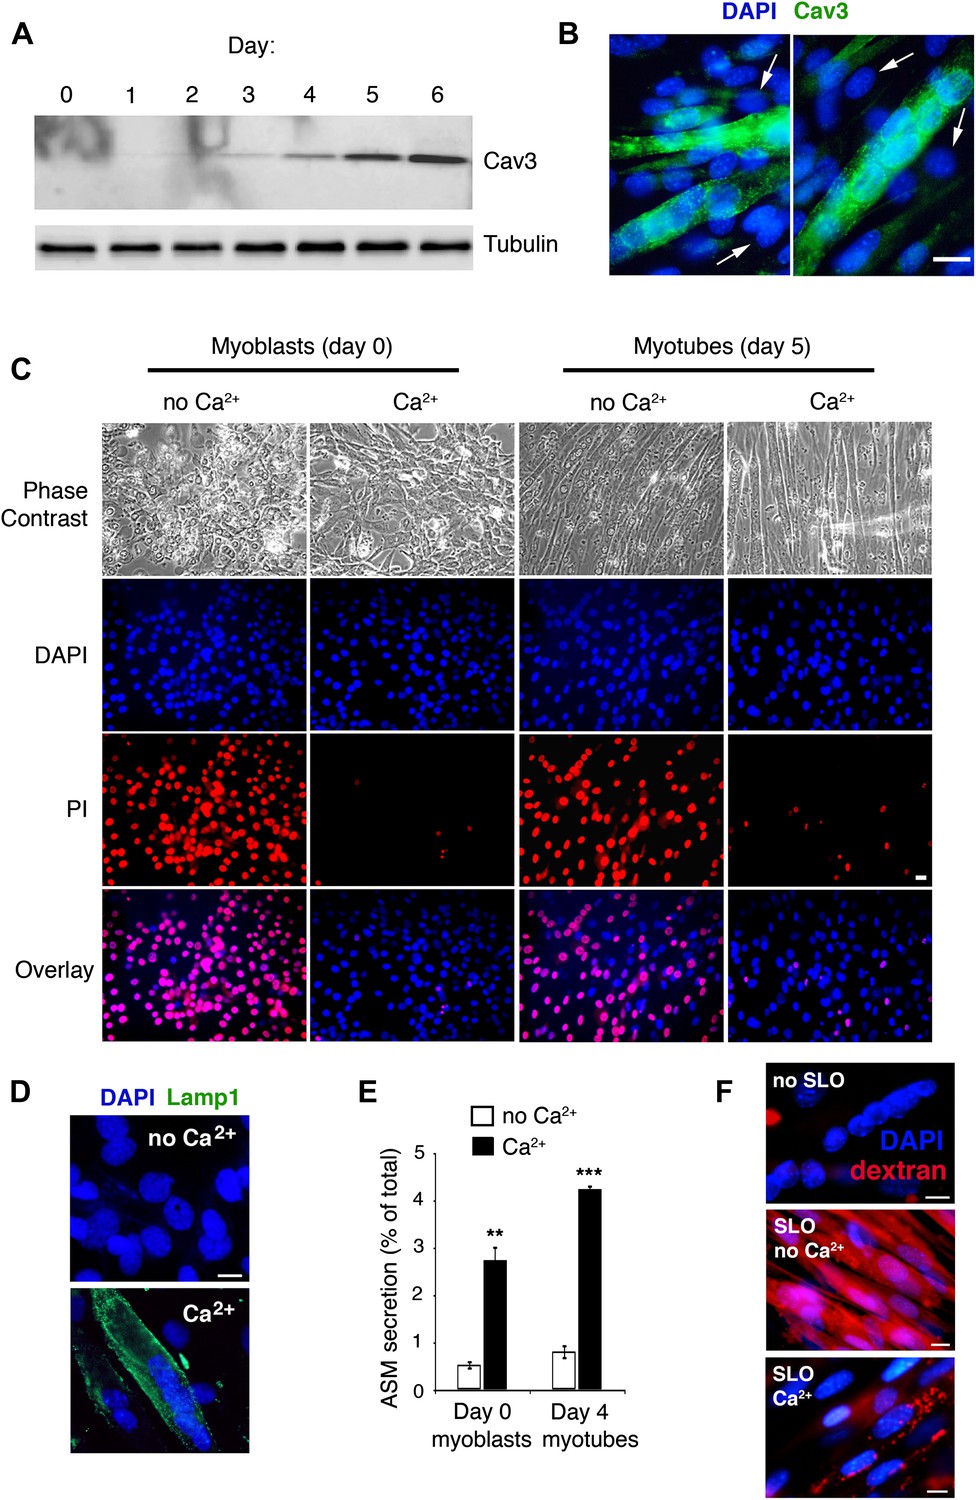
Cav3 expression, Ca2+-dependent sarcolemma repair, lysosomal exocytosis and endocytosis in C2C12 myoblasts/myotubes.
(A) Western blot with anti-Cav3 or anti-tubulin (loading control) antibodies showing that differentiation of C2C12 myoblasts induced by serum starvation leads to a gradual enrichment of the cultures in myotubes expressing the caveolin isoform Cav3. (B) Immunofluorescence of C2C12 cultures at day 5 after serum starvation with anti-Cav3 antibodies. Green: Cav3 staining in myotubes. Blue: DAPI-stained nuclei. Arrows point to DAPI-stained nuclei of Cav3-negative myoblasts. Bar: 100 nm. (C) C2C12 cells at day 0 (myoblasts) and day 5 (enriched in myotubes) after serum starvation, permeabilized with 400 ng/ml SLO and stained with PI (membrane impermeable) and DAPI (membrane permeable) after 4 min with or without Ca2+. Bar: 10 µm. The results in A–C are representative of three independent experiments. (D) Immunofluorescence with anti-Lamp1 in live C2C12 myotubes 15 min after permeabilization with SLO ± Ca2+. Green: Lamp1 luminal epitope. Blue: DAPI-stained nuclei. Bar: 10 μm. The results are representative of two independent experiments. (E) ASM activity secreted by undifferentiated myoblasts (day 0) or myotube-enriched C2C12 cultures (day 4) after SLO±Ca2+ for 240 s. Data represent mean ± SEM of triplicates. **p=0.002, ***p<0.001, unpaired Student’s t test . (F) Myotubes permeabilized or not with SLO±Ca2+ for 240 s in the presence of Texas Red-dextran. Red: dextran. Blue: DAPI-stained nuclei. Bars: 10 μm. The results are representative of three independent experiments.
Figure 10
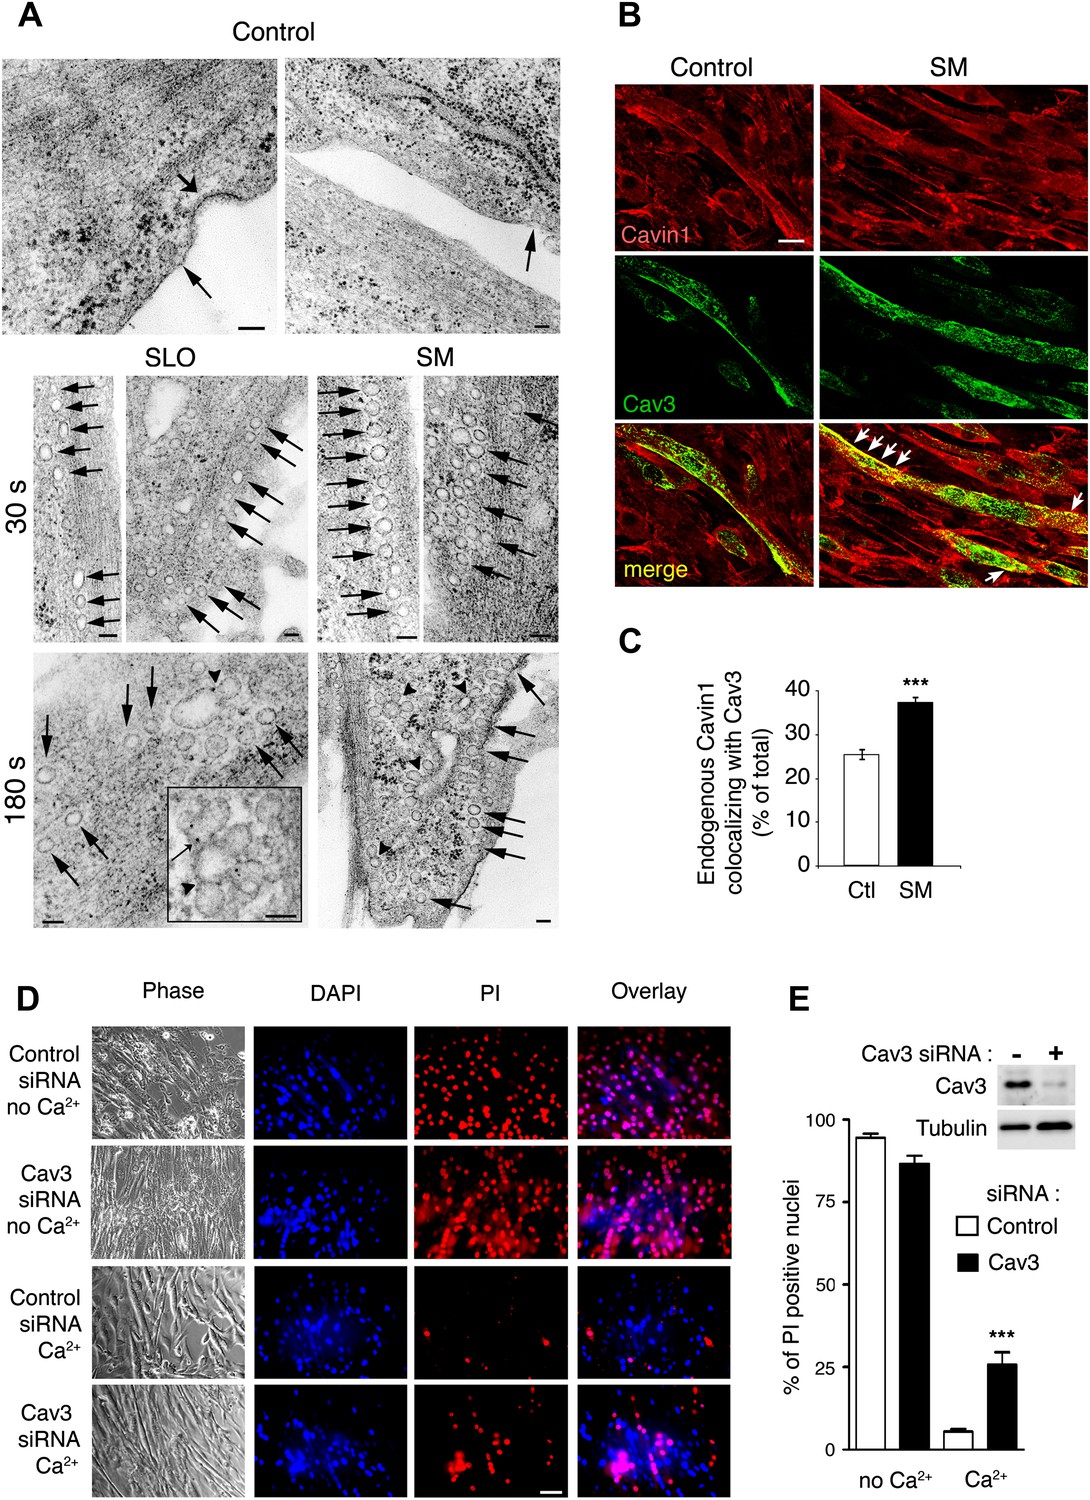
Caveolae-like vesicles accumulate in C2C12 myotubes exposed to sphingomyelinase and SLO, and resealing after injury depends on Cav3.
(A) TEM of myotubes untreated (control) or exposed to SLO or SM. Arrows: caveolae-like vesicles. Arrowheads: merged caveolae-like vesicles. Wide arrow: clathrin-coated pit. Inset: higher magnification showing luminal BSA-gold (thin arrow). Bars: 100 nm. The results are representative of four independent experiments. (B) Confocal images of immunofluorescence with anti-cavin1 (red) and anti-Cav3 (green) in C2C12 myotubes treated or not with SM for 30 s. Arrows show colocalization of cavin1 and Cav3 staining. Bar: 10 µm. The results are representative of two independent experiments. (C) Quantification of the fraction of all cavin1 colocalizing with Cav3 in E. Data represent mean ± SEM of the colocalization coefficient/myotube. ***p<0.001, unpaired Student’s t test. (D) Images of myotube-enriched cultures treated with control or Cav3 siRNA, exposed to SLO±Ca2+ for 240 s and stained with PI and DAPI. PI (red) and DAPI (blue). Bar: 50 μm. The results are representative of four independent experiments. (E) Western blot of Cav3 or tubulin (loading control), and quantification of PI positive nuclei in an assay performed as in (D). Data represent the mean of three independent experiments ± SEM. ***p<001, unpaired Student’s t test.
Figure 11
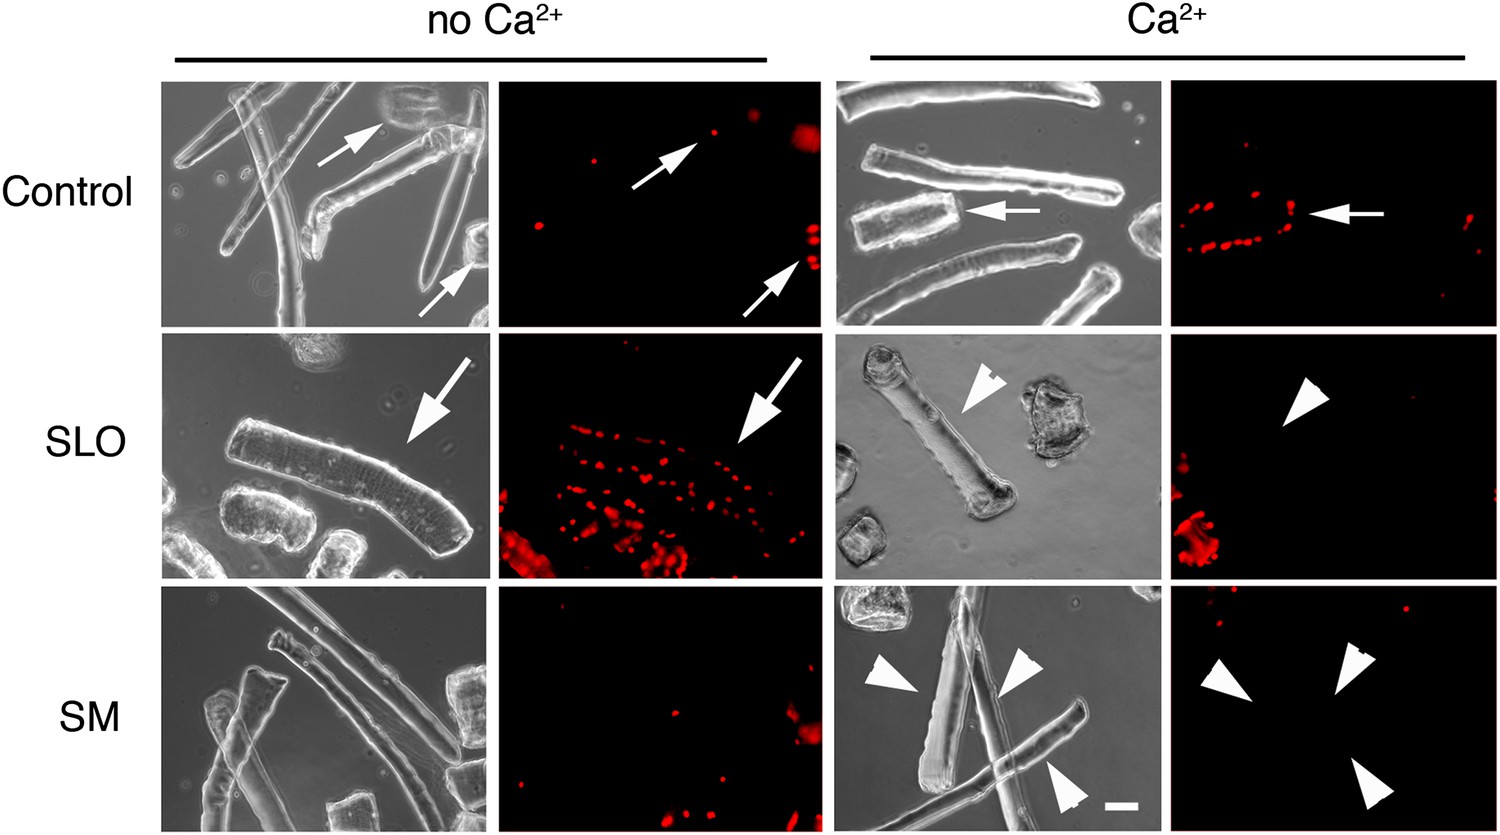
Primary muscle fibers are sensitive to SLO permeabilization and reseal in the presence of Ca2+.
Flexor digitorum brevis mouse muscle fibers treated or not with 400 ng/ml SLO or 50 mU/ml SM in the presence or absence of Ca2+ and stained with PI (red) after 30 s. Small arrows point to PI positive fibers that were injured during dissection and failed to reseal. Arrowheads point to PI-negative fibers that resealed after SLO+Ca2+, or were not injured by the SM treatment. Large arrows point to a PI-positive fiber that was injured by SLO and failed to repair without Ca2+. Bar: 50 µm.
Figure 12 with 1 supplement

Caveolae accumulate in primary mouse muscle fibers after exposure to sphingomyelinase or sarcolemma injury.
(A–C) TEM of flexor digitorum brevis fibers untreated (A) or exposed for 300 s to SLO (B) or SM (C). Three examples are shown for each. Arrows: single or merged caveolae-like vesicles. Bars: 100 nm. The results are representative of four independent experiments. (D) TEM of fiber fixed immediately after dissection, showing mechanical damage (site #1). Bar: 5 μm. Panels 1–4 show enlarged images of the regions indicated in the whole fiber image. Arrows: single or merged caveolae. Bars: 100 nm. The results are representative of two independent experiments.
Figure 12—figure supplement 1
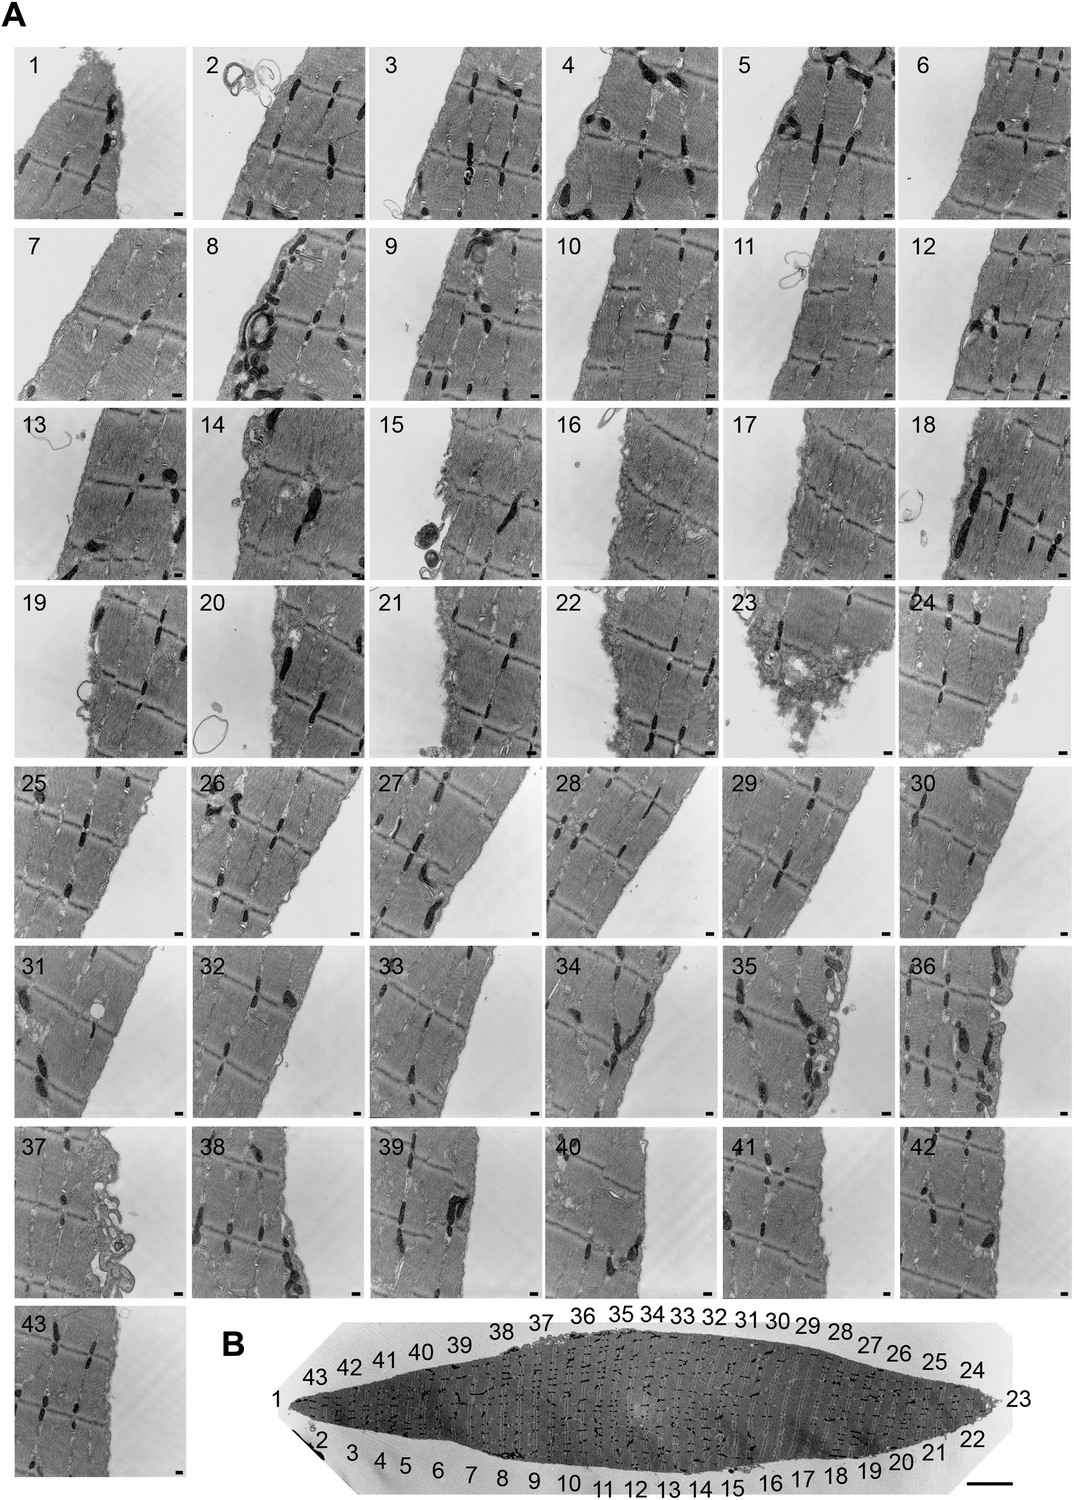
Accumulation of caveolae-like vesicles in mechanically injured flexor digitorum brevis muscle fibers.
(A) Sequential TEM images along the whole periphery of a fiber fixed shortly after dissection. Caveolae-like vesicles are more abundant in the vicinity (#21–24) of the wound site (#23). Bars: 100 nm. (B) TEM image of the whole fiber indicating the location of each image. Bar: 5 µm. The results are representative of several injured fibers observed in the two independent experiments described in Figure 12.
Figure 13
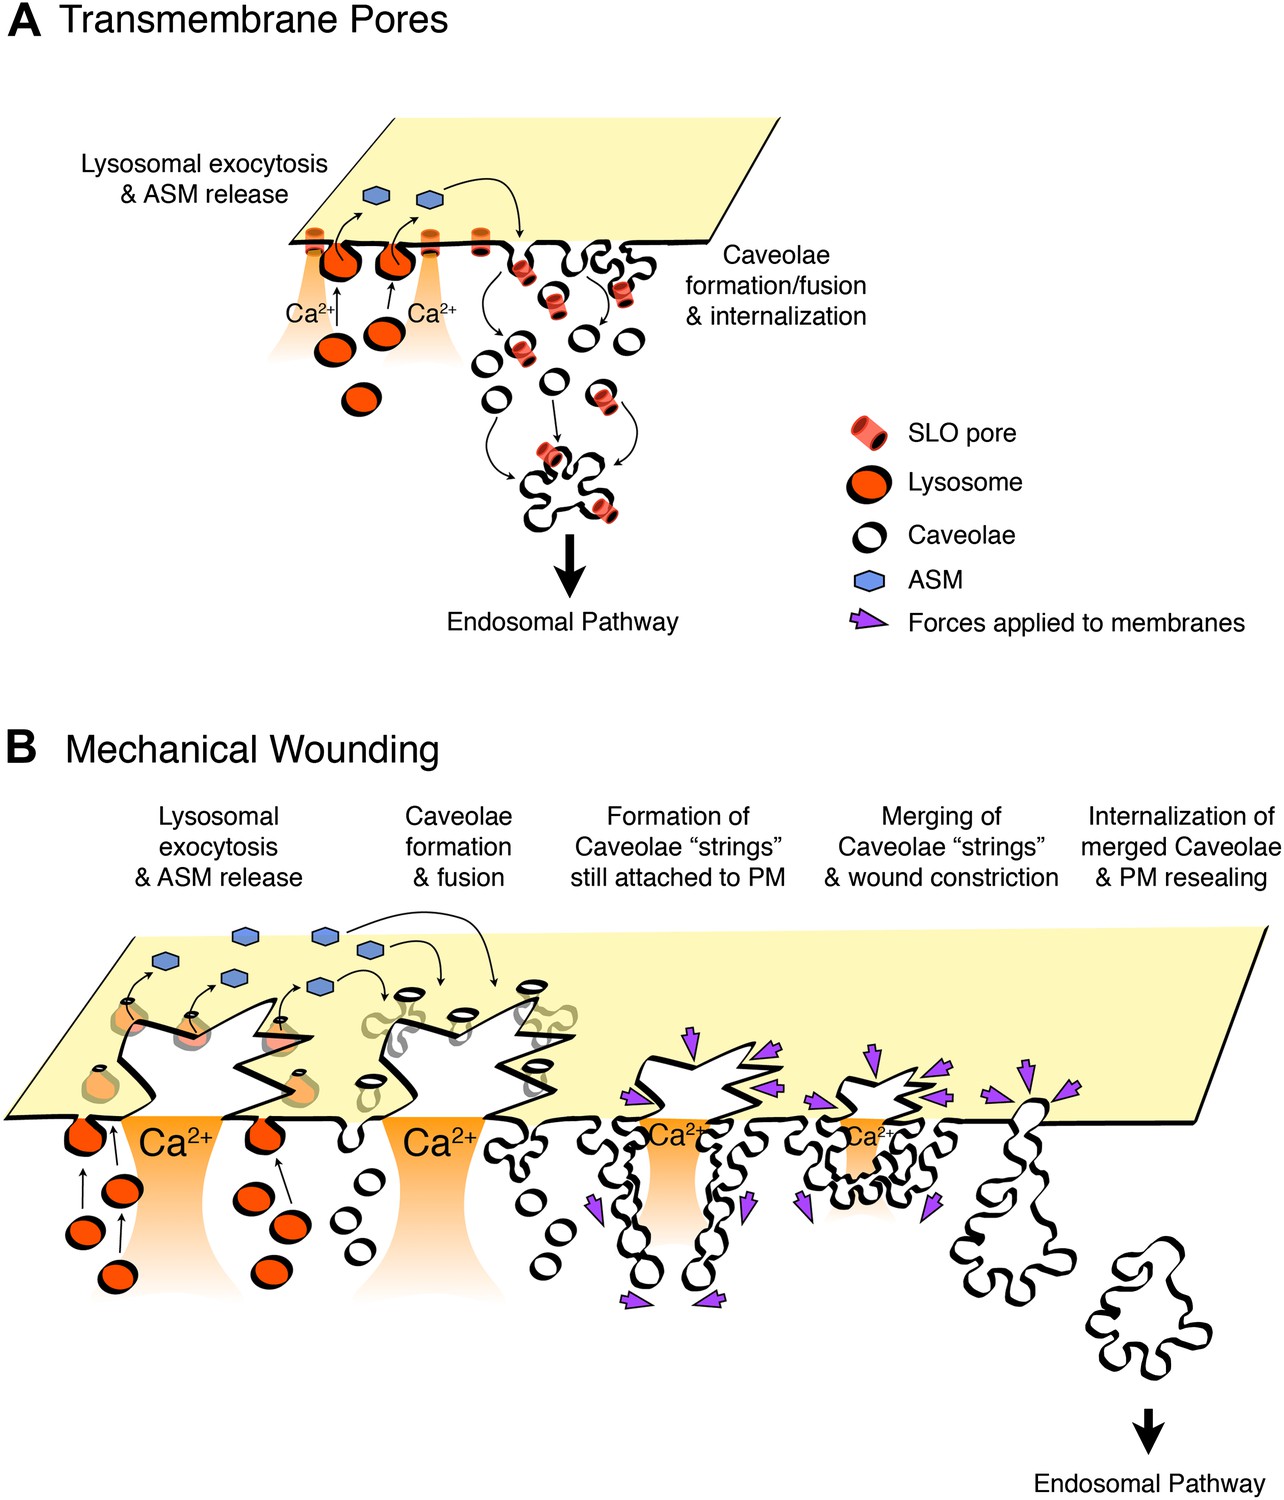
Model for PM repair mediated by caveolar endocytosis.
Permeabilization with transmembrane toxin pores (A) or mechanical wounding (B) triggers Ca2+ influx, exocytosis of lysosomes, release of ASM, and generation of ceramide at the PM outer leaflet, a process that promotes caveolae internalization and fusion. Toxin pores would be removed from the PM by caveolar endocytosis (A), while larger breaches on the lipid bilayer would be gradually constricted and resealed as a results of forces generated on the PM by the intracellular clustering, fusion and internalization of merged/branched caveolar structures (B).
Videos
Video 1
Internalization and lateral movement of SLO/Cav1 carriers, (related to Figure 4).
HeLa cells expressing mRFP-Cav1 (red) were pre-incubated for 5 min with 800 ng/ml of GFP-SLO (green) at 4°C and transferred in cold DMEM+Ca2+ to a live imaging chamber at 37°C, to allow for progressive warming, pore formation, and PM repair. Images were acquired for 5 min at 2 s/frame on a spinning disk confocal microscope. The video shows a vesicular structure positive for Cav1 and SLO that appears to separate rapidly from the PM and move laterally along the PM before disappearing into a different focal plane. Video is displayed at 6.67 frames/s. Dotted line: PM. Arrow indicates Cav1/SLO carrier. Bars: 5 µm.
Video 2
Internalization and trafficking of SLO/Cav1 carriers (related to Figure 4).
HeLa cells were treated as in video 1. The video shows a Cav1 positive structure on the PM that accumulates SLO before being internalized and moving rapidly into the cell. Video is displayed at 6.67 frames/s. Dotted line: PM. Arrow indicates Cav1/SLO positive vesicle. Bars: 5 µm.
Video 3
Intracellular merger and rapid internalization of SLO/Cav1 carriers (related to Figure 4).
HeLa cells were treated as in video 1. The video shows two separate SLO and Cav1 positive carriers close to the PM (arrows) that merge before rapidly moving further into the cell. The same cell contains a SLO/Cav1 positive structure (arrowhead) that suddenly separates from the PM and moves rapidly into the cell. Video is displayed at 6.67 frames/s. Dotted line: PM. Bars: 5 µm.
Video 4
RNAi-mediated silencing of Cav1 expression inhibits PM repair, allowing sustained FM1–43 influx into SLO-permeabilized NRK cells (related to Figure 6).
NRK cells treated with control or Cav1 siRNA were left untreated (no SLO) or pre-incubated with SLO at 4°C and transferred to a live imaging chamber at 37°C in the presence or absence of Ca2+, followed by addition of FM1–43 and time-lapse imaging in a spinning disk confocal microscope for 4 min at 1 frame/3 s. Video is displayed at 10 frames/s. Bar: 18 µm.
Download links
A two-part list of links to download the article, or parts of the article, in various formats.
Downloads (link to download the article as PDF)
Open citations (links to open the citations from this article in various online reference manager services)
Cite this article (links to download the citations from this article in formats compatible with various reference manager tools)
Caveolae internalization repairs wounded cells and muscle fibers
eLife 2:e00926.
https://doi.org/10.7554/eLife.00926


