BRAF inhibitors suppress apoptosis through off-target inhibition of JNK signaling
- University of Texas MD Anderson Cancer Center, United States
- University of Texas, United States
- Max F Perutz Laboratories, Austria
- Feinstein Institute for Medical Research, United States
Figures
Figure 1 with 3 supplements
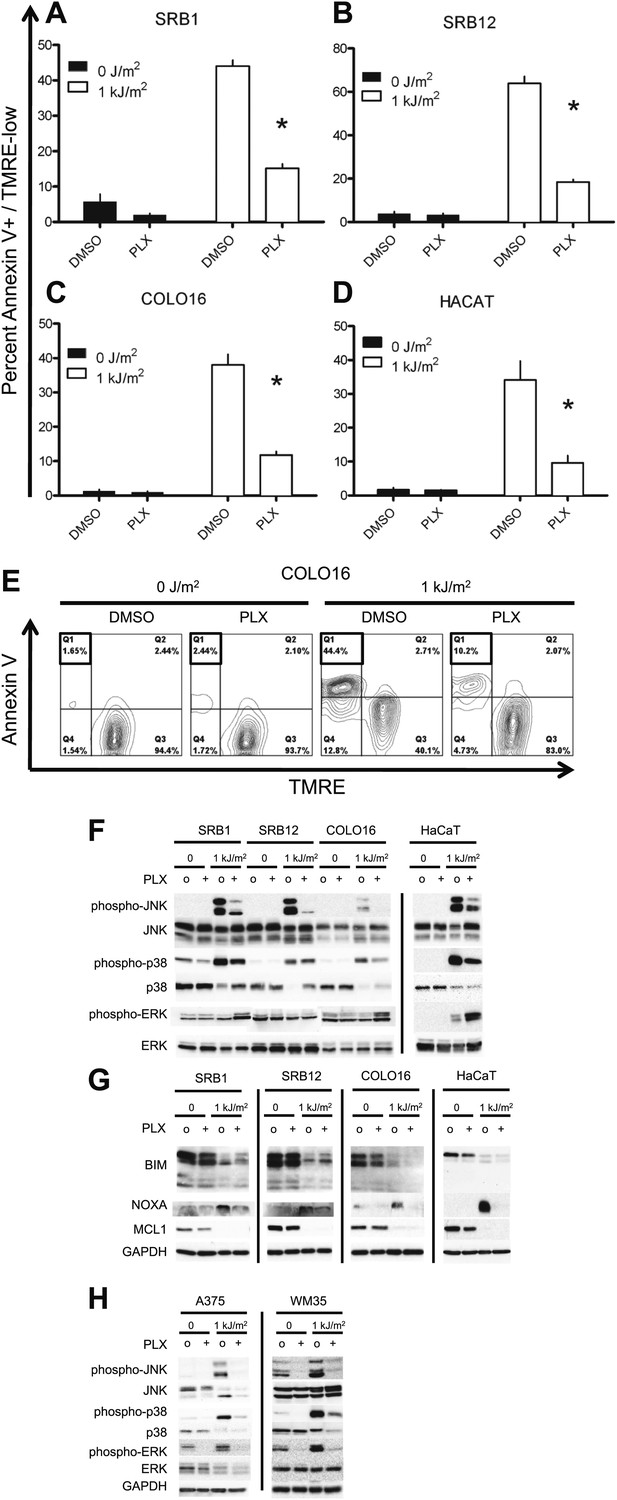
PLX4720 suppresses UV-induced apoptosis.
The cSCC and HaCaT cell lines were either unirradiated or irradiated with 1 kJ/m2 of UVB in the absence (‘o’, 1:2000 DMSO) or presence (‘+’) of 1 μM PLX4720 and isolated for FACS analysis and protein extracts 24 hr later. (A) SRB1, (B) SRB12, (C) COLO16, and (D) HaCaT cells show at least 70% suppression of apoptosis in the presence of PLX4720 as measured by FACS for Annexin V+, TMRE-low cells (n = 6 for each cell line, ‘*’ denotes statistical significance at p<0.05). (E) A representative FACS plot for COLO16 is shown. Annexin V+, TMRE-low cells are contained in the upper left quadrant (boxed), which was significantly populated in UV-irradiated cells, but not in the absence of UV, or in the presence of PLX4720. (F) Western blots probed for the MAP kinases demonstrated strong phospho-JNK and phospho-p38 induction following irradiation and significant suppression by PLX4720. Phospho-ERK was slightly induced following irradiation, and at 24 hr, paradoxical hyperactivation in the presence of PLX4720 was observed, particularly in SRB1 and HaCaT cells. (G) Western blots showed that BIM was not upregulated in these BRAF-wild-type cells, consistent with intact ERK signaling. MCL1 was downregulated by irradiation and not modulated by PLX4720, whereas NOXA expression was strongly induced in irradiated cells and suppressed by PLX4720. (H) Western blots of BRAFV600E melanoma cell lines, A375 and WM35, demonstrated suppression of UV-mediated induction of phospho-JNK and phospho-p38 by PLX4720 at 24 hr. As expected, phospho-ERK is shut down in PLX4720-treated cells.
Figure 1—figure supplement 1
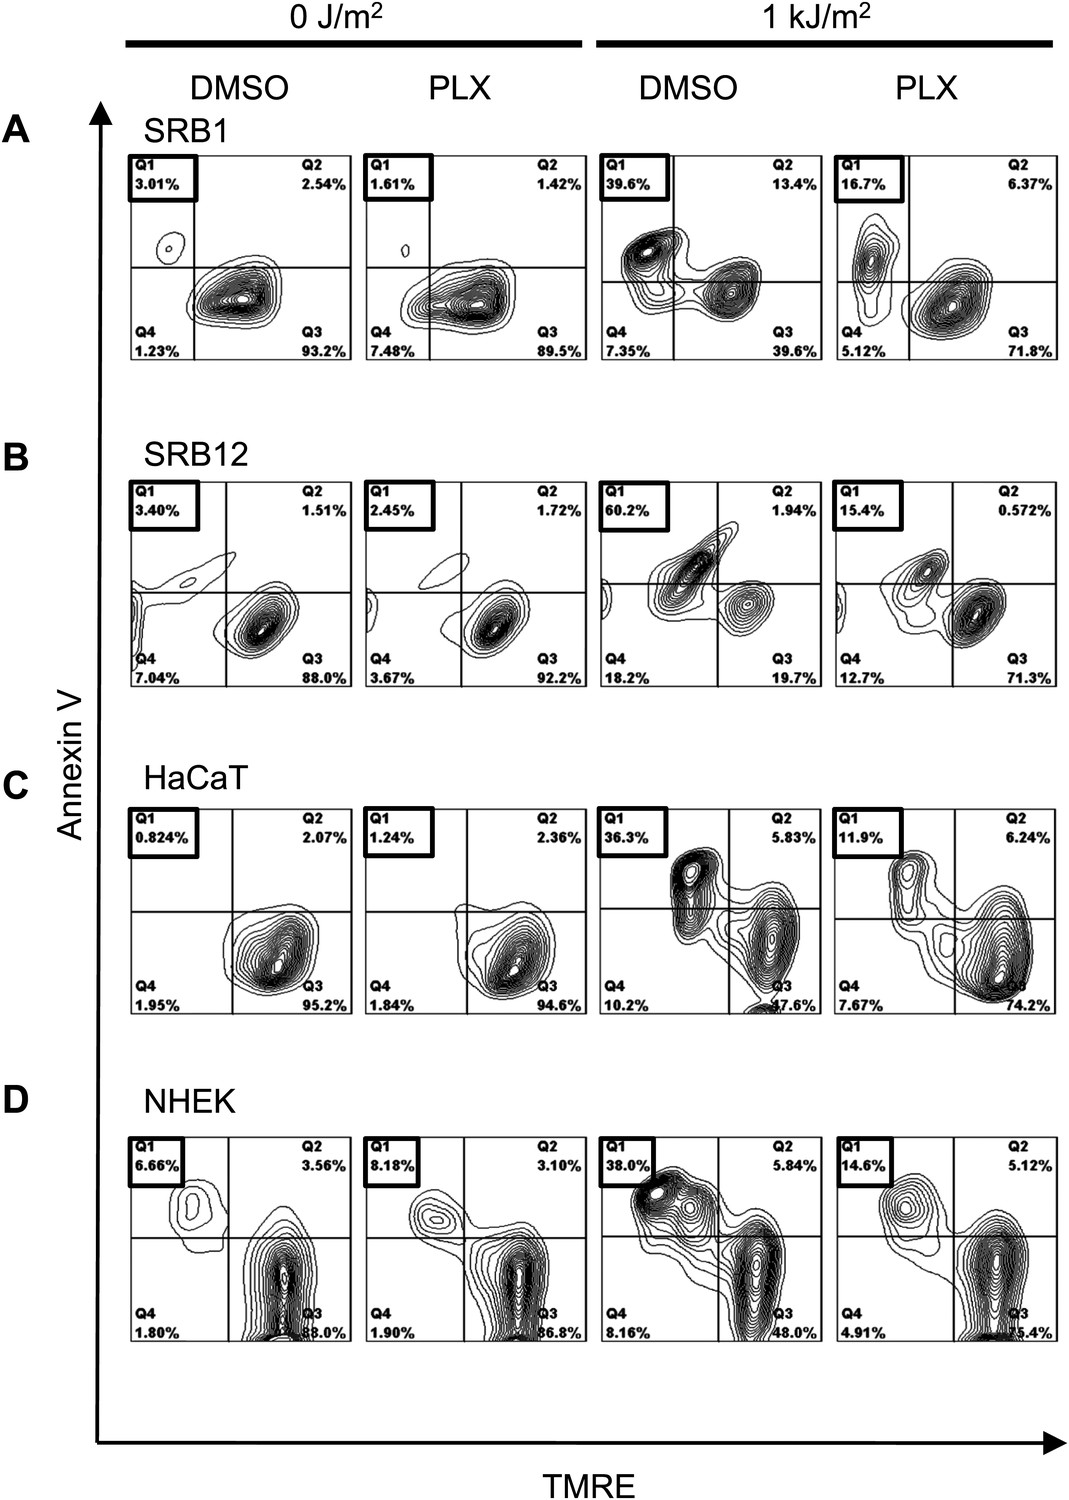
PLX4720 potently suppresses apoptosis in cSCC, HaCaT cell lines, and NHEK cells.
Representative FACS plots of Annexin V vs TMRE in SRB1 (A), SRB12 (B), HaCaT (C), and NHEK (D) cells demonstrated low levels of apoptosis (Annexin V+, TMRE-low in quadrant 1) in unirradiated cells in the presence and absence of 1 μM PLX4720. Significant levels of apoptosis were seen in all control-treated irradiated cells, which were significantly suppressed in the presence of PLX4720, by at least 70% in all cells tested.
Figure 1—figure supplement 2
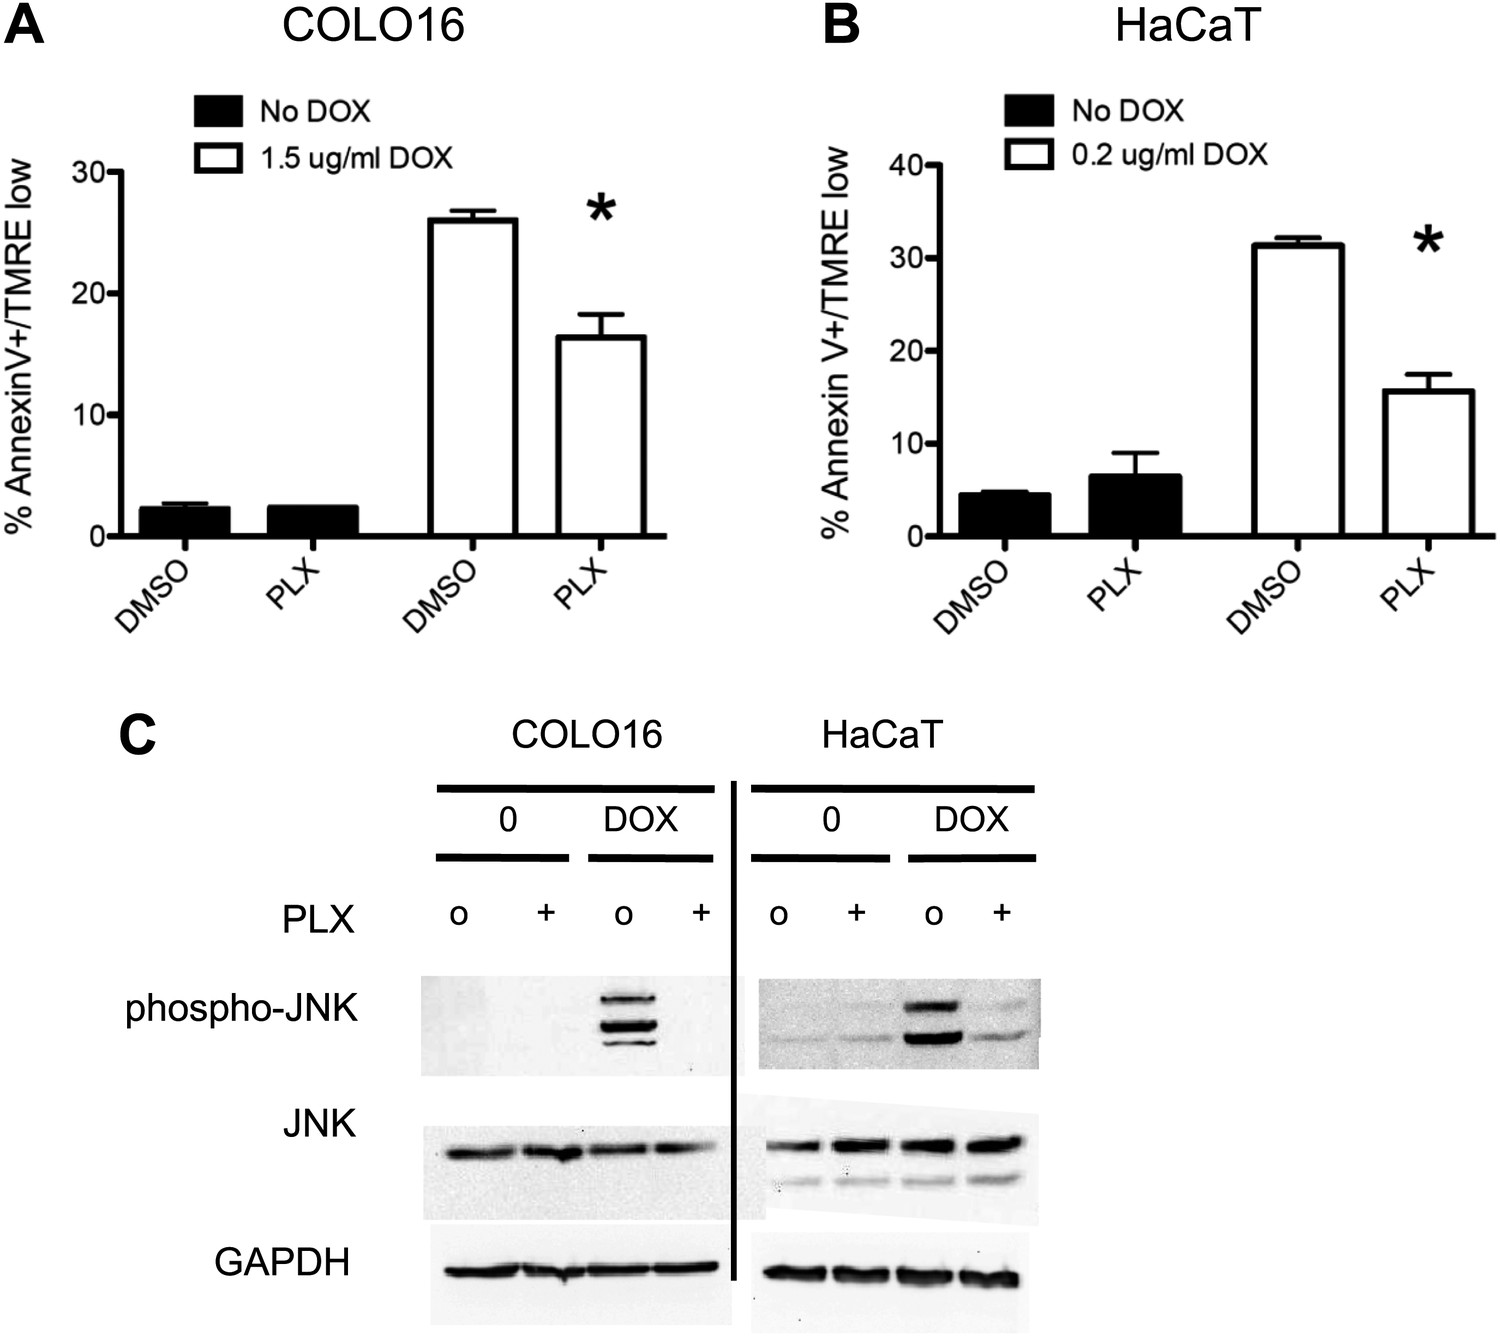
PLX4720 suppresses doxorubicin-induced JNK activation and apoptosis in cSCC and HaCaT cell lines.
COLO16 and HaCaT cell lines were either treated with doxorubicin or PBS and lysed 24 hr later in the absence (‘o’, 1:2000 DMSO) or presence (“+”) of 1 μM PLX4720. (A) COLO16 and (B) HaCaT cells showed significant decrease in apoptosis measured by FACS for Annexin V+, TMRE-low cells (n = 3 for each cell line, ‘*’ denotes statistical significance at p<0.05). (C) Western blots were probed for phospho-JNK and total JNK, showing a potent activation of JNK by doxorubicin that is significantly suppressed by PLX4720.
Figure 1—figure supplement 3
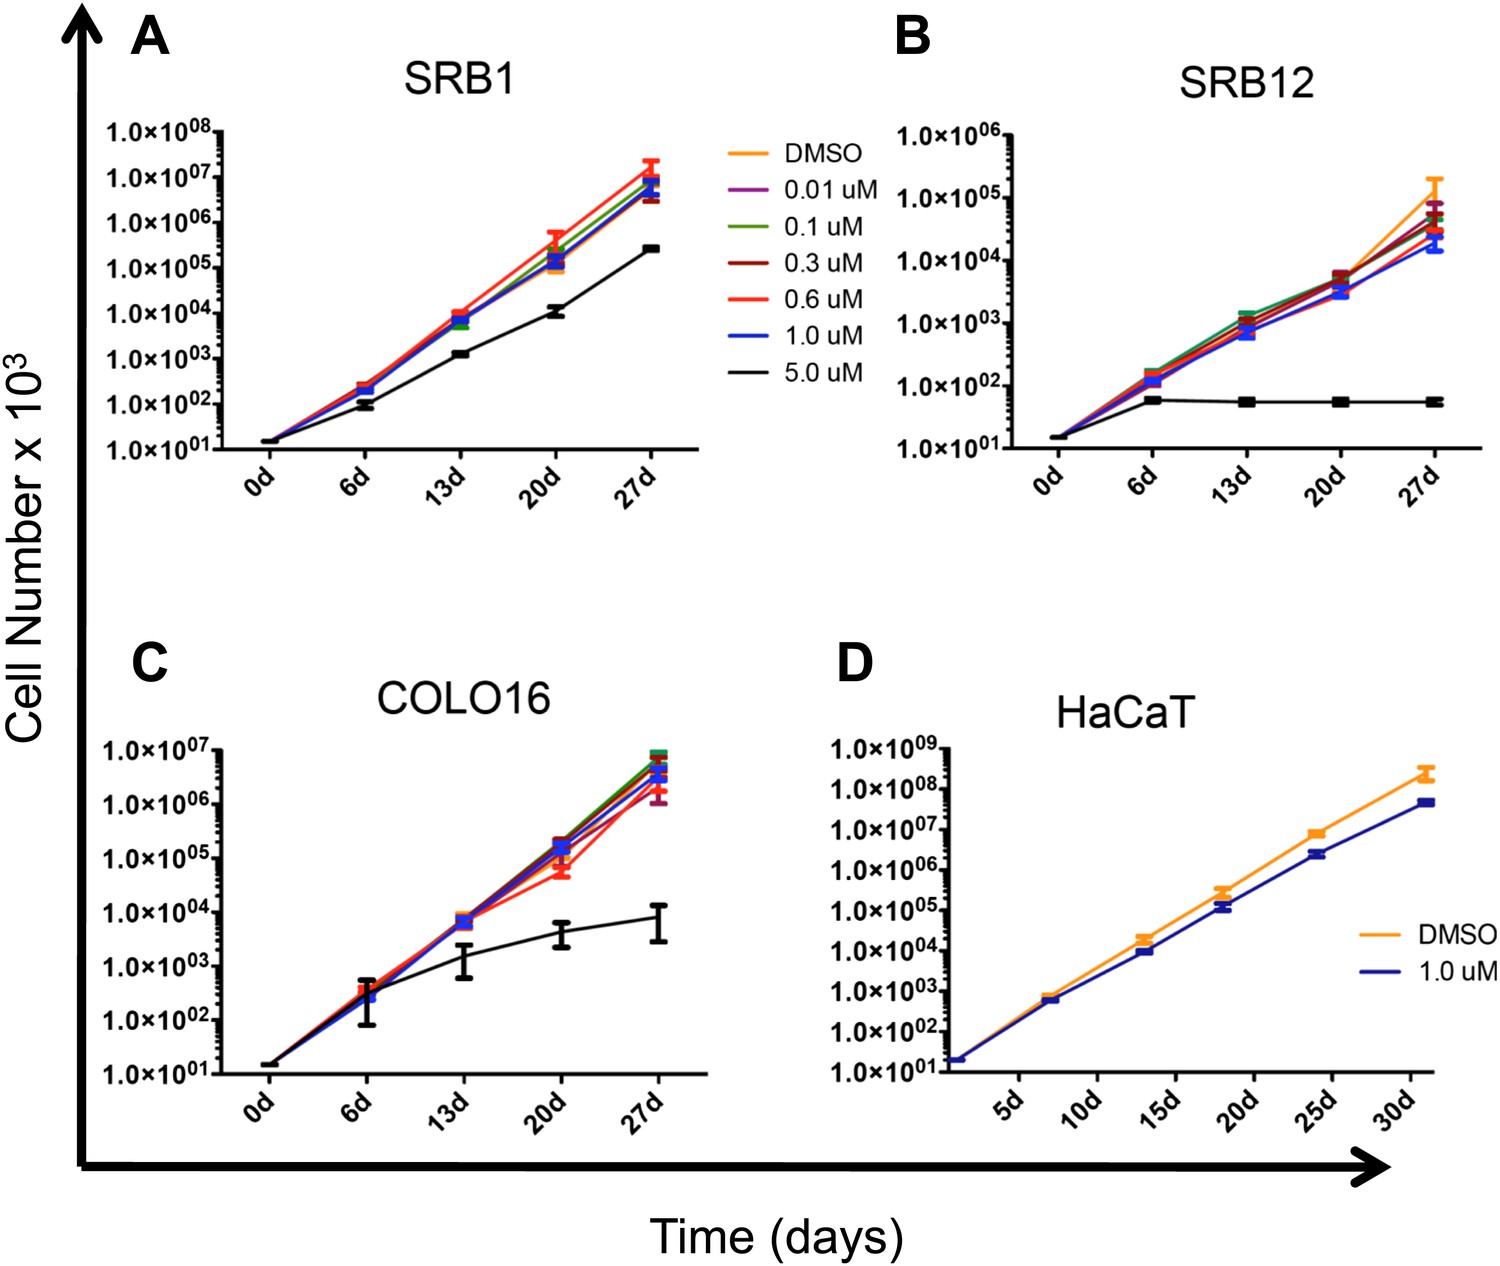
PLX4720 does not confer a proliferative advantage to cSCC and HaCaT cell lines.
(A) SRB1, (B) SRB12, (C) COLO16, and (D) HaCaT cells were treated with DMSO (1:2000) or the indicated concentrations of PLX4720 for at least 28 days during which cells were serially passaged and counted. Over that time frame there was a slight decrement in the proliferation of SRB12 and HaCaT cells in the presence of 1 μM PLX4720. All cells treated at 5 μM PLX4720 exhibited decreased proliferation.
Figure 2 with 2 supplements
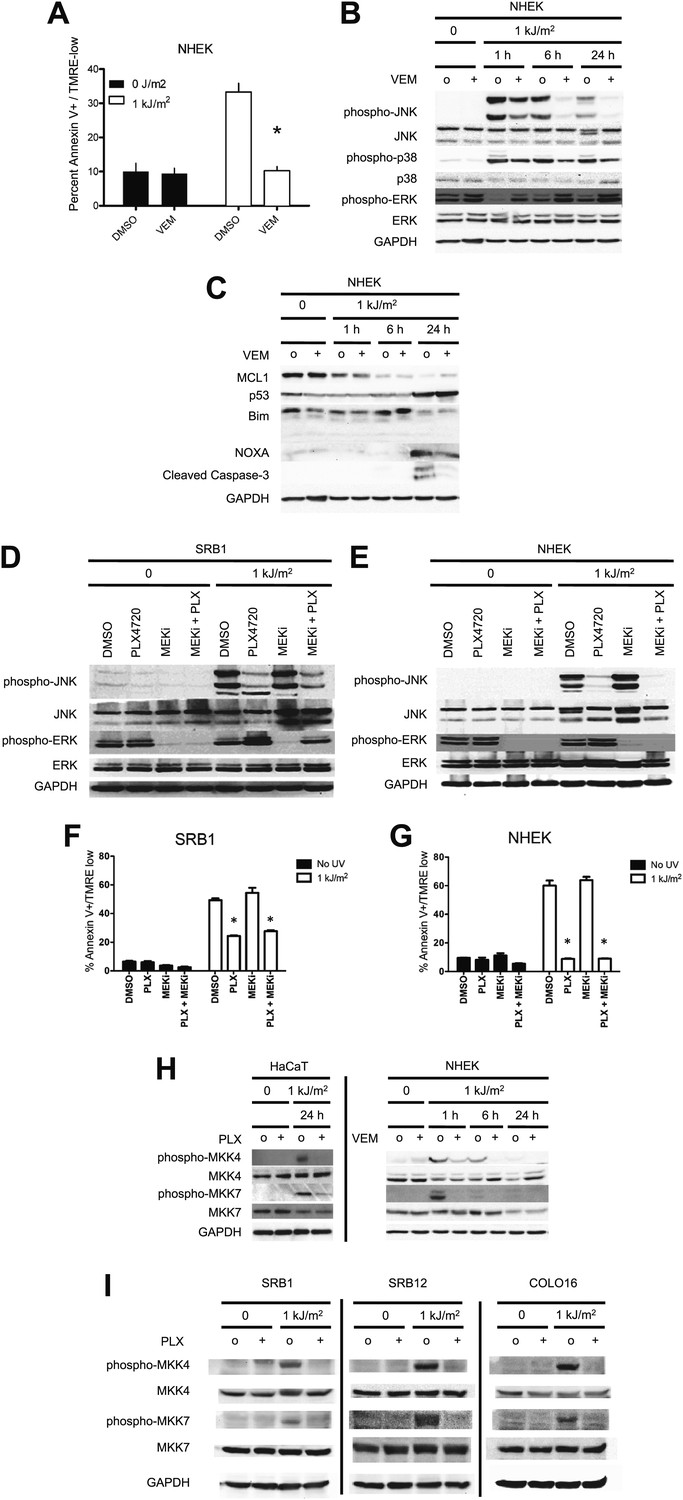
Vemurafenib and PLX4720 suppress apoptosis and JNK signaling in primary human keratinocytes and cSCC cells independently of MEK/ERK signaling.
Normal human epidermal keratinocytes (NHEKs) were irradiated with 1 kJ/m2 of UVB in the absence (‘o’, 1:2000 DMSO) or presence (‘+’) of 1 μM vemurafenib and isolated for FACS analysis and protein extracts 24 hr later. (A) Apoptosis was significantly suppressed (70%) in the presence of vemurafenib as measured by FACS for Annexin V+, TMRE-low cells (n = 6, ‘*’ denotes statistical significance at p<0.05). (B) Western blot analysis showed induction of phospho-JNK and phospho-p38 within 1 hr following irradiation, which persisted for at least 24 hr and which was suppressed by vemurafenib at all time points. (C) MCL1 and BIM expression was not significantly modulated by vemurafenib; however, NOXA induction, which occurred at 24 hr, was reduced by vemurafenib. In these primary cells, p53 protein was stabilized by 24 hr and vemurafenib did not affect overall levels. Suppression of apoptosis, as measured by cleaved caspase-3 levels, was observed in the presence of vemurafenib-treated irradiated cells, consistent with the FACS results. To test the relevance of MEK signaling, cSCC (SRB1) and NHEK cells were irradiated with 1 kJ/m2 of UVB in the absence (‘o’, 1:2000 DMSO) or presence of 1 μM PLX4720 singly or in combination with 0.6 μM (NHEK) or 1.2 μM (SRB1) AZD6244 (MEKi) and isolated for FACS analysis and protein extracts 24 hr later. (D) SRB1 and (E) NHEK cells showed induction of phospho-JNK at 24 hr following irradiation, by Western in the presence (lane 7) and absence (lane 5) of MEKi. The addition of MEKi to PLX4720 did not affect the suppression of JNK activation (compare lanes 6, 8) despite potent suppression of phospho-ERK. (F) SRB1 and (G) NHEK cells exhibited a strong suppression of UV-induced apoptosis by PLX4720 (Annexin V+, TMRE-low cells; n = 6, ‘*’ denotes statistical significance at p<0.05) that was likewise unaffected by the addition of MEKi. To test whether upstream kinases in the JNK pathway were inhibited, MKK4 and MKK7 activation was probed in cells. (H) Both phospho-MKK4 and phospho-MKK7 were induced in HaCaT and NHEK cells following irradiation, and this was suppressed in the presence of 1 μM PLX4720 and vemurafenib, respectively. (I) In all cSCC cell lines, SRB1, SRB12, COLO16, phospho-MKK4 and phospho-MKK7 are strongly induced following irradiation, and this is suppressed in all lines by 1 μM PLX4720.
Figure 2—figure supplement 1
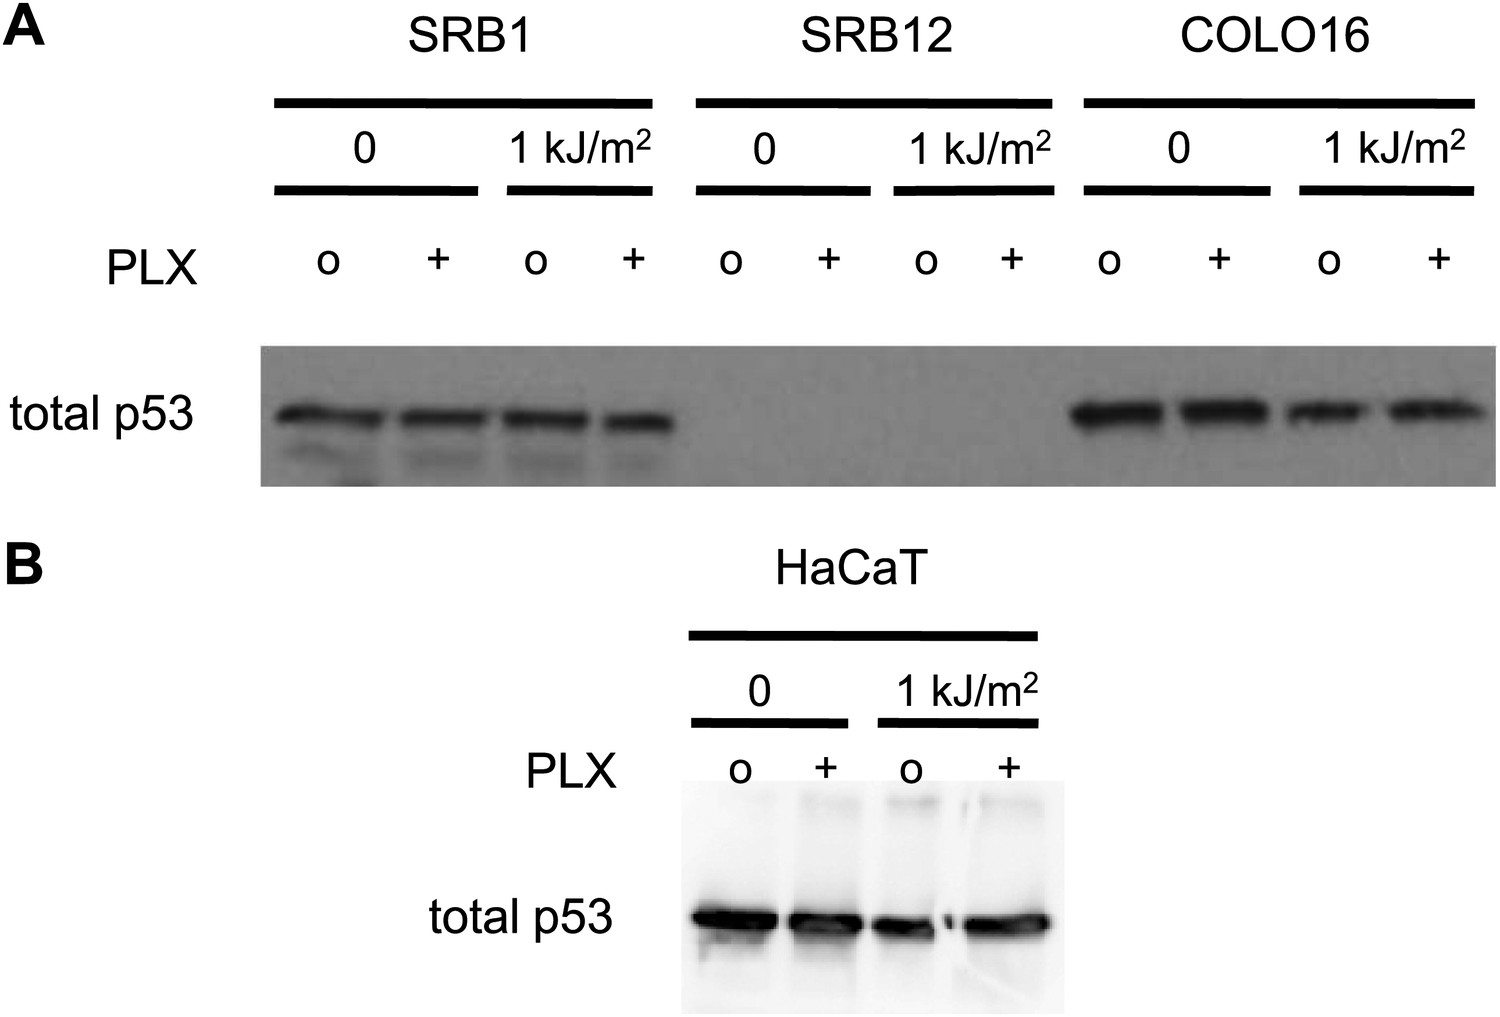
p53 does not respond to stress in cSCC and HaCaT cell lines.
cSCC cell lines SRB1, SRB12, and COLO16 were either unirradiated or irradiated with 1 kJ/m2 of UVB in the absence (‘o’, 1:2000 DMSO) or presence (‘+’) of 1 μM PLX4720 and isolated for protein extracts 24 hr later. (A) Western blots of total p53 reveal that none of the cell lines upregulate p53 in response to UV irradiation. SRB12 cells do not express p53. (B) HaCaT cells are known to be mutant for p53 and the presence of p53 in unstressed cells, combined with the failure to upregulate levels following UV radiation, is a hallmark of functionally inactive p53 in cell lines. Loading controls are the same as those in Figure 1F.
Figure 2—figure supplement 2
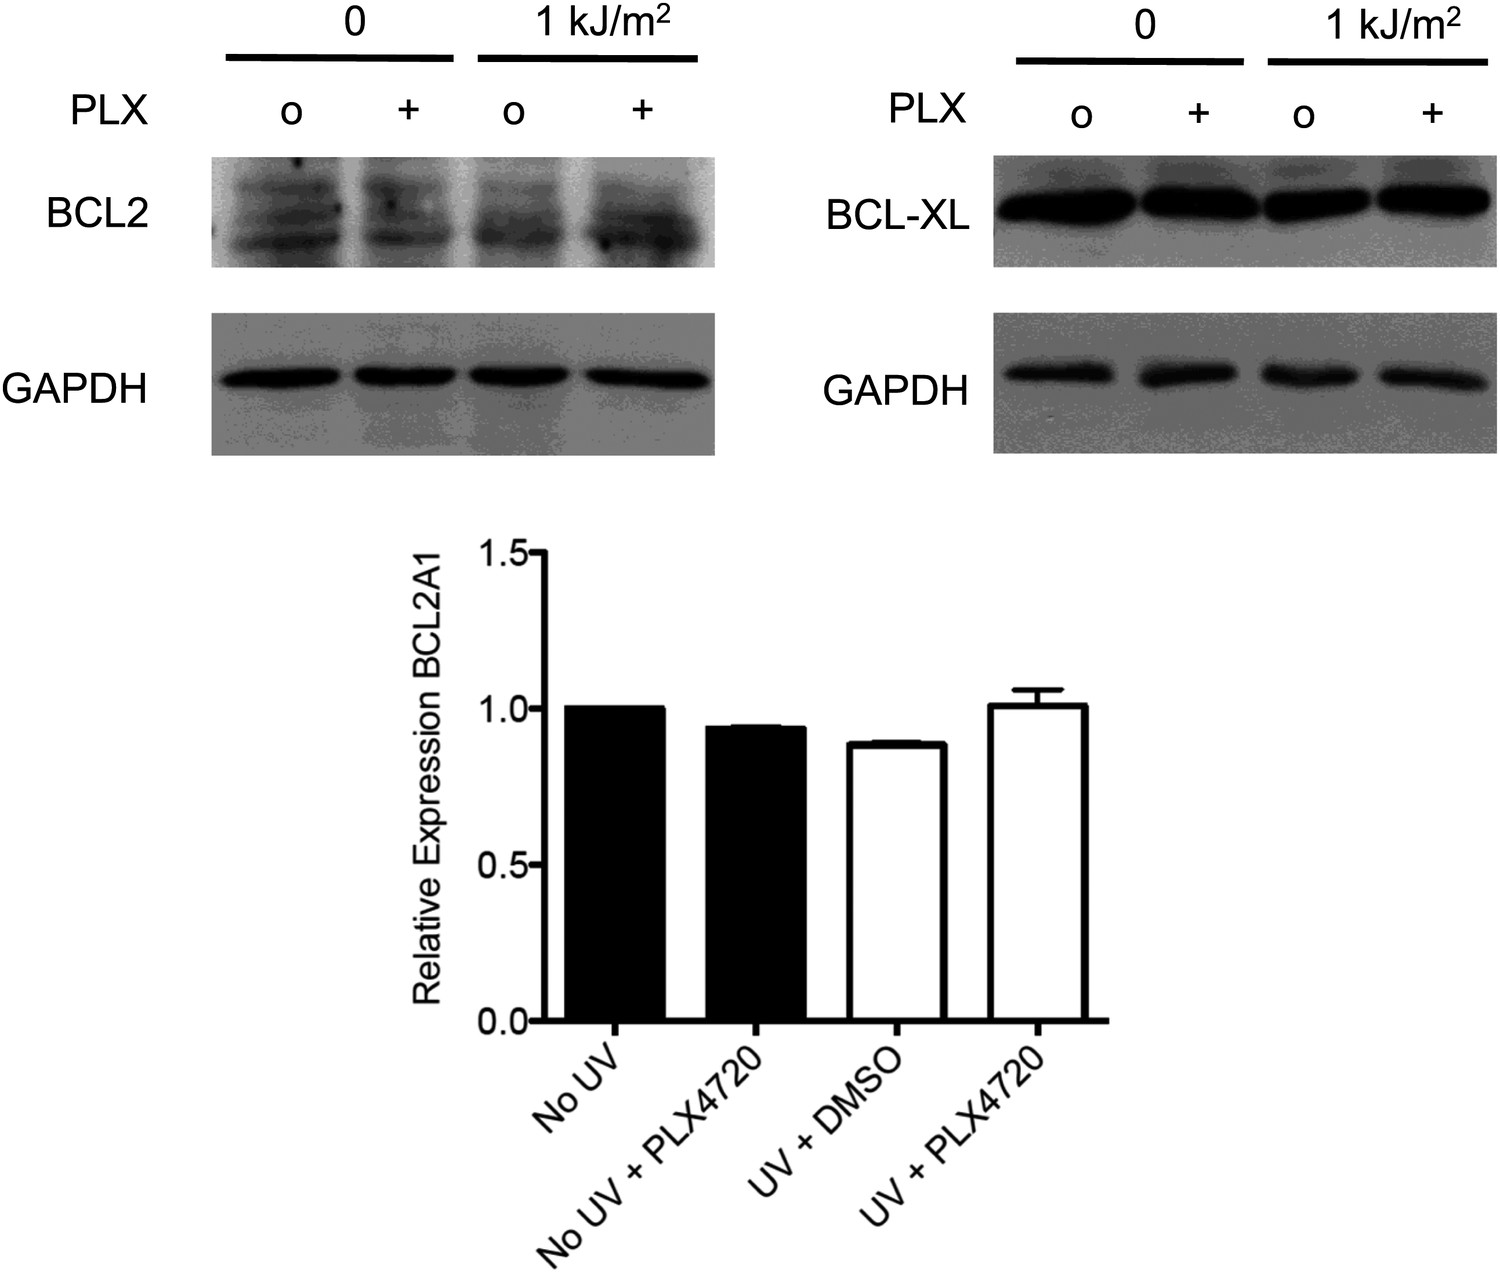
BCL2 family members BCL2, BCL-XL, and BCL2A1 are not modulated by acute UV exposure or PLX4720.
HaCaT cells were either unirradiated or irradiated with 1 kJ/m2 of UVB in the absence (‘o’, 1:2000 DMSO) or presence (‘+’) of 1 μM PLX4720 and isolated for protein extracts 24 hr later. Western blots for BCL2 (2875P, Cell Signaling) and BCL-XL (2764P/clone 54H6, Cell Signaling) expression show that expression of neither is changed by acute UV exposure and or by PLX4720. c, qRT-PCR for BCL2A1 mRNA expression, referenced to GAPDH (Taqman) shows that BCL2A1 expression is likewise unchanged by acute UV exposure or by PLX4720.
Figure 3 with 4 supplements
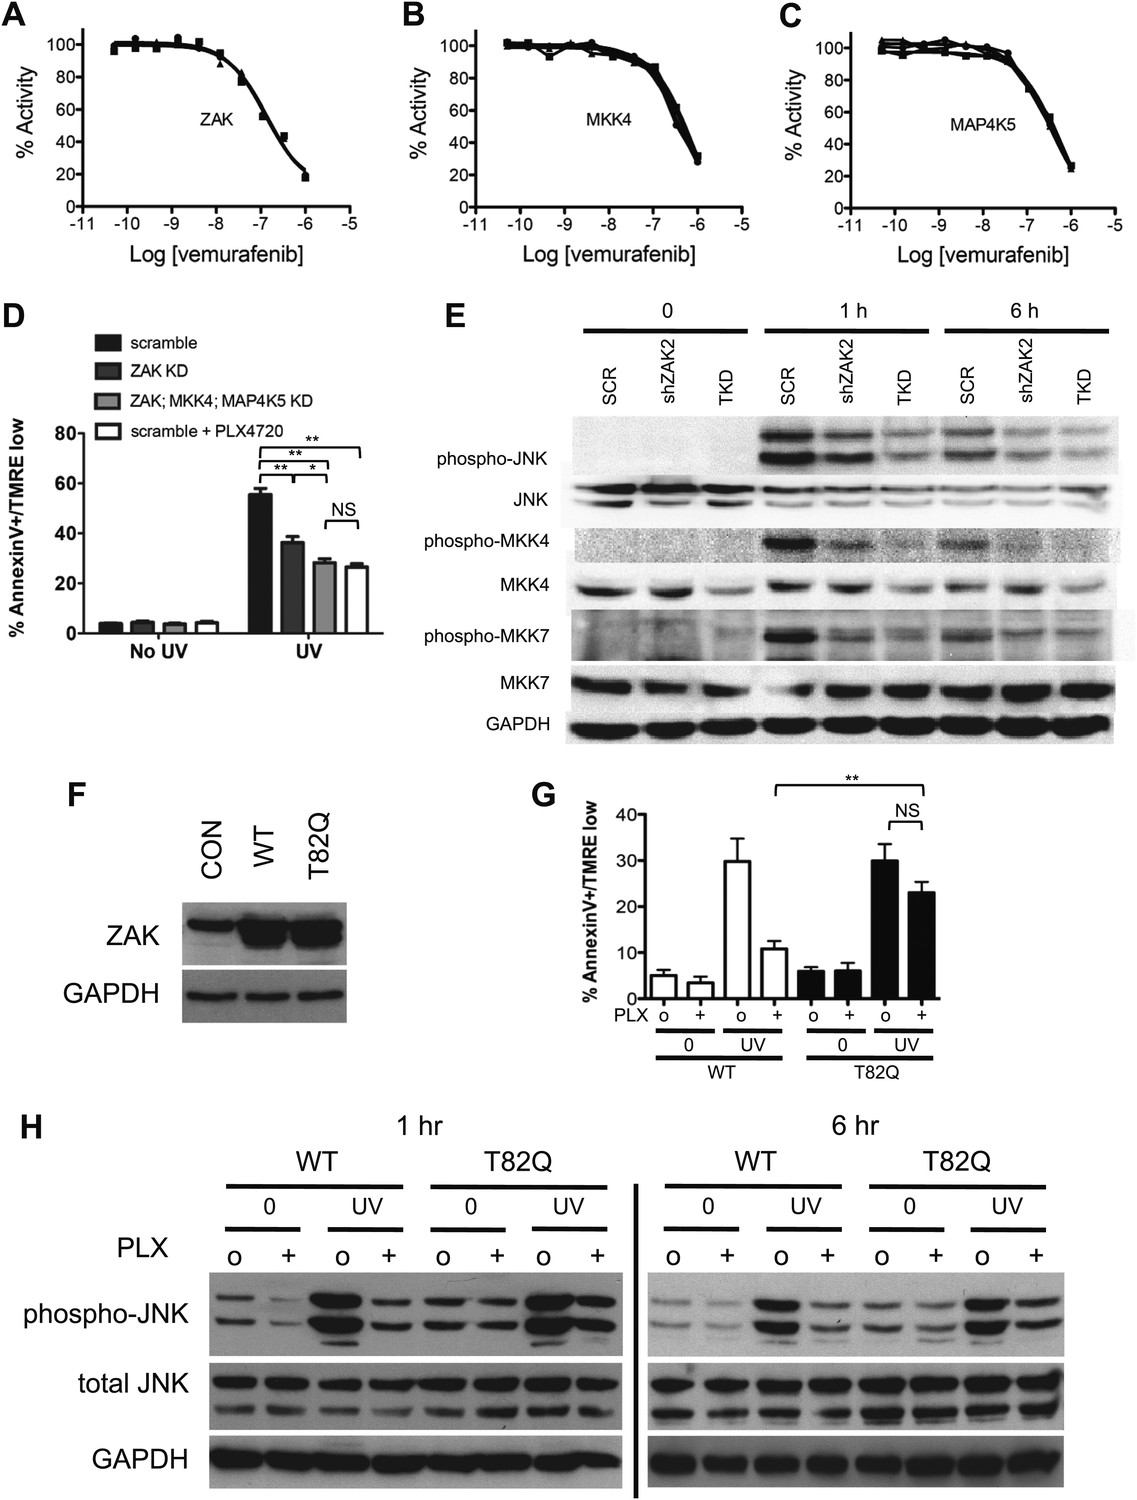
PLX4720 and vemurafenib suppress apoptosis and JNK signaling through inhibition of off-target kinases.
(A–C) In-vitro kinase assays for ZAK, MKK4, and MAP4K5 were performed across a 10-point concentration range from 0.05 to 1000 nM in triplicate, revealing significant inhibition of kinase activity within the nM range for vemurafenib. (D) Lentiviral shRNA knockdown of ZAK singly or in combination with MKK4 and MAP4K5 (triple knockdown, ‘TKD’) was performed revealing potent suppression of apoptosis as measured by FACS for Annexin V+, TMRE-low cells (n = 5, ‘*’ denotes statistical significance at p<0.05, ‘**’ at p<0.01, ‘NS’ is not significant) at 24 hr following single dose UVB irradiation at 720 J/m2. ZAK knockdown and triple knockdown cells exhibit 70% and 94% suppression of apoptosis, respectively, relative to PLX4720-treated cells expressing a non-suppressing shRNA control (scramble, ‘SCR’). (E) Western blots of lysates obtained at 1 and 6 hr post-UV irradiation show potent induction of phospho-MKK4, phospho-MKK7, and phospho-JNK which are all suppressed with progressively increasing effect in ZAK single knockdown (‘shZAK2’) and triple knockdown (‘TKD’) HaCaT cells. (F) Western blots of HaCaT cells electroporated with pcDNA3-wild-type (WT) ZAK and the gatekeeper mutant pcDNA3-(T82Q) ZAK show equivalent expression. (G) HaCaT cells overexpressing ZAK (WT) and ZAK (T82Q) were irradiated with a single dose of UVB irradiation at 720 J/m2 in the absence (‘o’) and presence (‘+’) of 1 μM PLX4720 and apoptosis measured by FACS for Annexin V+, TMRE-low cells (n = 4, ‘**’ at p<0.01, ‘NS’ is not significant) at 24 hr. ZAK (WT) cells are sensitive to PLX4720-mediated suppression of apoptosis (bar 3 vs 4), but drug-treated ZAK (T82Q)-expressing cells undergo significantly more apoptosis than drug-treated ZAK (WT) cells (bar 4 vs 8), with bypass of PLX4720-induced suppression as compared to drug-treated ZAK (WT) cells (paired t-test, p=0.005). (H) Western blots of ZAK (WT) and ZAK (T82Q)-expressing HaCaT cells at 1 hr and 6 hr post-irradiation show that phospho-JNK activation is intact in both cell lines in the absence of drug (lanes 3, 7), but that drug-treated ZAK (T82Q)-expressing HaCaT cells have significantly more phospho-JNK activation at both 1 and 6 hr post-irradiation, as compared to drug-treated ZAK (WT)-expressing cells (lane 4 vs 8).
Figure 3—figure supplement 1
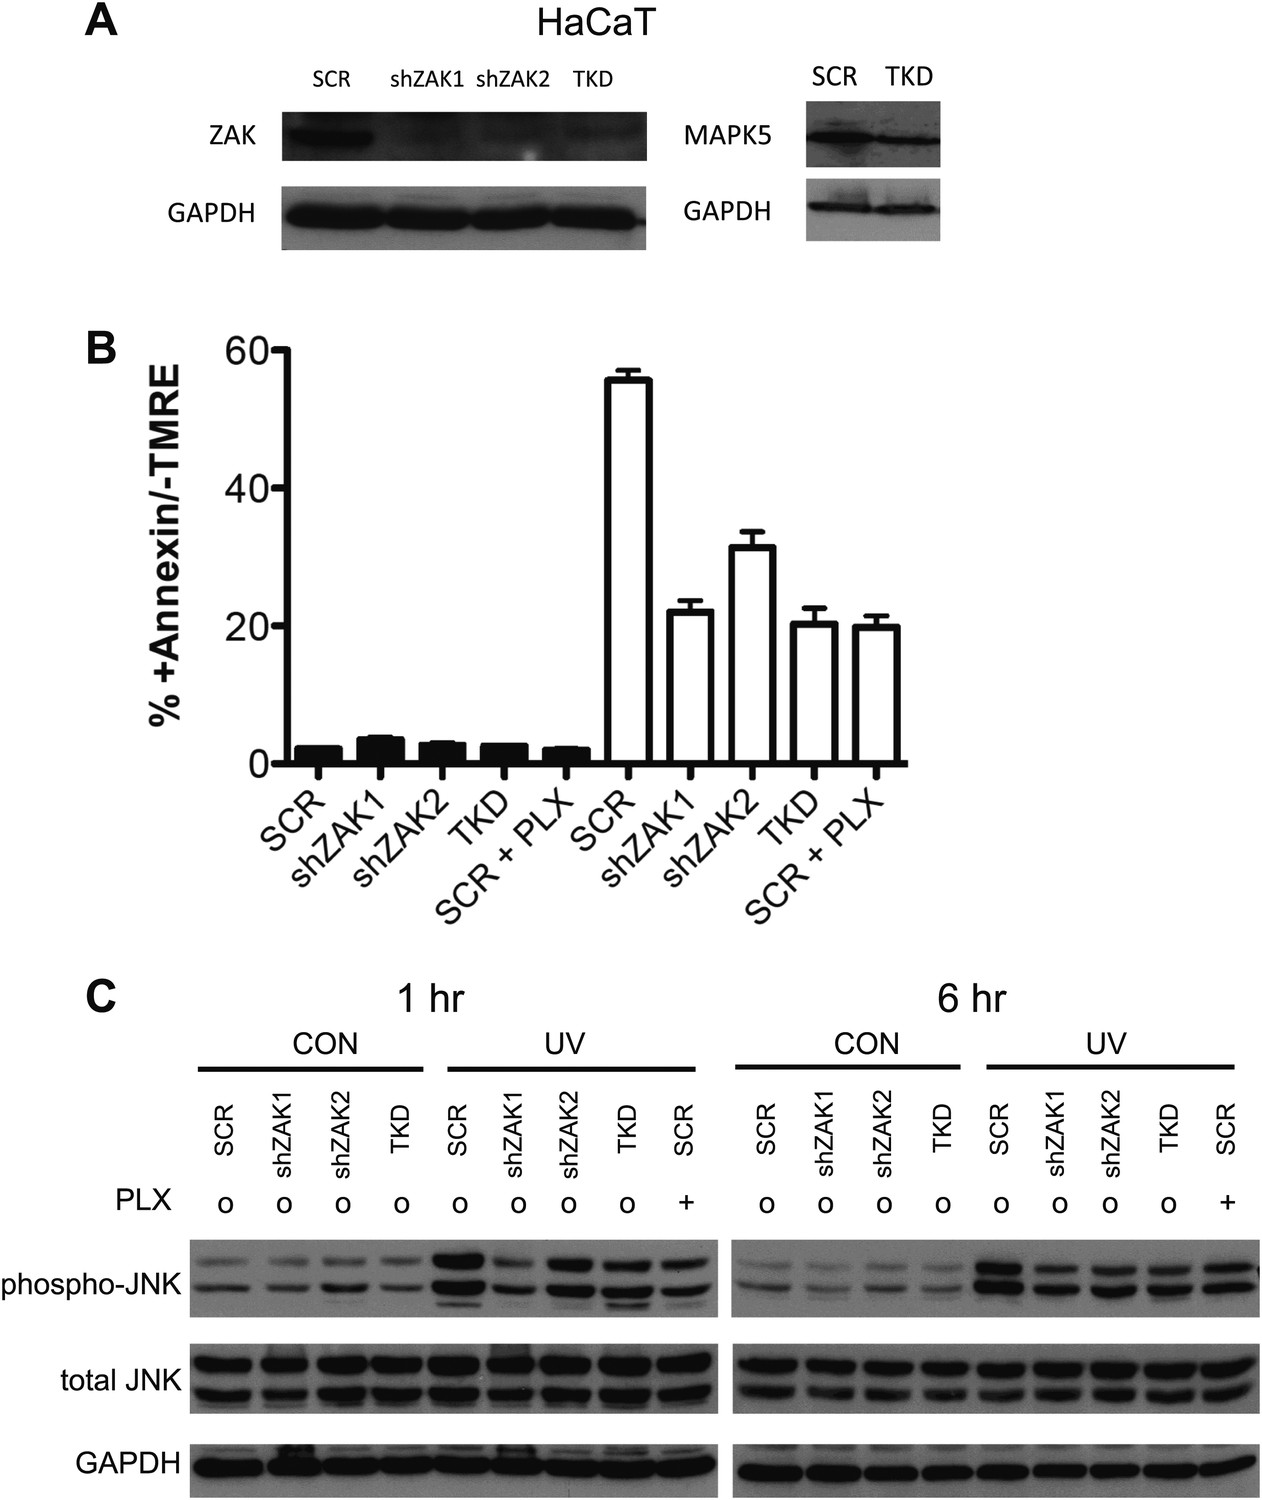
Knockdown of ZAK potently inhibits JNK activation and UV-induced apoptosis.
(A) Western blot of HaCaT cells expressing two shRNA clones and HaCaT TKD cells (containing shZAK2) all show significant knockdown of ZAK protein, though shZAK2 produces slightly less knockdown. Approximately 54.6% knockdown (ImageJ) of MAP4K5 is observed in TKD cells. (B) HaCaT cells, expressing non-silencing scramble-shRNA (‘SCR’), shZAK1, shZAK2, or TKD, were either unirradiated (black bars) or irradiated (open bars) with 1 kJ/m2 of UVB in the absence (‘o’, 1:2000 DMSO) or presence (‘+’) of 1 μM PLX4720 and analyzed by FACS for apoptosis (Annexin V+, TMRE-) at 24 hr. UV-induced apoptosis is significantly suppressed by both ZAK shRNA clones in HaCaT cells and in TKD cells. The shZAK2 clone, which results in less knockdown than shZAK1, produces correspondingly less suppression of UV-induced apoptosis (93.7% for shZAK1 vs 67.8% for shZAK2). shZAK1-expressing HaCaT cells, TKD cells, and PLX4720-treated HaCaT scrambled-shRNA-expressing cells show similar degrees of suppression, again consistent with the fact that ZAK can account for the majority of the effect of BRAFi-induced suppression of JNK signaling. (C) HaCaT cells, treated as above, were processed for Western blots at 1 and 6 hr following UV exposure to assess JNK activation. Significant suppression of phospho-JNK is observed at 1 hr and 6 hr post-irradiation in all cell lines where ZAK is knocked down, as well as TKD cells and SCR cells treated with PLX4720. In comparing the shZAK1 and shZAK2-expressing HaCaT cells, the degree of phospho-JNK inhibition correlates exactly with the degree of knockdown of ZAK particularly at 1 hr: less phospho-JNK inhibition is observed with less ZAK knockdown.
Figure 3—figure supplement 2
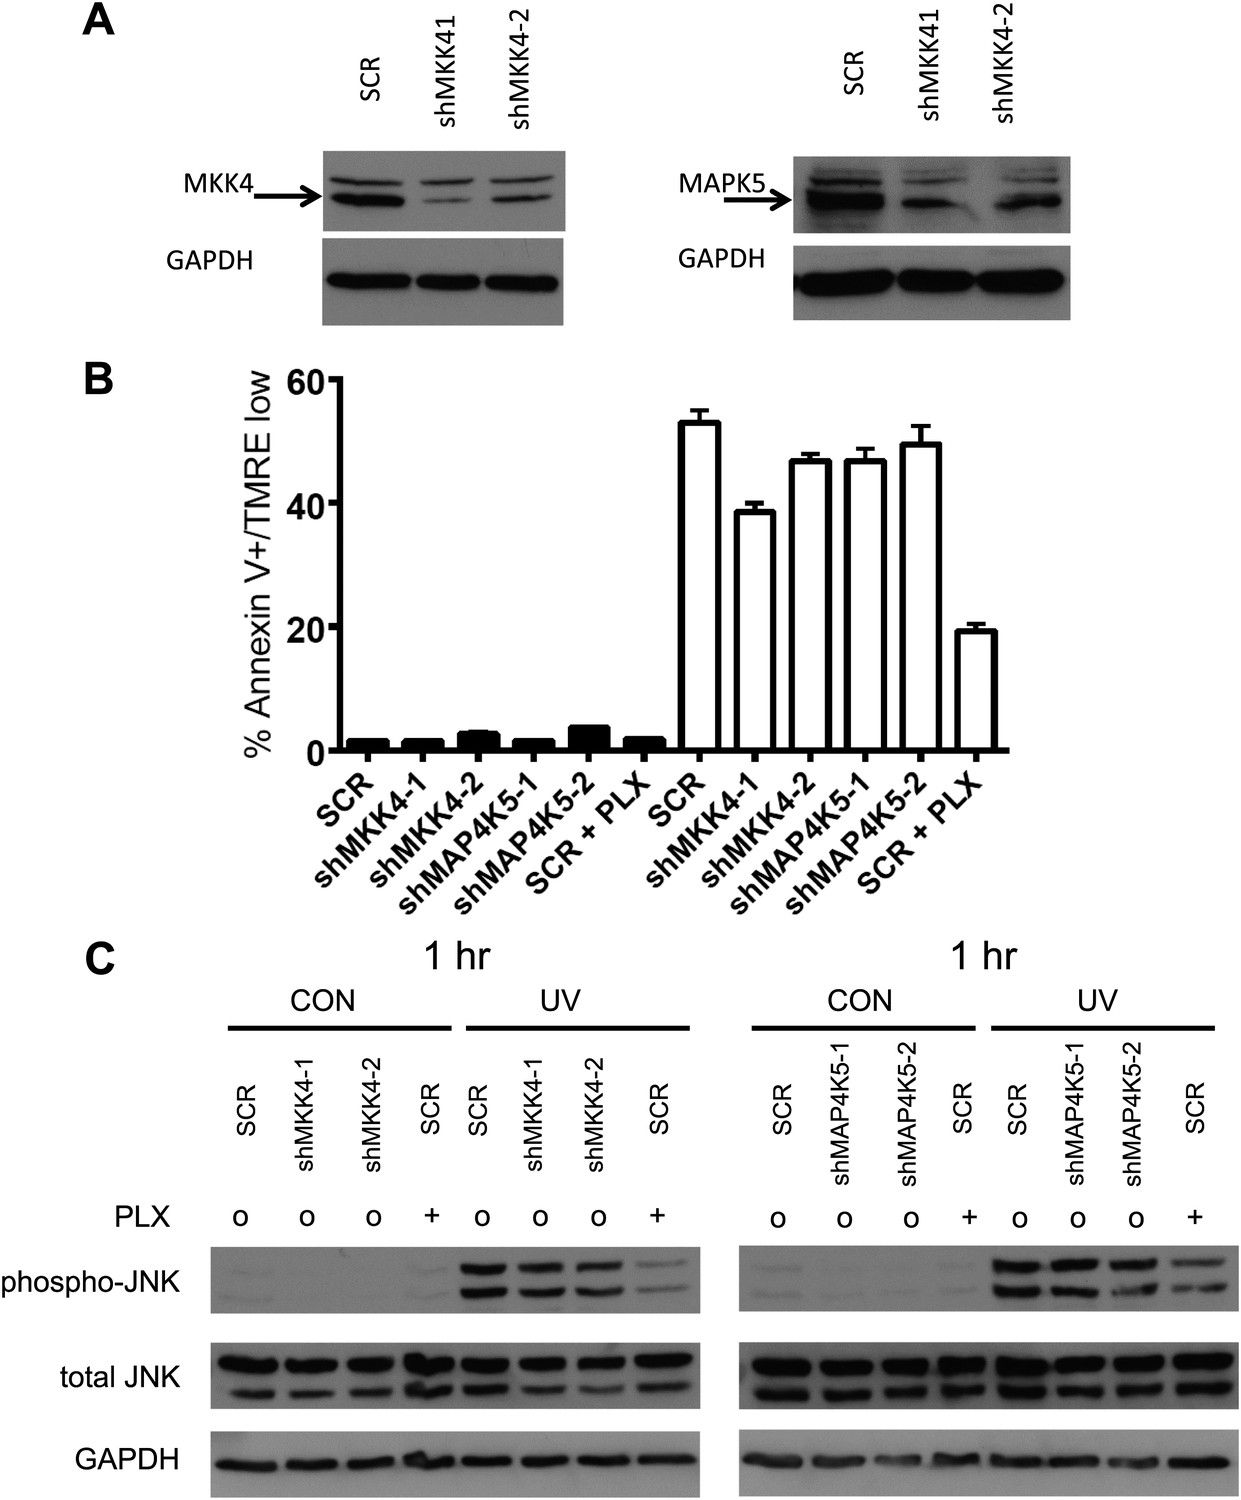
Single knockdown of MKK4 or MAP4K5 partially inhibits JNK activation and UV-induced apoptosis.
(A) Western blot of HaCaT cells expressing two shRNA clones against MKK4 and MAP4K5 show significant knockdown of targets proteins (shMKK4-1: 89.3%, shMKK4-2: 71.9%, shMAP4K5-1: 86.4%, shMAP4K5-2: 84.1%; ImageJ). (B) HaCaT cells, expressing non-silencing scramble-shRNA (‘SCR’), shMKK4-1, shMKK4-2, shMAP4K5-1, or shMAP4K5-2 were either unirradiated (black bars) or irradiated (open bars) with 720 J/m2 of UVB in the absence (‘o’, 1:2000 DMSO) or presence (‘+’) of 1 μM PLX4720 and analyzed by FACS for apoptosis (Annexin V+, TMRE-) at 24 hr. UV-induced apoptosis is suppressed most substantially by MKK4 (up to 27.3%), but not substantially by MAP4K5 (up to 11.6%) in HaCaT cells. These results are consistent with the fact that ZAK can account for the majority of the effect of BRAFi-induced suppression of JNK signaling. Importantly, since MKK4 is important for JNK activation, and ZAK activates MKK4, the partial suppression of phospho-JNK activation and apoptosis is expected. (C) HaCaT cells, treated as above, were processed for Western blots at 1 hr following UV exposure to assess JNK activation. Significant activation of phospho-JNK is still observed at 1 hr post-irradiation in all cell lines, as compared to SCR cells treated with PLX4720.
Figure 3—figure supplement 3
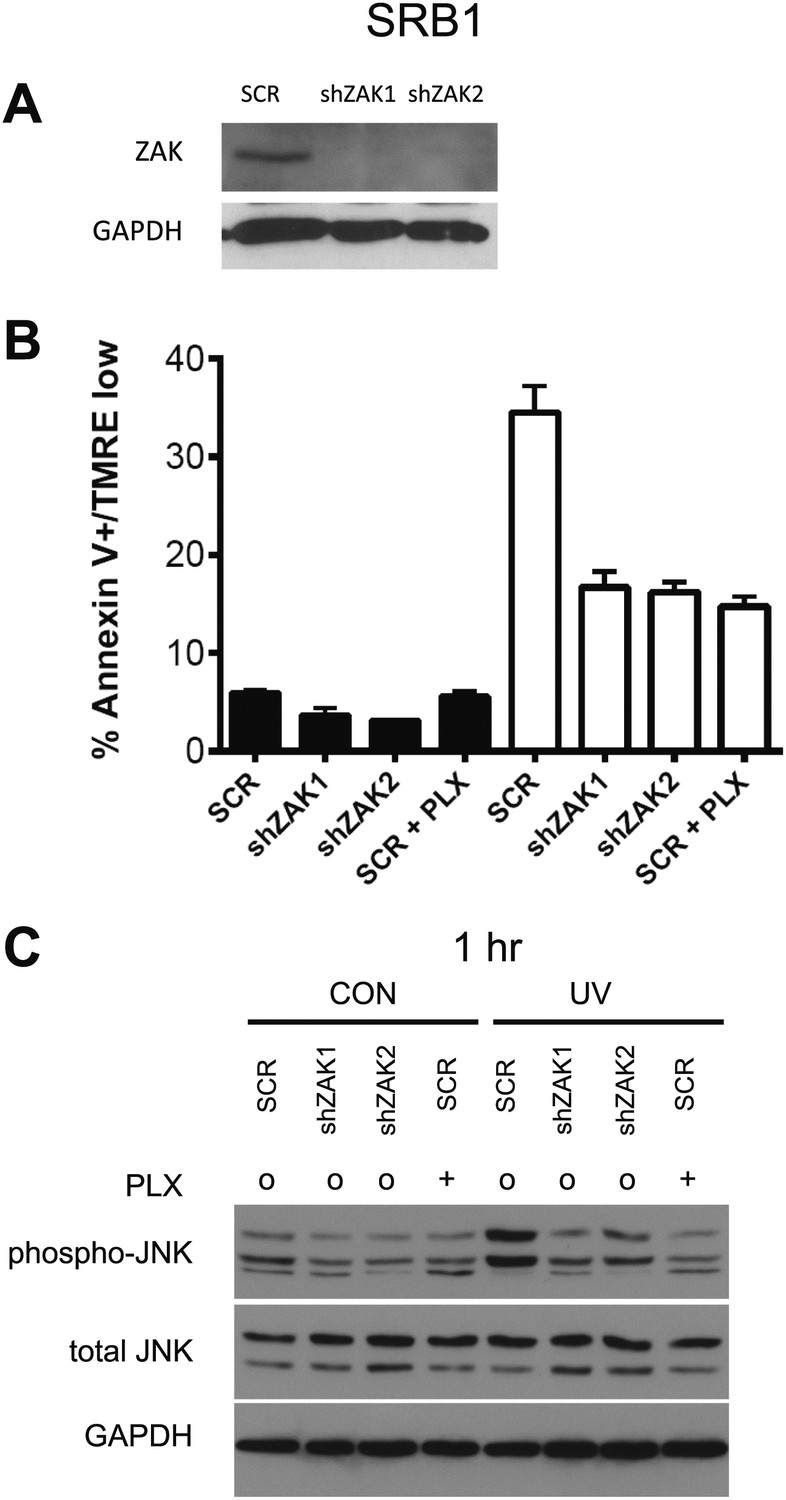
Knockdown of ZAK potently inhibits JNK activation and UV-induced apoptosis in SRB1 cells.
(A) Western blot of SRB1 cells expressing two shRNA clones (shZAK1, shZAK2) all show significant knockdown of ZAK protein. (B) SRB1 cells, expressing non-silencing scramble-shRNA (‘SCR’), shZAK1, or shZAK2, were either unirradiated (black bars) or irradiated (open bars) with 720 J/m2 of UVB in the absence (‘o’, 1:2000 DMSO) or presence (‘+’) of 1 μM PLX4720 and analyzed by FACS for apoptosis (Annexin V+, TMRE-) at 24 hr. UV-induced apoptosis is significantly suppressed by both ZAK shRNA clones in SRB1 cells. shZAK1/2-expressing SRB1 cells and PLX4720-treated SRB1 scrambled-shRNA-expressing cells show similar degrees of suppression (90%, 92.5% of drug-treated cells), again consistent with the fact that ZAK can account for the majority of the effect of BRAFi-induced suppression of JNK-dependent apoptosis. (C) SRB1 cells, treated as above, were processed for Western blots at 1 hr following UV exposure to assess JNK activation. Significant suppression of phospho-JNK is observed at 1 hr post-irradiation in all cell lines where ZAK is knocked down, as well as in SCR cells treated with PLX4720.
Figure 3—figure supplement 4
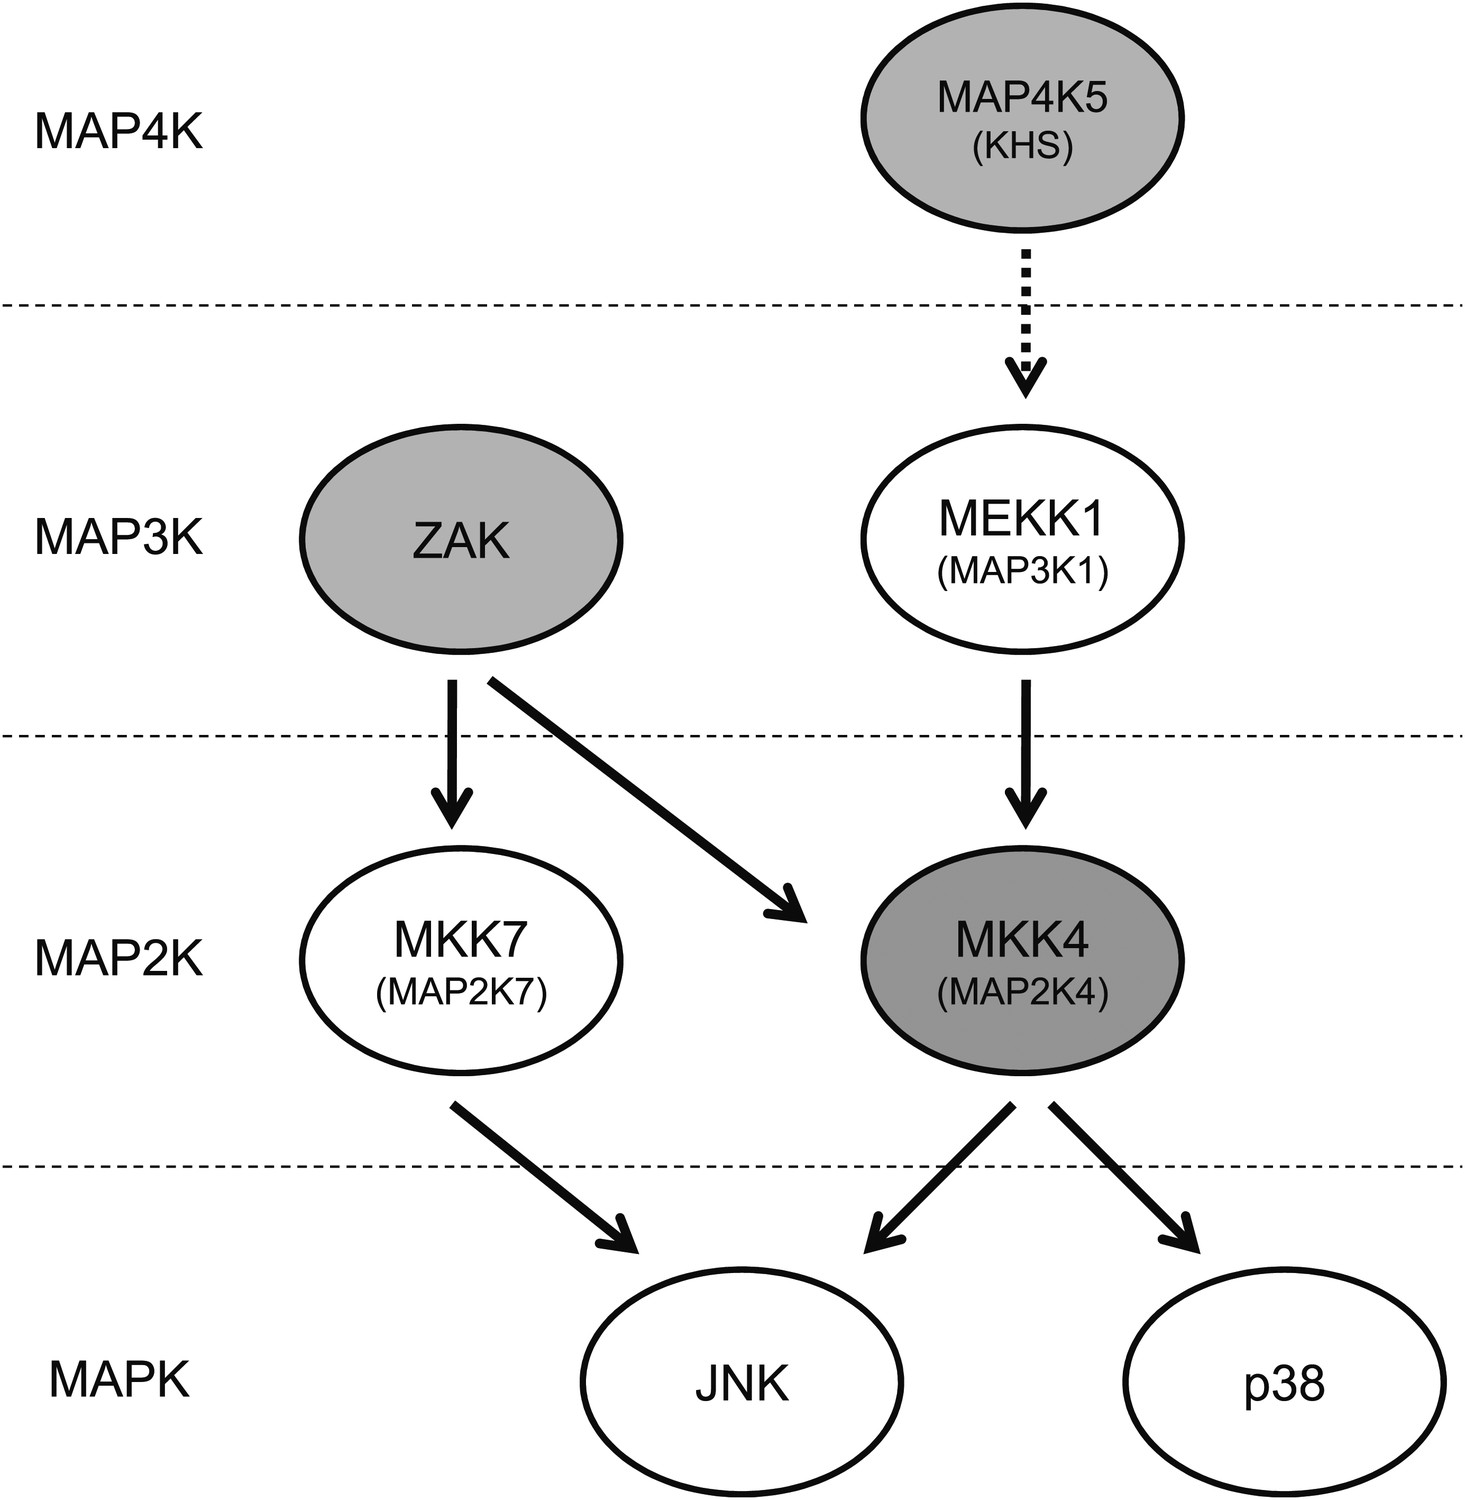
Vemurafenib and PLX4720 inhibit multiple kinases upstream of JNK and p38.
The schematic shows MAP kinases upstream of JNK and p38 that are inhibited by these BRAF inhibitors (gray-shaded). Vemurafenib and PLX4720 inhibit ZAK (principally) and MKK4 (MEK4/MAP2K4), resulting in inhibition of MKK7 and MKK4 and, ultimately, JNK. p38 activation was diminished by drug exposure in some contexts , but not to the degree that JNK activation was. Vemurafenib and PLX4720 also inhibit MAP4K5, which has been shown to be upstream of MKK4 and JNK.
Figure 4 with 1 supplement
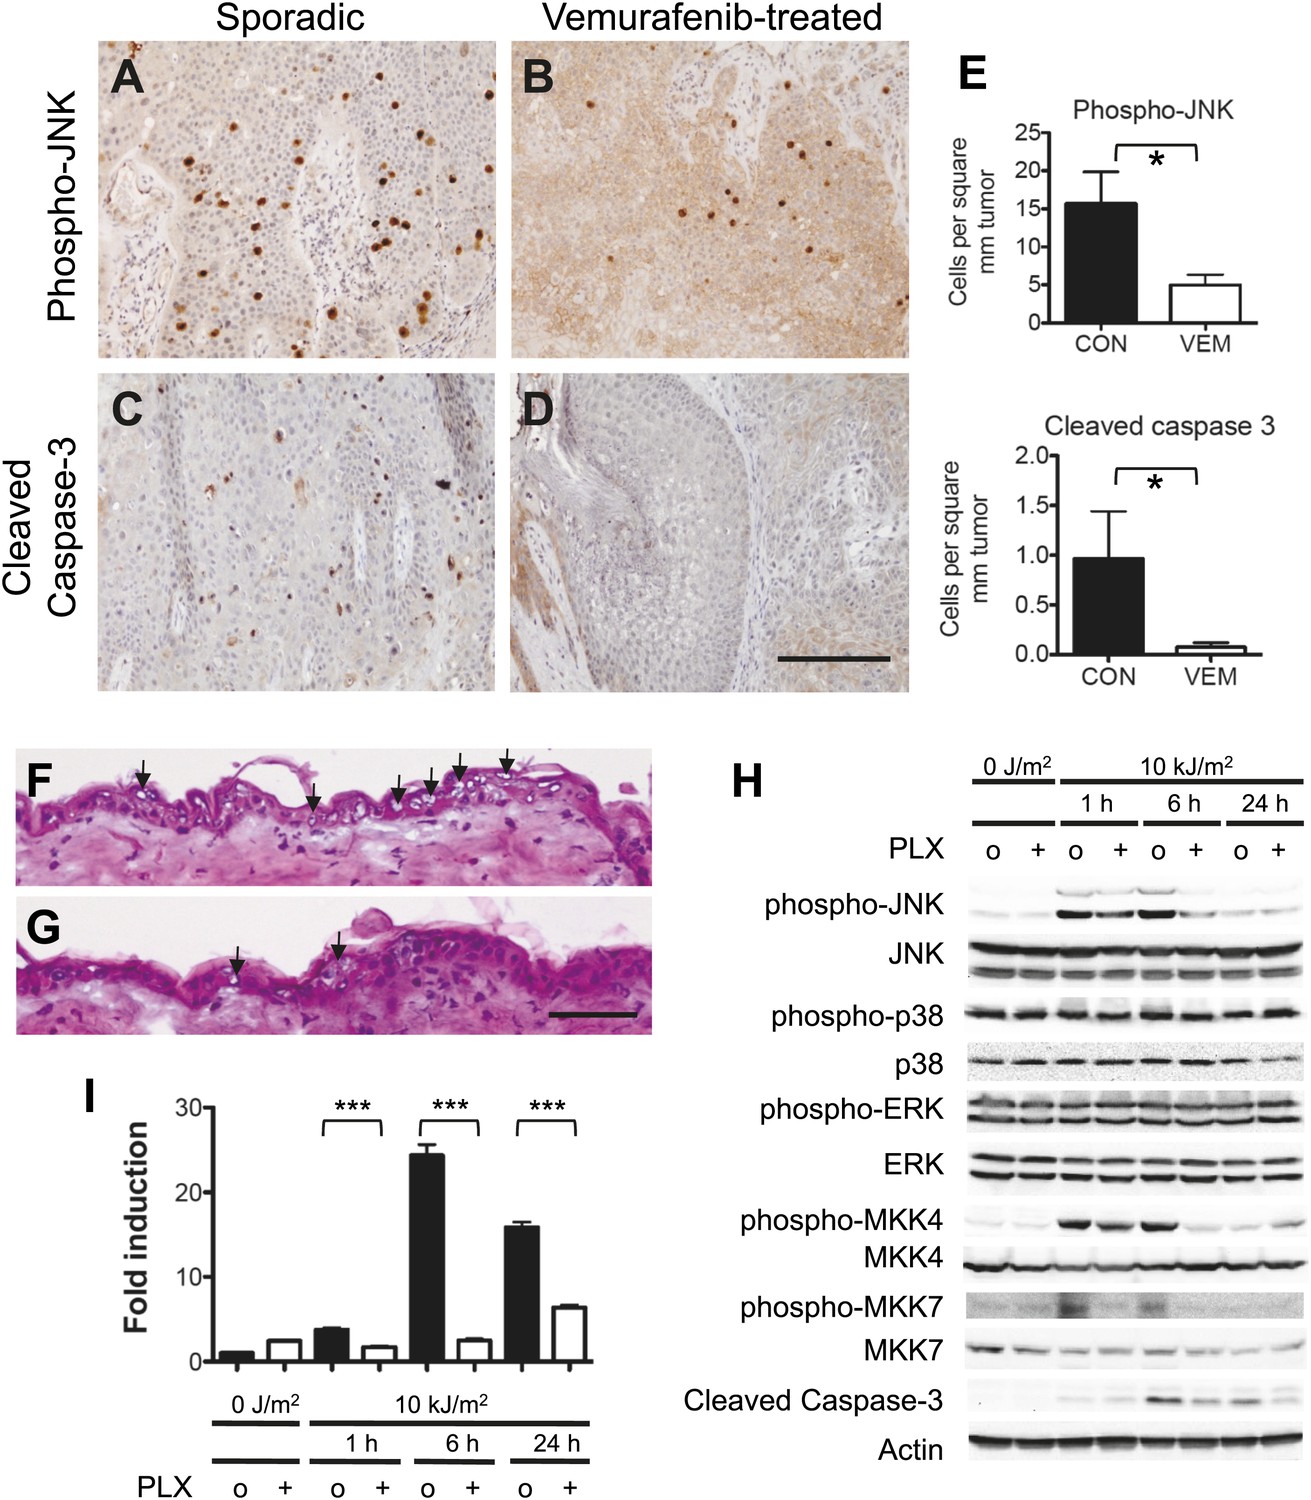
Vemurafenib and PLX4720 suppress apoptosis and JNK signaling in vivo.
(A–D) cSCC samples from vemurafenib-treated patients and non-treated patients were analyzed by immunohistochemistry for phospho-JNK and cleaved caspase-3 expression. cSCC arising in vemurafenib-treated patients show decreased expression of phospho-JNK (B) and cleaved caspase-3 (D) as compared to sporadic cSCC in patient never treated with vemurafenib (A and C). Scale bar is 100 μm. (E) Comparisons of stained cells normalized to mm2 of tumor area revealed significant suppression of both phospho-JNK and cleaved caspase 3 expression in vemurafenib-treated cSCC (‘*’, p<0.05). (F and G) Hematoxylin-stained cryosections of skin harvested at 24 hr post-irradiation showed extensive apoptosis (arrowheads) with vacuolated blebbed cells and clumped pyknotic nuclei in control-treated mice (F) and significantly fewer apoptotic cells in PLX4720-treated mice (G). Scale bar is 50 μm. (H–I) Vehicle-treated (‘o’) and PLX4720-treated (‘+’) mice were unirradiated or irradiated once, and epidermis was harvested at 1 hr, 6 hr, and 24 hr post-irradiation. (H) Significant UV-induced upregulation of both phospho-JNK and phospho-p38 were observed within 1 hr, with significant suppression of phospho-JNK in PLX4720-treated mice by 6 hr and minimal suppression of phospho-p38. Phospho-ERK levels remained constant. The upstream regulators of JNK, MKK4 and MKK7, were both significantly activated within 1 hr of irradiation, and potently suppressed in PLX4720-treated mice. Cleaved caspase-3 levels increased within 6 hr and were suppressed in PLX4720-treated mice. (I) Noxa was induced most significantly at 6 hr and was potently suppressed by PLX4720 at all time points (‘***’, p<0.001).
Figure 4—figure supplement 1
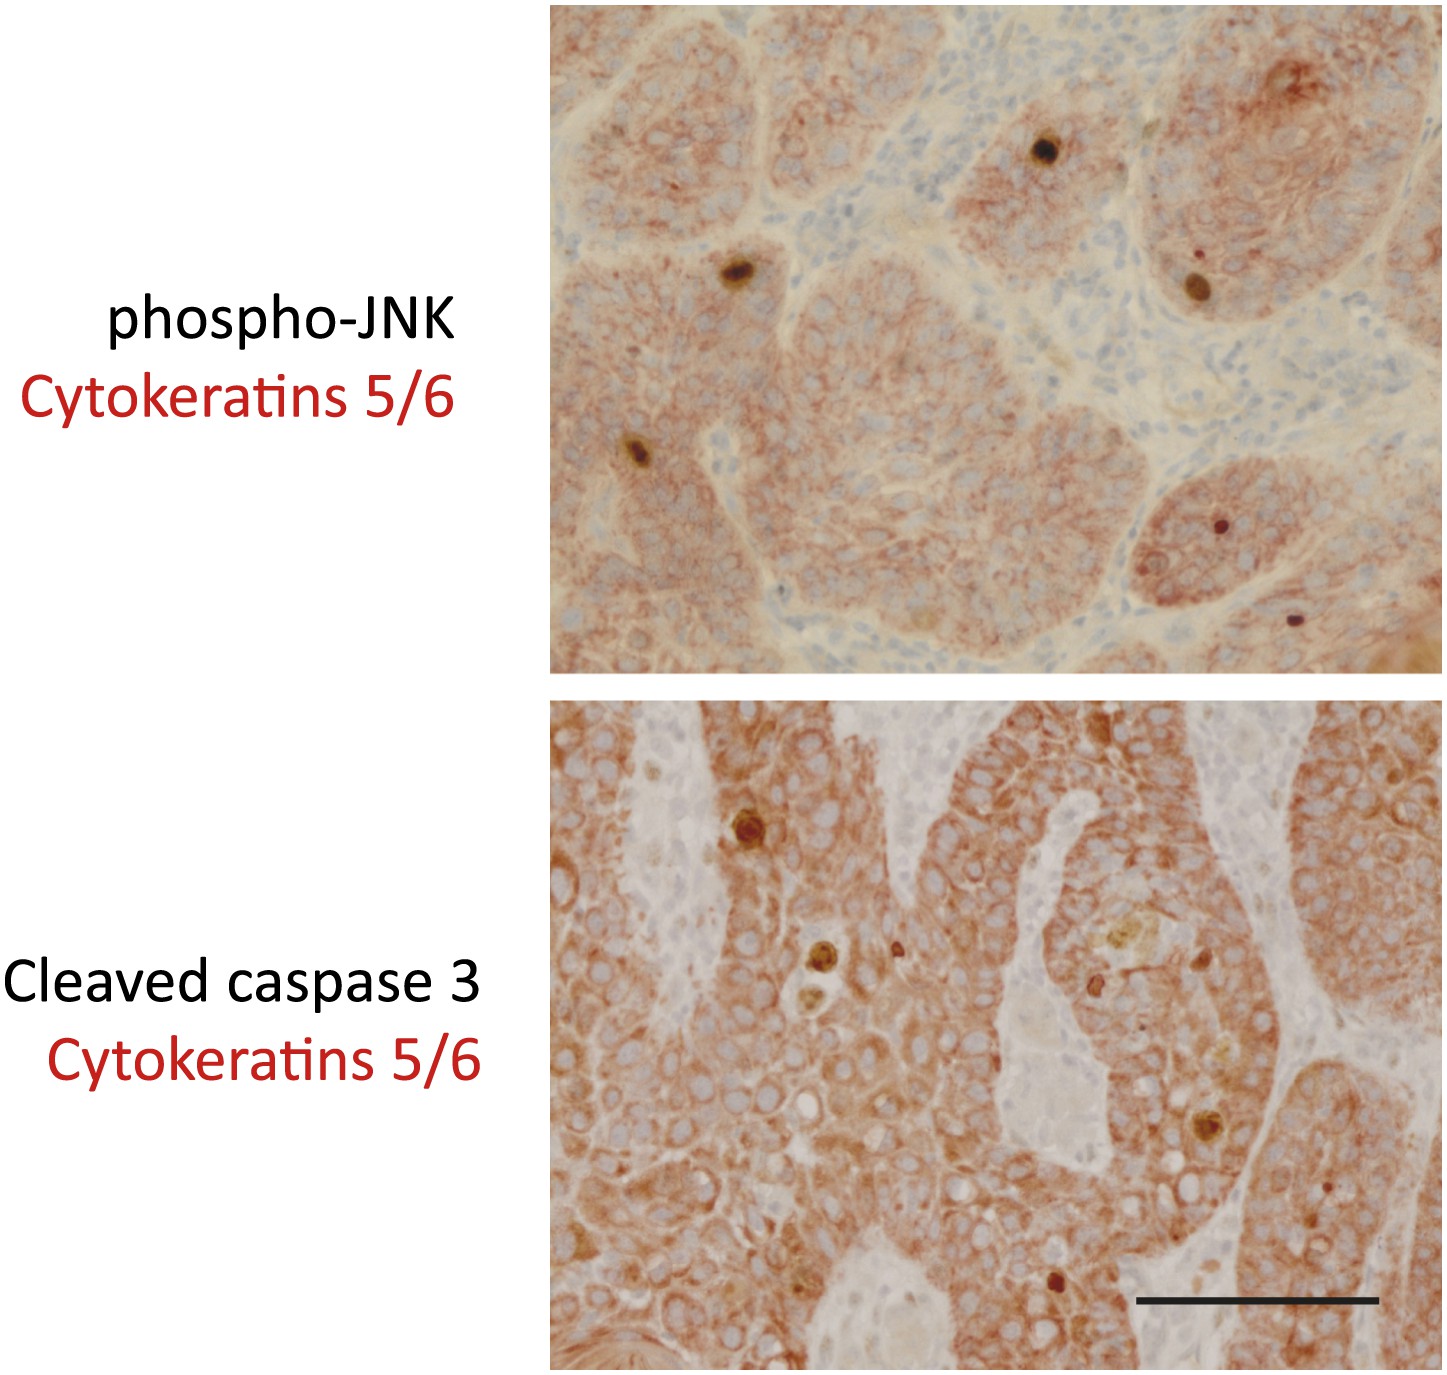
Double staining of sporadic cSCC confirms phospho-JNK and cleaved caspase-3 expression within keratinocytes of tumors.
Sections were processed for standard immunohistochemistry and stained with primary antibodies against phospho-JNK, cleaved caspase-3 (Cell Signaling; peroxidase–DAB) as before, together with antibodies against cytokeratins 5/6 (clone D5/16 B4—Thermo; peroxidase–AEC). Results of the double staining show that in all cases, phospho-JNK staining and cleaved caspase 3 staining was observed exclusively in keratinocytes within tumors. Keratinocytes (CK5/6 +) are significantly larger and have more cytoplasm than macrophages or lymphocytes. Scale bar is 50 μM.
Figure 5 with 1 supplement
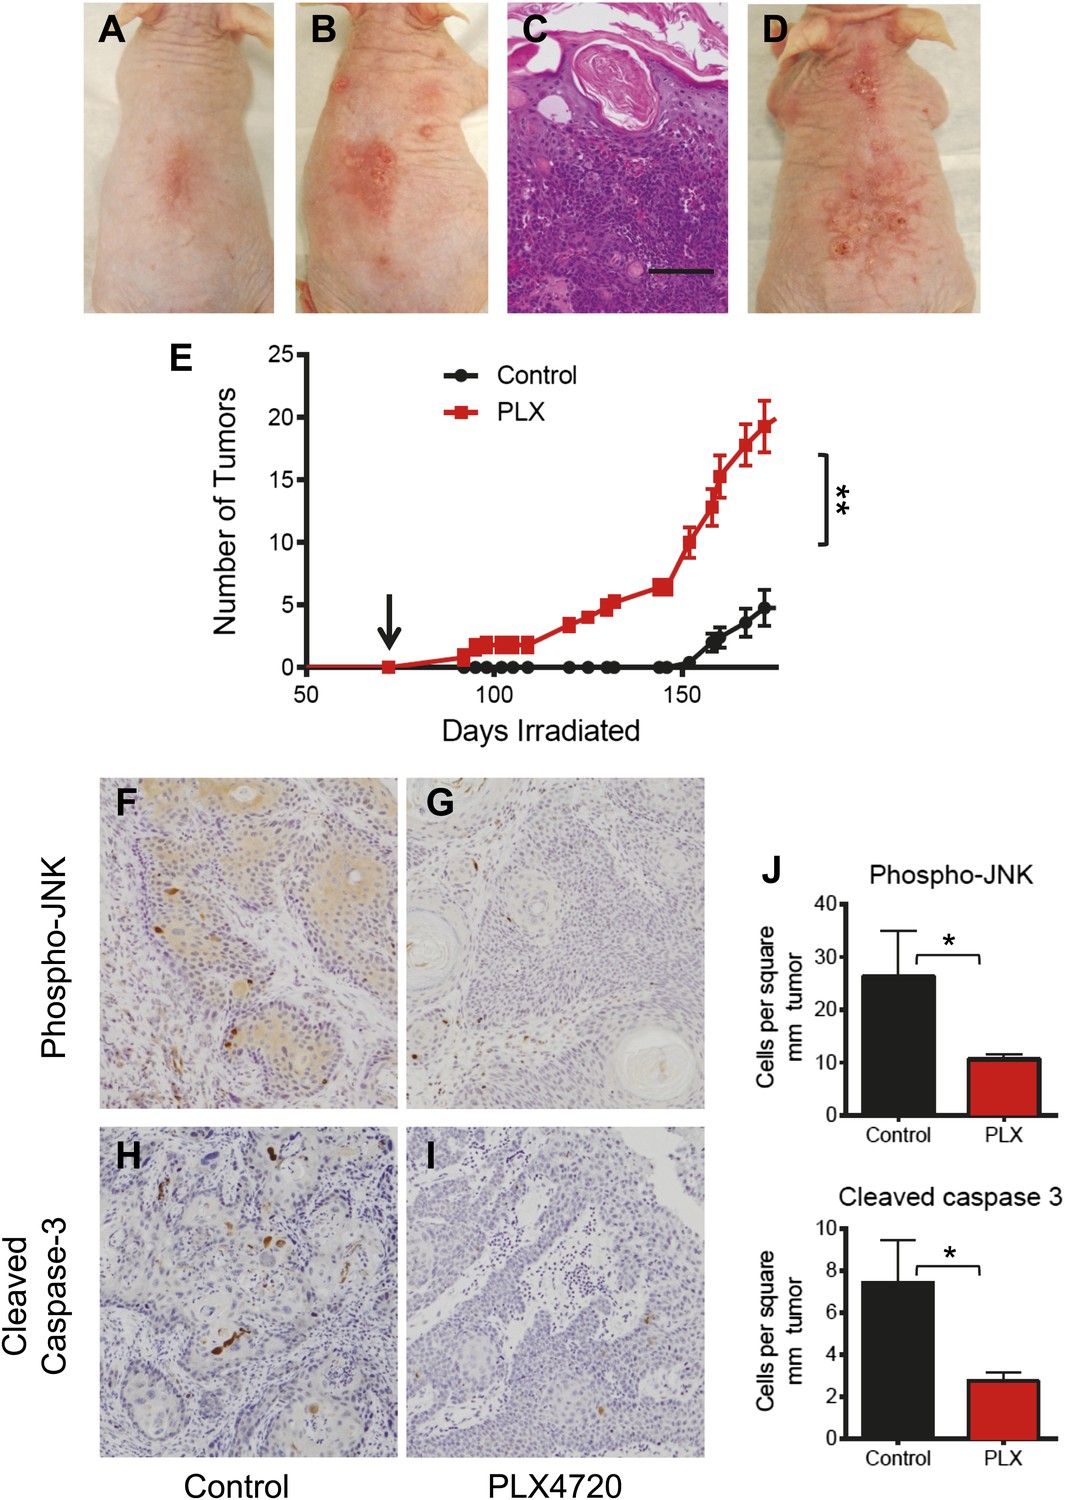
PLX4720 and JNK inhibition dramatically accelerate cSCC development in the UV-driven Hairless mouse model.
(A–E) Chronically-irradiated Hairless mice were treated with PLX4720 (n = 5), or vehicle (n = 5) starting at day 72 (arrow, E). Tumors were induced within 20 days of PLX-4720 treatment (B), whereas only erythema was seen in control animals (A). The tumors in PLX4720-treated mice progressed to well-differentiated cSCC (C, scale bar 75 μm), steadily increasing in size and number (D, day 132). (E) Even at 150 days (78 days of drug treatment), only PLX4720-treated mice had tumors and the differences in tumor number persisted throughout (‘**’, p=0.0026). (F–J) cSCC from mice were harvested and assessed for phospho-JNK and cleaved caspase 3 expression by immunohistochemistry. Tumors from PLX4720-treated animals showed significantly lower levels of phospho-JNK (G) and cleaved caspase 3 (I) as compared to control-treated animals (F and H). Differences in these parameters were significant across all comparisons (J, ‘*’, p<0.05).
Figure 5—figure supplement 1
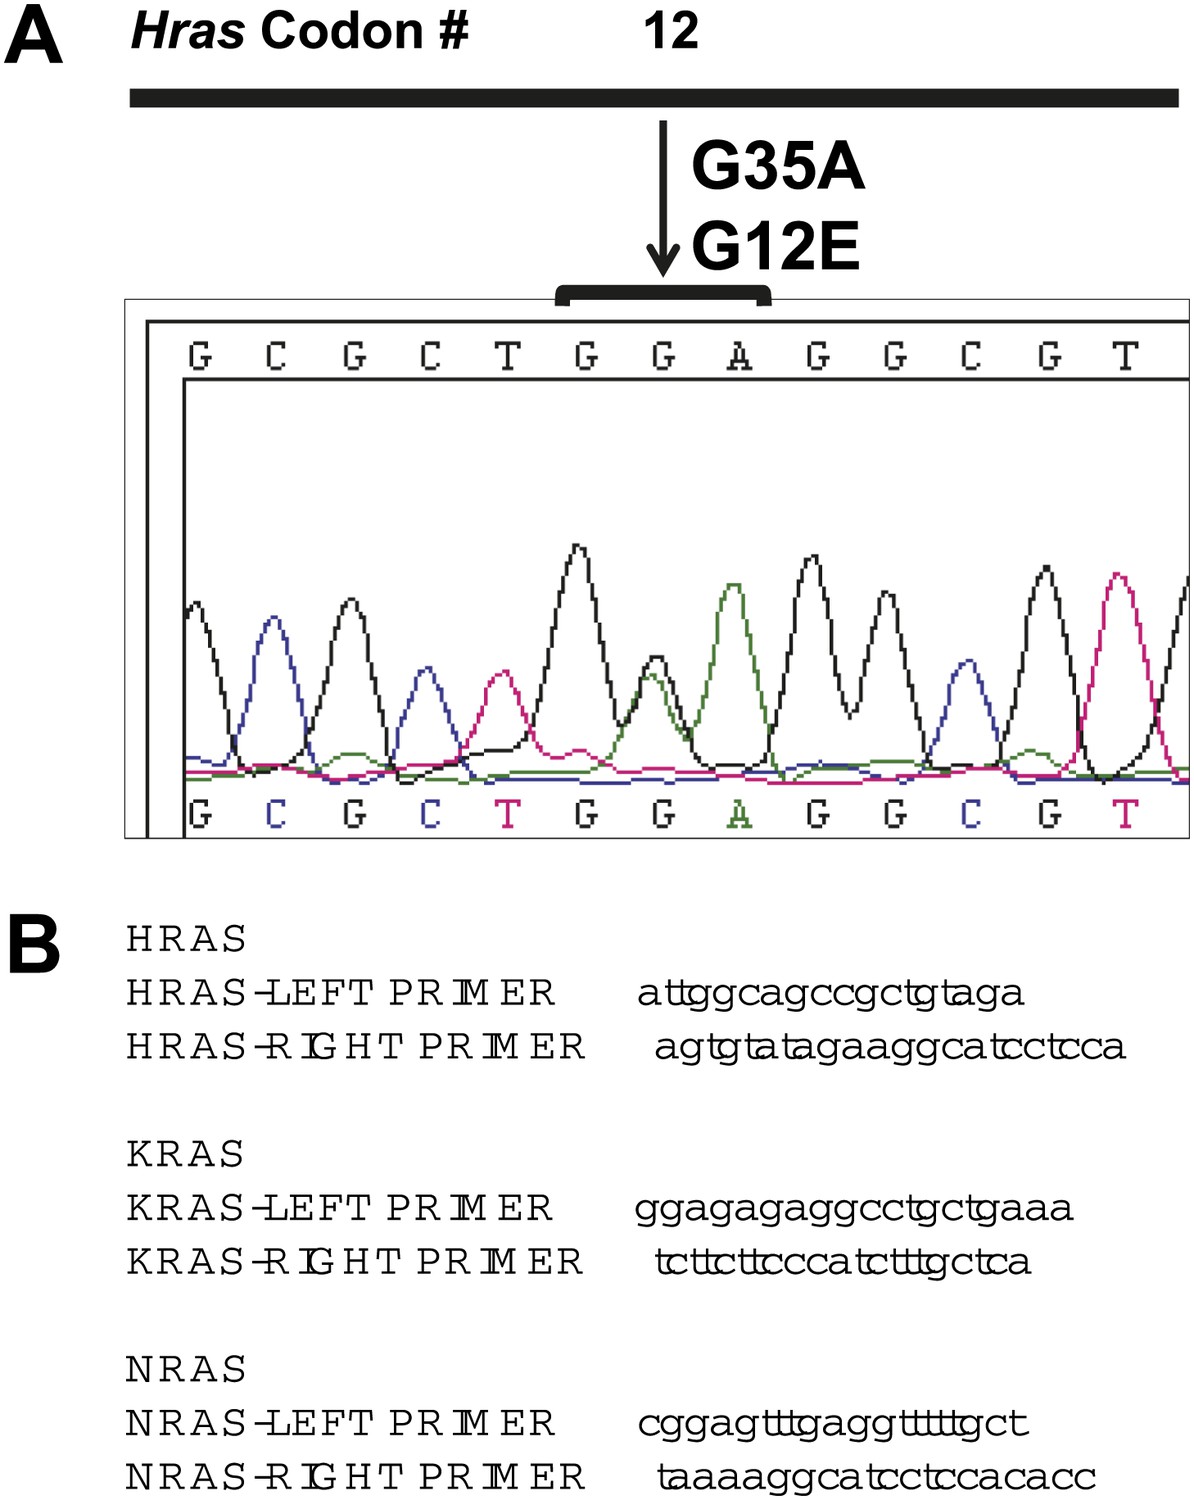
cSCC and papillomas arising in Hairless mice treated with PLX4720 do not have Ras mutations.
(A and B) cDNA was reverse-transcribed from total RNA, PCR-amplified with the above primers (B) and analyzed by Sanger sequencing for mutations in both directions. No mutations in Hras, Kras, or Nras were detected in any of the papillomas (n = 5) or carcinomas (n = 3) isolated from PLX4720-treated mice. One of the papillomas from untreated mice had a heterozygous point mutation (A) in Hras (G35A, G12E) among 14 samples (12 papillomas, 2 cSCC).
Figure 6 with 3 supplements
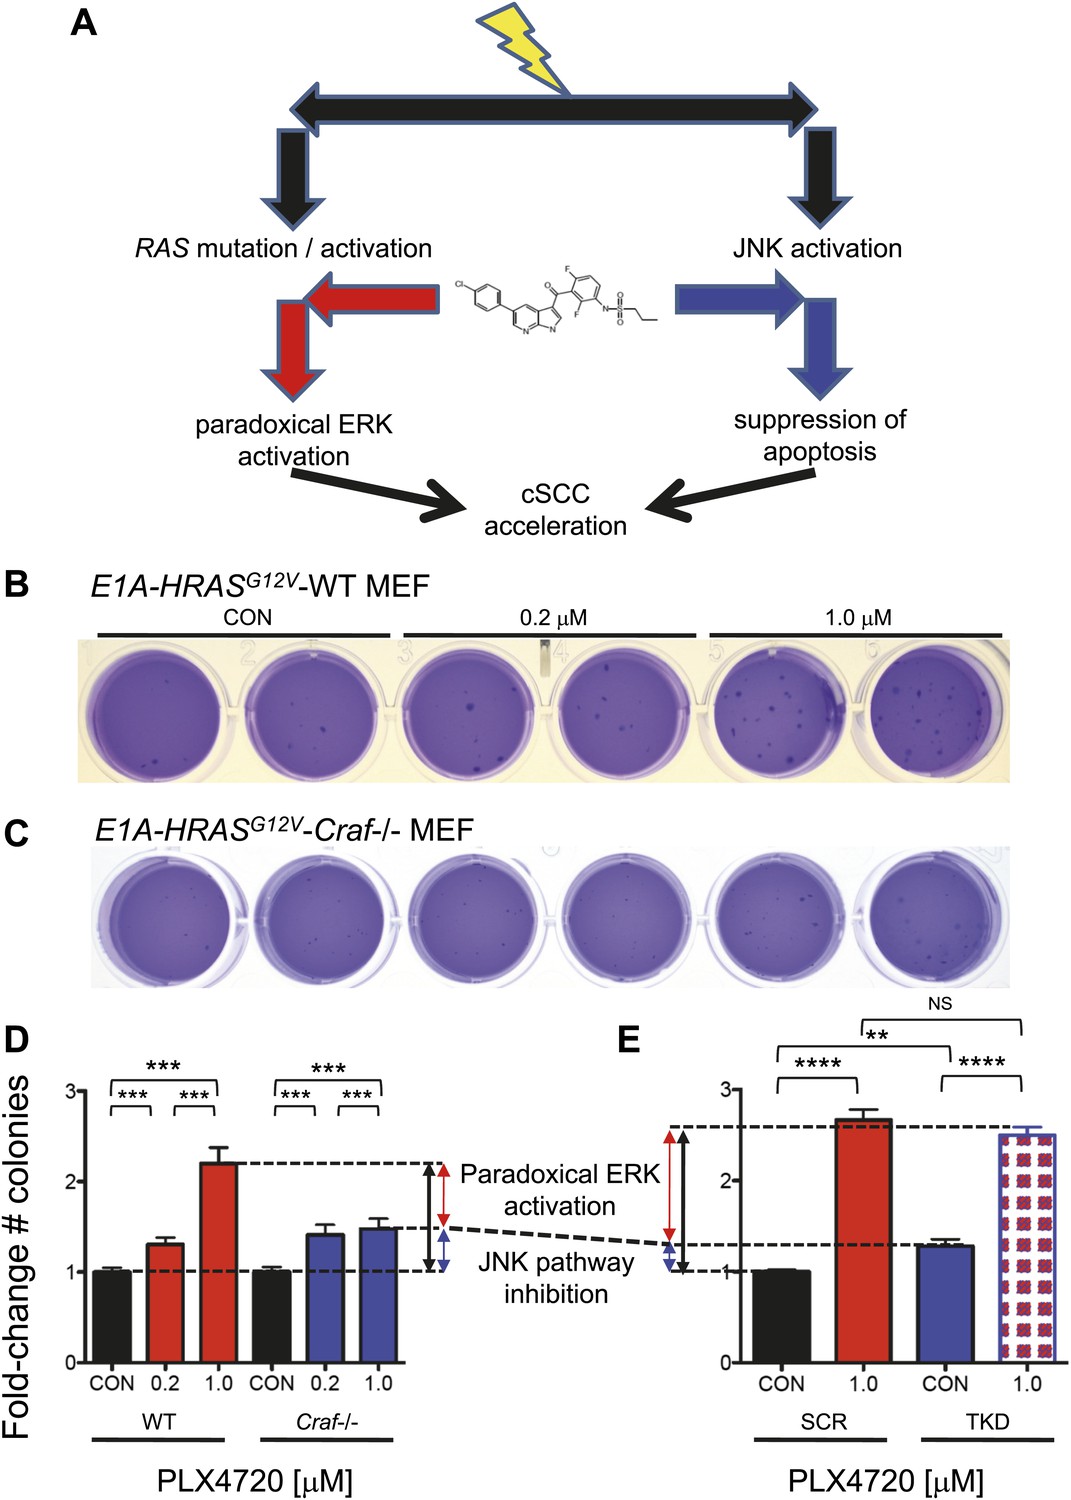
Paradoxical ERK activation and JNK pathway inhibition make significant and separable contributions to BRAFi-induced growth.
(A) We envision two separable, parallel mechanisms by which PLX4720 and vemurafenib contribute to cSCC development. Drug-induced paradoxical ERK activation and inhibition of JNK signaling occur in parallel, but the former depends on intact CRAF. (B and C) Representative soft agar colonies of E1A and HRASG12V-transformed wild-type (WT) (B) and Craf−/− (C) MEFs, following exposure to 0.2 μM and 1.0 μM PLX4720 over 4–6 weeks show significant colony-forming advantages conferred by BRAFi. (D) The fold-change in colony counts of transformed wild-type (WT) (n = 22 replicates) and Craf−/− (n = 14 replicates) MEFs demonstrate a dose-dependent increase in colonies, particularly for WT MEFs. The difference between colony formation advantages conferred by 1.0 μM PLX4720 in WT vs Craf−/− MEFs was interpreted to reflect the contribution of paradoxical ERK signaling (red arrow), which depends upon Craf, and is 60% of the total effect (black arrow), with the remainder composed of other effects including JNK inhibition (blue arrow). All differences between each MEF population were significant (‘***’, p<0.001) (E) The fold-change in colony counts of transformed HaCaT cells with (‘TKD’) and without (‘SCR’) triple lentiviral shRNA knockdown of ZAK, MAP4K5, and MAP2K4, show significant differences between 1.0 μM PLX4720-treated and control-treated conditions (‘****’, p<10−10). Importantly, untreated TKD cells had a significant advantage over untreated SCR HaCaT cells (‘**’, p<0.01), which we interpreted to be the contribution of JNK signaling inhibition, of 17.6% (blue arrow). Drug-treated SCR and TKD cells both had a similar degree of total colony formation advantage (averaged as black arrow), as expected, since the TKD cells are not expected to have any additional suppression of JNK signaling in the presence of drug (‘NS’, p=0.17, Figure 3D). Therefore, the colony counts for these two distinct systems (D and E), when taken together, show that JNK pathway inhibition accounts for approximately 17.6–40% and paradoxical ERK activation accounts for approximately 60–82.4% of the total effects of PLX4720 on tumor growth.
Figure 6—figure supplement 1
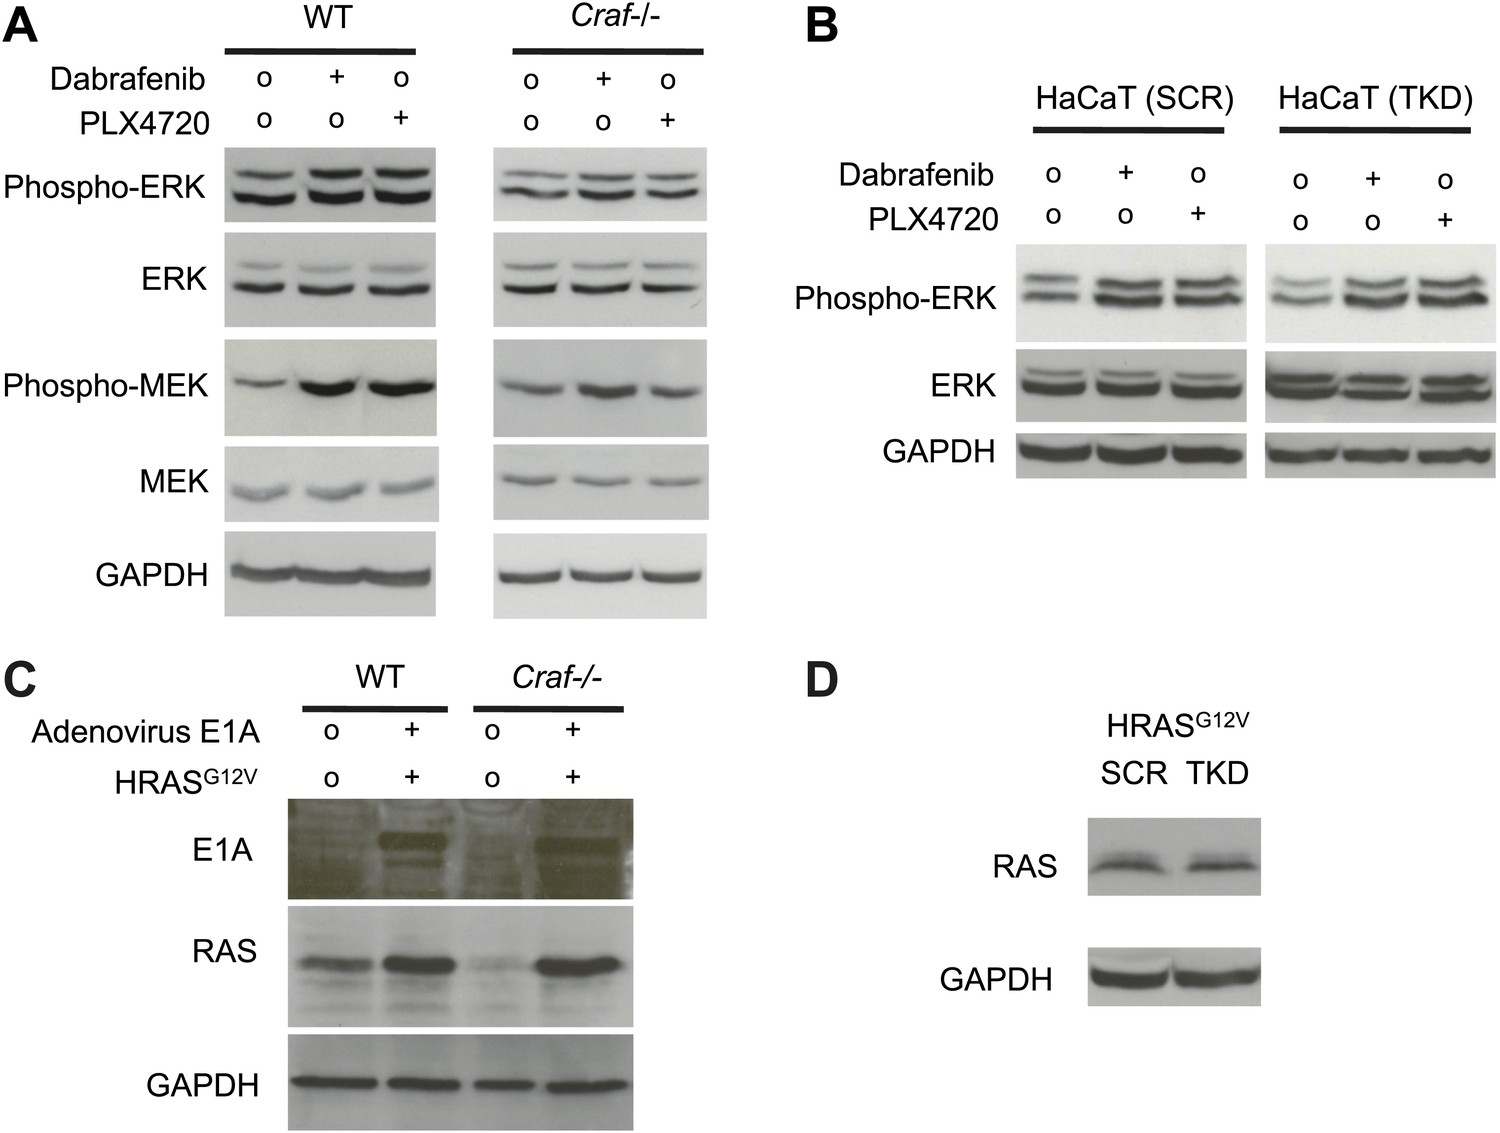
Paradoxical MEK and ERK activation require intact Craf.
Wild-type (WT) and isogenic Craf−/− MEFs were retrovirally transduced with HRASG12V and adenovirus E1A thereby enabling anchorage-independent growth for soft agar assays. (A) WT MEFs exhibit paradoxical MEK and ERK activation, effects that are significantly reduced in Craf−/− MEFs, particularly for MEK activation. (B) HRASG12V–transformed HaCaT cells with (‘TKD’) and without (‘SCR’) triple knockdown of ZAK, MAP4K5, and MAP2K4 show equivalent paradoxical ERK activation. (C) Transformed WT and Craf−/− MEFs show equivalent expression of E1A (sc-25, Santa Cruz) and RAS (sc-32, Santa Cruz). (D) Transformed HaCaT cells show equivalent expression of RAS.
Figure 6—figure supplement 2
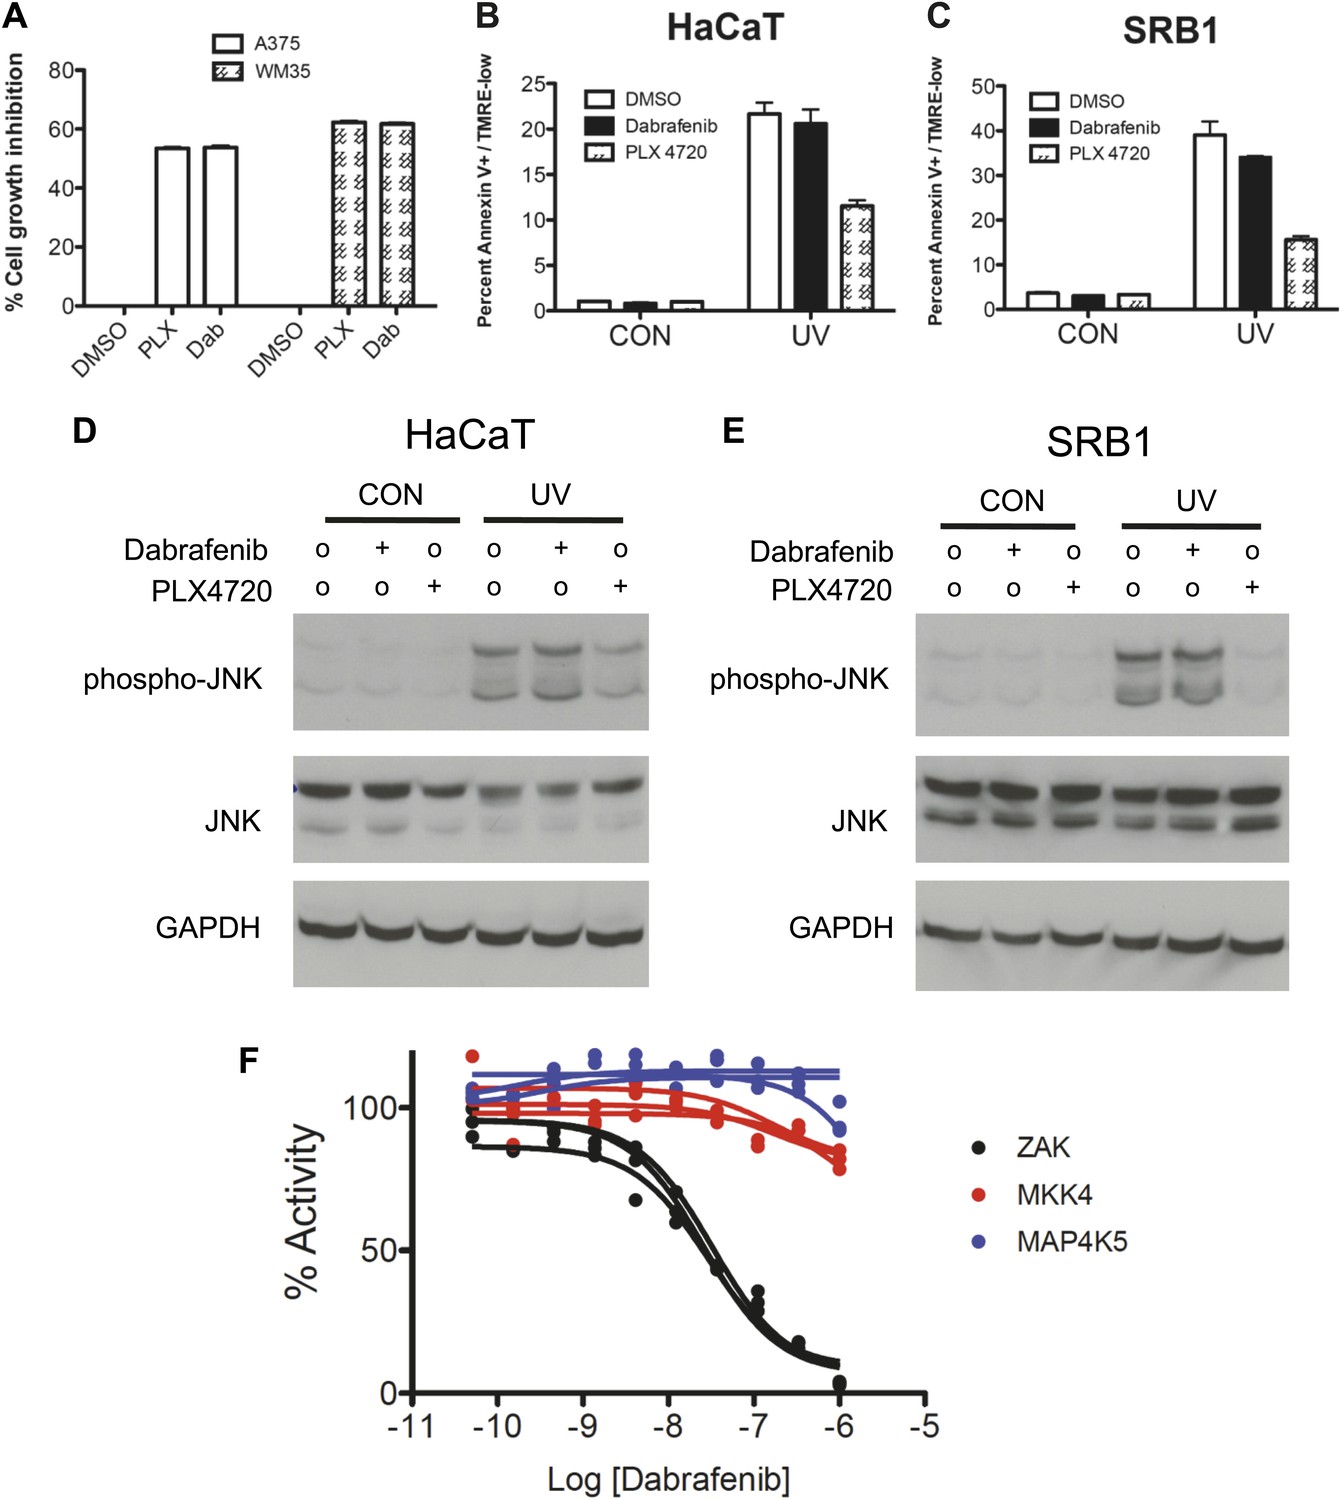
Dabrafenib fails to suppress apoptosis and phospho-JNK upregulation following UV irradiation at bioequivalent doses as compared to PLX4720.
Based upon human pharmacokinetic data and in vitro experiments, dabrafenib and PLX4720 were compared in multiple settings at bioequivalent doses (0.05 μM and 1.0 μM, respectively). (A) Both BRAFi suppress the growth of A375 and WM35 BRAFV600E melanoma cell lines to the same degree at these doses. (B and C) At these doses, dabrafenib fails to suppress UV-induced apoptosis significantly in HaCaT and SRB1 cells. (D and E) Likewise, dabrafenib fails to suppress phospho-JNK induction, whereas PLX4720 potently suppresses phospho-JNK induction as shown earlier. (F) Dabrafenib inhibits ZAK kinase with an estimated IC50 of 28.92 ± 2.23 nM, with no significant inhibition of MAP4K5 or MKK4 up to 1 μM. At 0.01 μM of dabrafenib, the retained activity of ZAK kinase is over 64%.
Figure 6—figure supplement 3
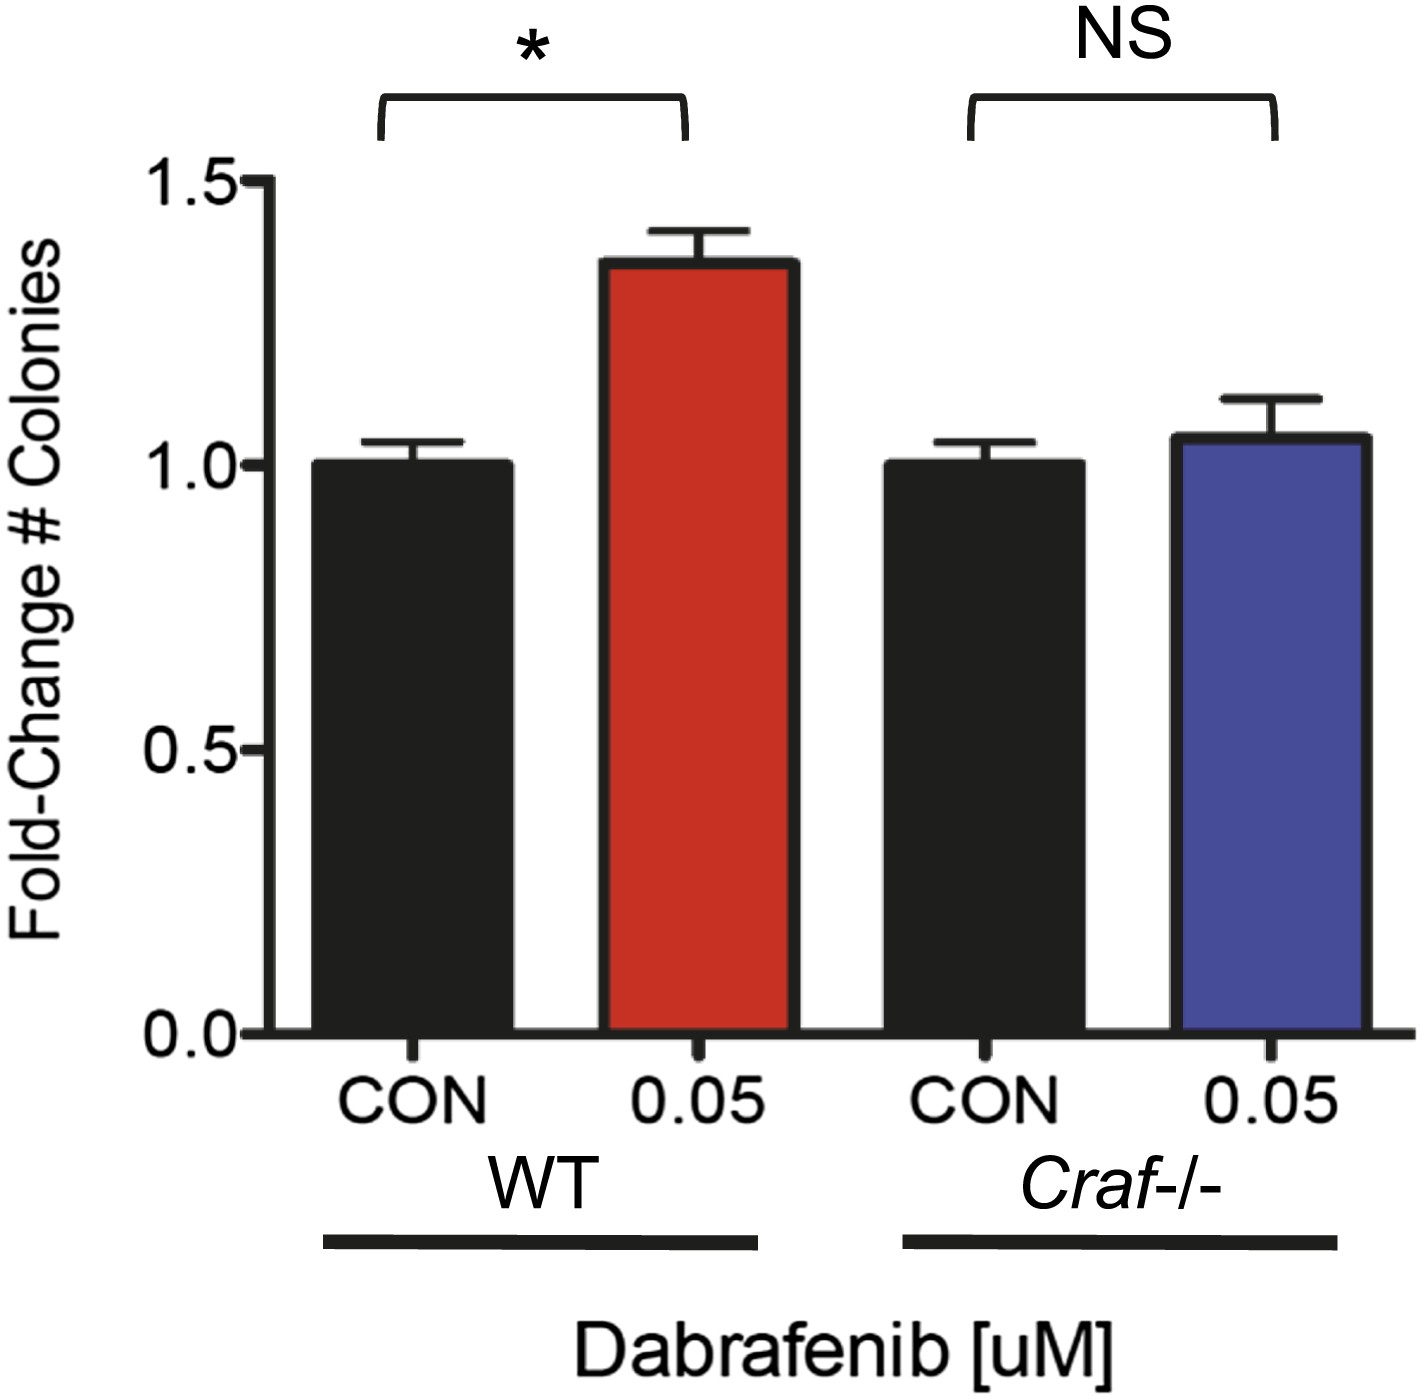
Dabrafenib produces a colony formation advantage only in WT MEFs.
At 0.05 μM, dabrafenib produce a significant growth advantage in E1A-HRASG12V- transformed WT MEFs. In E1A-HRASG12V-transformed Craf−/− MEFs, dabrafenib fails to confer a significant growth advantage, suggesting that in the absence of significant paradoxical ERK activation, dabrafenib does not have a relevant off-target effect that results in a growth advantage.
Tables
Table 1
Lack of BRAF and RAS mutations in cSCC and HaCaT cell lines
| ALK_F1174LIV_T3520CAG | ALK_F1245C_T3734G |
| ALK_F1245VI_T3733GA | BRAF_G464EVA_G1391ATC |
| BRAF_G466R_G1396CA | BRAF_K601E_A1801G |
| BRAF_V600EAG_T1799ACG_F | CTNNB1_S45APT_T133GCA |
| CTNNB1_T41APS_A121GCS | EGFR_Y813C_A2438G |
| GNAS_R201SC_C601AT | KRAS_G12SRC_G34ACT |
| KRAS_Q61EKX_C181GAT | MET_H1112_A3335GT |
| MET_Y1248HD_T3742CG | PIK3CA_A1046V_C3137T |
| PIK3CA_C420R_T1258C | PIK3CA_E110K_G328A |
| PIK3CA_E418K_G1252A | PIK3CA_F909L_C2727G |
| PIK3CA_H1047RL_A3140 GT | PIK3CA_H701P_A2102C |
| PIK3CA_N345K_T1035A | PIK3CA_Q060K_C178A |
| PIK3CA_R088Q_G263A | PIK3CA_S405F_C1214T |
| TNK2_R99Q_G296A | BRAF_G466EVA_G1397ATC |
| BRAF_V600LM_G1798 TA | CTNNB1_S37APT_T109GCA |
| CTNNB1_S45CFY_C134GTA | EGFR_G719_G2155TA |
| EGFR_L858R_T2573G | EGFR_T790M_C2369T |
| EPHA3_K761N_G2283 | FGFR2_S252W_C755G |
| FOXL2_C134W_C402G | KIT_K642E_A1924G |
| KIT_R634W_C1900T | KIT_V560D_T1679A |
| KIT_V825A_T2474C | KIT_Y553N_T1657A |
| KRAS_G12DAV_G35ACT | MET_N375S_A1124G |
| NRAS_G12SRC_G34ACT | PIK3CA_E453K_G1357A |
| PIK3CA_E545AGV_A1634CGT | PIK3CA_H1047RL_A3140 GT..1. |
| PIK3CA_K111N_G333C | PIK3CA_M1043V_A3127G |
| PIK3CA_P539R_C1616G | BRAF_E586K_G1756A |
| BRAF_G469EVA_G1406ATC | CTNNB1_S33APT_T97GCA |
| CTNNB1_S37CFY_C110GTA | EGFR_L861_T2582AG |
| EGFR_T854I_C2561T | FGFR2_N549KK_T1647GA |
| FRAP_R2505P_G7514C | FRAP_S2215Y_C6644T |
| IDH2_R172MK_G515 TA | JAK2_V617F_G1849T |
| KIT_L576P_T1727C | KIT_N566D_A1696 G |
| KRAS_A146PT_G436CA | NRAS_G12DAV_G35ACT |
| KRAS_Q61HHE_A183CTG | KRAS_G13SRC_G37ACT |
| NRAS_G13DAV_G38ACT | NRAS_Q61HHQ_A183TCG |
| PDGFRA_N659Y_A1975T | PDGFRA_V561D_T1682A |
| PIK3CA_E545KQ_G1633AC | PIK3CA_H1047Y_C3139T |
| PIK3CA_Q546EK_C1636 GA | PIK3CA_Y1021HN_T3061CA |
| RET_M918T_T2753C | AKT1_G173R_G517C |
| AKT2_E17K_G49A | BRAF_G469R_G1405CA |
| BRAF_L597R_T1790G | BRAF_V600_G1800 |
| CTNNB1_G34EVA_G101ATC | EGFR_S720P_T2158C |
| GNA11_Q209LP_A626 TC | IDH1_R132CGS_C394TGA |
| IDH2_R140LQ_G419 TA | IDH2_R140W_C418T |
| IDH2_R172S_G516T | KIT_D816HNY_G2446CAT |
| KIT_V559ADG_T1676CAG | KRAS_G10R_G28A |
| KRAS_Q61LPR_A182TCG | MET_H1112Y_C3334T |
| MET_M1268T_T3803C | MET_T1010I_C3029T |
| NRAS_A146T_G436A | NRAS_Q61EKX_C181GAT |
| PDGFRA_D842V_A2525T | PDGFRA_D842_G2524TA |
| PDGFRA_N659K_C1977A | PIK3CA_E542KQ_G1624AC |
| PIK3CA_G1049R_G3145C | PIK3CA_M1043I_G3129ATC |
| PIK3R1_D560Y_G1678T | PRKAG2_N488I_A1463T |
| AKT2_G175R_G523C | AKT3_G171R_G511A |
| ALK_F1174L_C3522AG | ALK_I1171N_T3512A |
| ALK_R1275QL_G3824AT | BRAF_D594GV_A1781 GT |
| CTNNB1_D32HNY_G94CAT | FBWX7_R465C_C1393T |
| FBWX7_R479QL_G1436AT | FBWX7_R505HLP_G1514ATC |
| FGFR3_G370C_G1108T | GNAQ_Q209H_A627T |
| IDH2_R140W_C419T | IDH2_R172GW_A514 GT |
| KIT_N822KNK_T2466GCA | KRAS_G13DAV_G38ACT |
| PDPK1_D527E_C1581G | PIK3CA_E542VG_A1625TG |
| PIK3CA_E545D_G1635CT | PIK3CA_T1025SA_A3073TG |
| PIK3CA_Y1021C_A3062G | PIK3R1_N564K_C1693AG |
| PRKAG1_R70Q_G209A | AKT1_E17K_G49A |
| AKT1_K179M_A536T | BRAF_V600EAG_T1799ACG_R |
| CDK4_R24C_C70T | CDK4_R24H_G71A |
| CTNNB1_D32AGT_A95CGV | FBWX7_R465HL_G1394AT |
| FGFR3_G697C_G2089T | FGFR3_K650MT_A1949 TC |
| FGFR3_R248C_C742T | FGFR3_S371C_A1111T |
| FGFR3_Y373C_A1118G | GNAS_R201H_G602A |
| IDH1_R132HL_G395AT | KIT_N822YHD_A2464TCG |
| MET_R988C_C2962T | MET_Y1253D_T3757 G |
| NRAS_G13SRC_G37ACT | NRAS_Q61RPL_A182GCT |
| PIK3CA_Q546LPR_A1637TCG | TNK2_E346K_G1036A |
| PIK3CA_H1047RL_A3140 GT | ALK_F1245C_T3734G |
-
The listed gene mutations were screened by Sequenom INT16/20 panel (Characterized Cell Line Core, MD Anderson Cancer Center) and HRAS was sequenced by Sanger sequencing. All examined loci were wild-type in the cSCC cell lines SRB1, SRB12, COLO16, and keratinocyte cell line HaCaT. The PIK3R1_M326I_G978 polymorphism was found in the SRB12 cell line.
Table 2
Quantitative competitive binding assays reveal additional kinase targets of PLX4720
| Gene Name | Entrez gene Symbol | Percent control (50 nM) | Percent control (200 nM) | Percent control (1000 nM) | Percent control (10 μM) | Calculated estimate of IC50 (nM) | Published biochemical IC50 (nM) |
|---|---|---|---|---|---|---|---|
| ASK1 | MAP3K5 | 89 | 98 | 97 | 100 | 14,179.29 | |
| ASK2 | MAP3K6 | 94 | 100 | 100 | 100 | ||
| BLK | BLK | 91 | 78 | 32 | 1 | 446.56 | |
| BRAF(V600E) | BRAF | 38 | 19 | 3.9 | 0.1 | 32.04 | 13 |
| BRK | PTK6 | 47 | 14 | 2.4 | 0.2 | 30.38 | 130 |
| DLK | MAP3K12 | 95 | 98 | 100 | 92 | ||
| FGR | FGR | 69 | 38 | 11 | 2.5 | 153.47 | |
| HPK1 | MAP4K1 | 100 | 100 | 100 | 47 | ||
| LZK | MAP3K13 | 94 | 100 | 96 | 75 | ||
| MAP3K1 | MAP3K1 | 96 | 100 | 92 | 84 | ||
| MAP3K15 | MAP3K15 | 94 | 97 | 91 | 59 | ||
| MAP3K2 | MAP3K2 | 100 | 93 | 87 | 41 | ||
| MAP3K3 | MAP3K3 | 94 | 97 | 98 | 75 | ||
| MAP3K4 | MAP3K4 | 100 | 100 | 100 | 65 | ||
| MAP4K2 | MAP4K2 | 98 | 100 | 99 | 67 | ||
| MAP4K3 | MAP4K3 | 100 | 95 | 90 | 56 | ||
| MAP4K4 | MAP4K4 | 92 | 99 | 100 | 46 | ||
| MAP4K5 | MAP4K5 | 96 | 100 | 63 | 8 | 1257.42 | |
| MEK3 | MAP2K3 | 100 | 100 | 100 | 64 | ||
| MEK4 | MAP2K4 | 48 | 27 | 2.6 | 0.05 | 37.96 | |
| MEK6 | MAP2K6 | 82 | 100 | 100 | 47 | ||
| MINK | MINK1 | 89 | 100 | 98 | 55 | ||
| MKK7 | MAP2K7 | 100 | 100 | 100 | 84 | ||
| MLK1 | MAP3K9 | 100 | 100 | 100 | 100 | >10,000 | >5000 |
| MLK2 | MAP3K10 | 100 | 82 | 100 | 76 | ||
| MLK3 | MAP3K11 | 100 | 100 | 100 | 100 | ||
| MST1 | STK4 | 100 | 93 | 84 | 55 | 6709.79 | >5000 |
| OSR1 | OXSR1 | 100 | 94 | 95 | 42 | ||
| PAK1 | PAK1 | 93 | 97 | 83 | 22 | ||
| RIPK1 | RIPK1 | 99 | 87 | 85 | 50 | ||
| SRMS | SRMS | 1.9 | 0.55 | 0.05 | 0 | 0.64 | |
| STK39 | STK39 | 100 | 100 | 100 | 59 | ||
| TAK1 | MAP3K7 | 90 | 88 | 85 | 49 | ||
| TAOK1 | TAOK1 | 87 | 94 | 89 | 65 | 7532.57 | >5000 |
| TAOK2 | TAOK2 | 92 | 100 | 93 | 51 | ||
| TAOK3 | TAOK3 | 100 | 98 | 96 | 58 | ||
| TNIK | TNIK | 97 | 89 | 79 | 24 | ||
| ZAK | ZAK | 20 | 4 | 0.7 | 0.1 | 9.47 |
-
Quantitative competitive binding assays were performed for a group of kinases previously tested against PLX4720 as well as a group of MAP kinases upstream of JNK. Published biochemical IC50s for PLX4720 are listed (see main text) for comparison and demonstrate good quantitative correspondence between estimated Kd from binding assays and biochemical IC50s. ZAK and MKK4 (MAP2K4) were very tightly bound by PLX4720 with estimated Kd below 50 nM. Bold text indicates the kinases tested for inhibition by PLX4720 with in-vitro kinase assays.
Table 3
Quantitative competitive binding assays reveal additional kinase targets of vemurafenib
| Percent control (50 nM) | Percent control (200 nM) | Percent control (1000 nM) | Percent control (10 μM) | Calculated estimate of IC50 (nM) | Published biochemical IC50 (nM) | ||
|---|---|---|---|---|---|---|---|
| ASK1 | MAP3K5 | 90 | 94 | 97 | 100 | 11,972.22 | >1000 |
| ASK2 | MAP3K6 | 94 | 98 | 100 | 74 | ||
| BLK | BLK | 96 | 66 | 30 | 0.55 | 518.03 | 547 |
| BRAF(V600E) | BRAF | 63 | 25 | 5.4 | 0.5 | 64.78 | 31 |
| BRK | PTK6 | 63 | 28 | 6.9 | 0.35 | 68.04 | 213 |
| DLK | MAP3K12 | 98 | 97 | 66 | 92 | ||
| FGR | FGR | 65 | 49 | 13 | 1.6 | 149.26 | 63 |
| HPK1 | MAP4K1 | 95 | 88 | 67 | 15 | ||
| LZK | MAP3K13 | 100 | 99 | 93 | 74 | ||
| MAP3K1 | MAP3K1 | 98 | 84 | 89 | 81 | ||
| MAP3K15 | MAP3K15 | 84 | 100 | 84 | 91 | ||
| MAP3K2 | MAP3K2 | 91 | 91 | 89 | 83 | ||
| MAP3K3 | MAP3K3 | 87 | 97 | 100 | 94 | ||
| MAP3K4 | MAP3K4 | 95 | 92 | 87 | 46 | ||
| MAP4K2 | MAP4K2 | 99 | 82 | 95 | 46 | ||
| MAP4K3 | MAP4K3 | 80 | 90 | 82 | 24 | ||
| MAP4K4 | MAP4K4 | 96 | 92 | 83 | 23 | 2842.34 | >1000 |
| MAP4K5 | MAP4K5 | 62 | 33 | 4.1 | 0.1 | 58.21 | 51 |
| MEK3 | MAP2K3 | 100 | 96 | 98 | 54 | ||
| MEK4 | MAP2K4 | 19 | 4.1 | 0.2 | 0.05 | 6.82 | |
| MEK6 | MAP2K6 | 91 | 97 | 87 | 21 | 4080.69 | >1000 |
| MINK | MINK1 | 100 | 100 | 91 | 66 | 14,761.44 | >1000 |
| MKK7 | MAP2K7 | 97 | 95 | 94 | 85 | ||
| MLK1 | MAP3K9 | 100 | 93 | 97 | 41 | 13,979.88 | >1000 |
| MLK2 | MAP3K10 | 92 | 96 | 87 | 78 | ||
| MLK3 | MAP3K11 | 98 | 100 | 100 | 77 | ||
| MST1 | STK4 | 99 | 83 | 51 | 12 | ||
| OSR1 | OXSR1 | 100 | 100 | 89 | 98 | ||
| PAK1 | PAK1 | 99 | 98 | 91 | 46 | ||
| RIPK1 | RIPK1 | 92 | 100 | 99 | 73 | ||
| SRMS | SRMS | 24 | 9.6 | 0.75 | 0 | 11.15 | 18 |
| STK39 | STK39 | 100 | 100 | 97 | 66 | ||
| TAK1 | MAP3K7 | 93 | 88 | 86 | 88 | ||
| TAOK1 | TAOK1 | 91 | 100 | 97 | 79 | ||
| TAOK2 | TAOK2 | 98 | 92 | 95 | 70 | 11,770.83 | >1000 |
| TAOK3 | TAOK3 | 92 | 98 | 92 | 80 | 15,468.75 | >1000 |
| TNIK | TNIK | 95 | 94 | 66 | 11 | ||
| ZAK | ZAK | 9 | 1.8 | 0.25 | 0.05 | 4.03 |
-
Quantitative competitive binding assays were performed for a group of kinases previously tested against vemurafenib as well as a group of MAP kinases upstream of JNK. Published biochemical IC50s for vemurafenib are listed (see main text) for comparison and demonstrate good quantitative correspondence between estimated Kd from binding assays and biochemical IC50s. ZAK and MKK4 (MAP2K4) were very tightly bound by vemurafenib with estimated Kd below 50 nM. Bold text indicates the kinases tested for inhibition by vemurafenib with in-vitro kinase assays.
Download links
A two-part list of links to download the article, or parts of the article, in various formats.
Downloads (link to download the article as PDF)
Open citations (links to open the citations from this article in various online reference manager services)
Cite this article (links to download the citations from this article in formats compatible with various reference manager tools)
BRAF inhibitors suppress apoptosis through off-target inhibition of JNK signaling
eLife 2:e00969.
https://doi.org/10.7554/eLife.00969


