Rasgrp1 mutation increases naïve T-cell CD44 expression and drives mTOR-dependent accumulation of Helios+ T cells and autoantibodies
- John Curtin School of Medical Research, The Australian National University, Australia
- University of California, San Francisco, United States
- Canberra Hospital and ANU Medical School, The Australian National University, Australia
- University of Calgary, Canada
- Genomics Institute, Novartis Research Foundation, United States
- Howard Hughes Medical Institute, University of California, San Francisco, United States
Figures
Figure 1 with 1 supplement
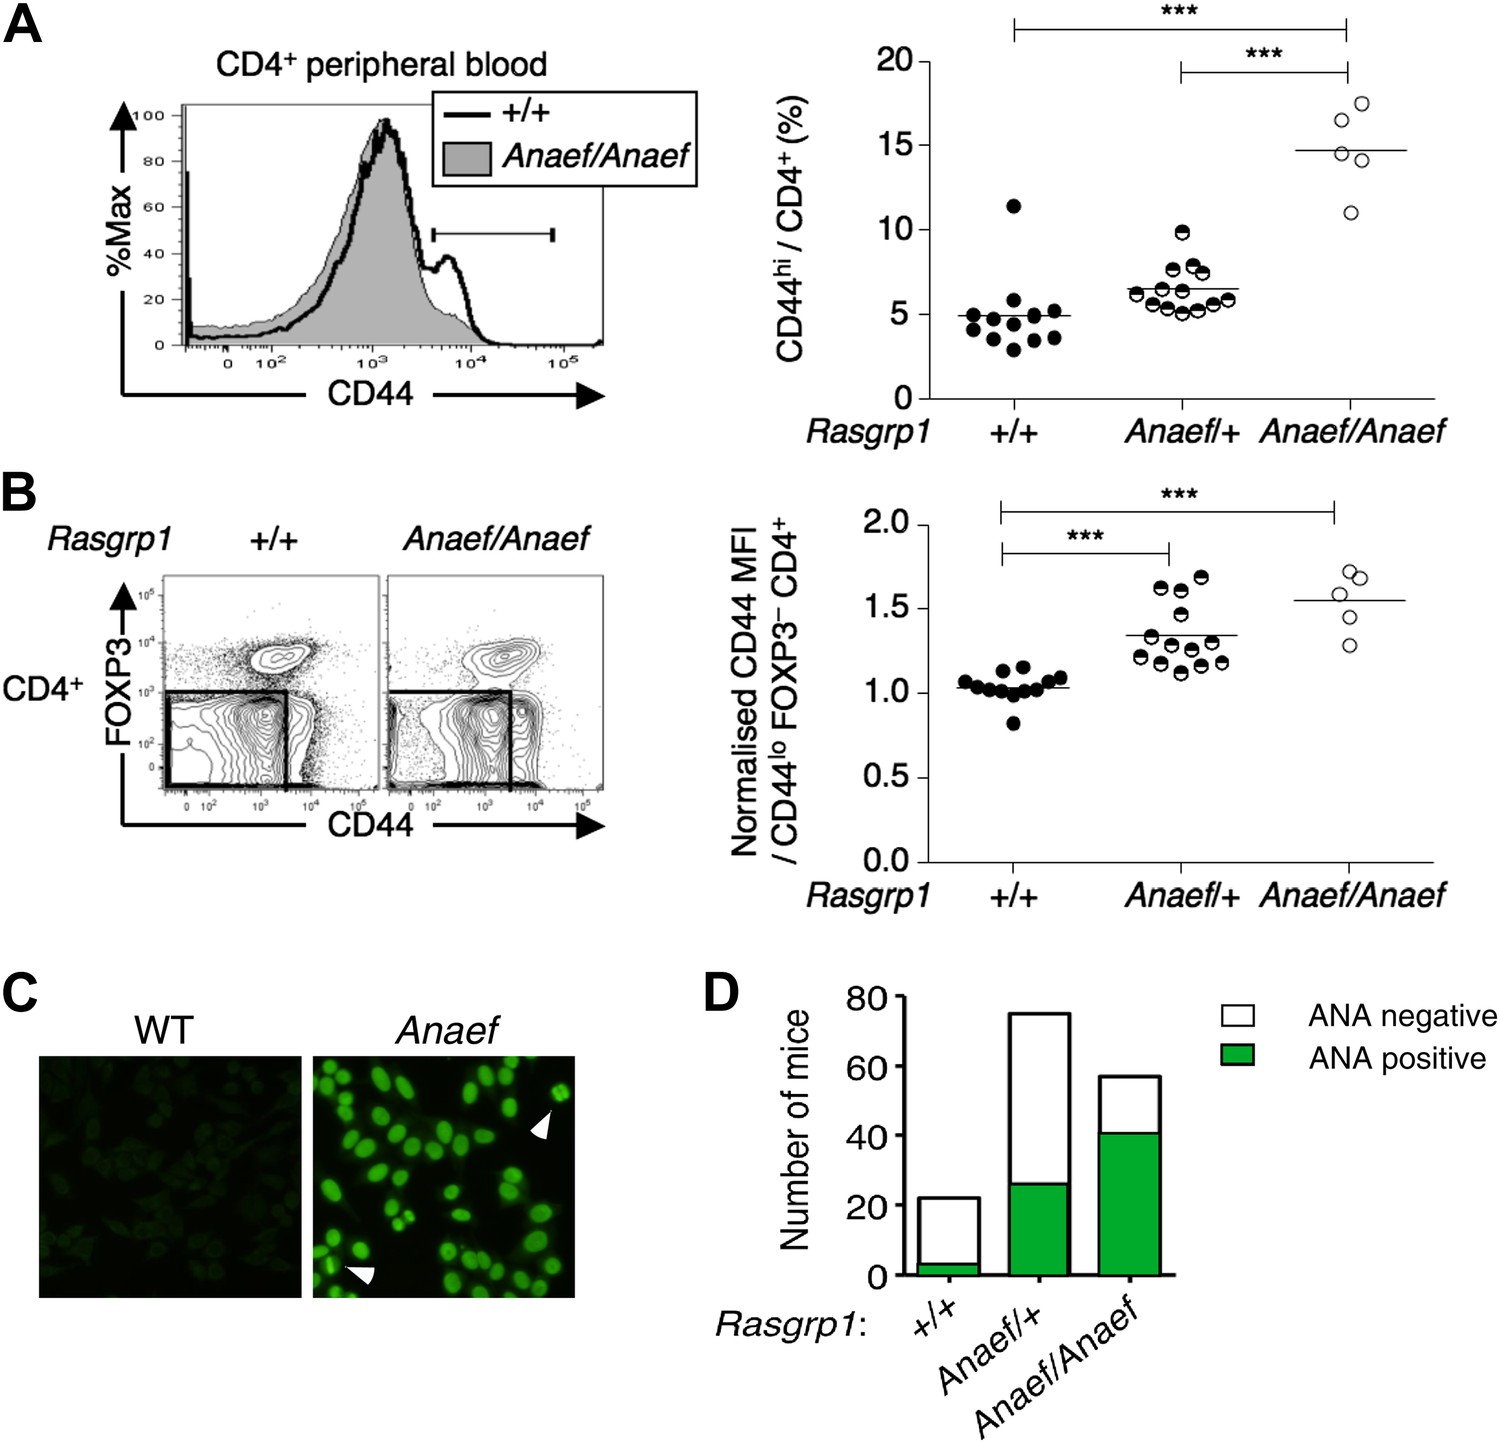
An ENU mouse mutant with increased CD44hi CD4 cells and anti-nuclear autoantibodies.
(A and B) Representative flow cytometry showing on peripheral blood CD4+ cells (A) CD44 expression with the gate used to define CD44hi cells and (B) FOXP3 vs CD44 phenotype including normalized CD44 Mean Fluorescence Intensity (MFI) of the gated CD44lo FOXP3− subset from Rasgrp1+/+ (WT), heterozygous Rasgrp1Anaef/+ or homozygous Rasgrp1Anaef/Anaef mice. Statistical analysis (right) used unpaired Student’s t tests where each symbol represents an individual mouse; ***p<0.001. (C) Antinuclear antibodies (ANA) in diluted blood plasma from a B6xB10. Rasgrp1Anaef mouse and wildtype littermate, measured by indirect immunofluorescence on HEp-2 cells. Note homogeneous nuclear staining of interphase cells and positive chromatin bars in dividing cells (marked with arrow). Magnification 20 ×. (D) Quantitation of positive ANA results for wildtype, Rasgrp1Anaef/+ and Rasgrp1Anaef/Anaef C57Bl/6xC57Bl/10 siblings tested at 15 weeks of age.
Figure 1—figure supplement 1
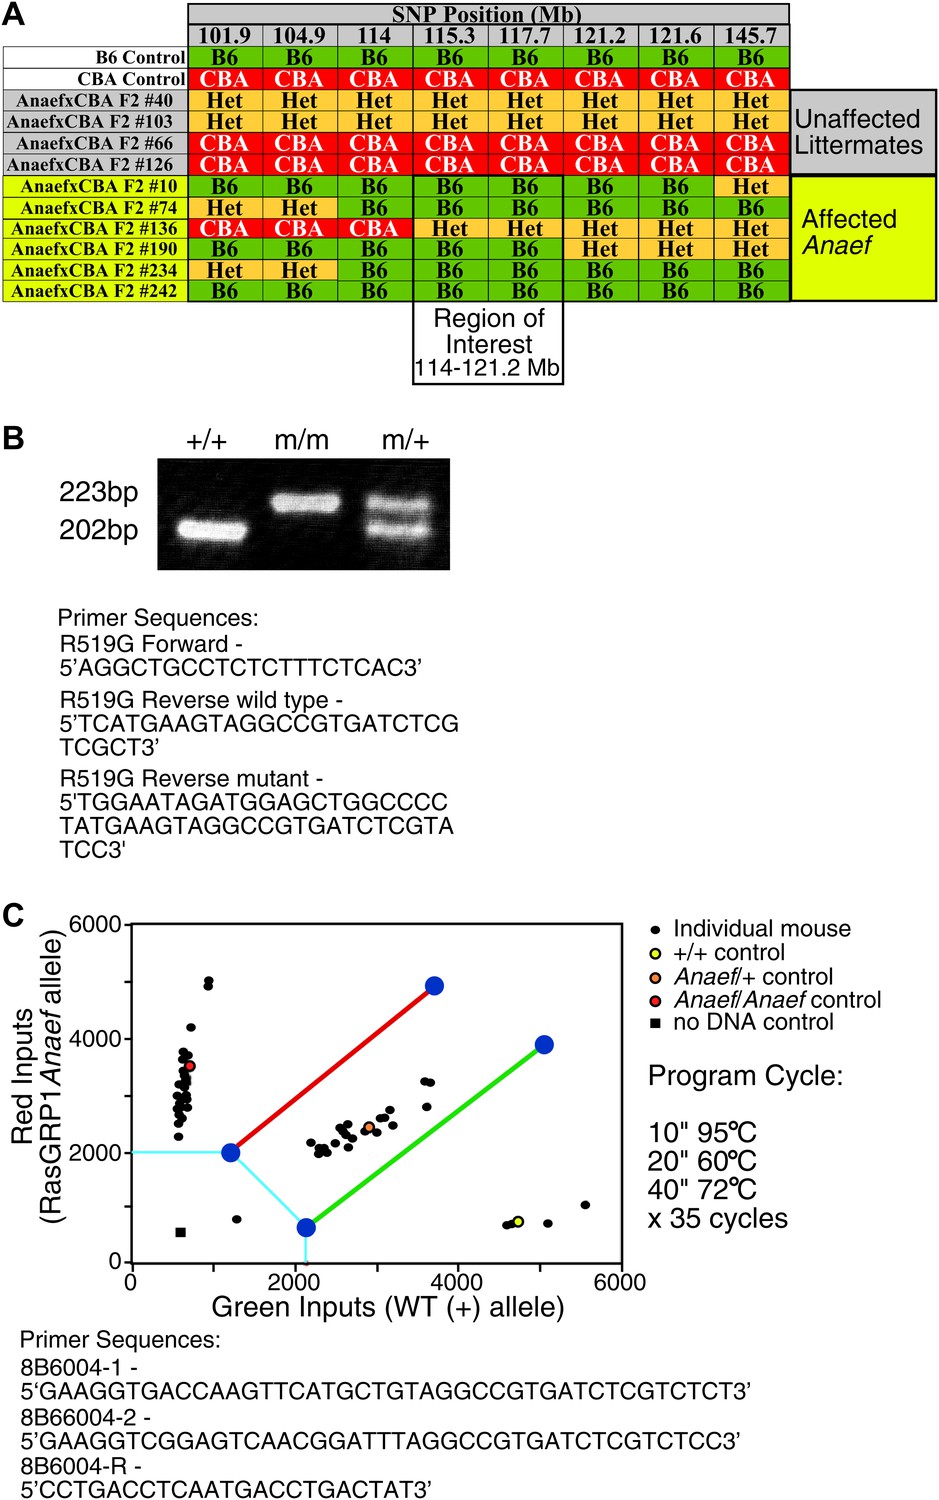
Mapping and genotyping of the Rasgrp1 mutation in ENU mutant mice with anti-nuclear antibodies and CD44hi phenotype.
(A) SNP analysis of a cohort of F2 mice generated by outcrossing a B6 animal identified as ‘affected’ with CBA, then incrossing F1 offspring to produce the (ENU.B6 × CBA/J) F2 animals listed. Phenotypes of affected mice tracked with a genomic region between 114–121.2 on chromosome 2. The Rasgrp1 gene lies in this interval. (B) Genotyping of Rasgrp1Anaef/Anaef, Rasgrp1Anaef/WT, and wildtype mice in the Roose lab was performed using MS-PCR as described (Rust et al., 1993; Bottema and Sommer, 1993). Products are wt: 202 bp and R519G: 223 bp. (C) Genotyping of Rasgrp1Anaef/Anaef, Rasgrp1Anaef/WT, and wildtype mice using Amplifluor PCR in the Goodnow Lab. The Rasgrp1Anaef strain was established through ethylnitrosourea (ENU)-mediated mutagenesis of B6 mice at the Australian National University as previously described (Randall et al., 2009).
Figure 2
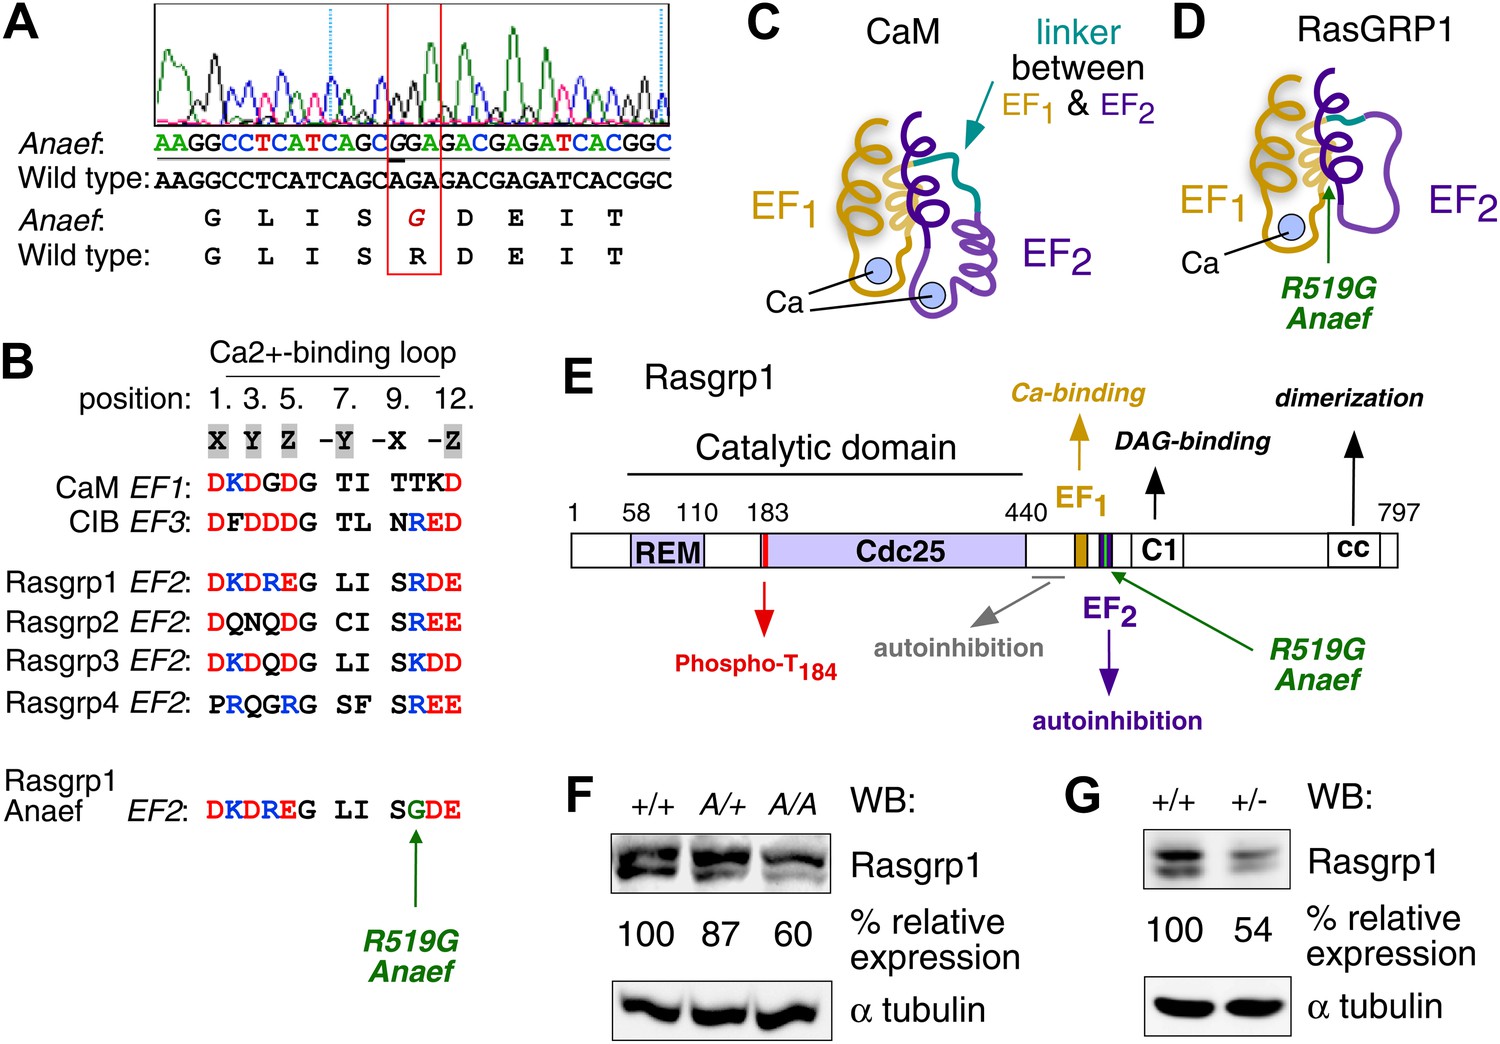
Mapping of the ENU mutation to the autoinhibitory second EF hand domain in Rasgrp1.
(A) Sequence trace of Rasgrp1Anaef exon 13 aligned to wildtype Rasgrp1 sequence. (B) Sequence comparison of CaM (calmodulin), CIB (calcium and integrin binding protein) and Rasgrp1, -2, -3 and -4 EF hands with conserved residues highlighted. (Acidic, red; Basic, blue; Calcium-binding residues, highlighted in grey; ENU-mutated residue in green). (C and D) Model of a typical pair of EF hands with two calcium (Ca)-binding loops each flanked by N- and C-terminal α-helices based on CaM (C). Model including the atypical second EF hand in RasGRP1 (D). RasGRP1’s second EF hand does not bind calcium and the E helix has evolved into an autoinhibitory domain (Iwig et al., 2013). (E) Linear schematic of Rasgrp1 protein domains, phosphorylation site threonine 184, and position of R519G mutation in the second EF hand that evolved into a domain for autoinhibition. (F and G) Western blot for Rasgrp1 protein in thymocytes from Rasgrp1Anaef/Anaef (A/A), heterozygous Rasgrp1Anaef/WT (A/+), heterozygous Rasgrp1Null/WT (+/−), and wildtype (+/+) mice. Blot was reprobed for α tubulin as a loading control. Relative Rasgrp1 expression was calculated and is shown. Note the expression of Rasgrp1’s typical doublet, thought to be due to alternative translation initiation (Poon and Stone, 2009). Representative blots of at least three independent experiments.
Figure 3 with 1 supplement
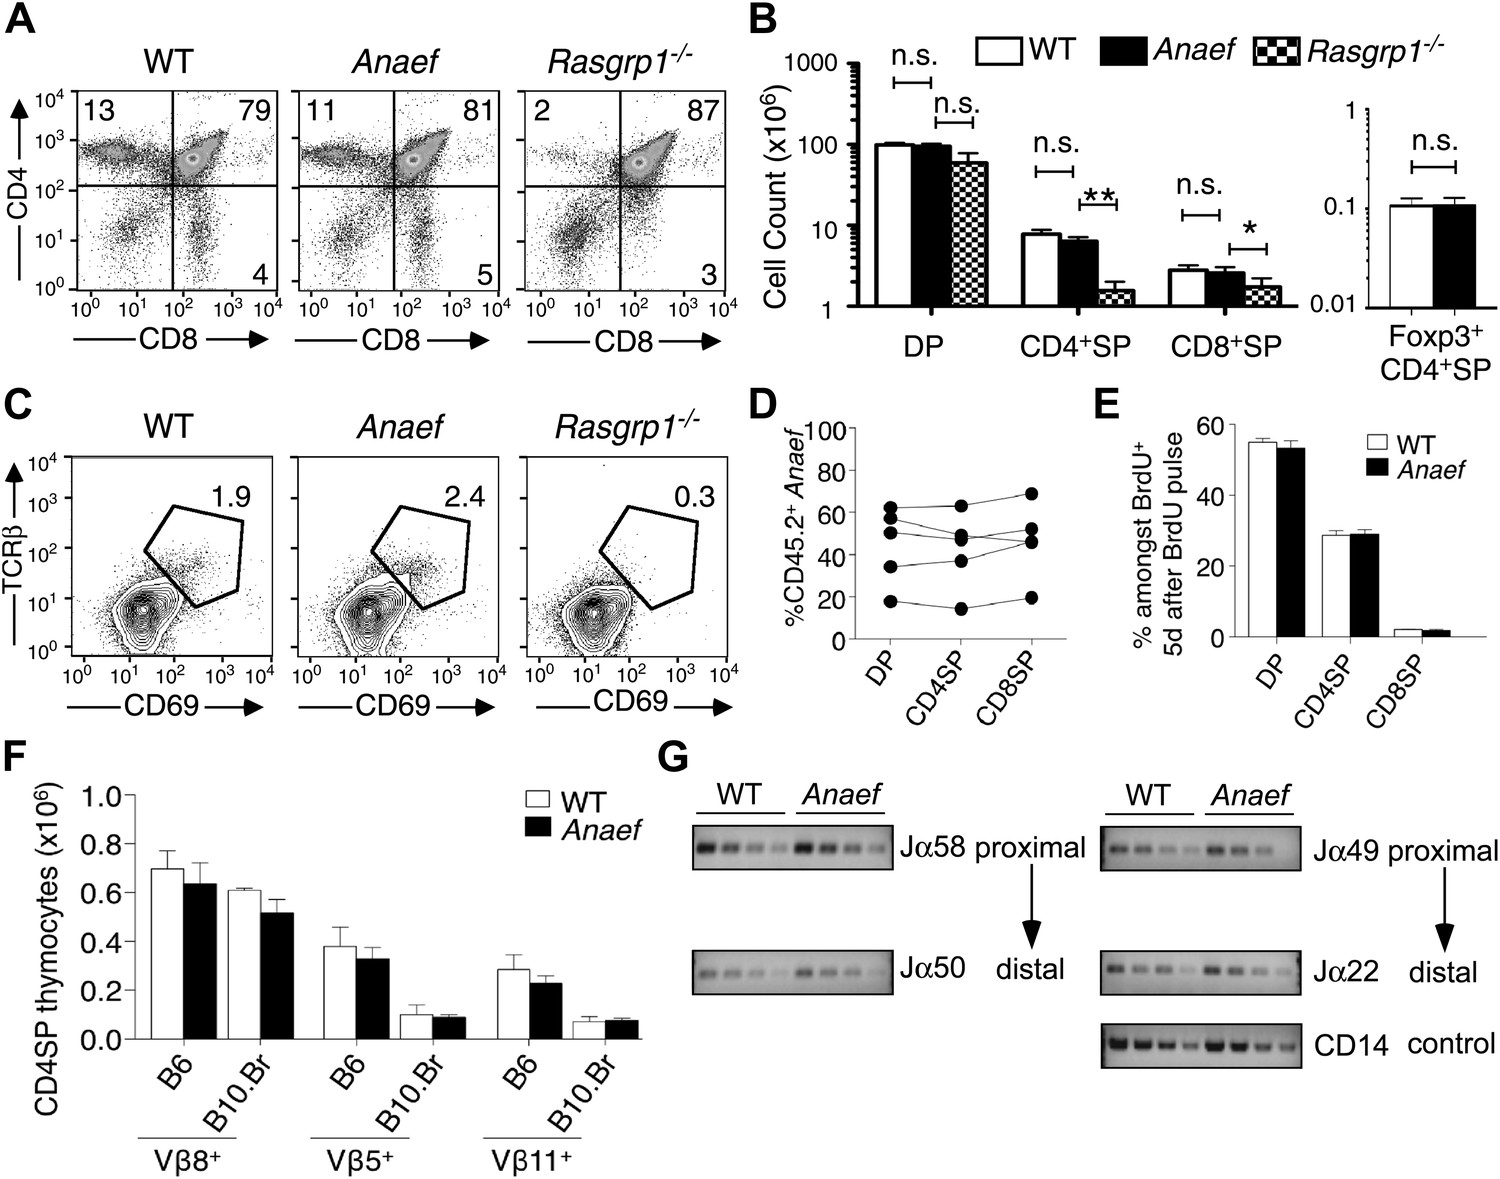
Rasgrp1Anaef differs from Rasgrp1null by preserving T cell selection in the thymus.
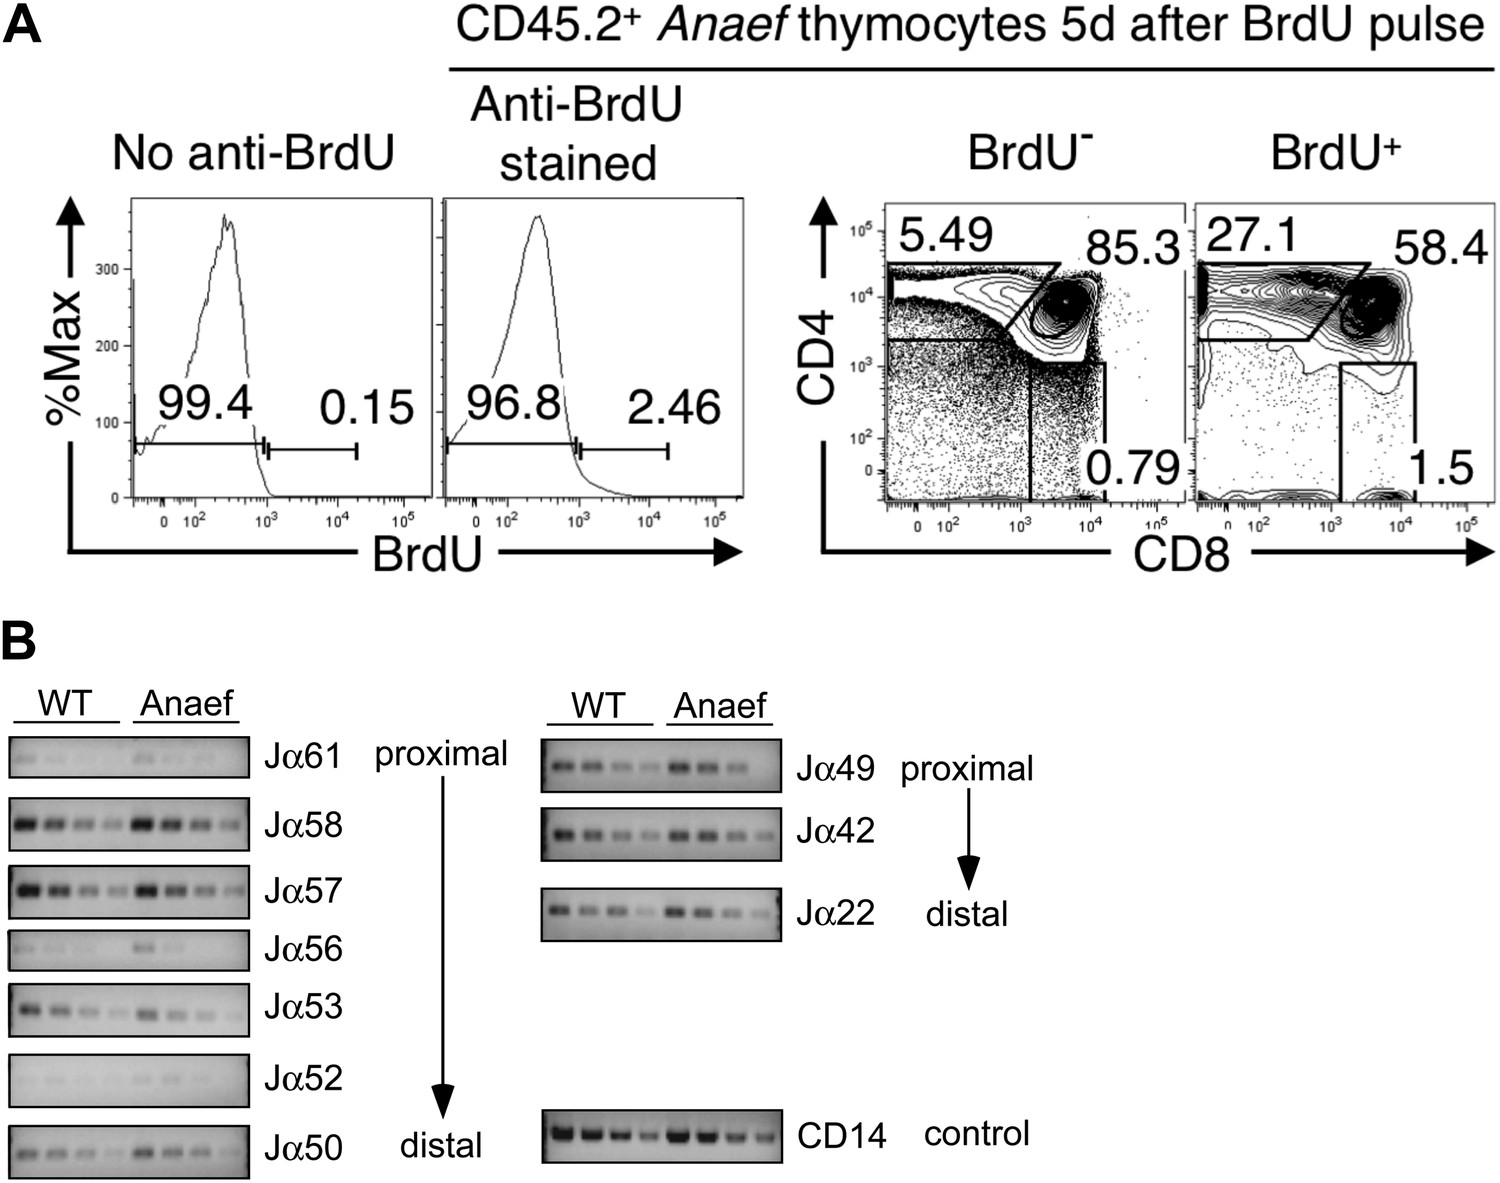
(A) CD4/CD8 phenotype of thymocytes in wildtype, Rasgrp1Anaef, and Rasgrp1-/- mice. (B) Number of DP, CD4SP and CD8SP as well as Foxp3+ CD4SP thymocytes in wildtype (n = 36), Rasgrp1Anaef (n = 35), and Rasgrp1−/− (n = 3) mice. Student’s t tests p value symbols: **p<0.005, *p<0.05. (C) Percentages of CD69hi TCRβhi cells among DP cells. Representative of three mice per genotype. (D) Competitive repopulation of thymic subsets in irradiated CD45.1+ B6 recipient mice reconstituted with a mixture of CD45.1+ WT and CD45.2+ Rasgrp1Anaef bone marrow cells. The percentage of CD45.2+ cells amongst the indicated thymocyte subsets was determined 8 weeks after reconstitution. Lines connect measurements from individual mice. Data are representative of three separate chimera cohorts. (E) Mixed bone marrow chimeras bearing CD45.1+ WT and either CD45.2+ WT or CD45.2+ Rasgrp1Anaef hematopoietic cells were injected i.p. with 1 mg BrdU 5 days before analysis. The percentages of DP, CD4SP and CD8SP cells amongst BrdU-labeled CD45.2+ Rasgrp1Anaef (black columns) or CD45.2+ WT (white columns) thymocytes were determined and the mean ± SEM (n = 5 mice per group) is shown. See Figure 3—figure supplement 1A for flow cytometry gates. (F) Mean ± SEM number of CD4SP thymocytes expressing TCR Vβ8, which is not superantigen reactive, or Vβ5 or Vβ11 that recognize endogenous retroviral superantigen presented by the I-E MHCII molecule, comparing B6 mice lacking I-E and B10.BR expressing the I-E (n = 3 mice per group compiled from two experiments). (G) Analysis of Jα usage in sorted CD4SP thymocytes of wildtype or Rasgrp1Anaef mice following published methods. PCR was performed using serial 1:2 dilutions of template DNA with primer sets that reveal rearrangements proximal (Jα58, Jα49) or distal (Jα50, Jα22) to the two promoters. Figure 2G is representative of three independent experiments. See Figure 3—figure supplement 1 for details on promoter use, additional Jα segments, and published methods.
Figure 3—figure supplement 1
Comparison of thymocyte maturation kinetics in WT and Rasgrp1Anaef.
(A) Gating strategy to analyze thymocyte maturation kinetics in Figure 2E. Histograms and plots show CD45.2+ Anaef thymocytes in mixed chimeras bearing CD45.1+ WT plus CD45.2+ Anaef hematopoietic cells. The histogram second from the left shows gates defining BrdU− and BrdU+ subsets of CD45.2+ Anaef thymocytes, each of which was analyzed for CD4 vs CD8 expression in the right two plots. The CD4/CD8 plots indicate that the BrdU+ subset has a higher frequency of SP cells, demonstrating the specificity of the BrdU+ gate. Gating defining DP, CD4SP and CD8SP subsets amongst BrdU+ cells (far right plot) were used to compile Figure 2E. (B) Analysis of Jα usage in sorted CD4+ SP thymocytes of wildtype or Anaef mice following published methods (Abarrategui and Krangel, 2006). PCR was performed using serial 1:2 dilutions of template DNA with primer sets. Primer sequences for the PCR were identical to those formerly reported (identity of sequences between 129 mice and C57/Bl6 mice was verified in the databases). Two promoters regulate the rearrangements; TEA (T-Early-α), which regulated Jα61 to Jα50 and the Jα49 promoter that regulated Jα49 and more distal segments such as Jα22. As described, CD14 was used as control. A representative experiment with CD4+ SP from three independent experiments is shown here. We did not observe significant differences in Jα segments between DP thymocytes from wildtype and Rasgrp1Anaef mice either (not shown).
Figure 4 with 1 supplement
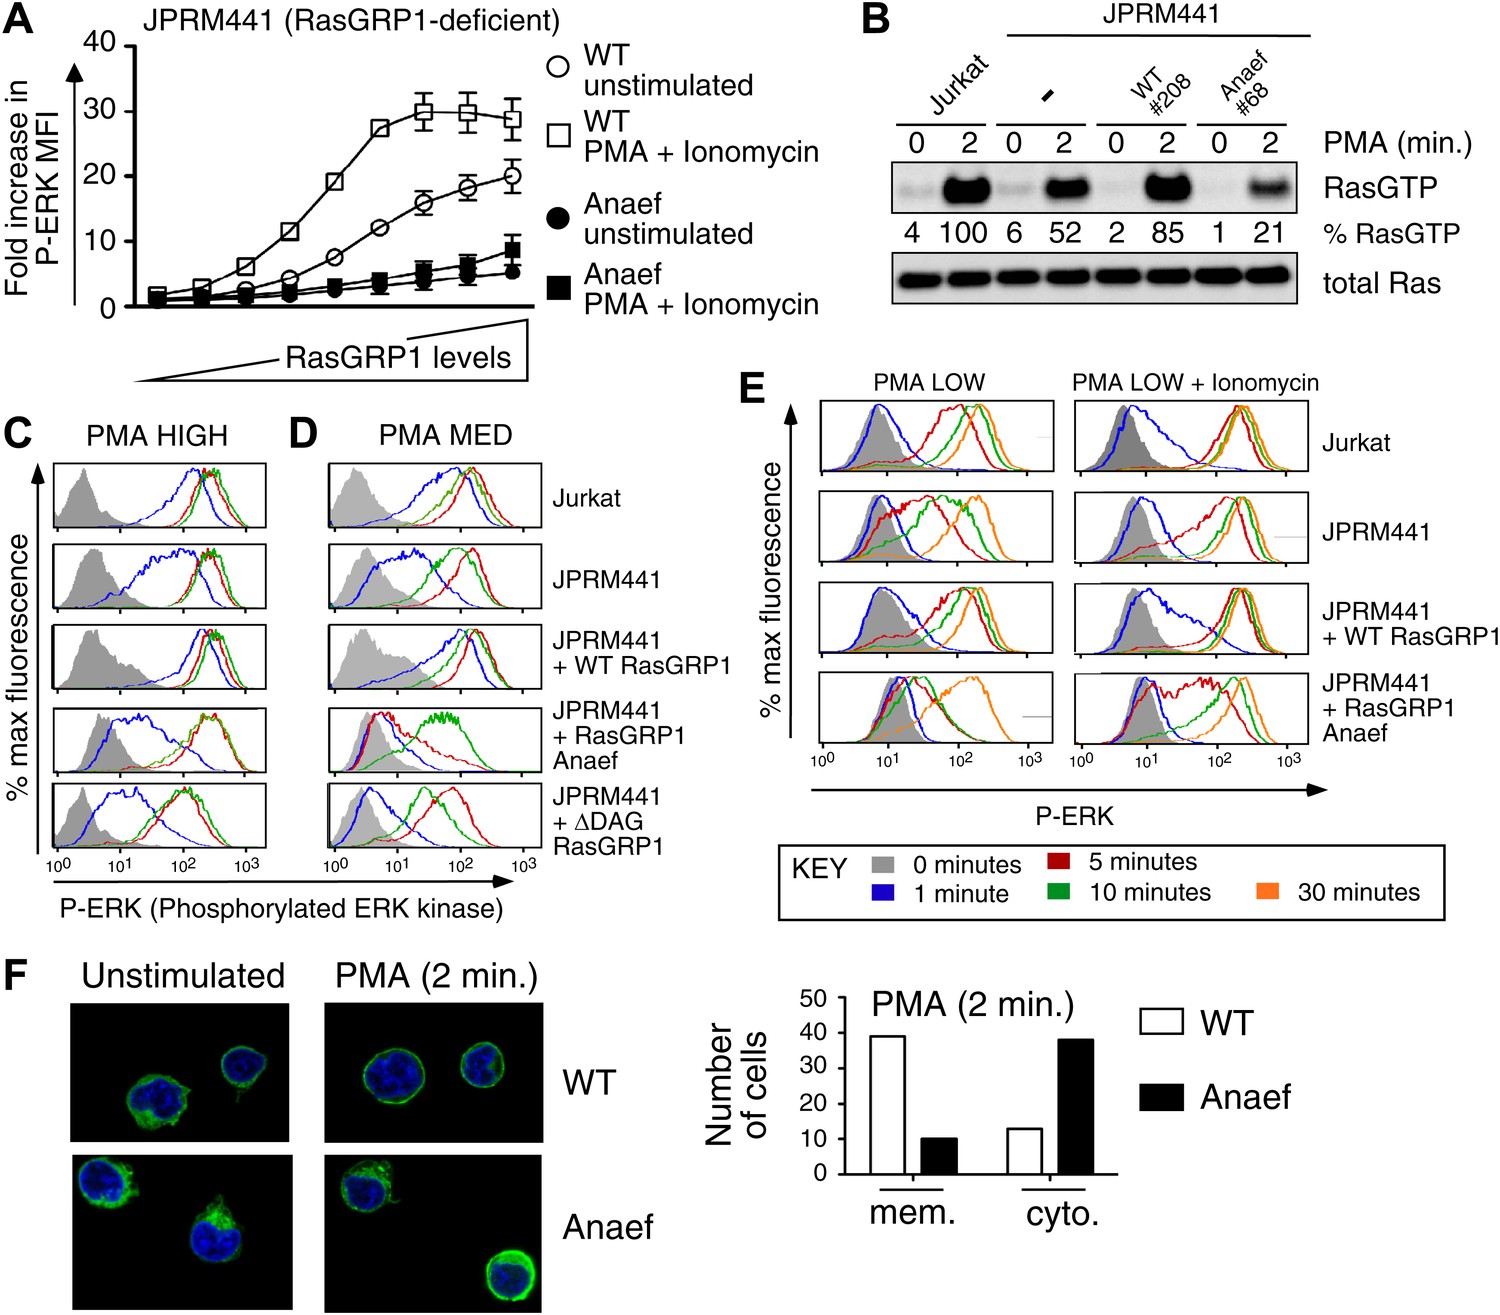
Rasgrp1Anaef diminishes in vitro signaling to Ras and ERK.
(A) RasGRP-1 deficient Jurkat cells (JPRM441) were transiently transfected with EGFP-tagged wildtype- or Anaef-RasGRP1 and RasGRP1-dose/P-ERK responses were determined by FACS. (B) Jurkat, JPRM441, and JPRM441 cells stably reconstituted with Anaef- or WT Rasgrp1 were left unstimulated or stimulated with 25 ng/ml PMA and RasGTP levels were determined through a RasGTP pull down assay. (C–E) The indicated cell lines were stimulated for 0, 1, 5, 10, or 30 min (see key) with a high (25 ng/ml, C), medium (5 ng/ml, D), or low dose (2 ng/ml, E) of PMA, or with 2 ng/ml PMA with ionomycin (1 μM) and stained for intracellular phosphorylated-ERK-1 and -2 (P-ERK), and analyzed by flow cytometry. Results for JPRM441-Rasgrp1Anaef clones #68 are shown, similar results were obtained with clone #69. (F) EGFP-tagged constructs were transiently transfected into JPRM441 and RasGRP1 localization was determined for unstimulated and PMA-stimulated cells as described in the text. 50 images for the 2-min PMA stimulation were scored in a blinded manner and plotted with RasGRP1-Anaef in the black columns.
Figure 4—figure supplement 1
Biochemical aspects of the Rasgrp1Anaef allele.
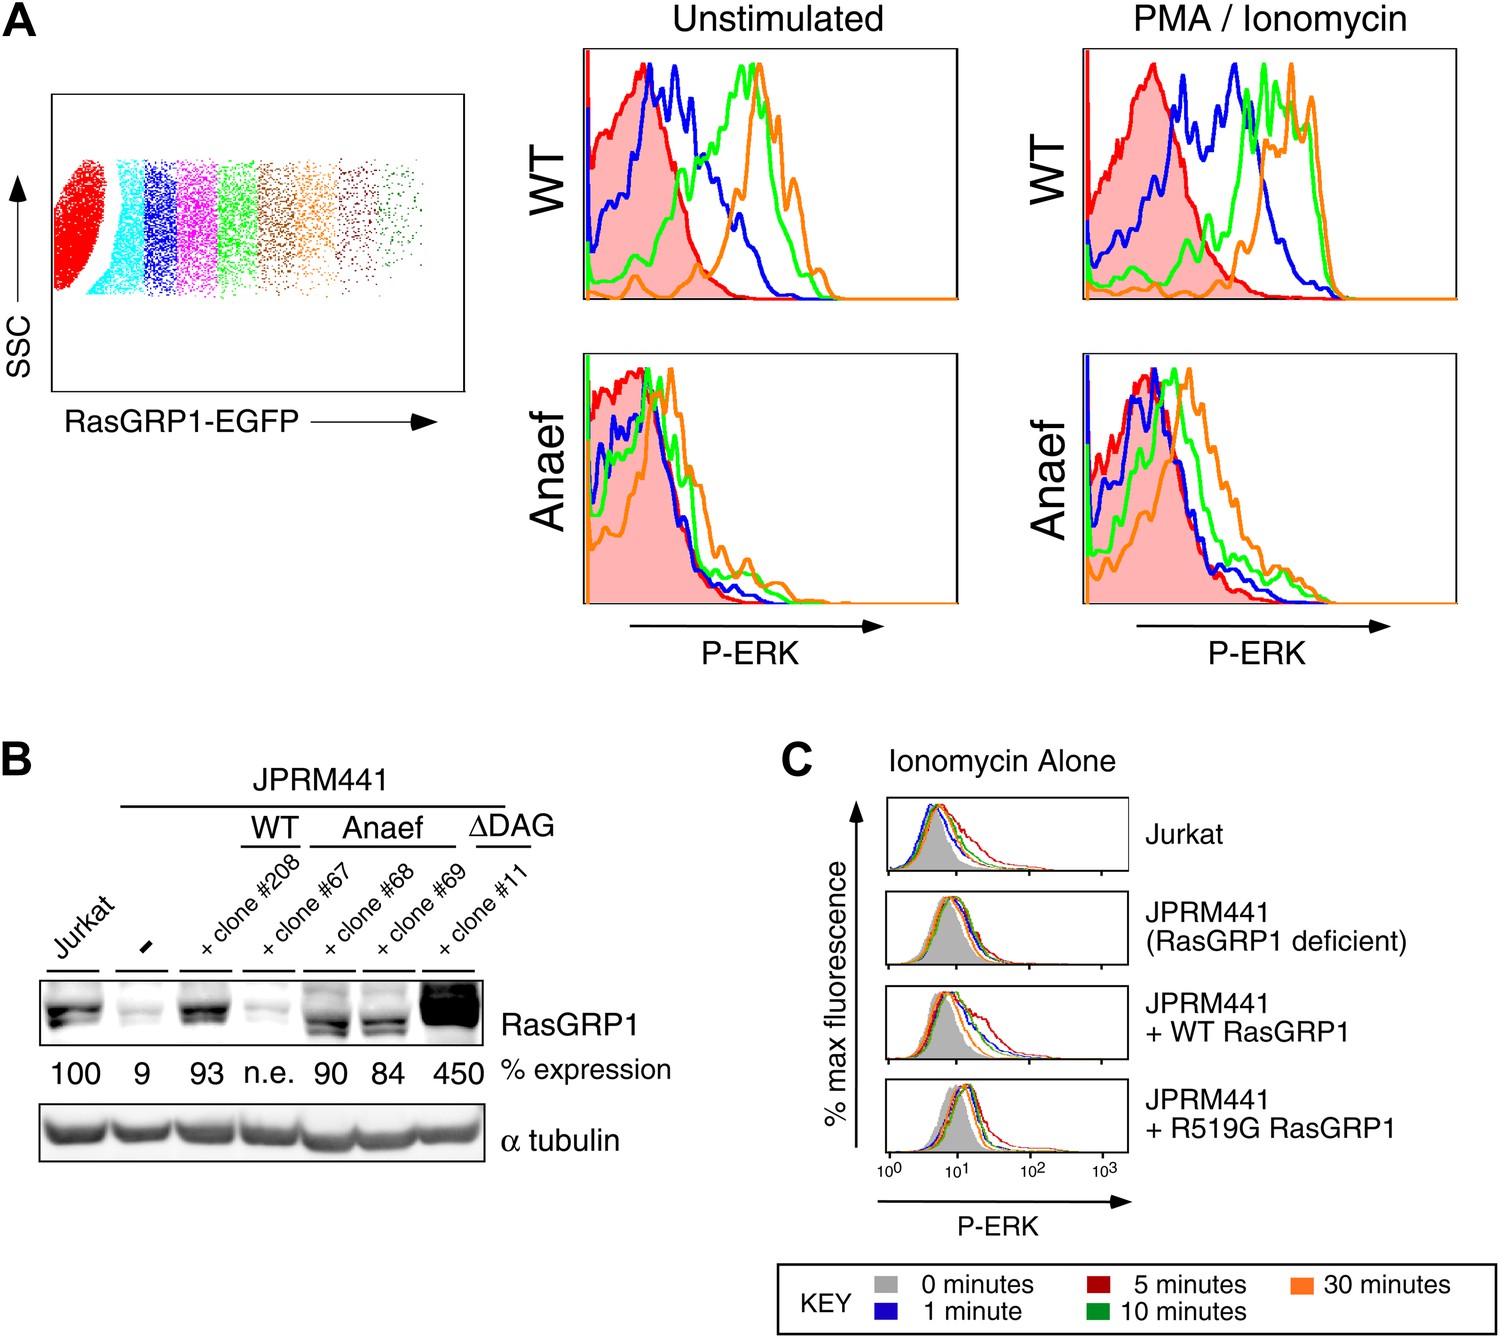
(A) Gating strategy for transiently expressed RasGRP1-EGFP in JPRM441 cells and analysis of ERK phosphorylation of cells expressing increasing doses of wildtype of Anaef RasGRP1 as depicted in the blue (second), green (fourth), and orange (sixth) color-coded cell populations, compared to ERK phosphorylation without transfected RasGRP1 in the filled brown histogram. (B) JPRM441 were stably reconstituted with a construct expressing Rasgrp1Anaef (clones #67, 68, 69). Protein lysates from an equivalent number of cells were probed for expression of Rasgrp1 and α tubulin (loading control). Percent expression of Rasgrp1 in each cell line (relative to the parental wildtype Jurkat) is shown. Rasgrp1Anaef protein levels in clones #68 and #69 were similar to those found in the parental Jurkat cell line and to expression of wildtype Rasgrp1 in a reconstituted JPRM441 clone 208 that we previously characterized (Roose et al., 2005) and were utilized in subsequent assays. (C) Ionomycin-induced P-ERK responses. The depicted stable cell lines were stimulated with ionomycin (1 μM) for the indicated times and stained for intracellular p-ERK. Representative histograms are shown.
Figure 5 with 2 supplements
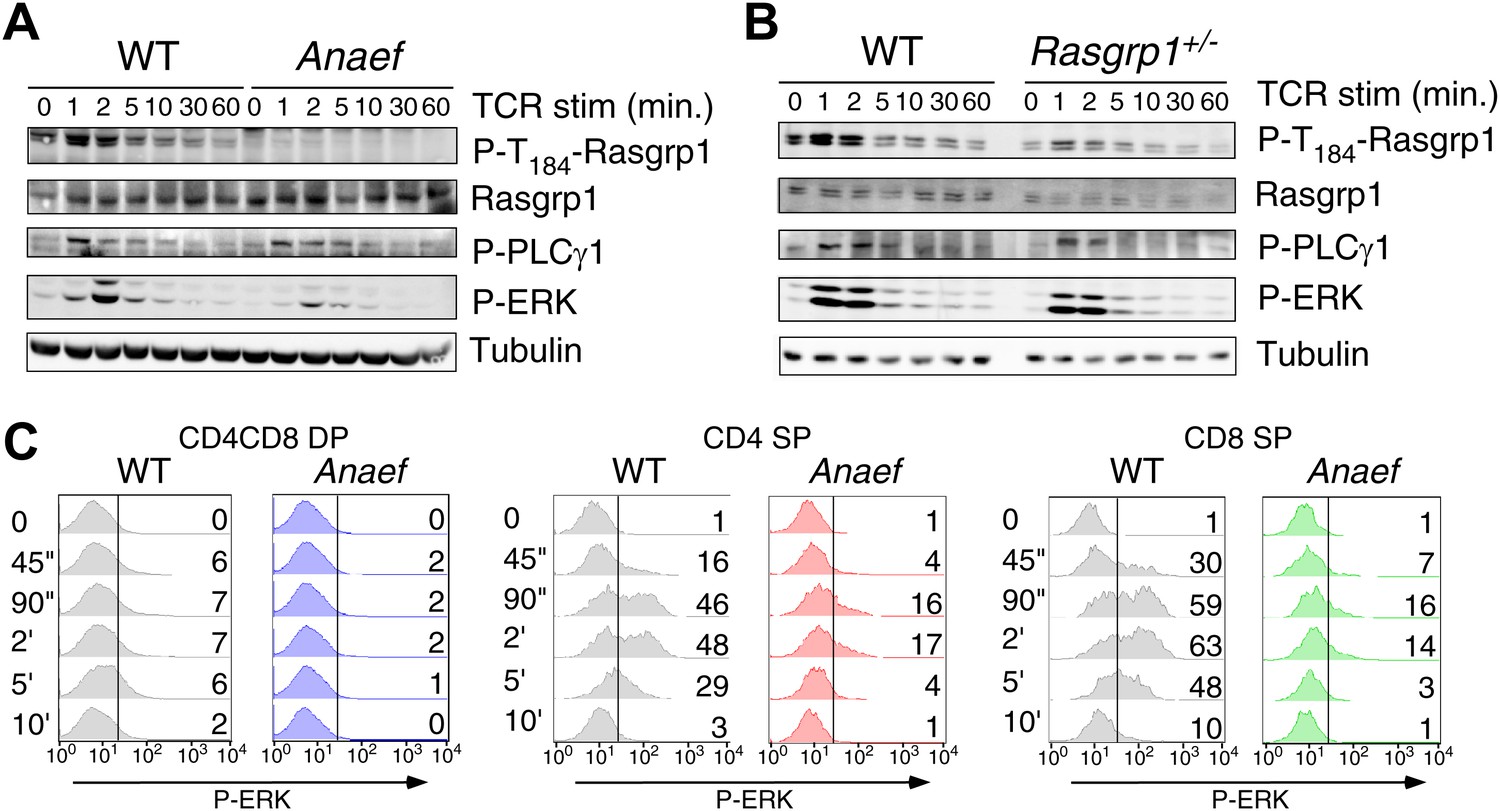
Rasgrp1Anaef signaling characteristics of in vitro stimulated thymocytes.
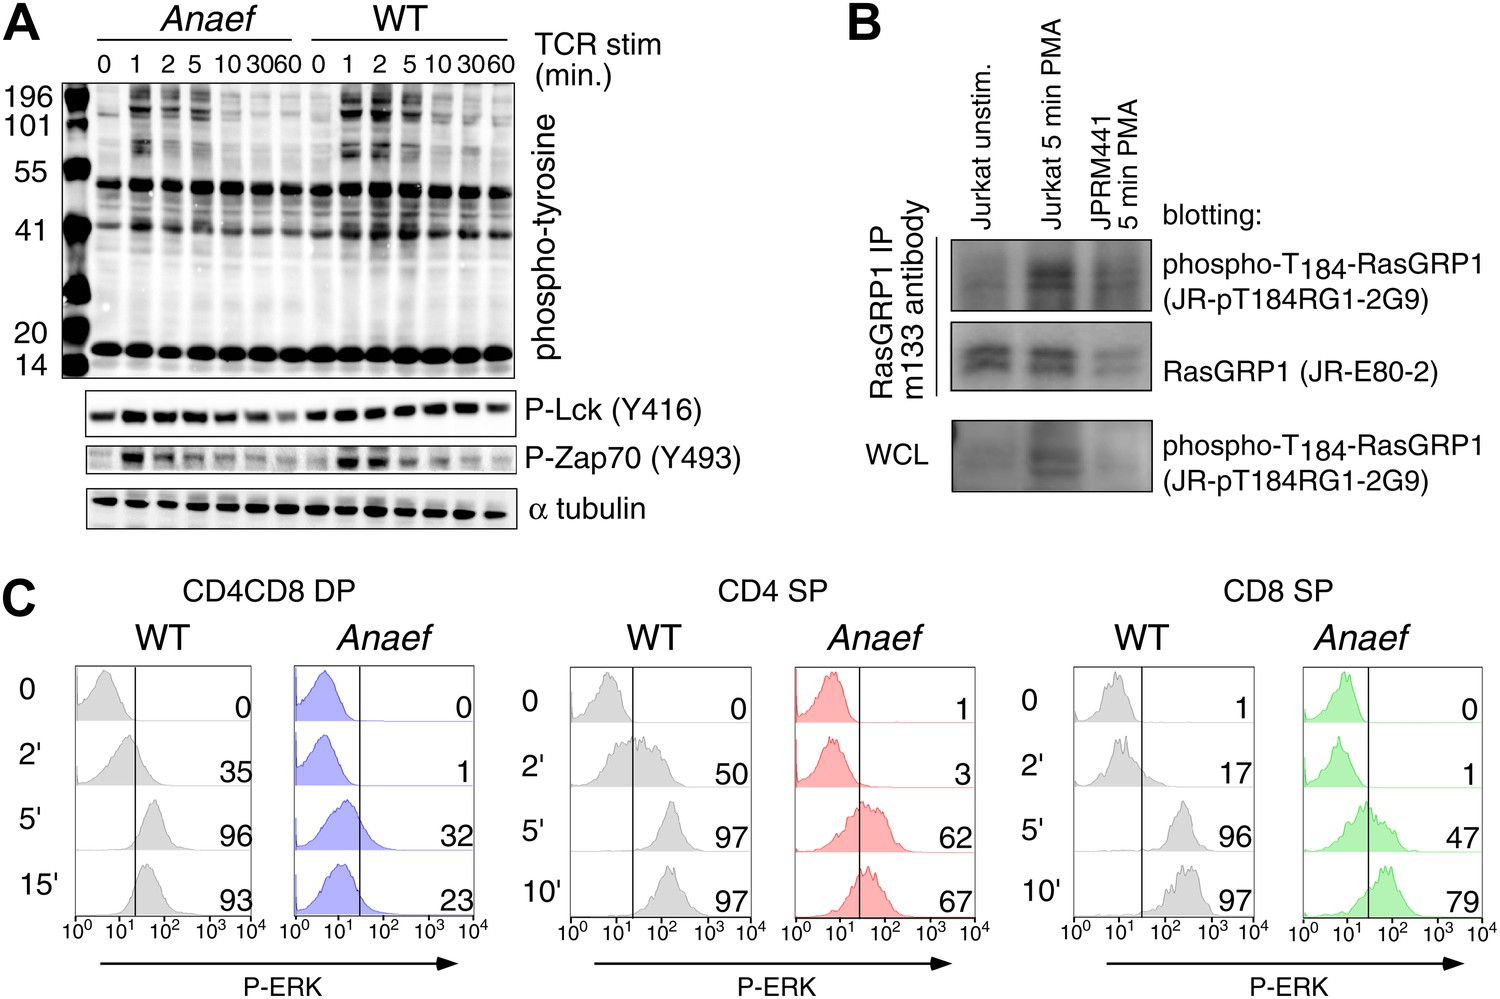
(A and B) Phosphorylation of PLCγ1, Rasgrp1, and ERK in total thymocytes from Rasgrp1Anaef and age-matched WT mice or Rasgrp1+/− and age-matched WT mice stimulated with anti-CD3 antibodies. (C) P-ERK induction by in vitro stimulation followed by intracellular flow cytometric staining and electronic gating on thymocyte subsets. Thymocytes from Rasgrp1Anaef and age-matched WT mice were stimulated with anti-CD3 antibody (5 μg/ml) and crosslinked using secondary antibody (Goat anti-hamster, 20 μg/ml) for the indicated time points, fixed, and stained for intracellular p-ERK. Histograms show P-ERK staining on electronically gated DP, CD4SP or CD8SP thymocytes. These conditions yielded low-levels of ERK phosphorylation that is typically observed for wildtype DP thymocytes. Numbers indicate the percentages of cells above the arbitrarily set reference point in the histograms so that it can be appreciated how many cells within each population cross this P-ERK threshold. Data is representative of three independent experiments. For PMA-induced responses see Figure 5—figure supplement 1D.
Figure 5—figure supplement 1
Signaling characteristics of Rasgrp1Anaef thymocytes.
(A) Thymocytes from Rasgrp1Anaef and age-matched WT mice were stimulated with anti-CD3 antibody (clone 2C11, 10 μg/ml) and whole cell lysates were analyzed for induction of tyrosine phosphorylated proteins (4G10) and for specific phospho-Lck and phospho-Zap70 residues. ? tubulin is a loading control. Surface TCR expression levels on Rasgrp1Anaef thymocytes were indistinguishable from wildtype (data not shown). (B) Characterization of JR-pT184RG1-2G9 monoclonal antibody. Whole cell lysates (WCL) or RasGRP1 immunoprecipitations with m133 monoclonal antibody of the indicated cell samples were subjected to western blot analysis with JR-pT184RG1-2G9 antibody. Note the induction of phosphorylated RasGRP1 in PMA-stimulated Jurkat cells and the reduction of this phosphor-RasGRP1 species in JPRM441 cells. Backblotting for total RasGRP1 levels was performed using a JR-E80-2 monoclonal antibody that recognizes human RasGRP1. (C) P-ERK induction by intracellular flow cytometric staining and electronic gating on thymocyte subsets following in vitro stimulation. Thymocytes from Rasgrp1Anaef and age-matched WT mice were stimulated with PMA (30 ng/ml) for the indicated time points, fixed, and stained for intracellular p-ERK. Histograms show P-ERK staining on electronically gated CD4+CD8+ (double positive) and CD4+ or CD8+ single positive thymocytes.
Figure 5—figure supplement 2
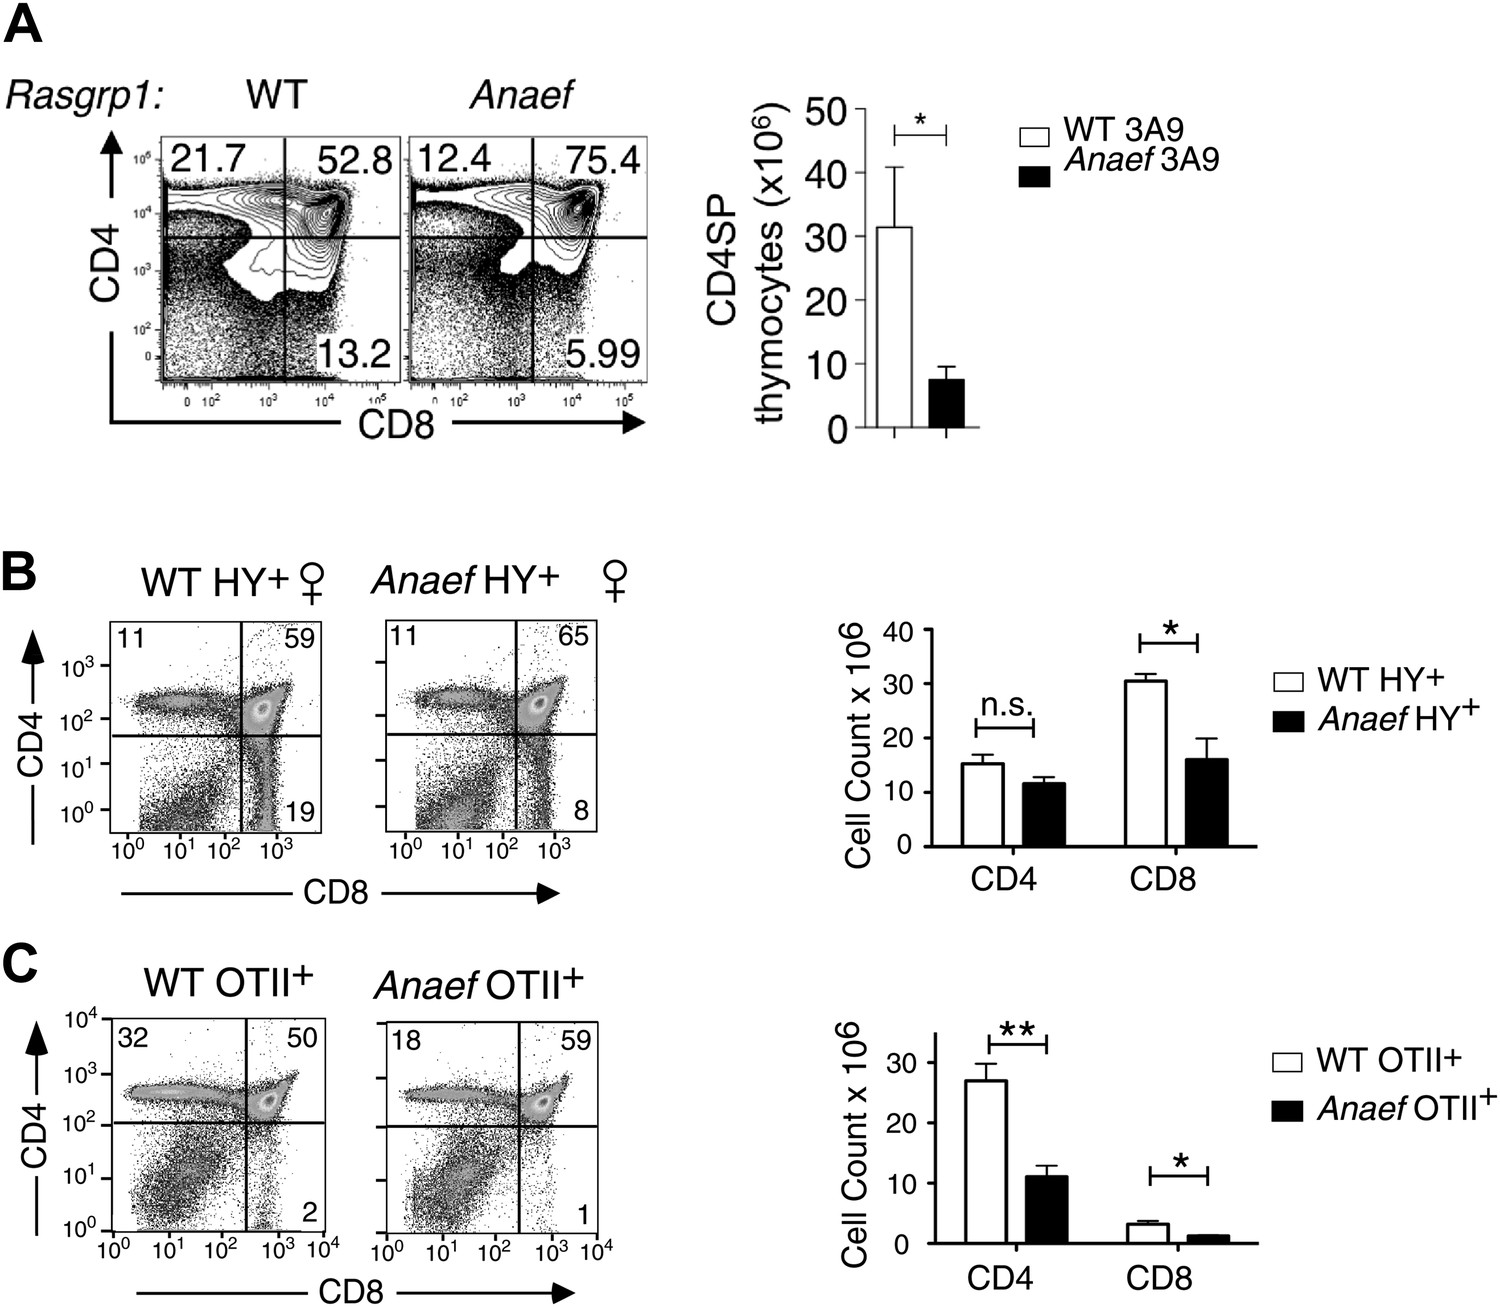
Thymic selection in Rasgrp1Anaef mice carrying transgenic TCRs.
Rasgrp1Anaef mice demonstrate a two to sixfold decrease in positive selection in the context of three different transgenic TCRs that are uniformly and strongly expressed early on during thymocyte development. (A) Representative CD4/CD8 phenotype of the thymus after reconstitution of irradiated B10.BR mice with 3A9 TCR transgenic bone marrow that was either WT or Anaef. Means and SEM number of CD4SP cells are shown on the right. Statistics used unpaired Student's t test (n = 5 per group). *p<0.05. (B) Representative flow cytometry plots and quantitiation of thymocytes in HY TCR transgenic females that facilitate positive selection of CD8 cells on MHCI. Total cell counts with mean and standard error are shown on the right (n = 4 mice). *p<0.05. (C) Representative flow cytometry plots and quantitation of thymocytes in OTII TCR transgenic mice in which CD4 SP are selected on MHCII. Representative plots and total cell counts are shown (n = 6 mice). Student's t tests p value symbols: **p<0.005, *p<0.05.
Figure 6
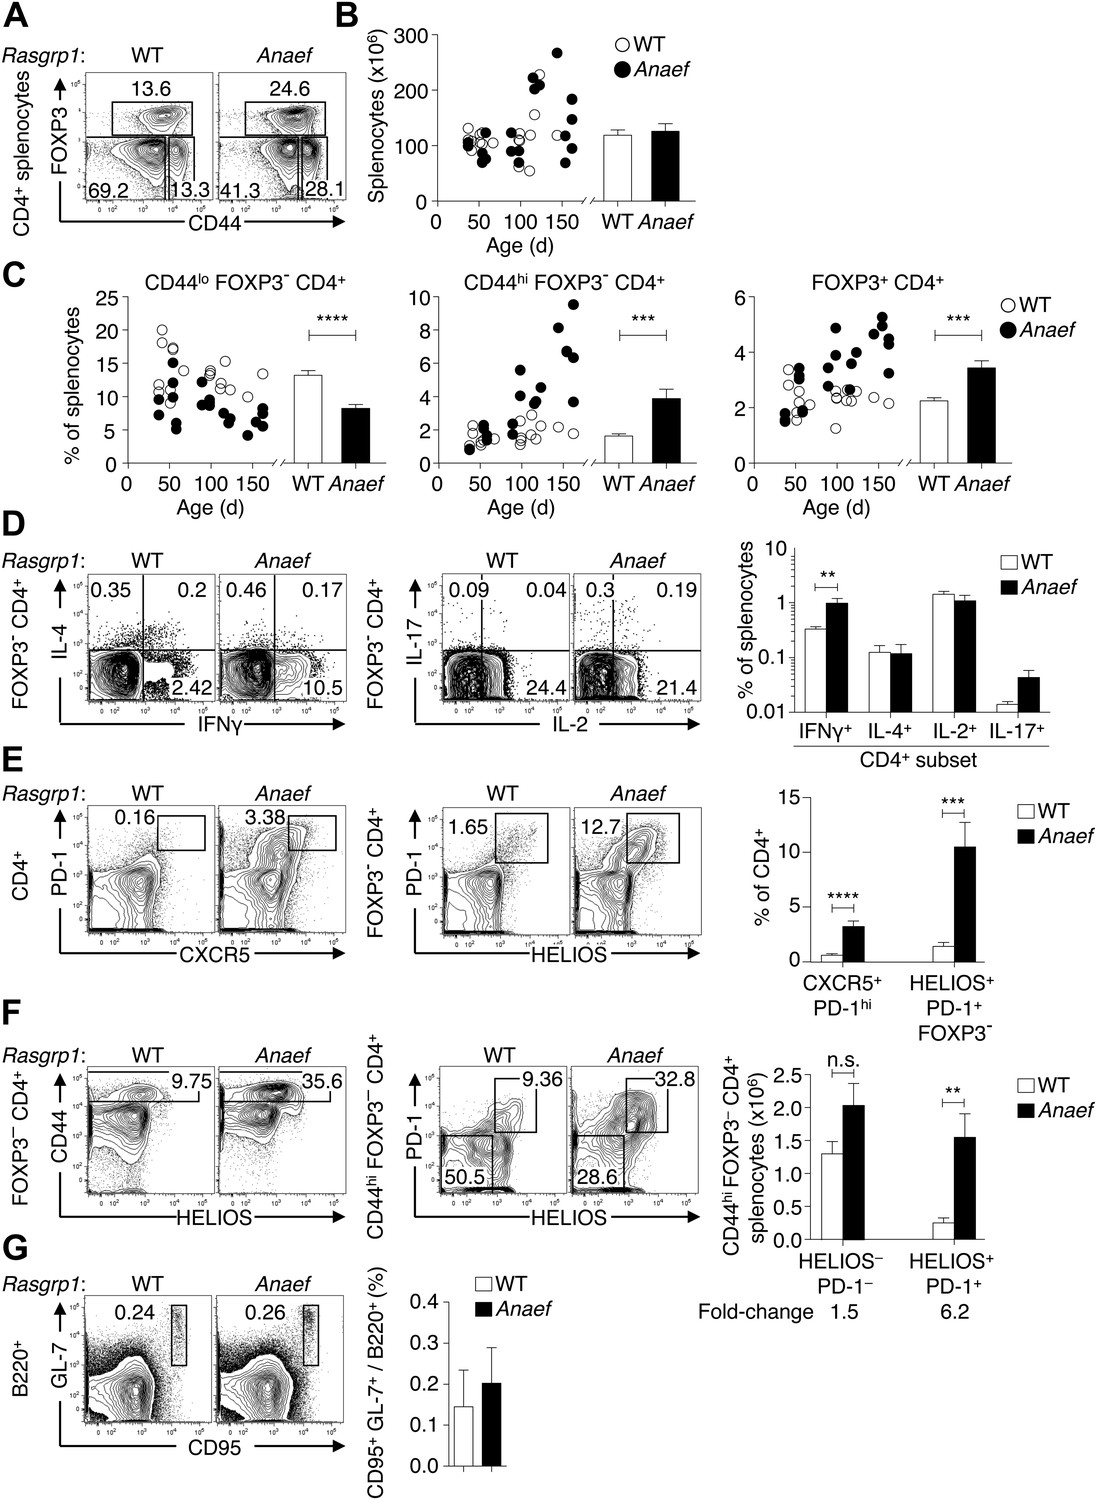
Rasgrp1Anaef results in dysregulation of peripheral CD4 T cells.
(A) Representative plots of wildtype or Rasgrp1Anaef CD4+ splenocytes subsetted into naïve (CD44lo FOXP3−), activated/memory (CD44hi FOXP3−), and T-reg (FOXP3+) populations. (B and C) Splenic cellularity and frequencies of the CD4+ subsets gated in (A) as a function of age in wildtype vs Rasgrp1Anaef mice; each dot represents one mouse (WT in white; Rasgrp1Anaef in black). Inset column graphs show the group mean ± SEM. Statistics obtained by unpaired Student’s t test. ***p<0.001, ****p<0.0001. (D) Representative intracellular labeling of IFNγ, IL-4, IL-2 or IL-17 on electronically gated Foxp3− CD4+ wildtype or Rasgrp1Anaef splenocytes that had been stimulated with PMA and ionomycin for 4 hr. Column graphs show mean ± SEM frequencies amongst all splenocytes. Statistical analysis of % IFNγ+ cells used an unpaired Student’s t test (n = 7 WT, 6 Anaef) **p<0.01. (E) Phenotype of CD4+ splenocytes showing a CXCR5+ PD-1hi gate for the TFH population (left) and a gate for the HELIOS+ PD-1+ population amongst Foxp3− CD4+ splenocytes (right). Column graph shows mean ± SEM frequencies of these populations amongst CD4+ splenocytes in wildtype or Rasgrp1Anaef mice. Statistical analyses used unpaired Student’s t tests (n = 19 WT, 18 Anaef). ***p<0.001, ****p<0.0001. (F) Helios vs CD44 phenotype of Foxp3− CD4+ splenocytes (left plots) showing the gate for the CD44hi population, which was analyzed for expression of Helios and PD-1 (right plots). Column graph shows the mean ± SEM number of splenocytes within the CD44hi Foxp3− CD4+ subpopulations gated in the right plots (n = 19 WT, 20 Anaef mice aged >70 days and compiled from 11 separate experiments). Unpaired Student’s t test **p<0.01. (G) Phenotype of B220+ splenocytes showing the CD95(Fas)hi GL-7hi gate used to define germinal center B cells (left), the mean ± SEM frequency of which is shown in the column graph (right) (n = 7 WT, 5 Anaef).
Figure 7

Role of B and T cells in Rasgrp1Anaef-induced Helios+ PD-1+ CD4+ T cell and autoantibody formation.
(A–E) B6.Cd79a−/− mice lacking B cells were intercrossed with B6.Rasgrp1Anaef mice to produce mice with the genotypes shown above the plots. Plots (left) display phenotype of (A and B) Foxp3− CD4+ splenocytes and the gate used to define the PD-1+ HELIOS+ subpopulation and absolute numbers of these cells are shown on the column graphs (mean ± SEM). Statistical comparisons used unpaired Student’s t tests (n = 4 WT, 5 Anaef, 2 CD79a-null, and 4 Anaef.CD79a-null) *p<0.05. (C) CD4+ splenocytes and the gates used to define FOXP3+ regulatory, CD44hi FOXP3− effector/memory, and CD44lo FOXP3− naïve subsets. Absolute numbers of effector/memory splenocytes (D) and Relative CD44 expression on naive splenocytes (E) are shown in the column graphs (mean ± SEM). Statistical comparisons used unpaired Student’s t tests (n = 4 WT, 5 Anaef, 2 CD79a-null, and 4 Anaef.CD79a-null) *p<0.05, ***p<0.001. (F) Experimental design to delineate role of Rasgrp1Anaef in T and B cells. Irradiated mice received either 100% Rasgrp1WT marrow, 100% Rasgrp1Anaef marrow, or a 1:4 mixture of CD45.1+ wild-type marrow mixed with CD45.2+ marrow from either Cd79anull/nullRasgrp1WT or Cd79anull/null Rasgrp1Anaef siblings. (G) Incidence of homogeneous nuclear ANA in blood plasma in chimeric mice collected 18 weeks after irradiation, measured by immunofluorescence on HEp-2 cells and scored in a blinded manner. (H) Representative plots (left), and (I) quantification of frequency (middle) and number (right) of PD-1+ Helios+ cells among Foxp3− CD4+ splenocytes from mixed chimeras in groups A and B as described in (F) 45 weeks after irradiation. Lines in (I) connect measurements from individual mice. Statistical analysis used paired Student’s t tests within groups and unpaired t tests between groups. **p<0.01, ***p<0.001, ****p<0.0001.
Figure 8 with 1 supplement

CD44 is a sensitive reporter of mTOR activity in immature and naïve CD4+ T cells.
(A) CD44lo T cell phenotype upon which Mtorchino mice were identified. Phenotype of Foxp3− CD4+ splenocytes from Mtor+/+ (WT) and Mtorchino/chino (chino) mice, showing the CD62Lhi subset on which CD44 expression was quantified and normalized to the mean of WT animals (mean ± SEM from three experiments shown below). (B) Schematic of mTOR protein showing functional domains and the chino I205S mutation in the fifth HEAT repeat. (C) Reduced body size in chino. Body mass vs age of WT (black dots; 10 female [top], 11 male [bottom]) or chino (unfilled dots; three female, two male) mice. Curves were fitted to the WT datasets using second order polynomial equations; dotted lines show 95% prediction bands (the area expected to enclose 95% of future WT data points; GraphPad Prism version 5.0d for MAC OS X). Straight lines connect multiple measurements of individual chino mice. (D) Splenocytes from WT or chino mice were left unstimulated or were stimulated with PMA (100 ng/ml) for 10 min, fixed, and stained for intracellular phosphorylated-S6 (P-S6). Histogram overlay shows P-S6 staining on CD4+ cells representative of two separate experiments. (E) Number of DP, CD4SP and CD8SP cells per thymus of WT (n = 7) or chino (n = 7) mice compiled from four experiments. (F) Selective reduction in CD44 expression on chino thymocytes. Histograms show CD44, CD5, CD69 or TCRb expression on gated DP, CD4SP or CD8SP thymocytes from WT (solid gray) vs chino (red overlay) mice, representative of four separate experiments (n = 7 mice per group in total). (G) Histogram (left) and column graph (right, mean ± SEM) shows CD44 expression on CD4+ CD3+ B220− peripheral blood lymphocytes from littermate mice of the indicated Mtor genotypes, compiled from five separate experiments using a total of 20 Mtor+/+, 49 Mtor+/chi and 7 Mtorchi/chi mice. CD44 relative fluorescence intensity (RFI) was calculated by dividing by the mean for the Mtor+/+ group analyzed in the same experiment. Unpaired Student’s t tests: ***p<0.0001. (H) CD44 RFI on unstimulated CD4SP thymocytes of WT or Rasgrp1Anaef mice after 7 days of treatment with the indicated rapamycin doses. Untreated control was set at 1. ***p<0.005, n.s. = non significant.
Figure 8—figure supplement 1
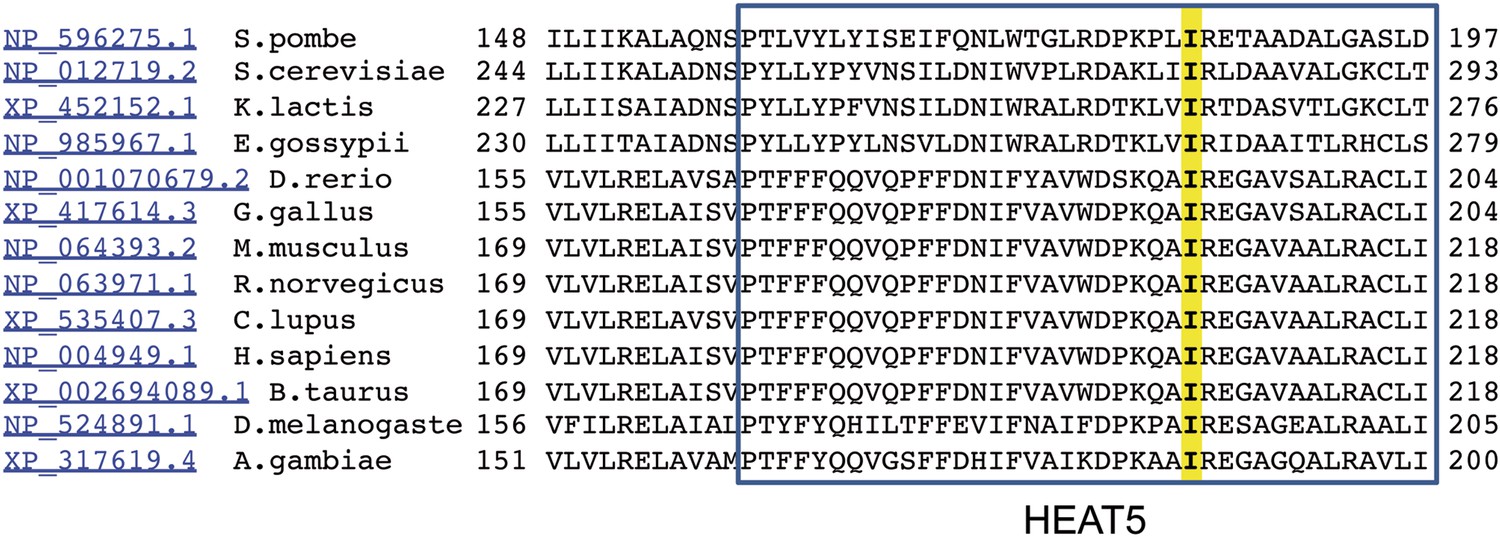
Alignment of HEAT5 domains in mTOR.
Amino acid sequences of the indicated 13 species were aligned to demonstrate the level of conservation in the HEAT5 domain. Note the isoleucine residue in yellow that is altered by the chino mutation to serine.
Figure 9 with 1 supplement
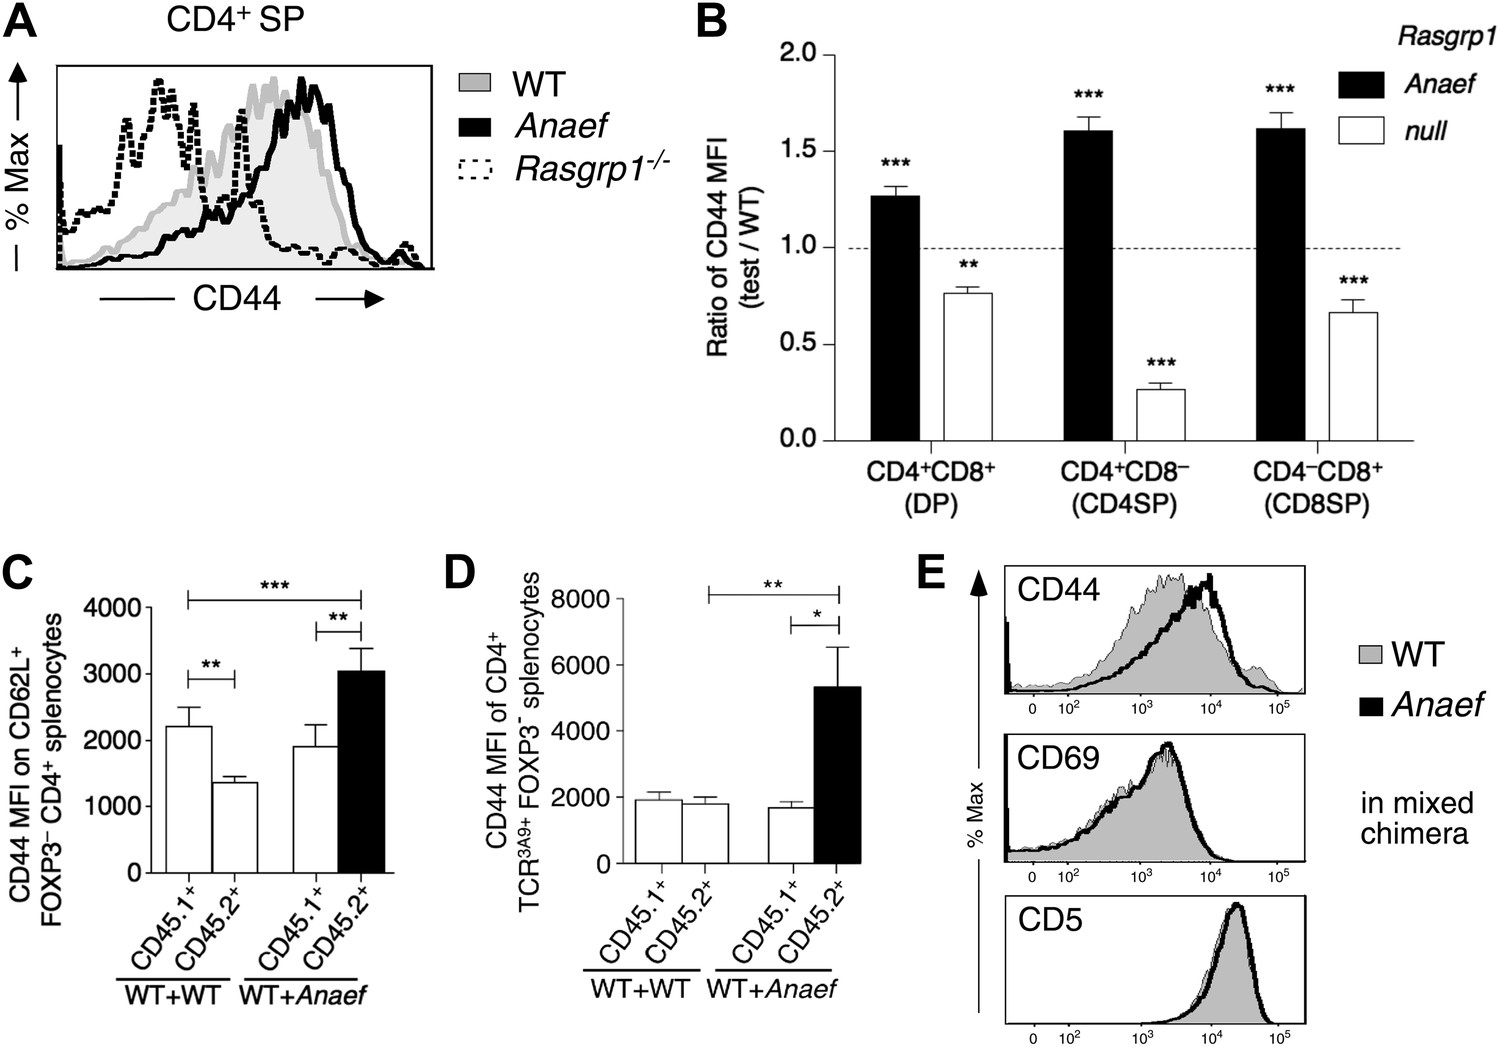
Selective and cell-autonomous increase in CD44 expression in Rasgrp1Anaef CD4+ T cells.
(A) Representative CD44 expression on unstimulated CD4SP thymocytes from wildtype, Rasgrp1Anaef and Rasgrp1−/− mice. (B) Mean relative CD44 from 22 Rasgrp1Anaef, 13 wildtype, and 3 Rasgrp1−/− mice compiled from seven experiments. In each experiment, the mean CD44 expression for the wildtype group was taken to be one, and values for individual mice were normalized to this. Unpaired Student’s t tests were used to compare Rasgrp1Anaef and Rasgrp1−/− with the wildtype group. **p<0.005, ***p<0.0005. (C) CD44 MFI on CD62L+Foxp3−CD4+ splenocytes from mixed bone marrow chimeras described in Figure 7F. Statistical comparisons used paired t tests within, and unpaired t tests between, groups of chimeras (n = 9 for both groups); ***p<0.001, **p<0.01. (D) CD44 MFI on TCR3A9+ (clonotype positive) CD4+Foxp3− splenocytes from B10.BR mixed bone marrow chimeras containing CD45.1+ wildtype TCR3A9 plus either CD45.2+ wildtype (n = 8) or CD45.2+ Rasgrp1Anaef (n = 7) 3A9 TCR-transgenic hematopoietic cells. Statistical comparisons in (C) and (D) used paired t tests within groups of chimeras and unpaired t tests between groups of chimeras. p value symbols: ***p<0.001, **p<0.01, *p<0.05. (E) Rasgrp1Anaef increases CD44 expression levels but does not affect CD69 or CD5 expression. CD4SP thymocytes are analyzed from irradiated mice reconstituted with non-transgenic CD45.1+ wildtype mixed with CD45.2+ Rasgrp1Anaef bone marrow.
Figure 9—figure supplement 1
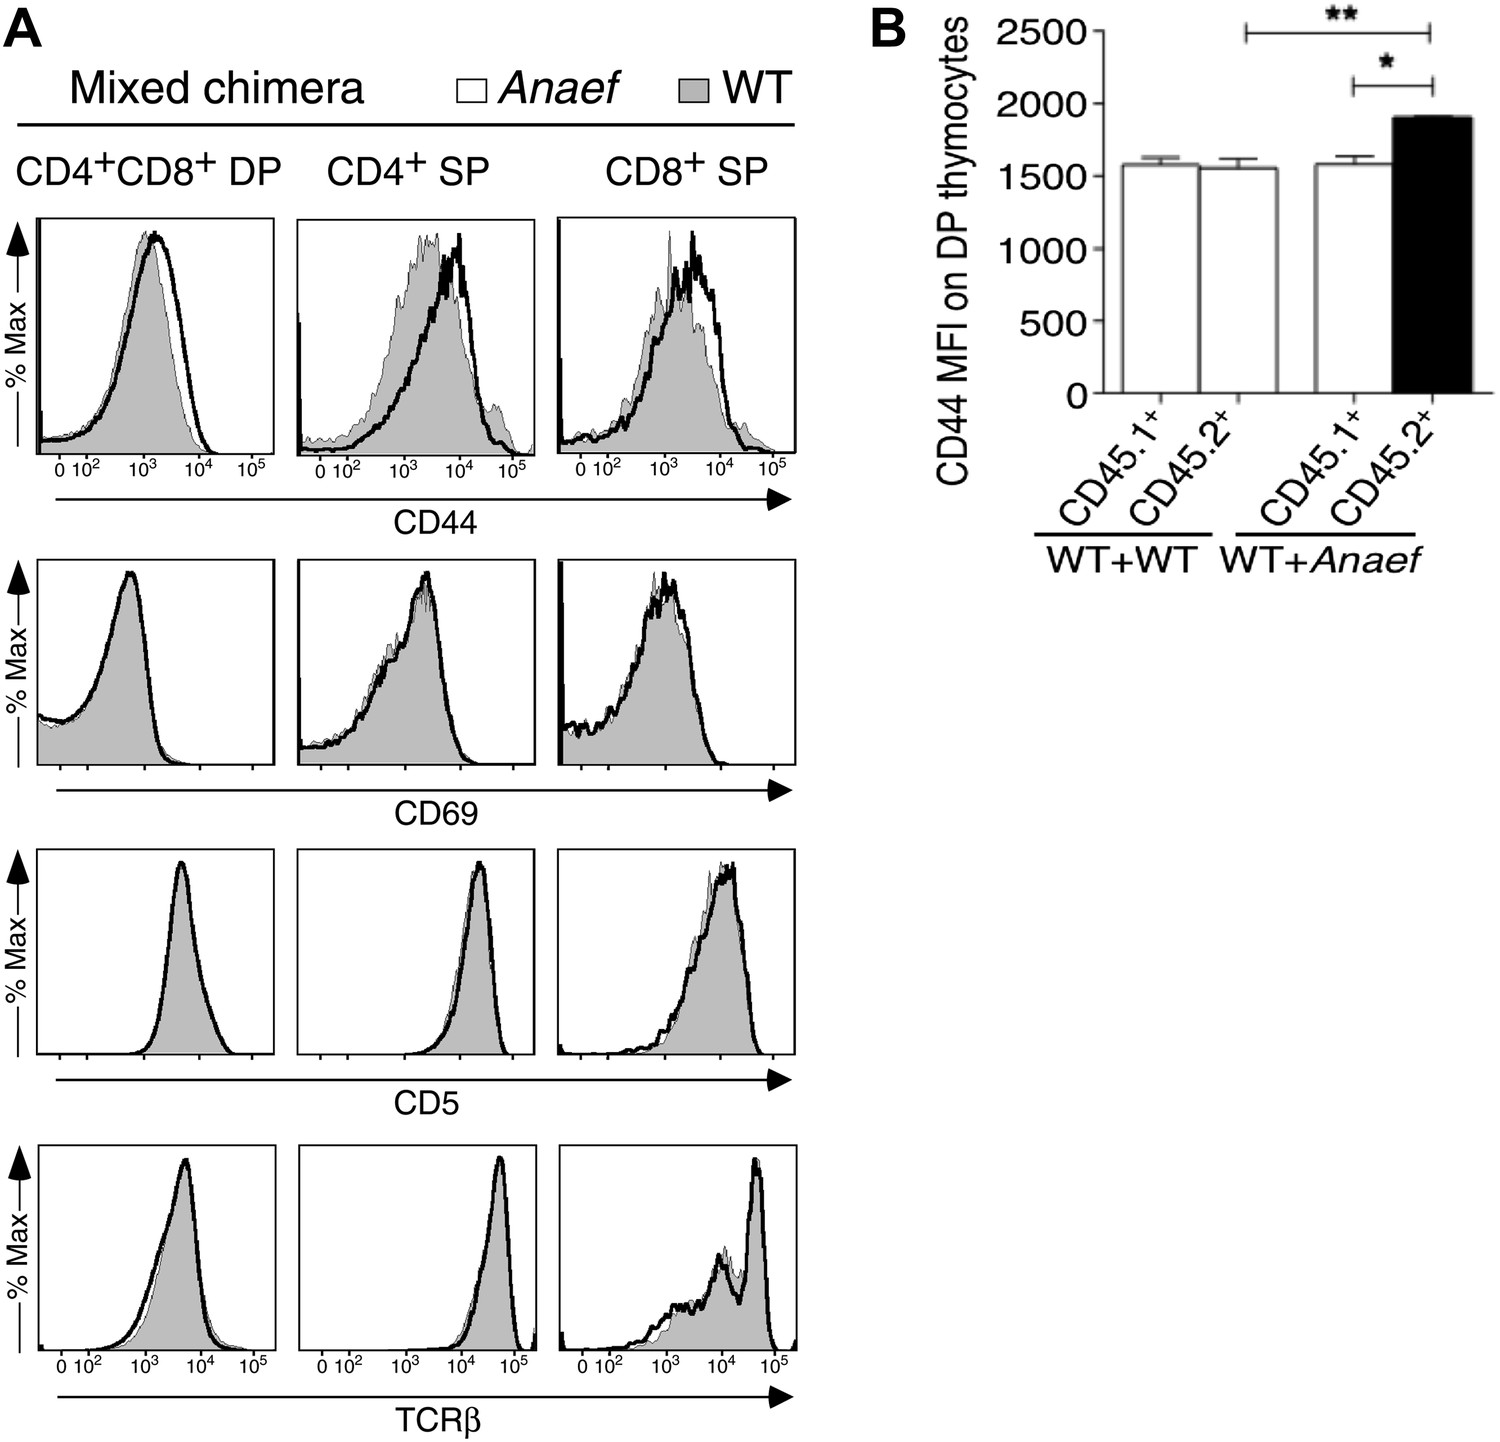
CD44 and P-S6 expression in thymocytes.
(A) Selective effect of Rasgrp1Anaef on CD44 expression during thymic maturation. Analysis of thymocytes from mixed chimeras (described in Figure 9E) bearing CD45.1+ WT (filled) plus CD45.2+ Rasgrp1Anaef (black trace) hematopoietic cells. Histograms show CD44, CD69, CD5, TCRβ expression on DP, CD4SP and CD8SP thymocytes. (B) Column graph shows CD44 MFIs on CD45.1+ or CD45.2+ DP thymocytes from the mixed chimeras (in A) as well as control WT + WT chimeras (n = 5 mice per group). p value symbols for unpaired t tests between groups and paired t tests within groups: **p: 0.01, *p,: 0.05.
Figure 10 with 1 supplement
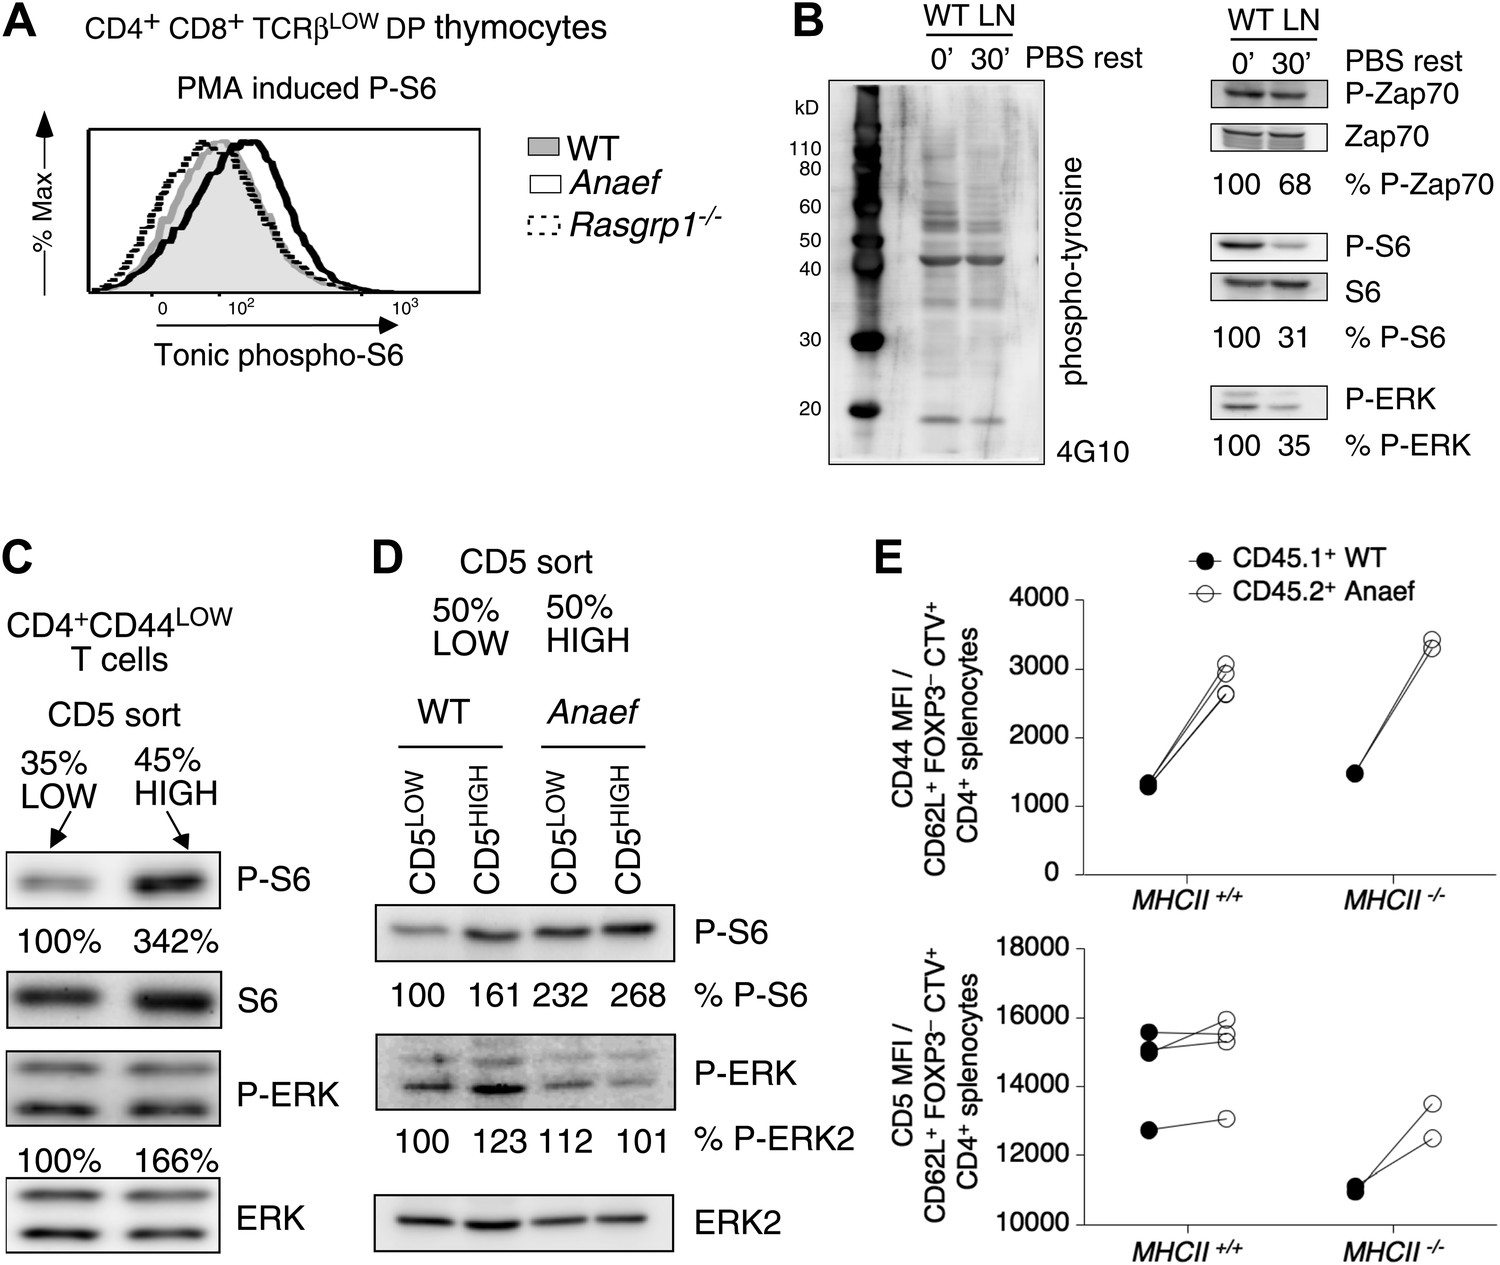
Increased tonic mTOR-S6 signals in Rasgrp1Anaef thymocytes and T cells.
(A) Tonic P-S6 levels in pre-selection DP thymocytes from wildtype, Rasgrp1Anaef and Rasgrp1−/− mice. Representative histograms are shown for five independent experiments with n = 9 for WT, n = 7 for Rasgrp1Anaef and n = 7 Rasgrp1−/− mice. (B) Total lymph node cells were analyzed for the indicated phospho-proteins either immediately after extraction and single cell suspension generation (0’) or after a 30 min rest period in PBS at 37° (30’). (C, D) Western blot measurements of basal P-S6 and P-ERK in unstimulated naive CD4+CD44lo T cells sorted into CD5low and CD5high subsets from wildtype and Rasgrp1Anaef mice. Equal loading was confirmed with specific blotting for ERK2, which can be done without stripping. Panels c-e are representative results of at least three independent experiments. (E) CD45.1 wild-type and Rasgrp1Anaef splenocytes were mixed, labeled with CellTrace Violet and adoptively transferred into CD45.2 wild-type or MHCII–deficient recipient mice (Figure 10—figure supplement 1). 48 hr later, donor-derived CD4+CD62L+FOXP3− cells in recipient spleens were resolved by flow cytometry and their CD44 (upper panel) and CD5 (lower panel) MFIs were plotted. Lines connect measurements from individual mice.
Figure 10—figure supplement 1
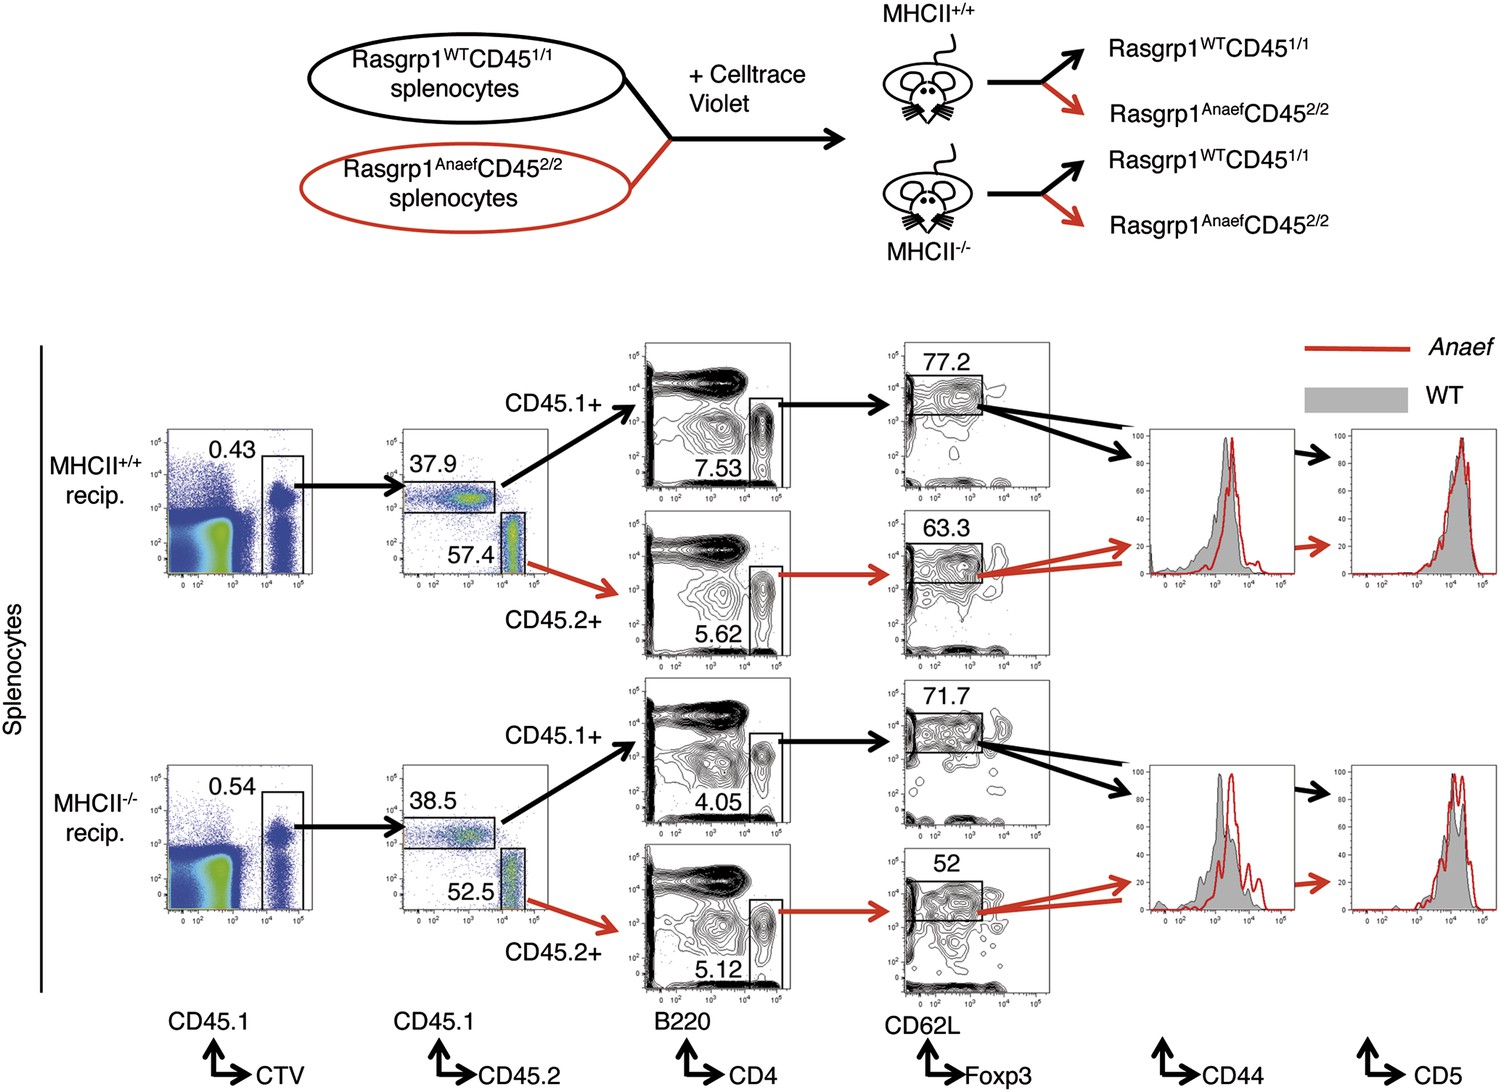
Testing the role of MHCII recognition in constitutive CD44 overexpression by Rasgrp1Anaef naive CD4 T cells.
Schematic of experiment design as described in the text (top) and flow cytometric resolution of co-transferred (CTV+) donor WT (CD451/1) and Rasgrp1Anaef (CD452/2) naive CD4 T cells on which CD5 and CD44 expression were compared (bottom).
Figure 11
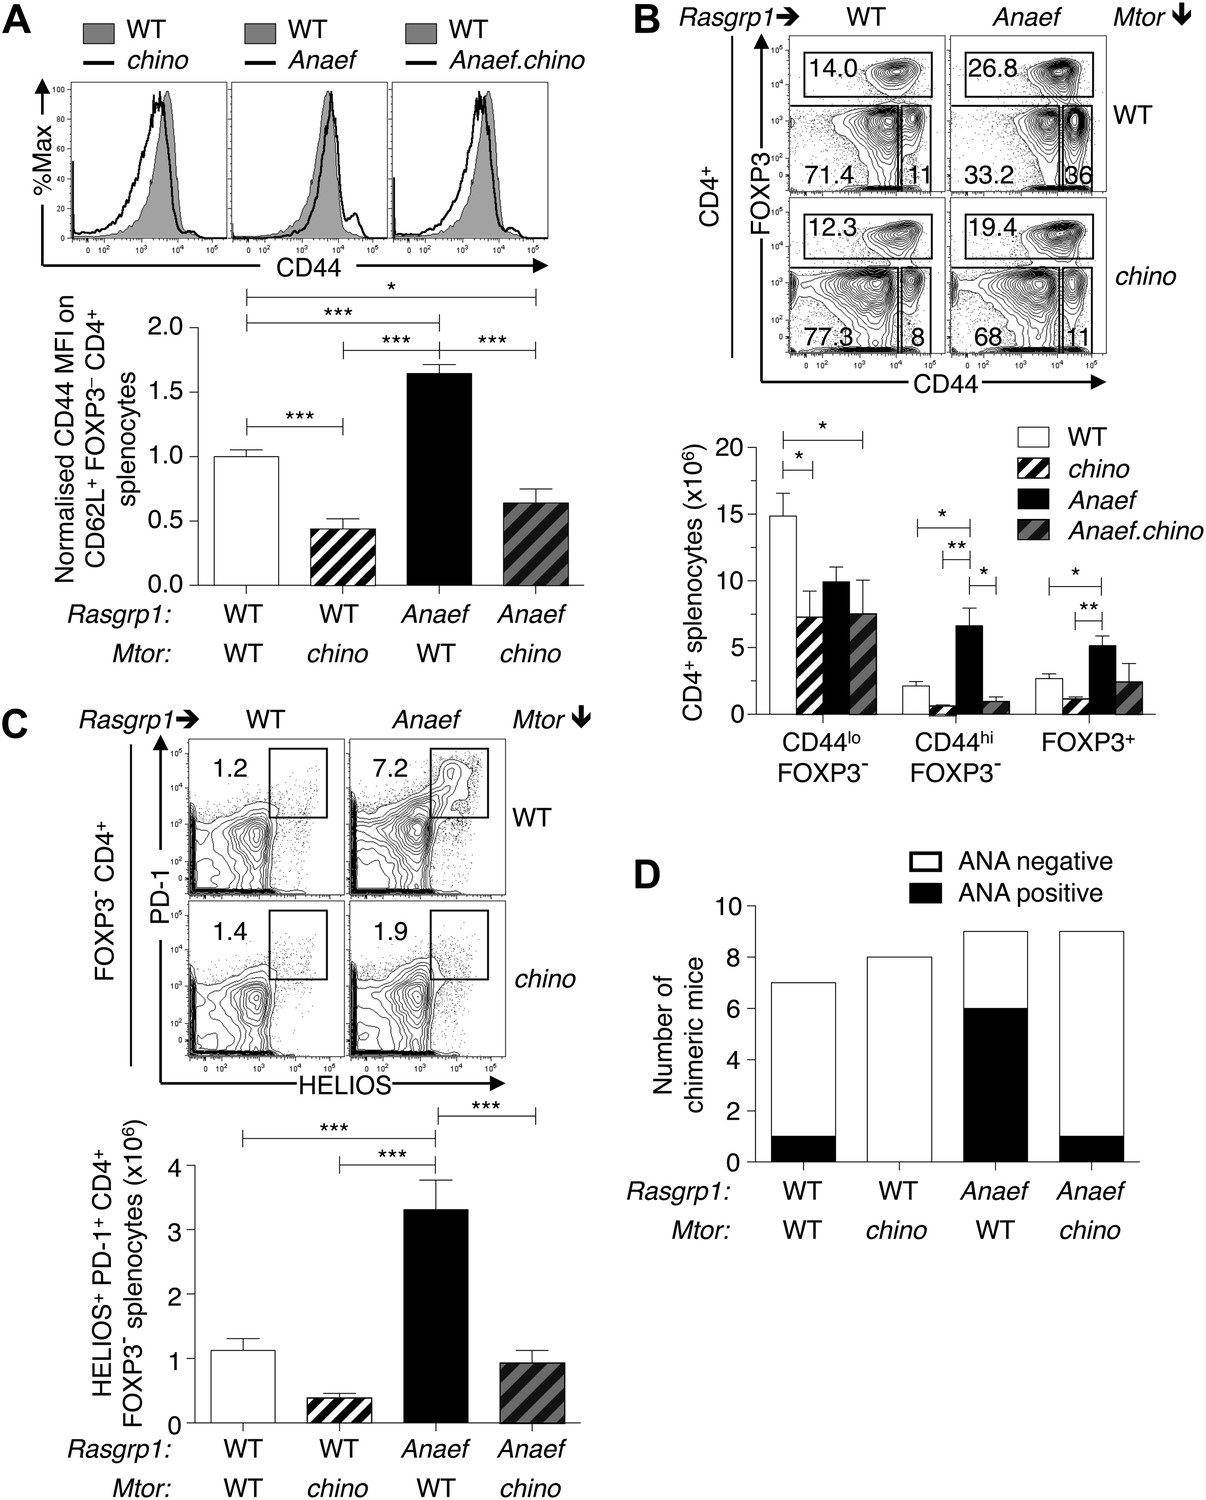
Mtor hypomorphic mutation corrects Rasgrp1Anaef–induced increase in naive T-cell CD44 expression and accumulation of CD44+Helios+PD-1+CD4+ cells and autoantibodies.
(A) B6.Rasgrp1Anaef mice were intercrossed with B6.Mtorchino mice to generate the single and double-mutant mice. Representative CD44 histograms of CD62L+FOXP3−CD4+ splenocytes from these chino, Anaef, and Anaef.chino mutants were overlaid against wild-type cells and plotted. Below, CD44 MFI of mice was normalized against average CD44 MFI of wild-type mice across two independent experiments and graphed, with columns showing mean ± SEM. Significance indicated using a 1-way ANOVA and Tukey’s post-test at n = 13 WT, 5 chino, 15 Anaef, and 4 Anaef.chino. *p<0.05, **p<0.01, ***p<0.001. (B) Representative CD44 vs FOXP3 plots for these four genotypes from (A), which display CD4+ splenocytes gated into naïve (CD44lo FOXP3−), activated/memory (CD44hi FOXP3−), and T-reg (FOXP3+) populations. Absolute numbers of these three subsets across all four genotypes is graphed below, with columns showing mean ± SEM. Significance indicated using a 1-way ANOVA and Tukey’s post-test at n = 13 WT, 5 chino, 15 Anaef, and 4 Anaef.chino. *p<0.05, **p<0.01. (C) Bone marrow cells from sibling mice described in (A) and (B) were used to reconstitute irradiated B6.SJL CD451/1 mice, which were analyzed 28 weeks after irradiation. Plots show HELIOS vs PD-1 expression on FOXP3− CD4+ splenocytes, representative of both nonchimeric and chimeric mice. Absolute number of HELIOS+ PD-1+ FOXP3− CD4+ splenocytes per mouse is graphed below, with columns showing mean ± SEM. Significance indicated using a 1-way ANOVA and Tukey’s post-test at n = 11 WT, 10 chino, 10 Anaef, 11 Anaef.chino. ***p<0.001. (D) Chimeric mice from (C) were bled 27 weeks after irradiation and the presence of homogeneous nuclear ANA in blood plasma was measured by immunofluorescence on HEp-2 cells and scored in a blinded manner.
Download links
A two-part list of links to download the article, or parts of the article, in various formats.
Downloads (link to download the article as PDF)
Open citations (links to open the citations from this article in various online reference manager services)
Cite this article (links to download the citations from this article in formats compatible with various reference manager tools)
Rasgrp1 mutation increases naïve T-cell CD44 expression and drives mTOR-dependent accumulation of Helios+ T cells and autoantibodies
eLife 2:e01020.
https://doi.org/10.7554/eLife.01020


