Developmental lineage priming in Dictyostelium by heterogeneous Ras activation
- University of Manchester, United Kingdom
- University of British Columbia, Canada
Figures
Figure 1 with 3 supplements
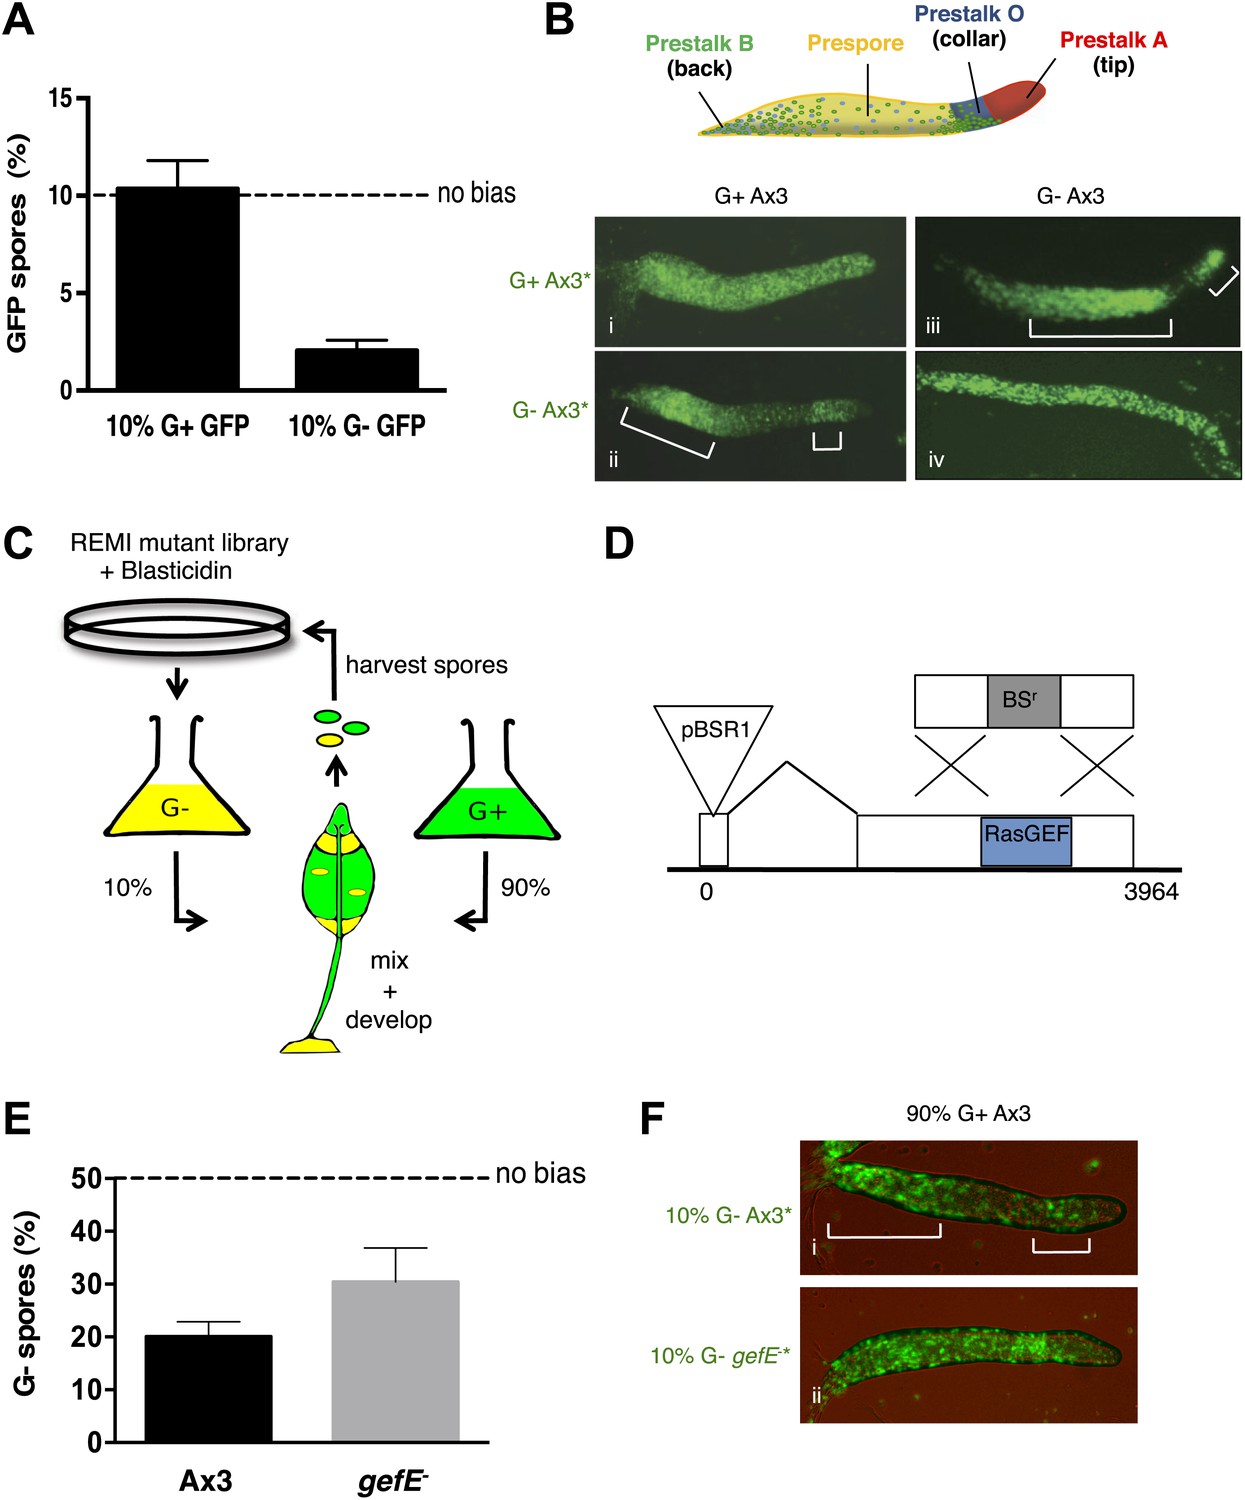
RasGEFE mutant cells are enriched in a genetic screen for modulators of nutritional bias.
(A) G− cells produce fewer spores than G+ cells in chimeric development. GFP-labelled Ax3 wild type cells were grown in either G+ or G− conditions and mixed 10:90 with wild type G+ cells. GFP spores were quantified by counting. Dotted line indicates the percentage GFP spores expected if there is no fate bias. Error bars represent SEM, p<0.0001. (B) G− growth biases cells towards pstO and pstB cell fates. Diagram shows organisation of different cell types along the anterior-posterior axis of the Dictyostelium slug. Patterning of GFP-labelled (*) G+ (i) and G− (ii) cells when mixed at 10:90 ratio with G+ cells. The reciprocal pattern was observed when GFP-labelled G+ (iii) and G− (iv) were mixed at 10:90 ratio with G− cells. (C) Schematic diagram of the genetic selection. REMI mutant cells were grown in G− and mixed 10:90 with wild type G+ GFP cells. Chimeric fruiting bodies were harvested and spores returned to growth medium after each developmental cycle. Wild type cells were removed with Blasticidin. (D) Generation of gefE− mutants. REMI plasmid, pBSR1, inserted into 42 bp exon 1. RasGEF catalytic domain (blue) deleted by homologous recombination. (E) gefE− mutant cells produce more spores than Ax3 wild type cells after G− growth. RFP-labelled wild type cells were grown in G+ medium and mixed at a 50:50 ratio with unlabelled wild type or gefE− mutant cells grown in G−. Number of unlabelled spores was quantified by counting. Error bars represent SEM, p<0.04. (F) Comparison of the patterning of GFP-labelled (*) wild type (i) or gefE− mutant (ii) cells grown in G− conditions when mixed at 10:90 ratio with unlabelled wild type G+ cells. AP axis in all slug images oriented from right-left with white bars showing regions of GFP enrichment.
Figure 1—figure supplement 1
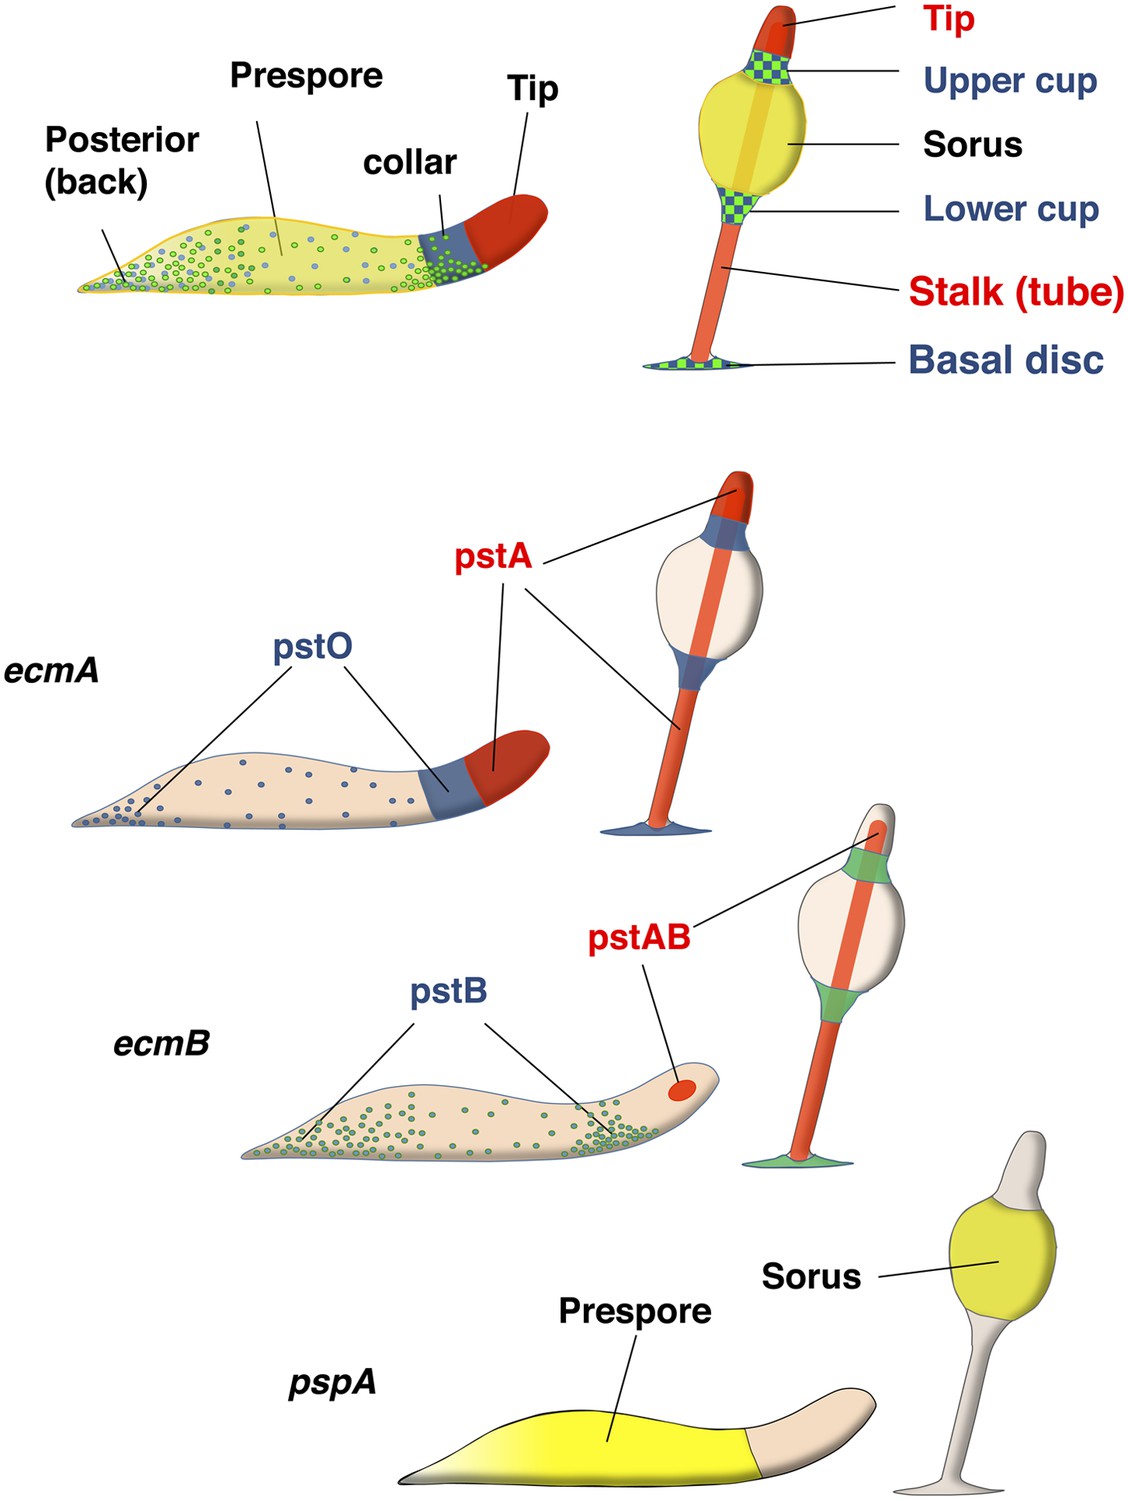
Organisation of cell types in Dictyostelim slug and culminants.
Nomenclatures for parts of Dictyostelium slug (left) and fruiting body (right) are depicted. Yellow (prespore) cells eventually form sorus and red cells (pstA or AB) form stalk cells. Blue (pstO) and green (pstB) cells are the DIF dependent cell types which eventually form upper/lower cup and basal disc. ecmA promoter can be subdivided to pstA and O, and ecmB promoter to pstAB and pstB cell types.
Figure 1—figure supplement 2
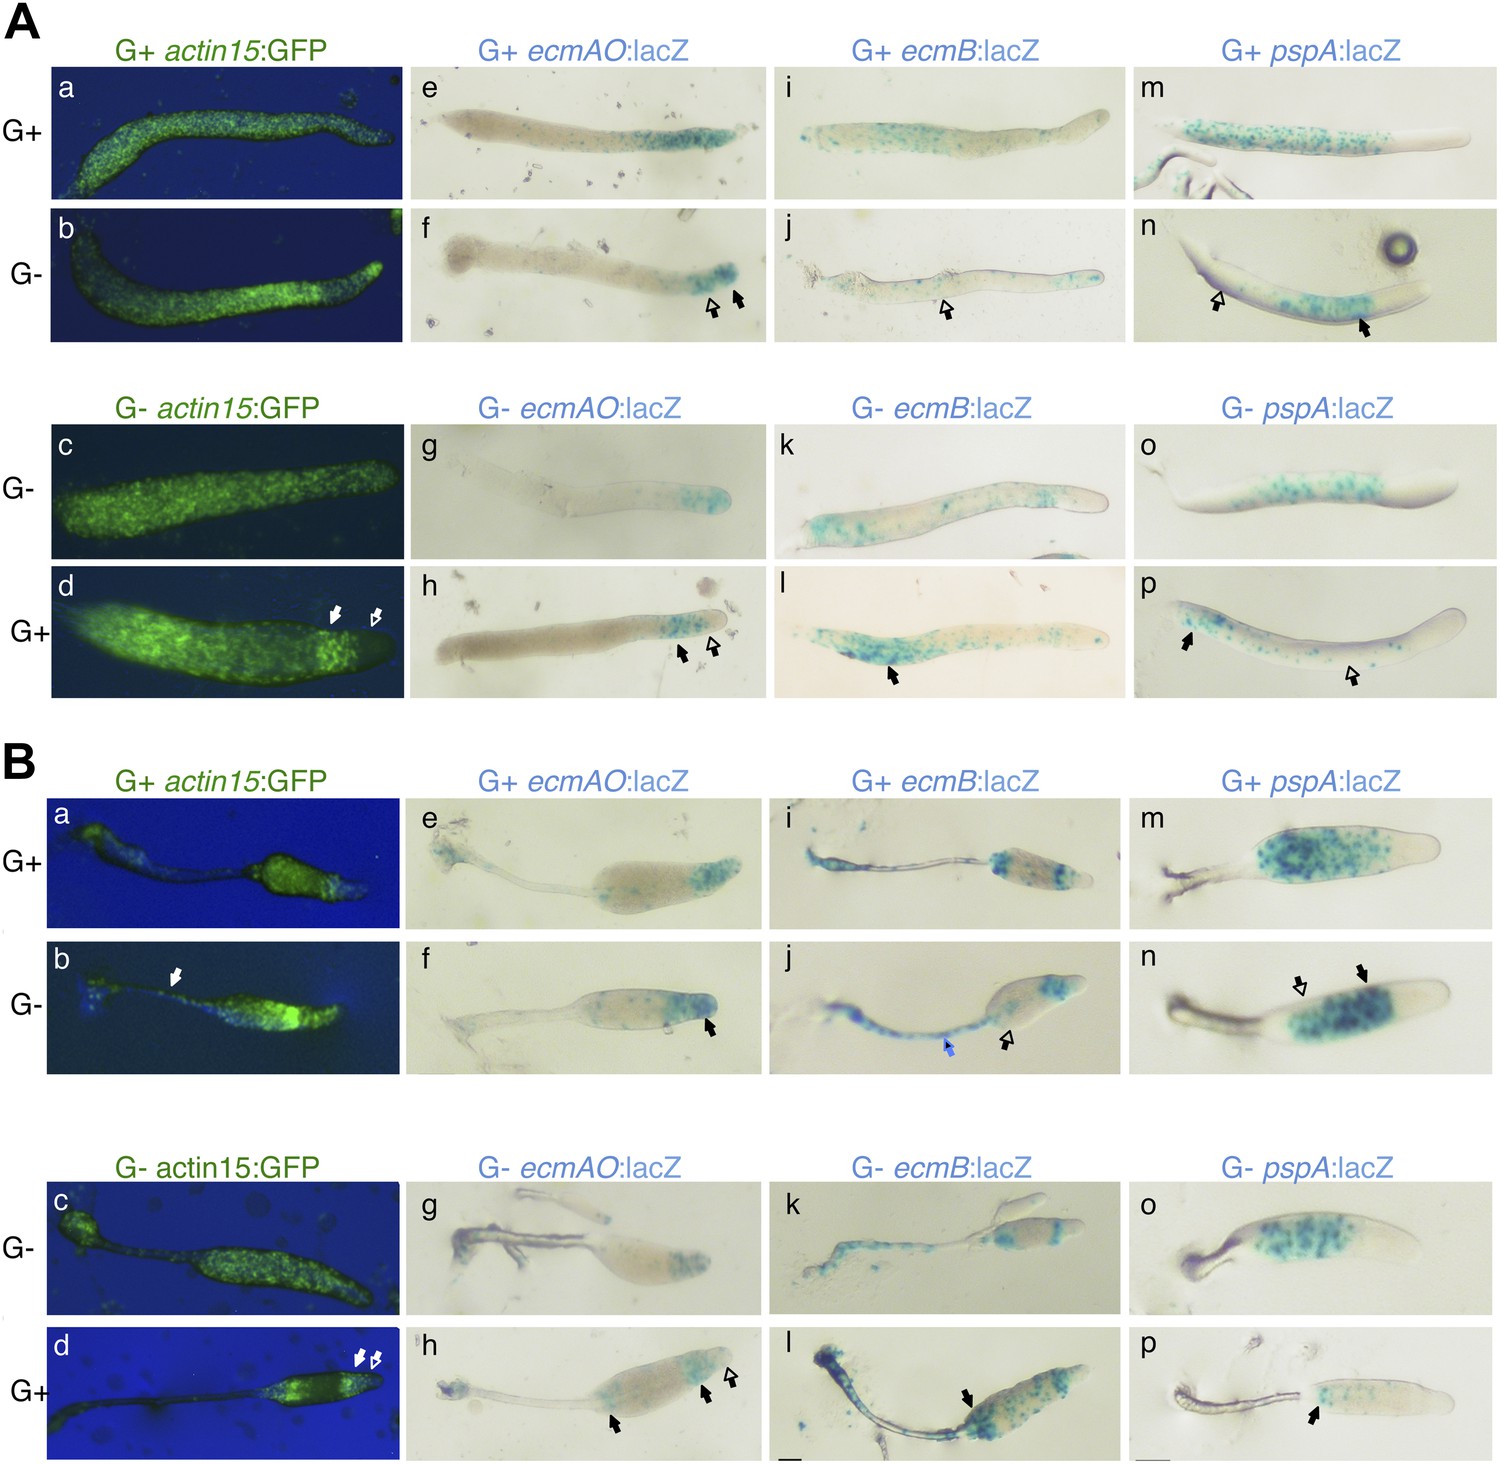
Cell type specific effects of nutritional history in Dictyostelium slugs.
(A) and culminants (B) 10% labelled G+ cells (upper panels) or G− cells (lower panels) mixed with 90% unlabelled G+ or G− cells. Closed arrows indicate enrichment of label, open arrows an absence. In each panel, the top row shows the control mix and is comparable to the image directly beneath. General patterning differences between G+ and G− cells (A–D) are described in the main text and Figure 1. G+ cells labelled with ecmAO:lacZ occupy anterior-most pstA regions when mixed with G− cells (E and F). In the reciprocal mix, G− cells labelled with ecmAO:lacZ were absent from the tip and formed a collar in the pstO regions when mixed with unlabelled G+ cells (G and H). Expression of ecmB:lacZ was decreased in pstB regions of chimeras when labelled G+ cells were mixed with unlabelled G− mutant cells (I and J) and increased when labelled G− mutant cells were mixed with unlabelled G+ cells (K and L). Wild type cells labelled with pspA:lacZ occupy the prespore region when mixed with unlabelled G− cells (M and N). In the reciprocal mix, where G− cells labelled with pspA:lacZ were mixed with unlabelled G+ cells, expression was greatly reduced and restricted to the rear of the prespore compartment (O and P). The AP axis of all structures is aligned from right-left. Refer to Figure 1—figure supplement 1 to link marker expression to cell type localization within slug or culminant.
Figure 1—figure supplement 3
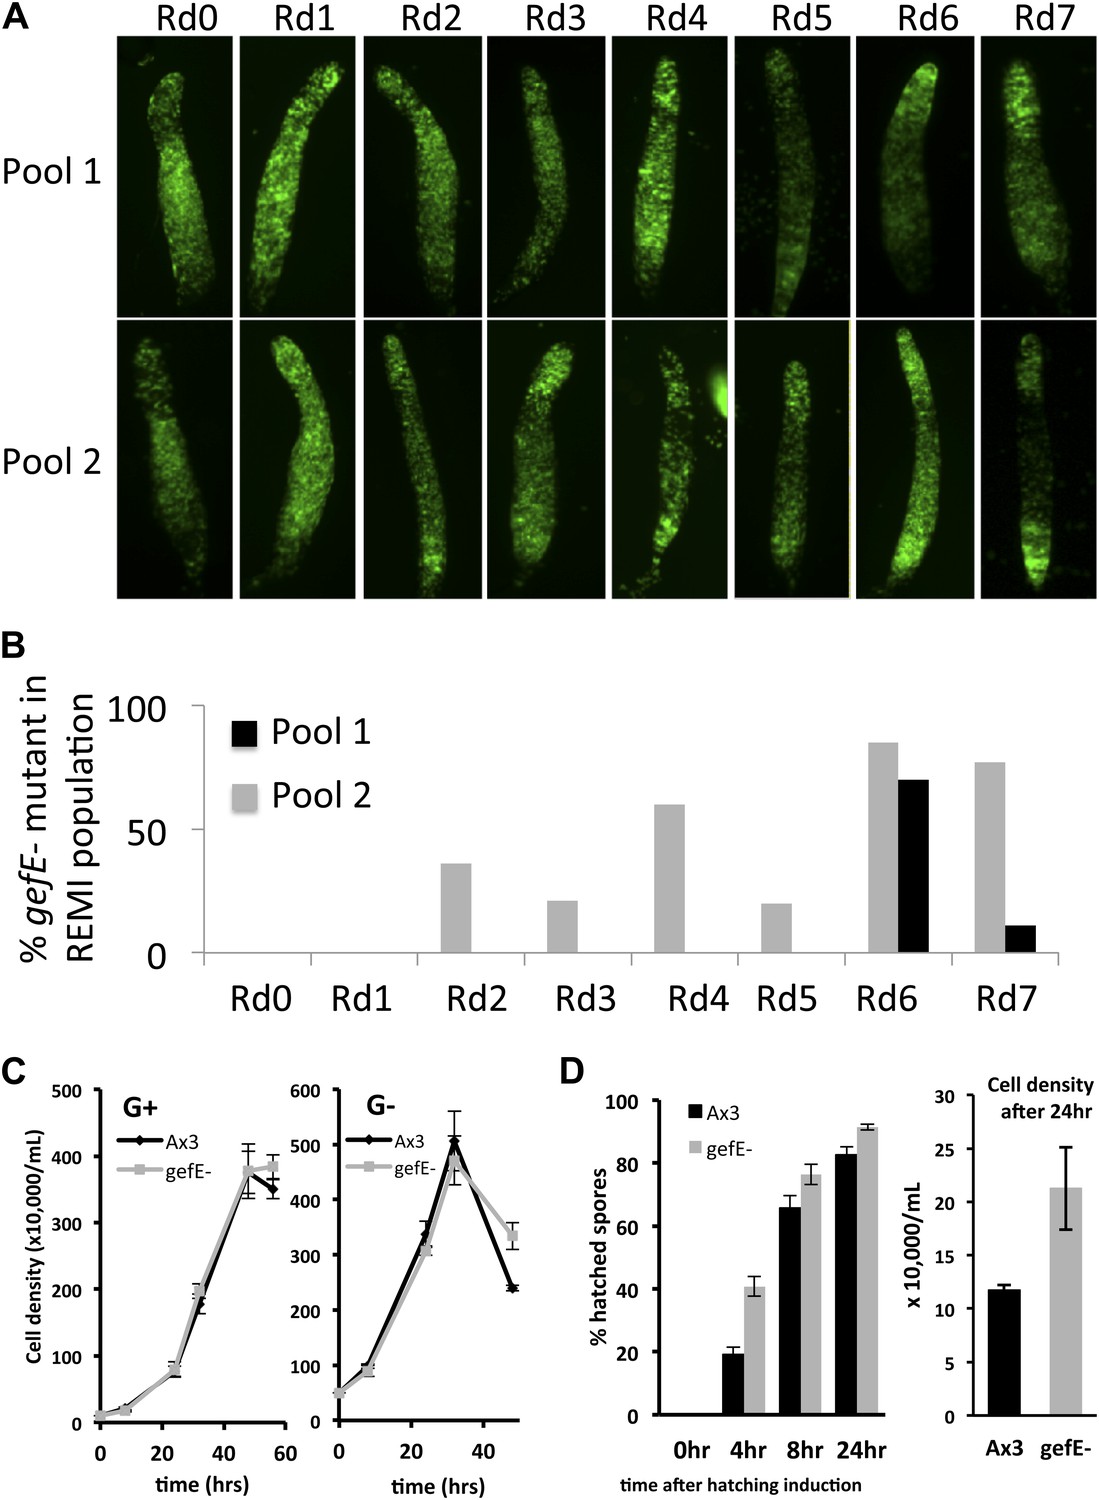
Enrichment of REMI mutants during screen correlates with change in cell fate preference during development.
(A) Patterning phenotype of REMI mutant pools in chimera with wild type cells. 10% wild type GFP cells were mixed with 90% REMI mutant cells from each pool at each round of selection. The dark regions in each slug show the location of the REMI mutant cells. In Rd0, REMI mutant cells localize in the pstO and pstB regions. By Rd7, wild GFP cells are almost entirely absent from prespore compartment, especially in pool 2. In pool 1 (top row), REMI mutant cells are enriched in the collar and back until Rd3. By Rd6 and 7, wild type GFP cells are enriched in the anterior prestalk region, suggesting the REMI mutant cells are in the prespore population. (B) Proportion of REMI mutants identified by iPCR that mapped to exon 1 of gefE locus in each round of selection. (C) Measurements of growth rate of wild type and gefE− mutant cells in G+ or G− medium. (D) Measurement of spore hatching rate of wild type and gefE− mutant cells. The percentage of hatched spores was scored at the indicated times after spores were placed in growth medium. The cell density after 24 hr of induction was also measured, revealing that the faster hatching rate of gefE− mutant resulted in approximately twofold higher cell density after 24 hr. Error bars represent SEM.
Figure 2 with 2 supplements

gefE− mutant cells avoid pstO and pstB fates.
(A) RFP-labelled AX3 wild type cells were mixed at a 50:50 ratio with unlabelled wild type or gefE− mutant cells. Both strains were grown in presence of glucose. Number of unlabelled spores quantified by counting. Dotted line indicates the percentage RFP spores expected if there is no fate bias. Error bars represent SEM, p<0.01. (B) Chimeras of 10% GFP-labelled (*) wild type or gefE− mutant cells mixed with 90% unlabelled wild type or gefE− mutant cells. AP axis in all slug images oriented from right-left with white bars showing regions of GFP enrichment. (C) Cells transfected with RFP control vector (a and b), or GefE-RFP fusion vector (c and d), under control of the constitutive actin promoter, mixed with unlabelled wild type cells at 20:80 ratio and observed during slug (a and c) and culminant (b and d) stages of development. Closed arrows indicate relative enrichment in reporter gene expression.
Figure 2—figure supplement 1
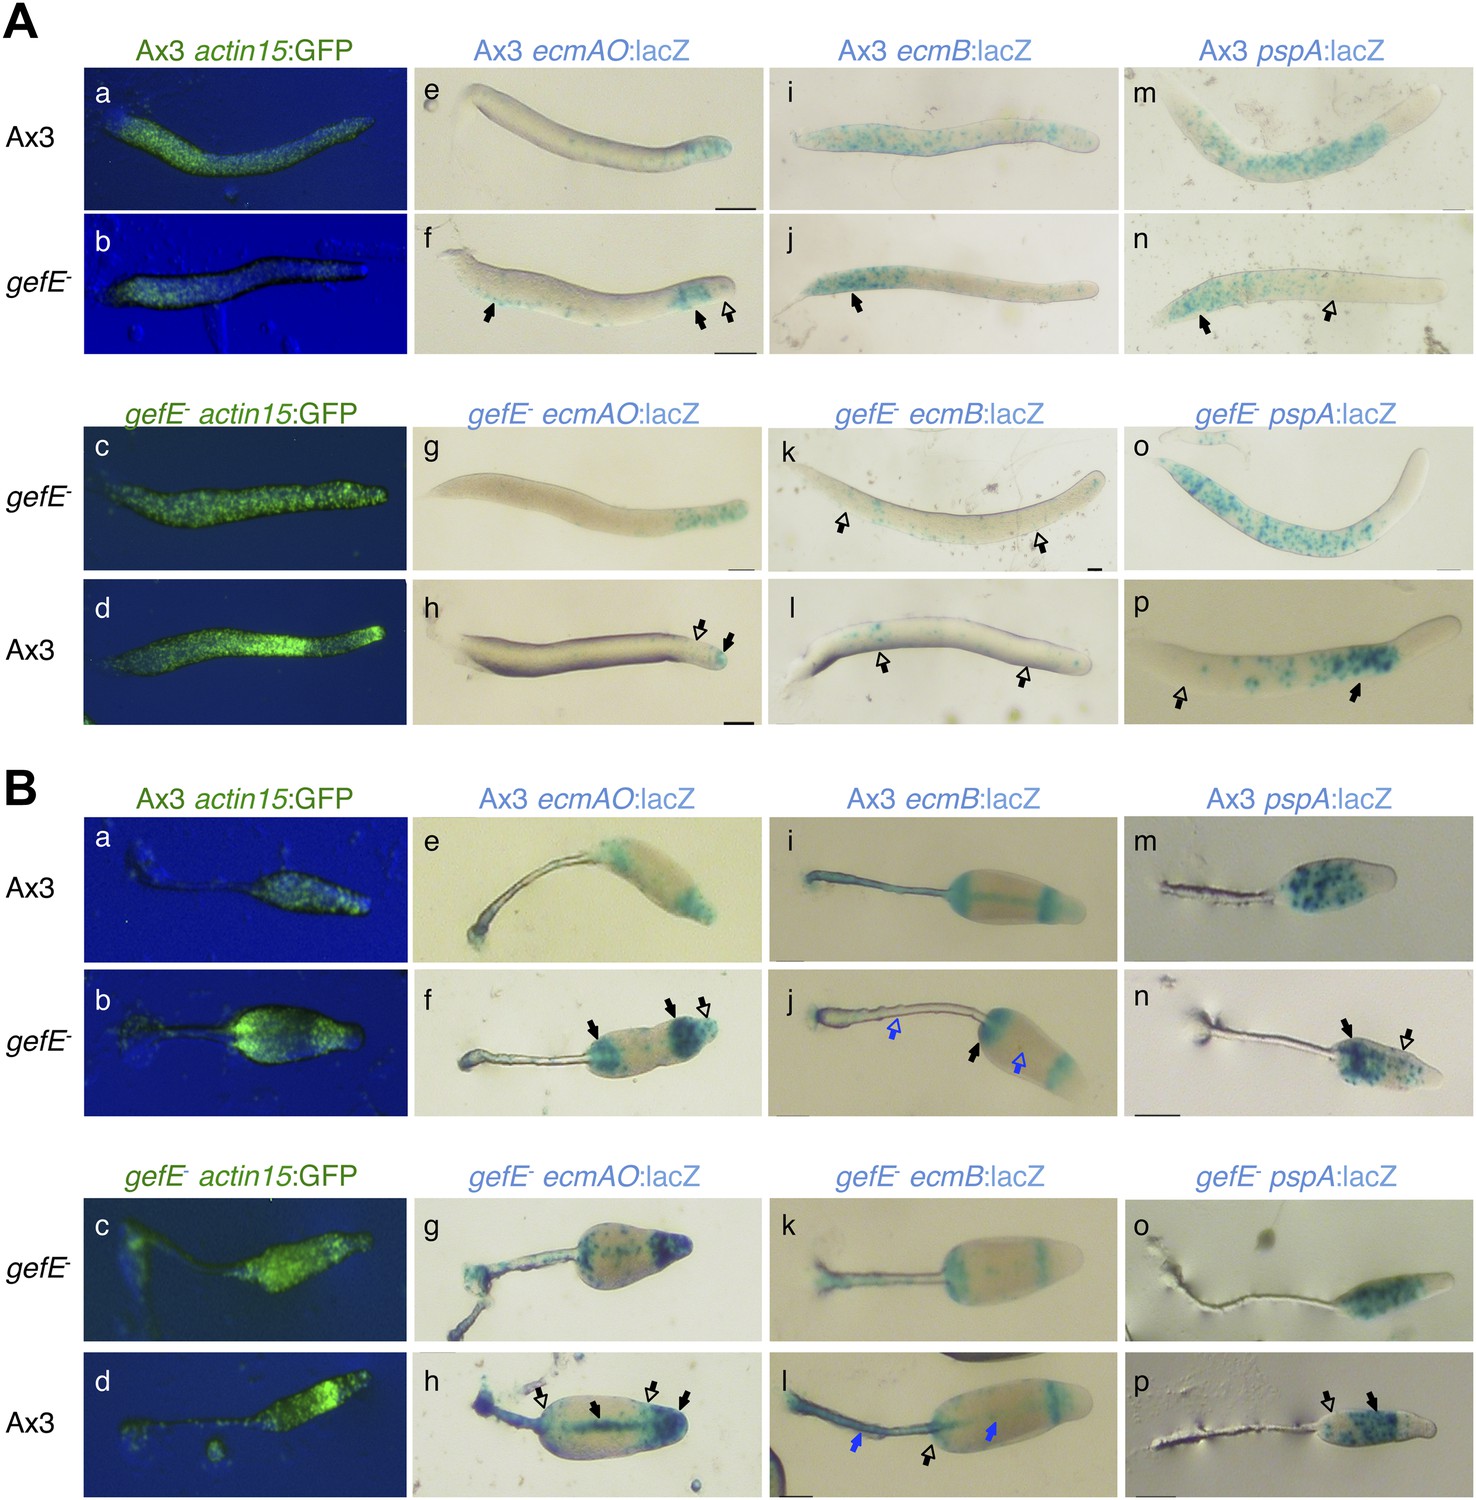
Cell type specific effects in chimeric gefE−/wt slugs.
(A) and culminants (B) 10% labelled Ax3 wild type (upper panels) or gefE− mutant cells (lower panels) mixed with 90% unlabelled wild type or gefE− mutant cells. Closed arrows indicate enrichment of label, open arrows an absence. In each panel, the top row shows the control mix and is comparable to the image directly beneath. General patterning differences between wild type and gefE− mutant cells (A–D) are described in the main text and Figure 2. Wild type cells labelled with ecmAO:lacZ were absent from the tip and formed a collar in the pstO regions when mixed with gefE− mutant cells (E and F). In the reciprocal mix, gefE− mutant cells labelled with ecmAO:lacZ occupied the anterior-most pstA regions when mixed with unlabelled wild type cells (G and H). Expression of ecmB:lacZ was increased in pstB regions of chimeras when labelled wild type cells were mixed with unlabelled gefE− mutant cells (I and J) and reduced when labelled gefE− mutant cells were mixed with unlabelled wild type cells (K and L). At culminant stage, ecmB expression is upregulated in pstA cells. Blue arrows in panel B highlight the tendency of wild type cells to avoid this fate (I and J) at the expense of gefE− mutant cells (K and L). Expression of pspA:lacZ was reduced and restricted to the prespore region when labelled wild type cells were mixed with unlabelled gefE− mutant cells (M and N). The reciprocal pattern was seen when labelled gefE− mutant cells were mixed with unlabelled wild type cells (O and P). The AP axis of all structures is aligned from right-left. Refer to Figure 1—figure supplement 1 to link marker expression to cell type localization within slug or culminant.
Figure 2—figure supplement 2
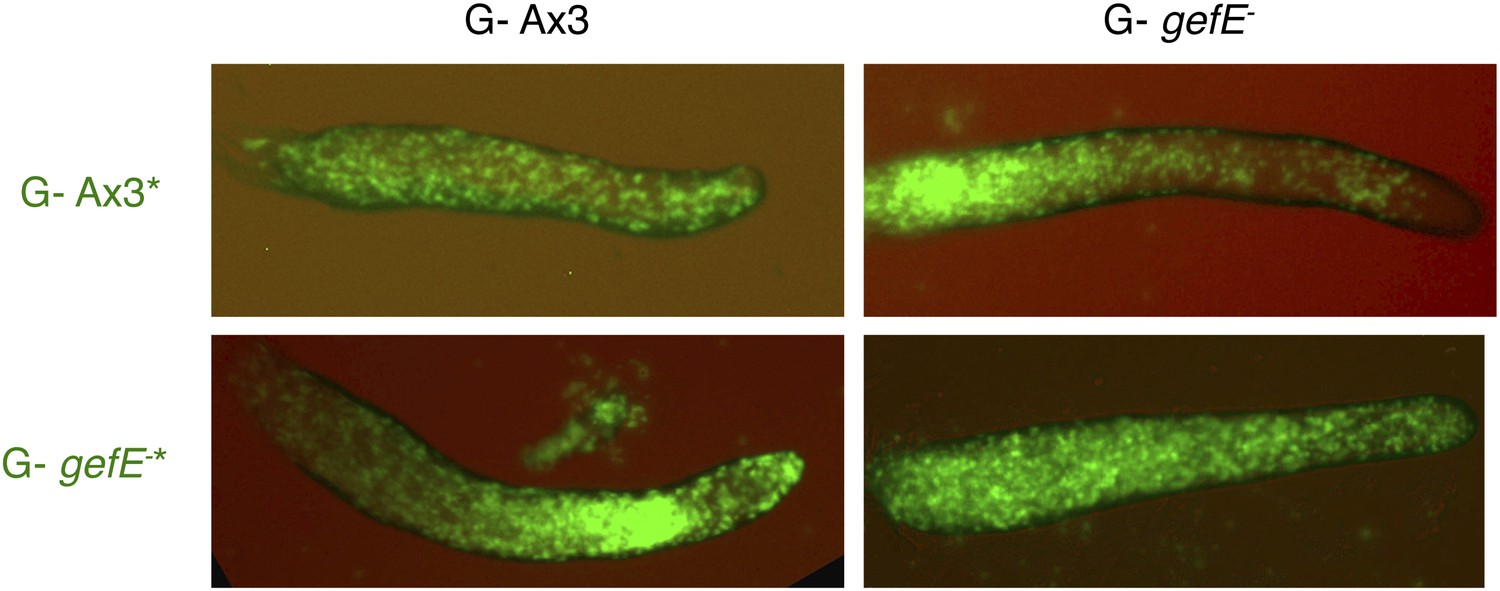
gefE− mutant cells avoid pstO and pstB fates when both partners have a G- growth history.
All cells were grown in absence of glucose. 10% GFP-labelled Ax3 wild type or gefE− mutant cells were then mixed with 90% wild type or gefE− mutant cells and developed to slug stage.
Figure 3

Cell type differentiation is unaffected during clonal development in the gefE− mutant.
(A) Quantification of prespore:prestalk ratio and total number of spores produced by Ax3 wild type and gefE− mutant at slug and fruiting body stages respectively. (B) Expression of prestalk markers ecmA and ecmB in clonal Ax3 wild type and gefE− mutant culminants. (C) Chimeras of 10% GFP-labelled (*) gefE− mutant cells grown in G+ or G− mixed with 90% unlabelled gefE− mutant cells grown in G+ or G− conditions. AP axis in all slug images oriented from right-left with white bars showing regions of GFP enrichment.
Figure 4
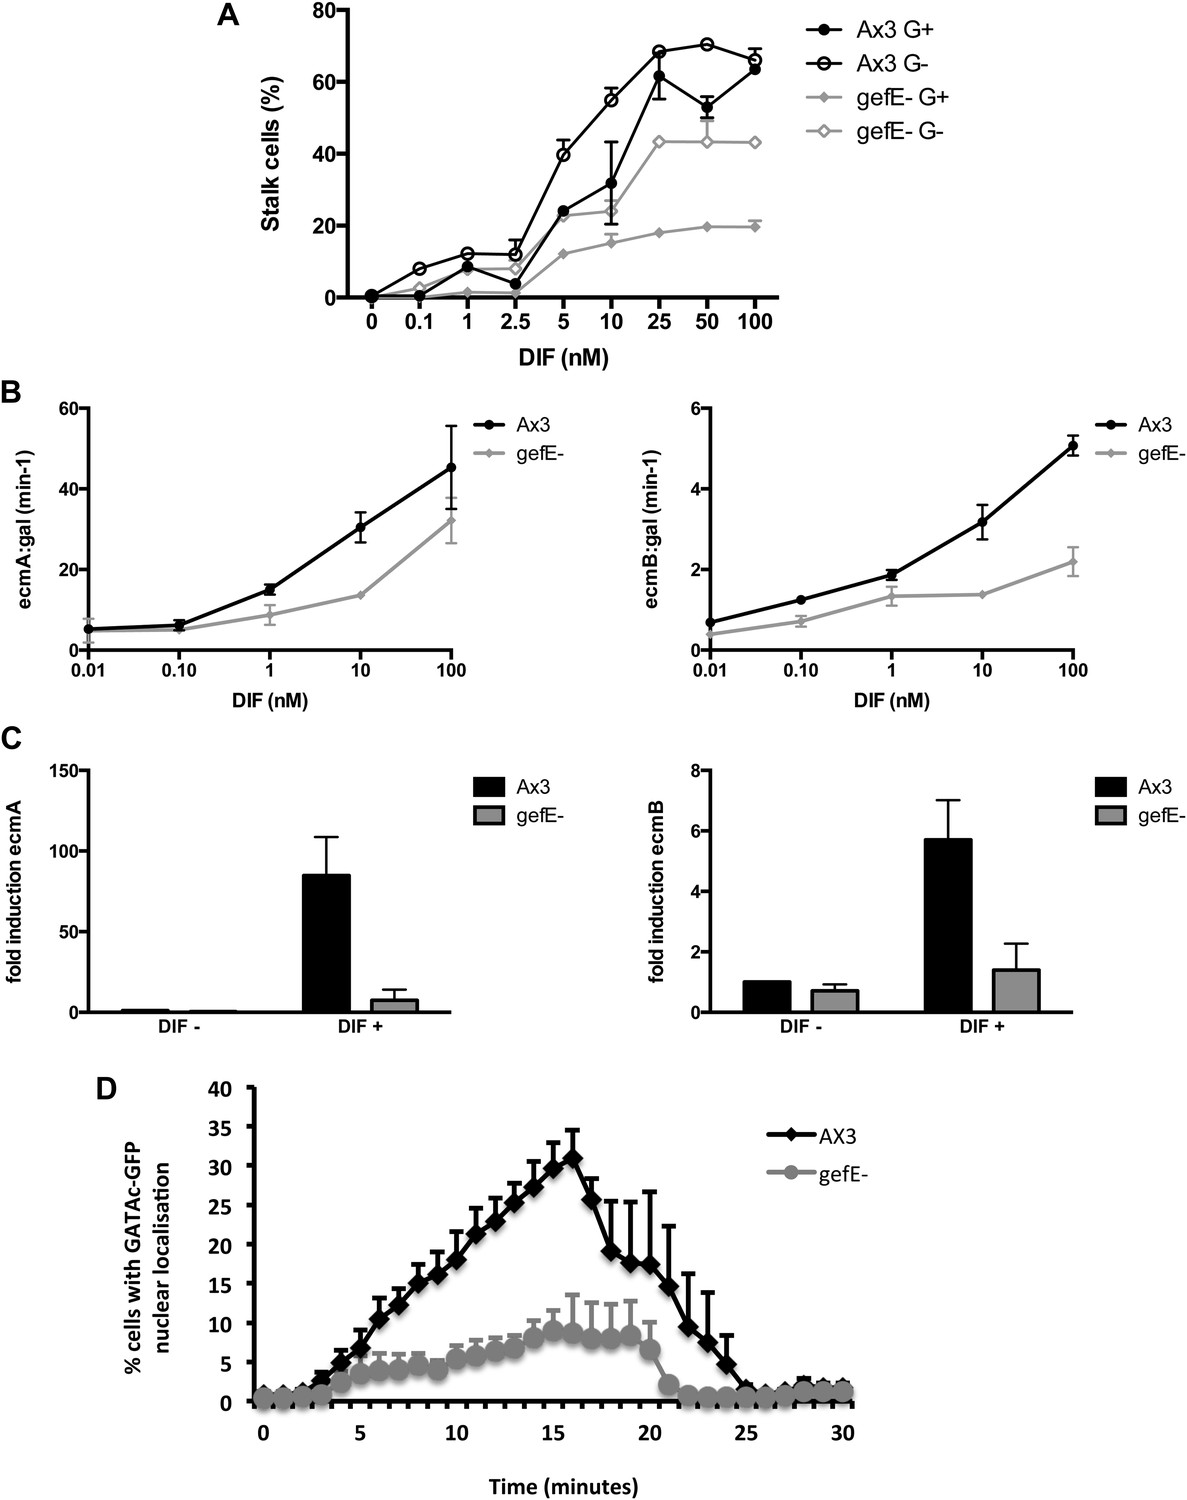
gefE− mutant cells are less sensitive to DIF.
(A) Quantification of stalk cell formation 22 hr after DIF induction. (B) Expression level of lacZ reporter gene fused to prestalk specific promoter of ecmA (left) or ecmB (right) 22 hr after DIF induction. (C) qPCR analysis of endogenous ecmA (left) or ecmB (right) transcript levels after 3 hr induction with 100 nM DIF. (D) Nuclear translocation of DIF-induced transcription factor, GATAc-GFP in response to 100 nM DIF.
Figure 5
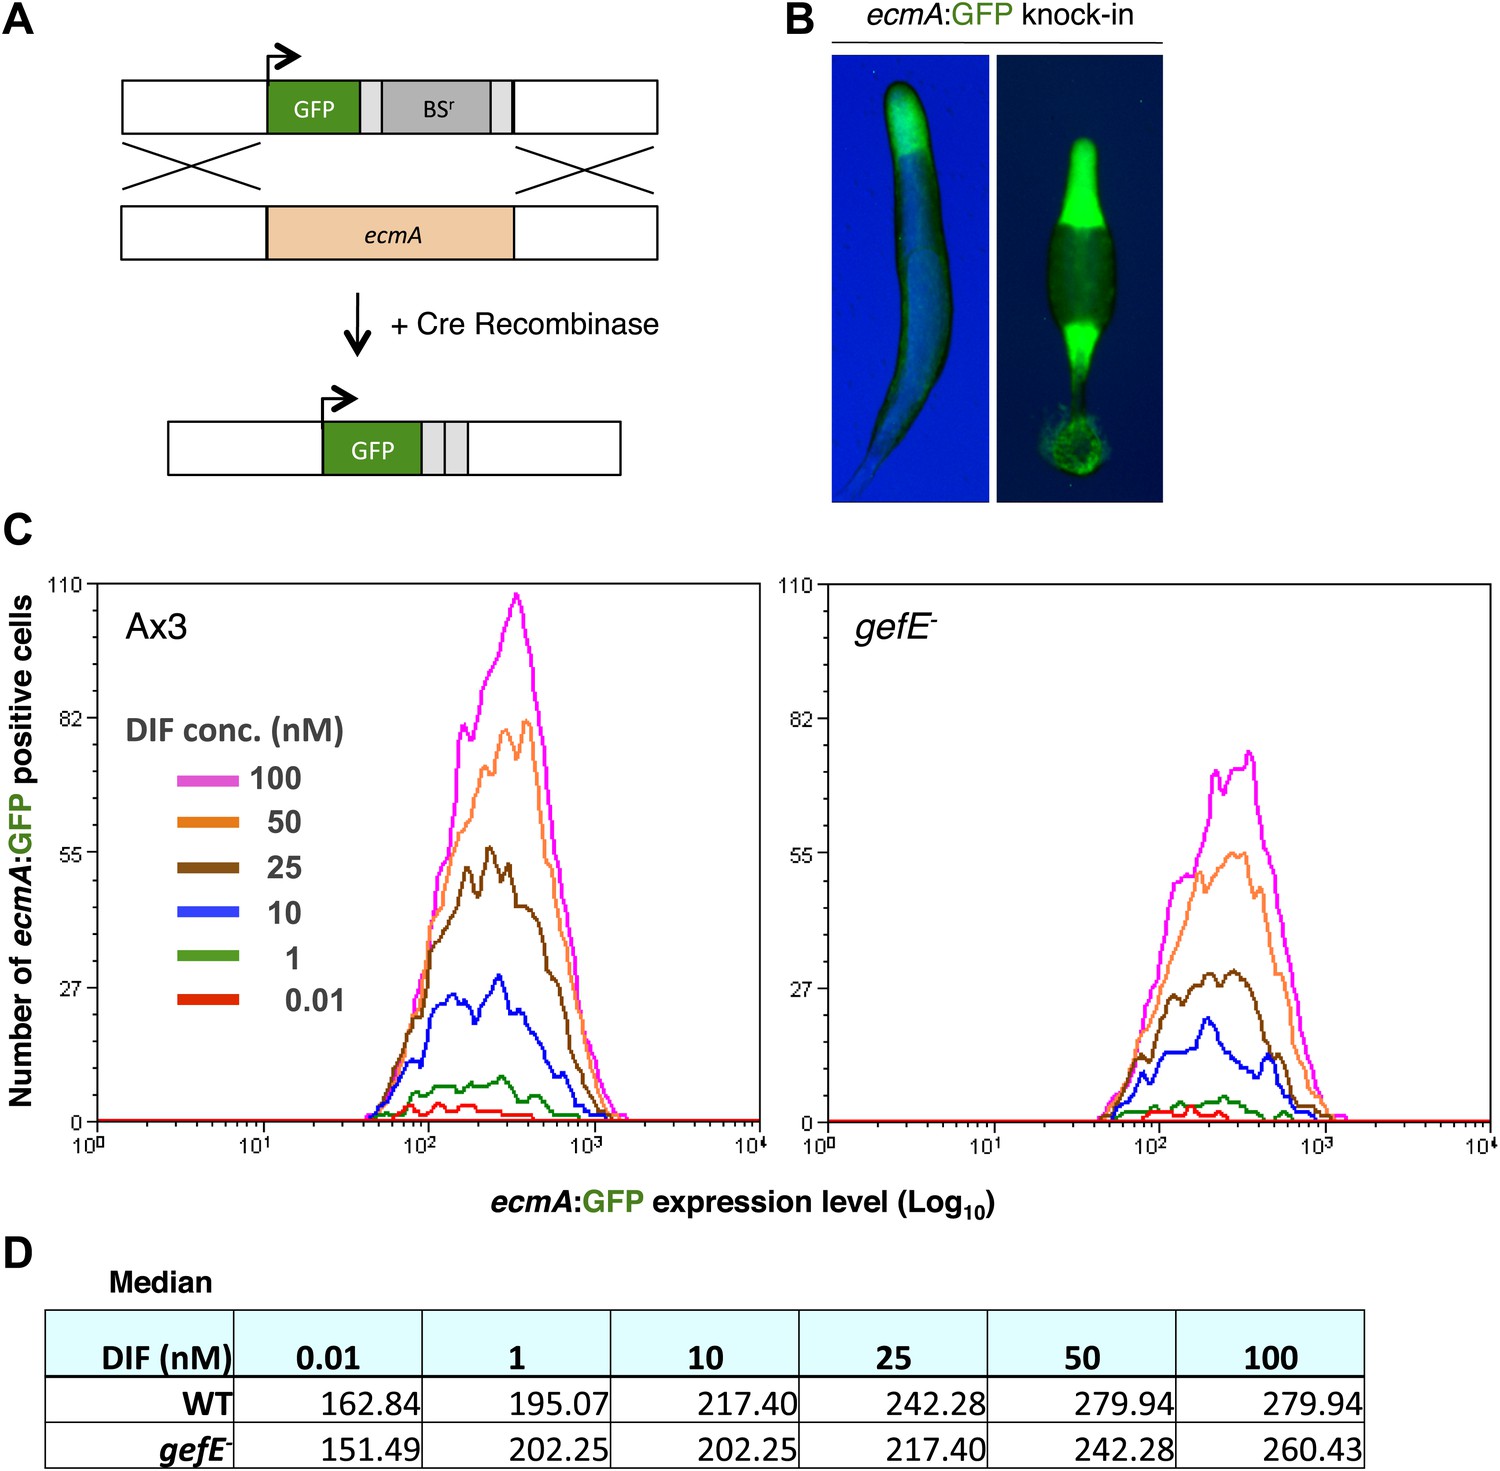
GefE regulates the DIF response threshold.
(A) Replacement of the endogenous ecmA gene with GFP (B) prestalk specific expression of GFP knock-in strain at slug and culminant stages. (C) FACS analysis of Ax3 wild type and gefE− mutant GFP knock-in strains stimulated with 0.01–100 nM DIF for 9 hr. Y-axis shows the number responders and X-axis the GFP expression level per cell. (D) Median GFP expression level of wild type and gefE− mutant populations stimulated with 0.01–100 nM DIF.
Figure 6 with 1 supplement
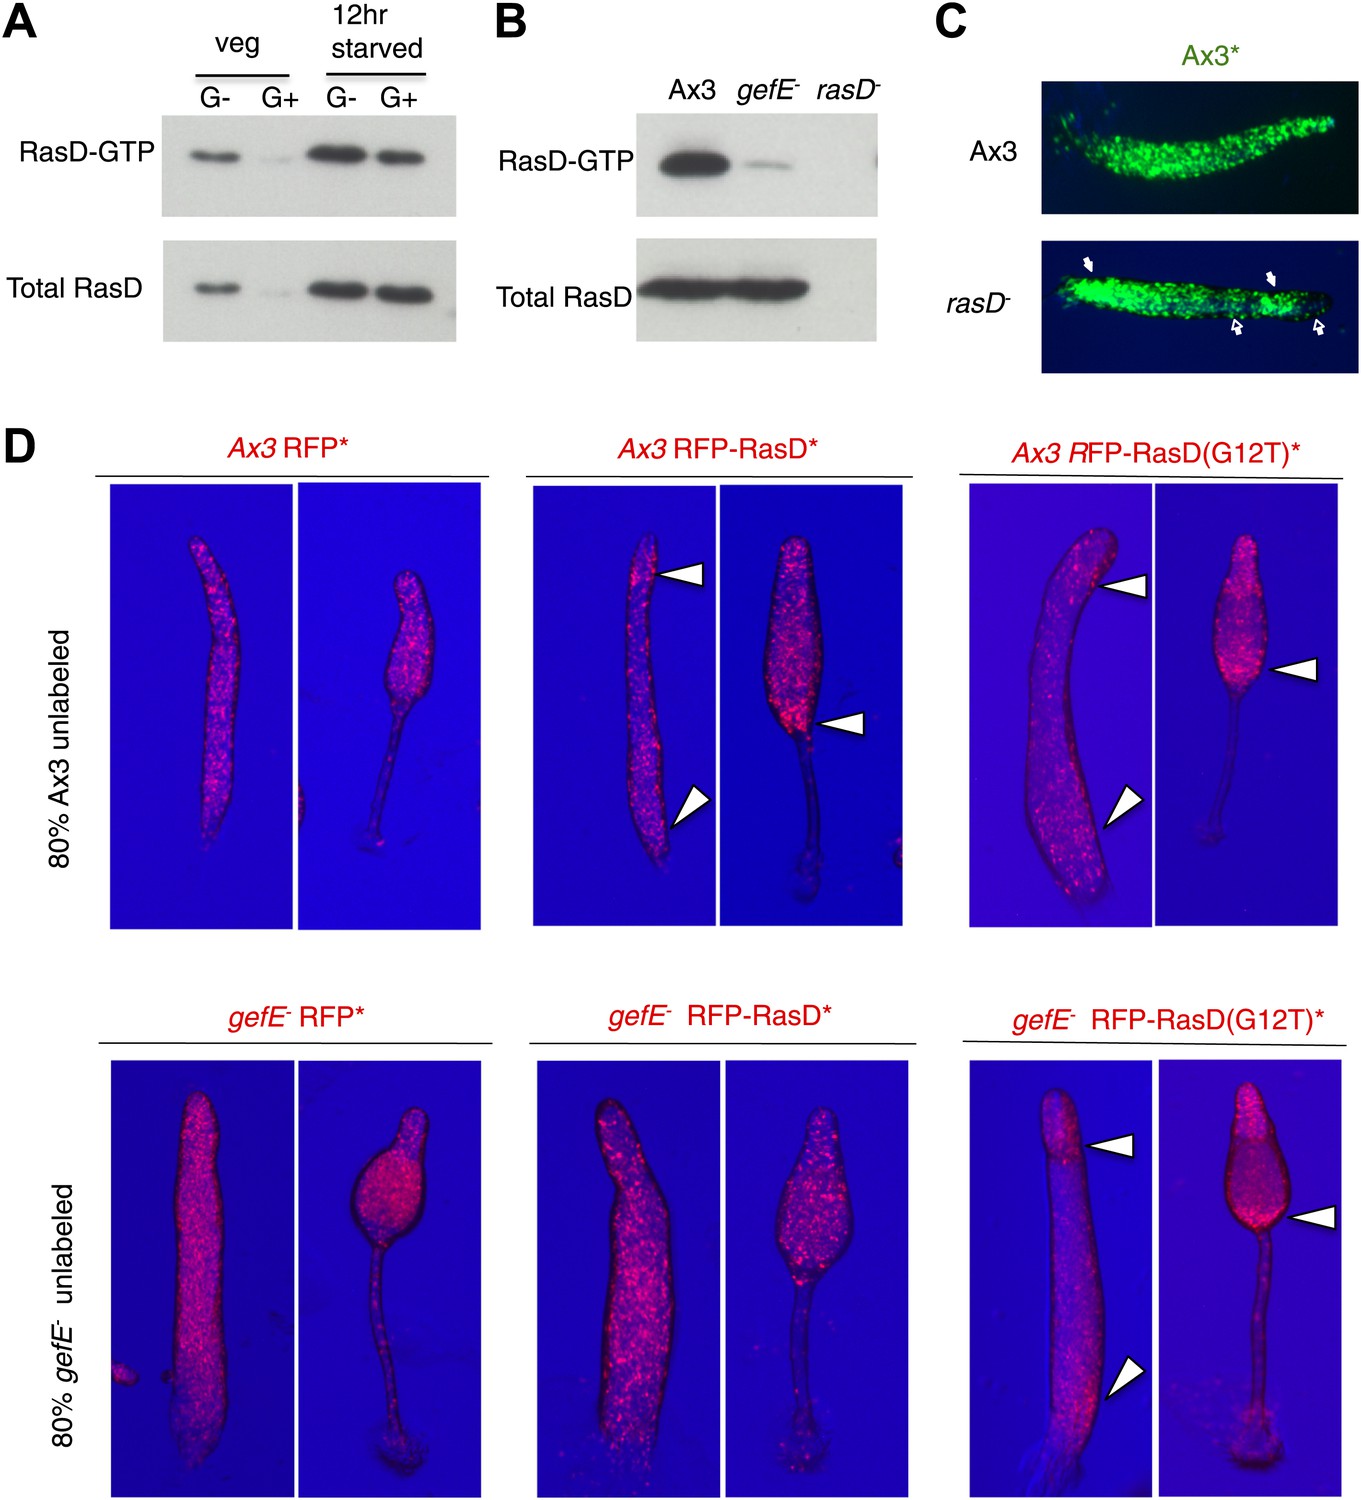
GefE activates RasD.
(A) Comparison of the levels of activated RasD-GTP and total RasD by Western blot in vegetative or 12 hr starved cells grown in the presence or absence of glucose. (B) Comparison of activated RasD-GTP and total RasD levels by Western blot in wild type Ax3, gefE− or rasD− cells. (C) GFP-labelled (*) Ax3 wild type cells mixed at 10:90 ratio with unlabelled Ax3 or rasD− mutant cells. Closed arrows show enrichment of wild type cells in pstO and pstB populations. Open arrows show reciprocal enrichment of rasD− cells. (D) RasD overexpression results in GefE dependent bias towards the pstO and pstB cell fates. 20% cells constitutively expressing RFP, RFP-RasD or RFP-RasD(G12T) were mixed with 80% unlabelled parental cells. When wild type Ax3 cells overexpress RFP-RasD or RFP-RasD(G12T) they become enriched in the pstO and pstB populations (arrows). Only gefE− cells that express constitutively activated RasD(G12T) are enriched in pstO and pstB populations (arrows).
Figure 6—figure supplement 1
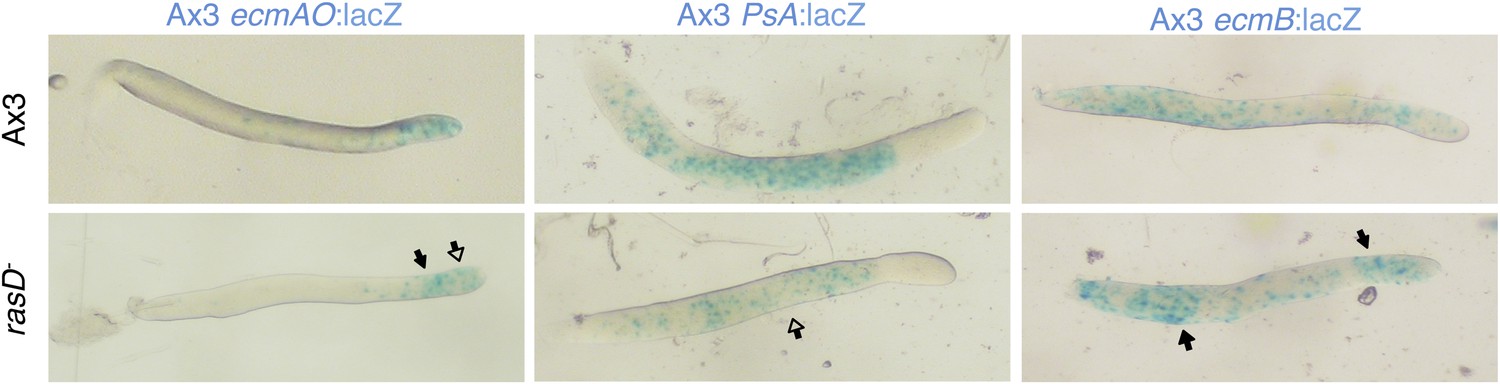
rasD− mutant cells avoid pstO and pstB fates in chimera with wild type cells.
10% Ax3 labelled wild type were mixed with 90% unlabelled rasD− mutant cells. The top row shows the control mix and is comparable to the image directly beneath. Closed arrows indicate enrichment of label, open arrows an absence. The AP axis of all slugs is aligned from right-left.
Figure 7 with 1 supplement
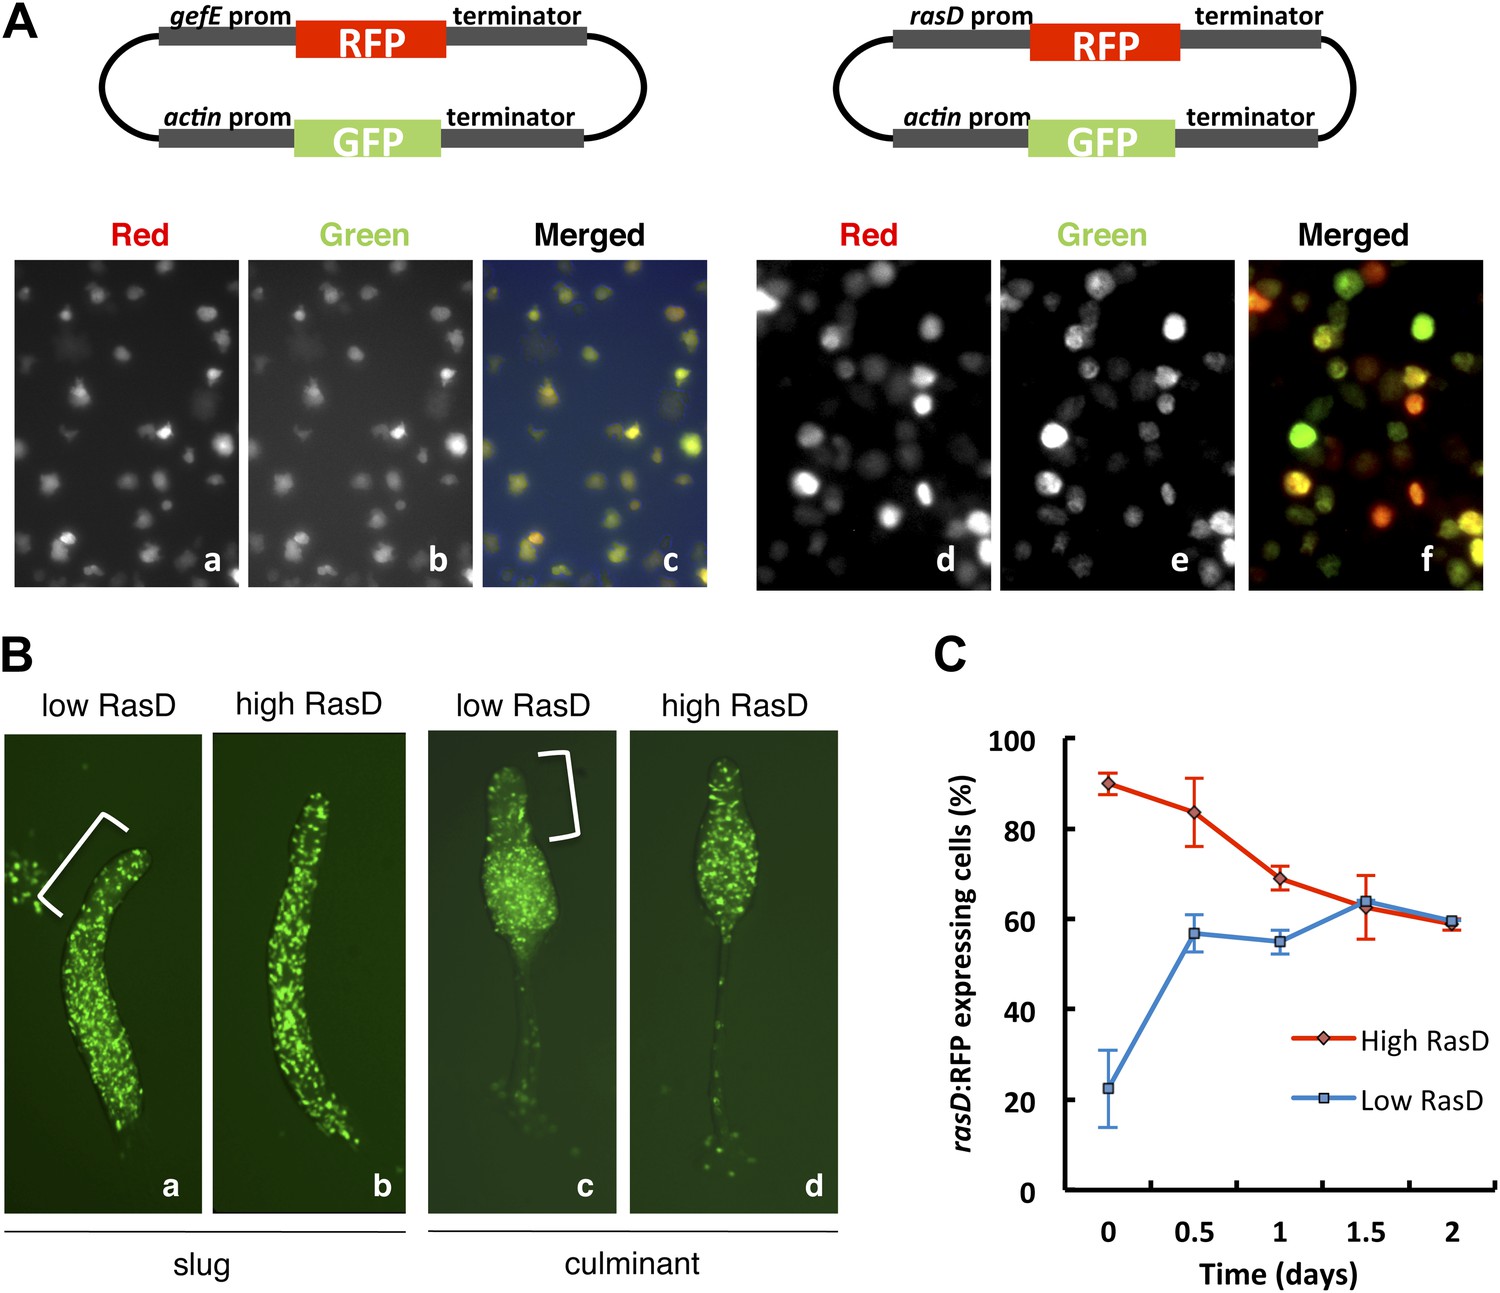
RasD expression is heterogeneous in growth phase populations.
(A) Dual promoter vectors used to drive constitutive GFP expression and gefE promoter (left) or rasD promoter (right) driven RFP expression. Cells growing in tissue culture plates were photographed with a fluorescence microscope on red channel (a and d), green channel (b and e) and both (c and f). (B) Ax3 cells transformed with rasD promoter vector were fractionated into RFP high and RFP low populations by FACS. These populations were mixed in a 5:95 ratio with unlabelled Ax3 cells. Cell fate choice was traced by constitutive expression of GFP at slug (a and b) and culminant (c and d) stages. White bars show regions of fewer GFP cells. (C) FACS sorted low or high rasD:RFP cells were cultured back in HL-5 medium. The ratio of RFP:GFP cells was scored over time.
Figure 7—figure supplement 1
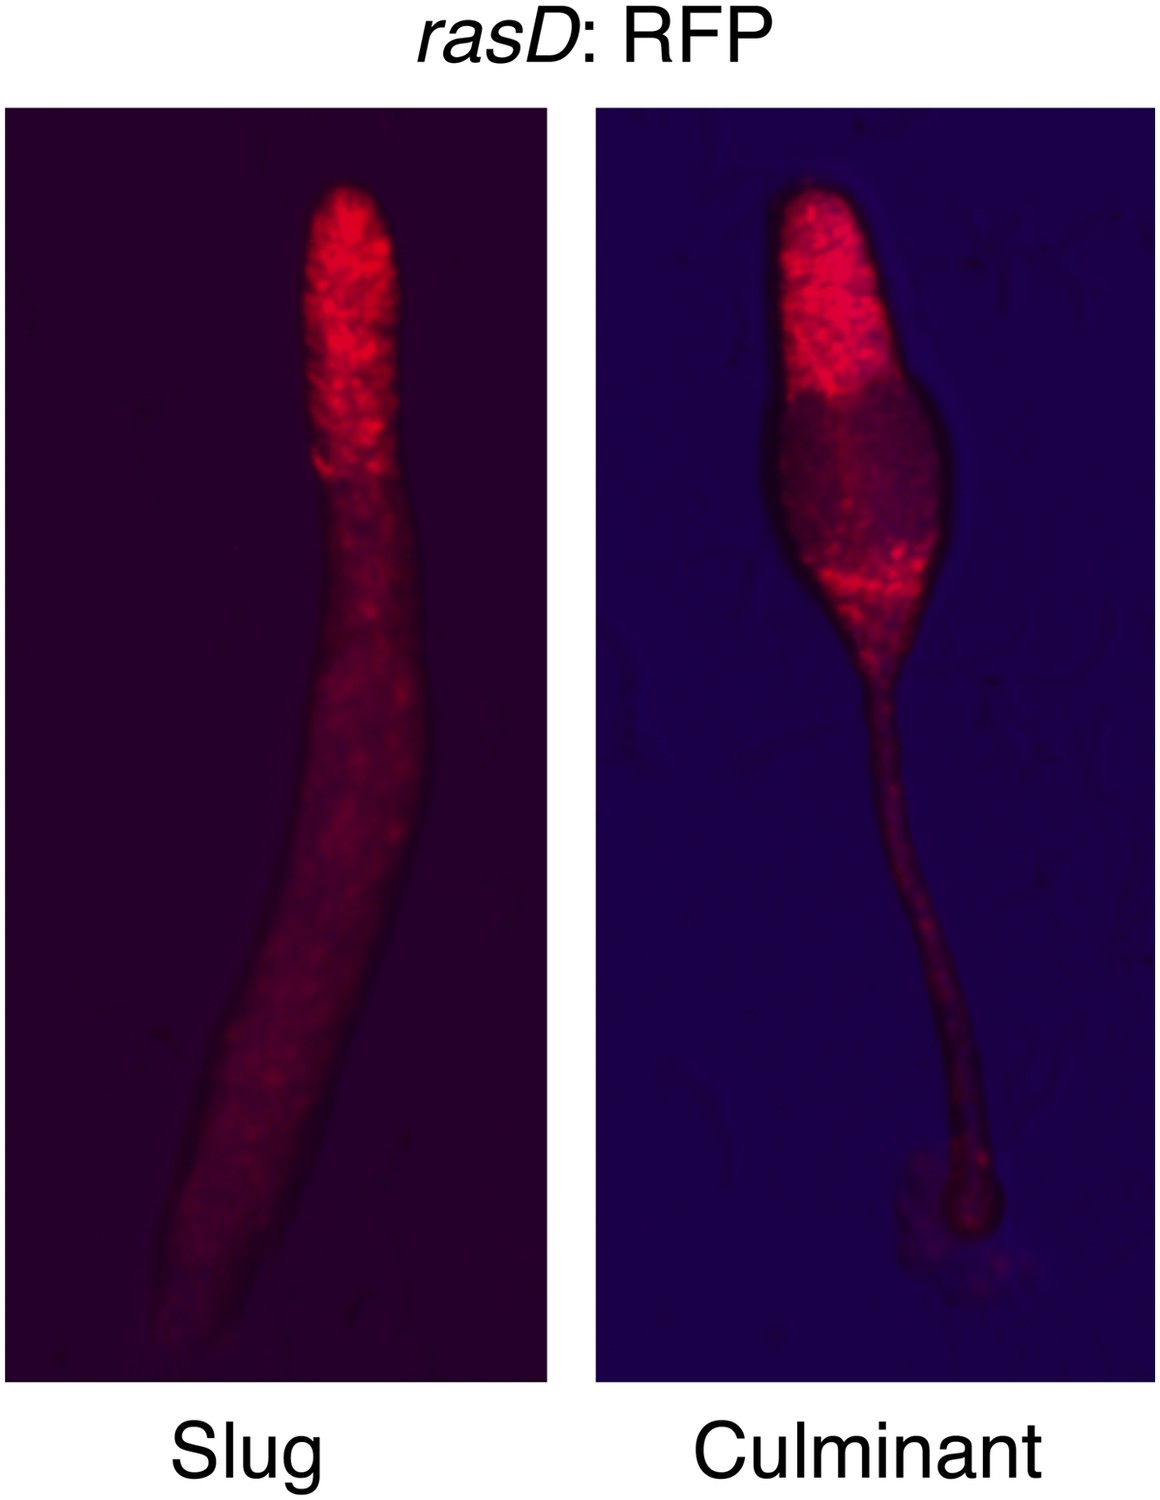
RasD is expressed in prestalk cells during development.
Expression of rasD:RFP (‘text’) in the prestalk populations of a clonal slug (left) and culminant (right). AP axis of both structures oriented top-bottom.
Download links
A two-part list of links to download the article, or parts of the article, in various formats.
Downloads (link to download the article as PDF)
Open citations (links to open the citations from this article in various online reference manager services)
Cite this article (links to download the citations from this article in formats compatible with various reference manager tools)
Developmental lineage priming in Dictyostelium by heterogeneous Ras activation
eLife 2:e01067.
https://doi.org/10.7554/eLife.01067


