Coordinated genomic control of ciliogenesis and cell movement by RFX2
- University of Texas at Austin, United States
- Stanford University, United States
- Howard Hughes Medical Institute, University of Texas at Austin, United States
Figures
Figure 1

Conserved cell behaviors during multi-ciliated cell development in mammalian airways and Xenopus epidermis.
https://doi.org/10.7554/eLife.01439.003
Figure 2 with 4 supplements
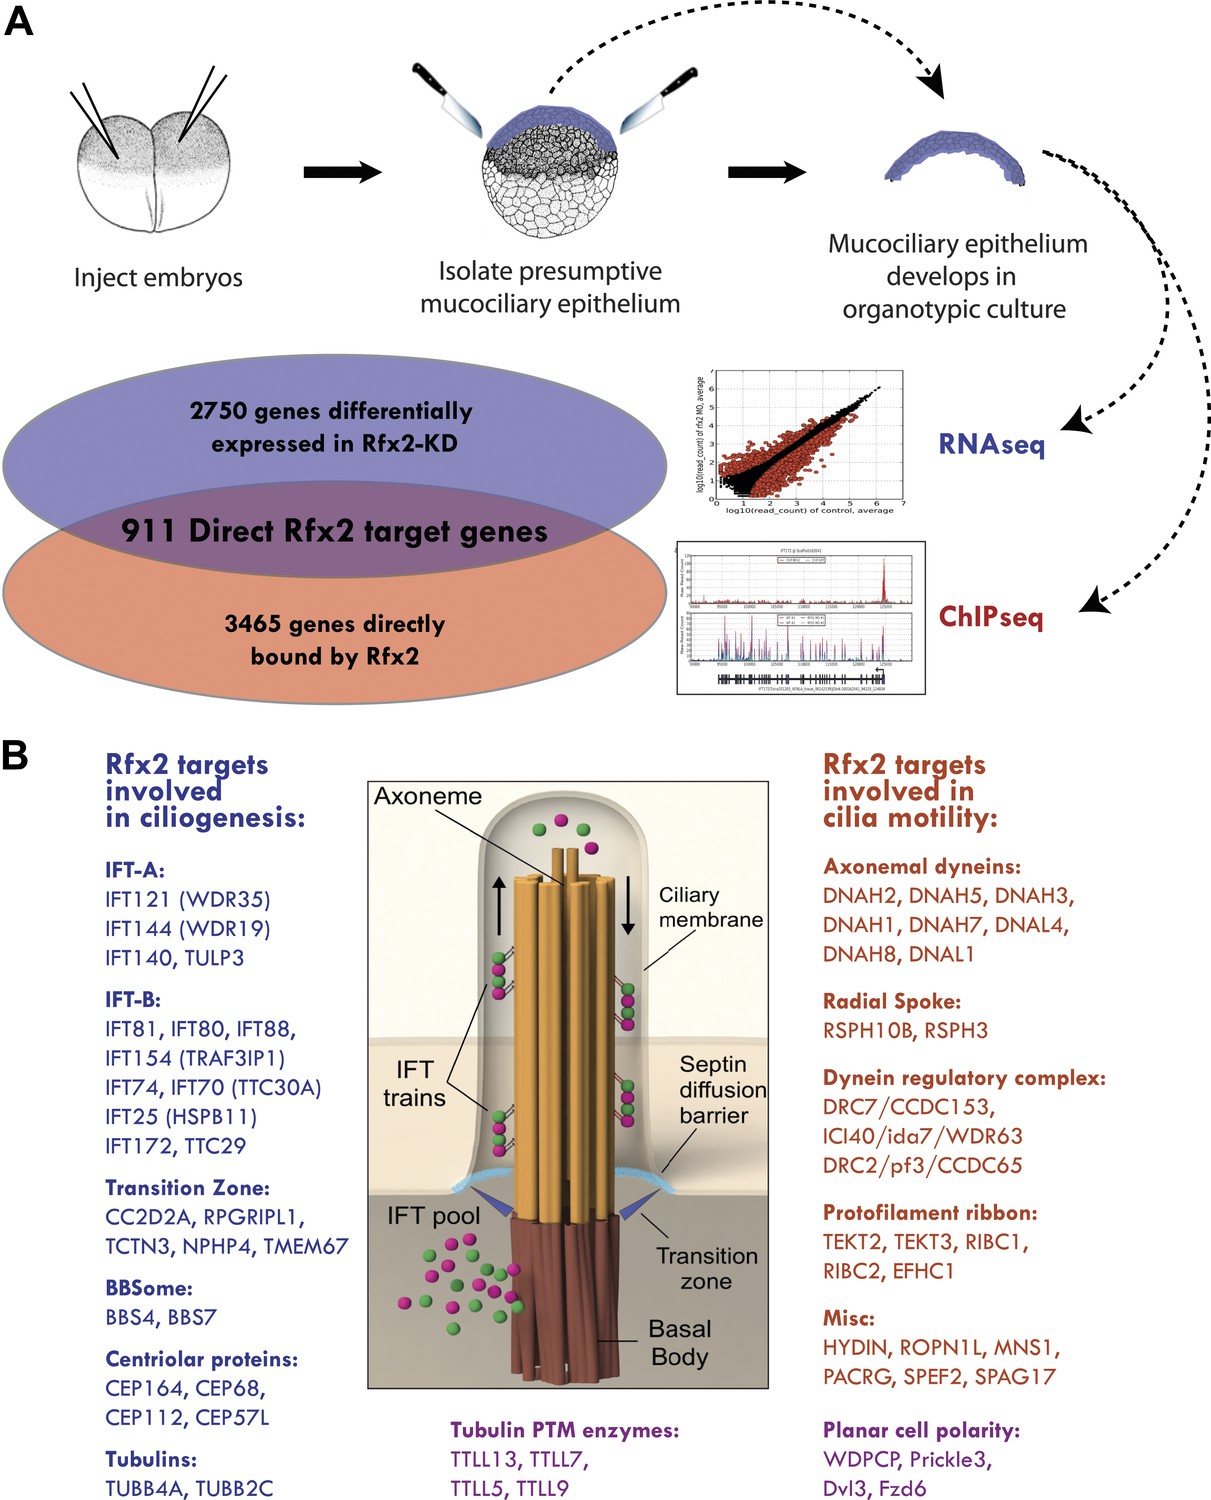
Rfx2 controls diverse ciliogenic machinery.
(A) Schematic diagram of this study. (B) Prominent cilia-related genes identified as Rfx2 targets in this study.
-
Figure 2—source data 1
911 genes corresponding to the directly regulated downstream target genes of Rfx2.
- https://doi.org/10.7554/eLife.01439.005
-
Figure 2—source data 2
Table of enriched GO terms.
- https://doi.org/10.7554/eLife.01439.006
Figure 2—figure supplement 1
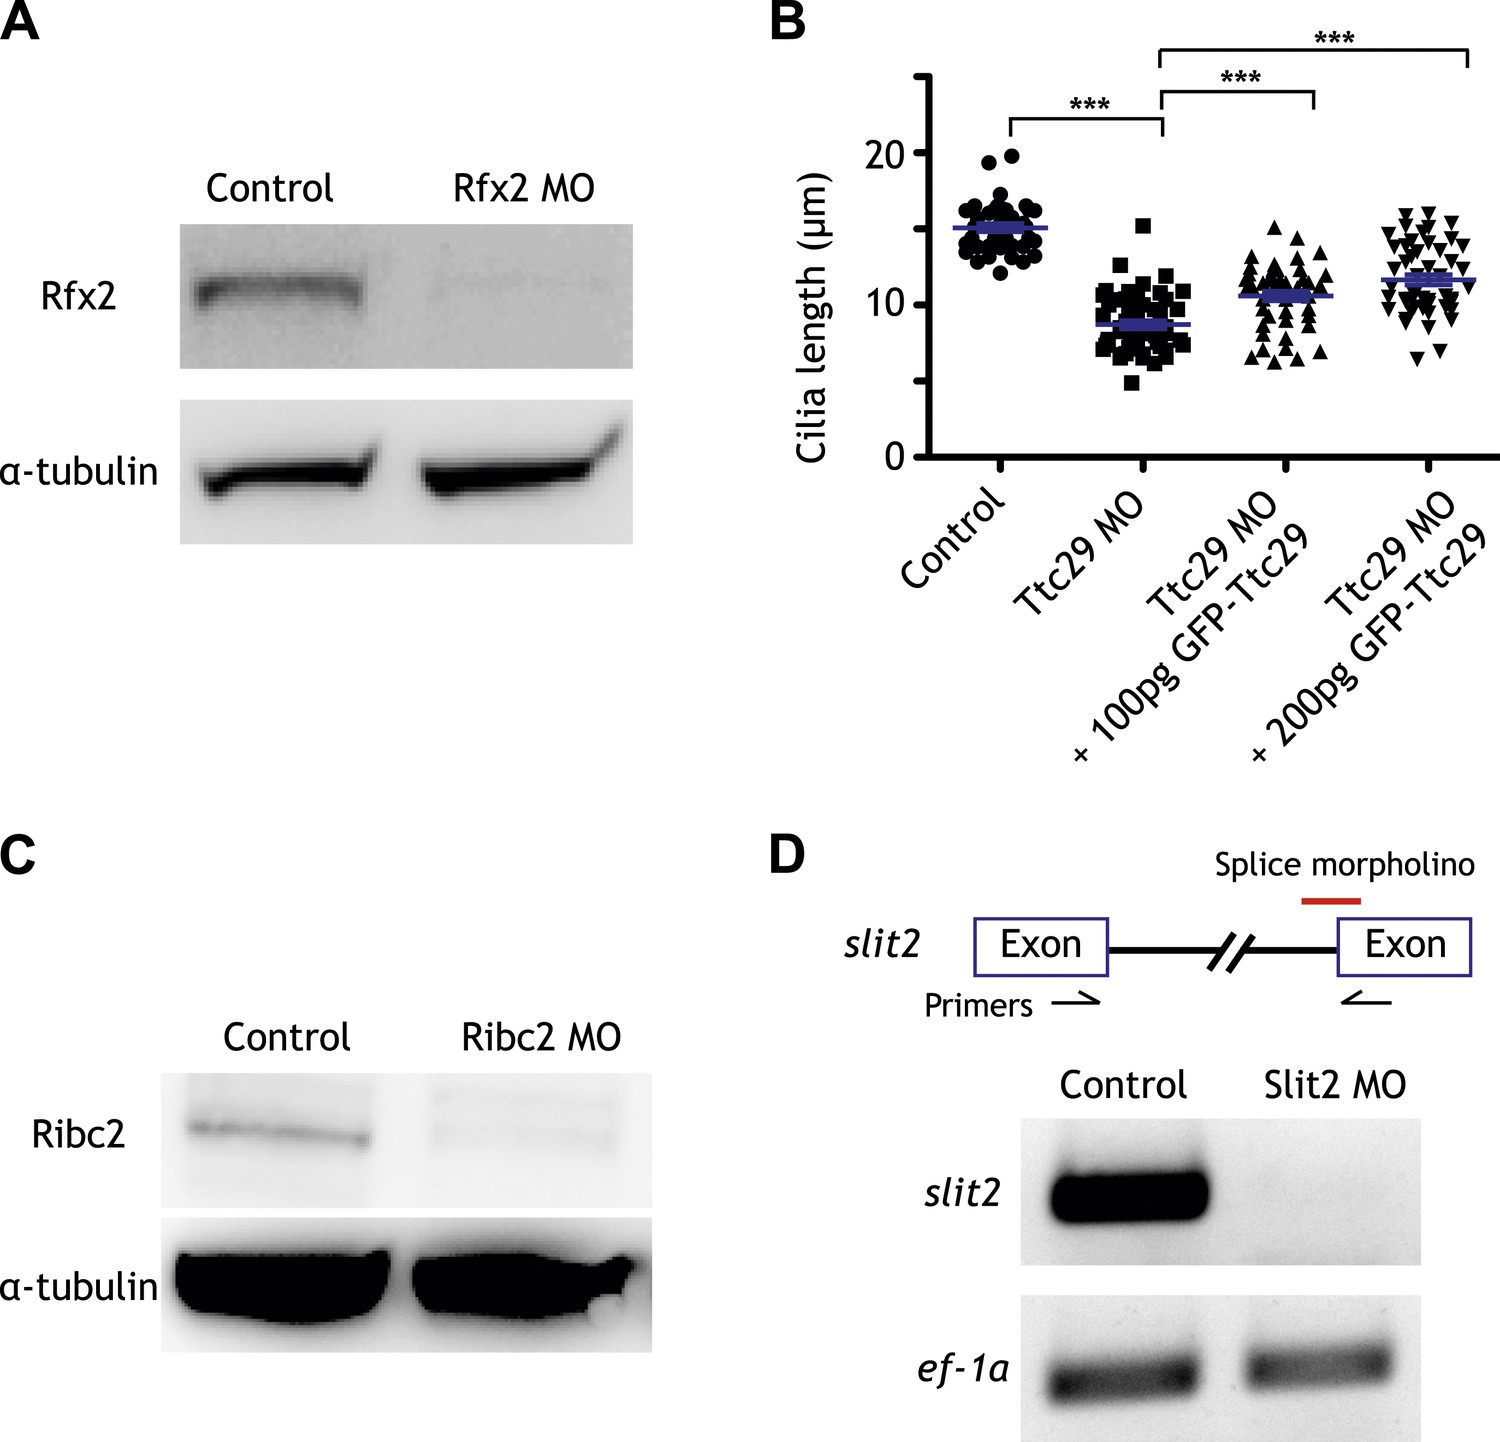
Controls for the morpholino antisense oligonucleotides used in this study.
(A) The amount of Rfx2 protein was reduced in Rfx2 morphants. α-tubulin served as a loading control. (B) Cilia length was significantly reduced following Ttc29 knockdown. The phenotype can be partially rescued by co-injection with GFP-Ttc29 mRNA. (C) The amount of Ribc2 protein was reduced following Ribc2 knockdown. α-tubulin served as a loading control. (D) The expression of slit2 was reduced following Slit2 knockdown.
Figure 2—figure supplement 2
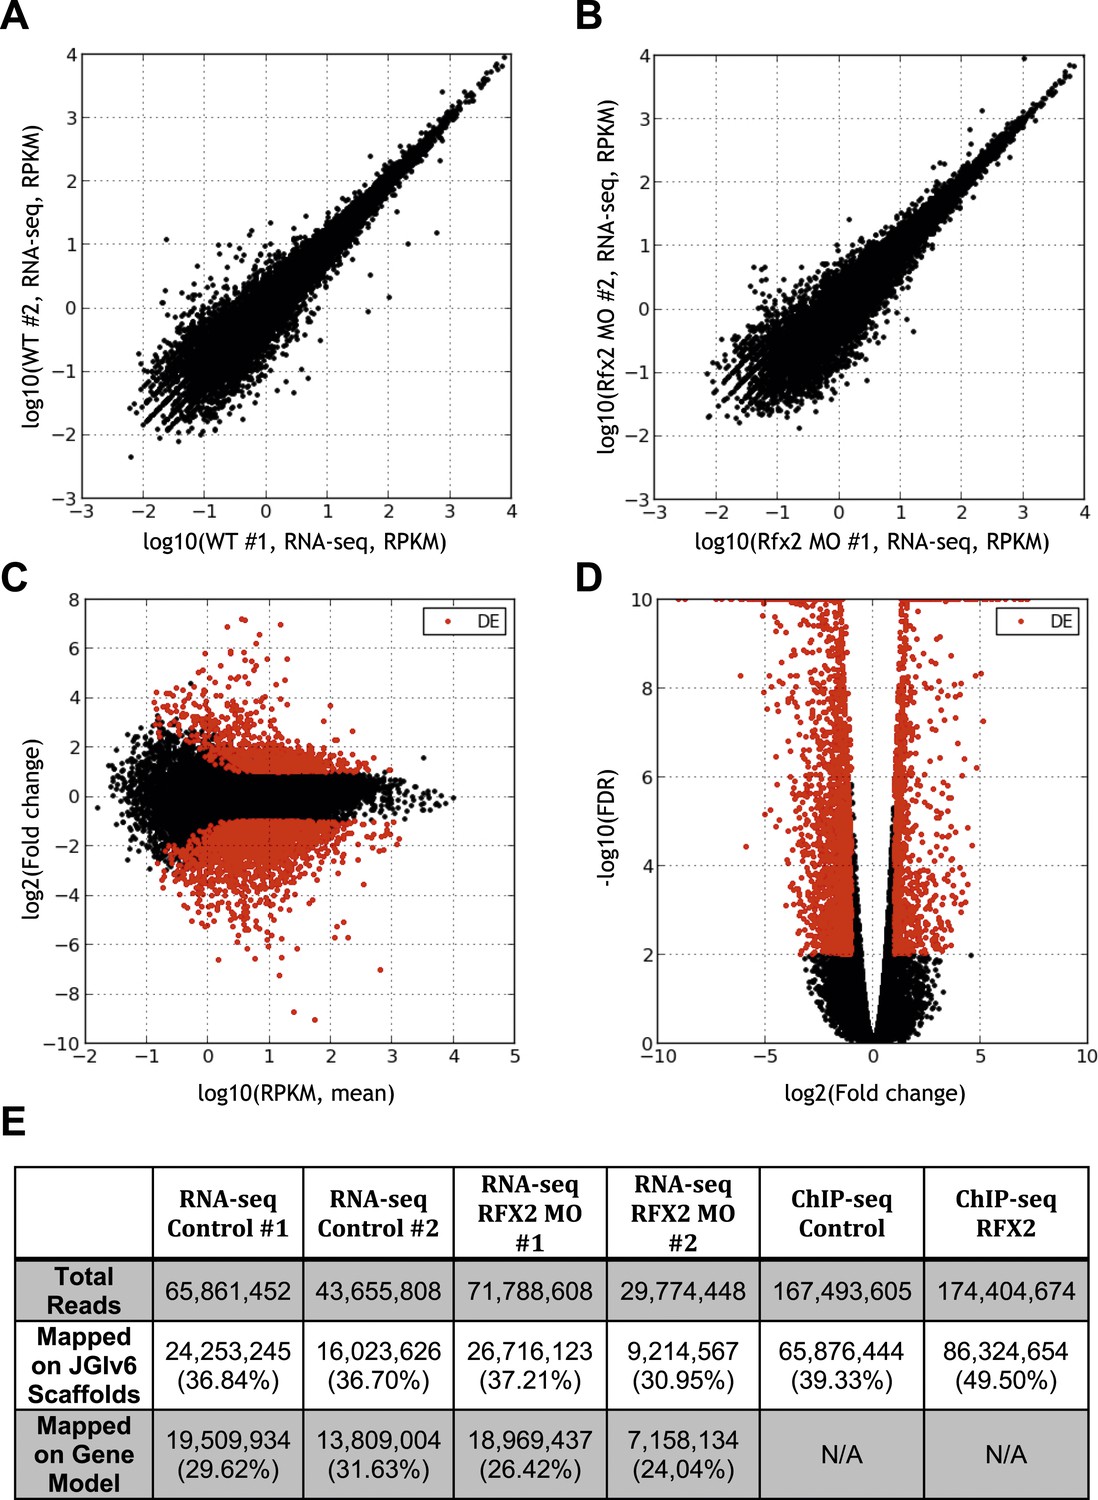
Summary of RNA-seq data.
(A) Correlation between RNA abundances from the replicate wild-type control samples, (B) correlation between RNA abundances from the replicate RFX2 knockdown samples, (C) MA-plot showing the relationship between fold-change and average abundance of each gene, and (D) Volcano plot showing the relationship of fold-change to FDR (adjusted p-value for differential expression). Genes differentially expressed in Rfx2 knockdown samples are indicated as red dots on (C) and (D). No systematic biases were evident among the differential expressed genes. Although the numbers of raw reads differed between samples, their normalized read counts correlated well. (E) Summary of sequencing data. The row titled ‘Total reads’ provides the numbers of Illumina Hi-Seq sequencing reads after pre-processing to remove low quality. We used the set of JGI 6.0 scaffolds longer than 10,000 bp for genome mapping, and the longest isoform of each gene model (‘Oktoberfest’ version), with bowtie1 (version 0.12.7) allowing two mismatches on the seed (-v 2 option). For mapping ChIP-Seq data to genomic scaffolds, we considered only unique hits (-m 1 option). For mapping RNA-seq reads to transcript models, we allowed for redundant hits (-an option) so as to maximize the signals from the RNA-seq datasets for the purposes of calculating differential gene expression, where redundant hits should not significantly affect the analysis, as each gene model was independently tested across conditions. We normalized across libraries by the total number of reads mapped onto a gene model. Subsequent tests of mapping without allowing redundant hits (-m 1 option) against the longest gene model confirmed that the differences between these two options was negligible. It should be noted that RNA-seq reads are paired-end 2 × 50 bp and ChIP-seq reads are single-end 1 × 35 bp.
Figure 2—figure supplement 3
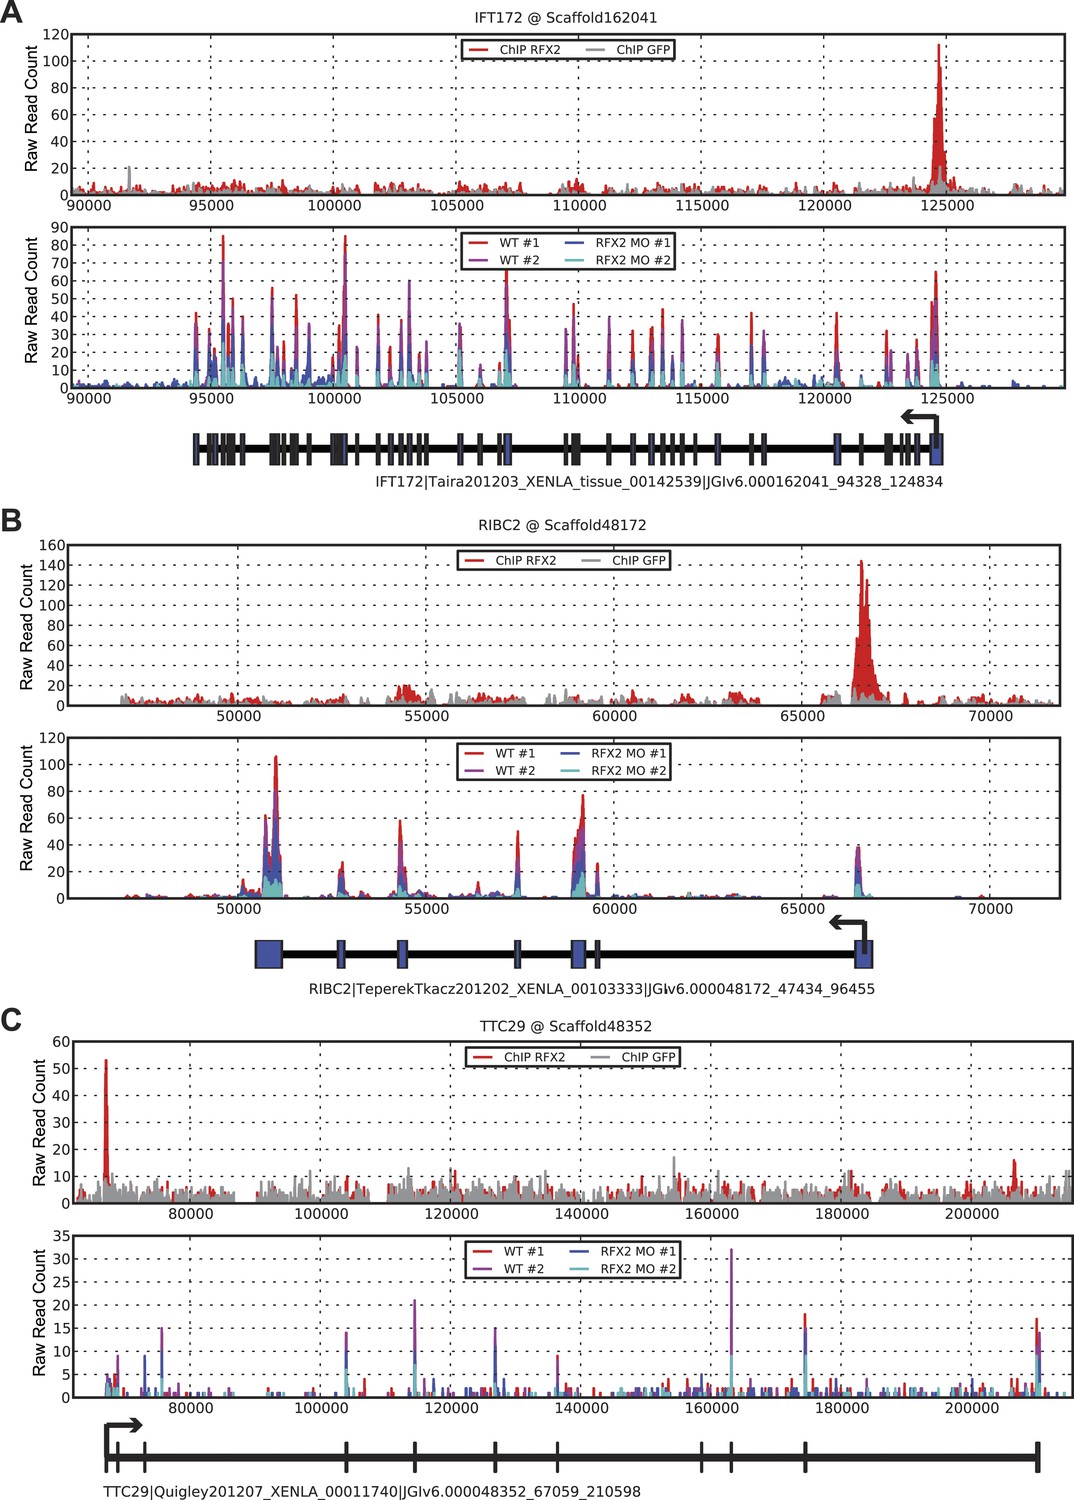
Three examples of RNA-seq and ChIP-seq data.
(A) ift172 (B) ribc2 (C) ttc29. In each figure, the top panel plots ChIP-seq read depths for Rfx2-GFP (red) and the GFP control (gray) samples across the genomic scaffold, while the middle panel plots RNA-seq read depths for the two replicate control experiments (red and magenta) and Rfx2 morpholino knockdown experiments (blue and cyan). All mapping results are reported as raw read counts (not normalized). Each bottom panel indicates the corresponding X. laevis gene model, indicating transcription start sites with black arrows. In each case, Rfx2 binds near the first exon of the transcripts, and gene models match well to exons from the RNA-seq data.
Figure 2—figure supplement 4
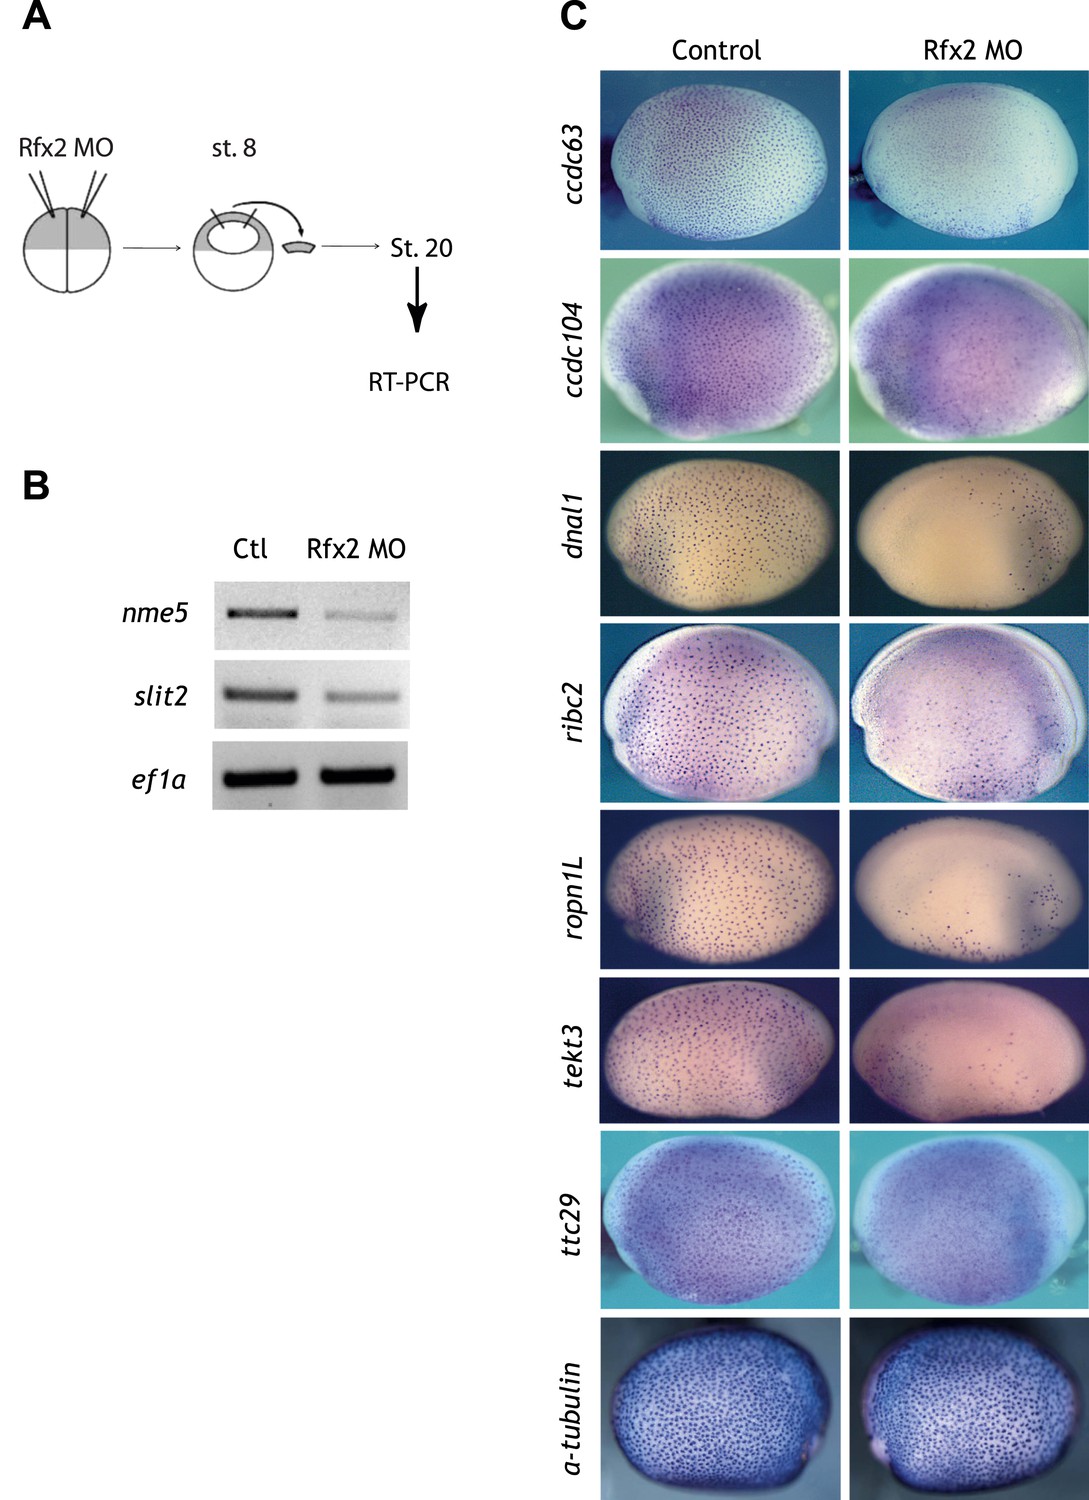
Validation of Rfx2-dependent genes.
(A) Overview of the animal cap assay. (B) RT-PCR results. Ctl: control animal caps. Rfx2 MO: Rfx2 morpholino-injected animal caps. α-tubulin expression was not changed. ef1α served as a loading control. (C) ccdc63, ccdc104, dnal1, ribc2, ropn1l, tekt3, and ttc29 were expressed in MCCs and their expressions were Rfx2-dependent.
Figure 3
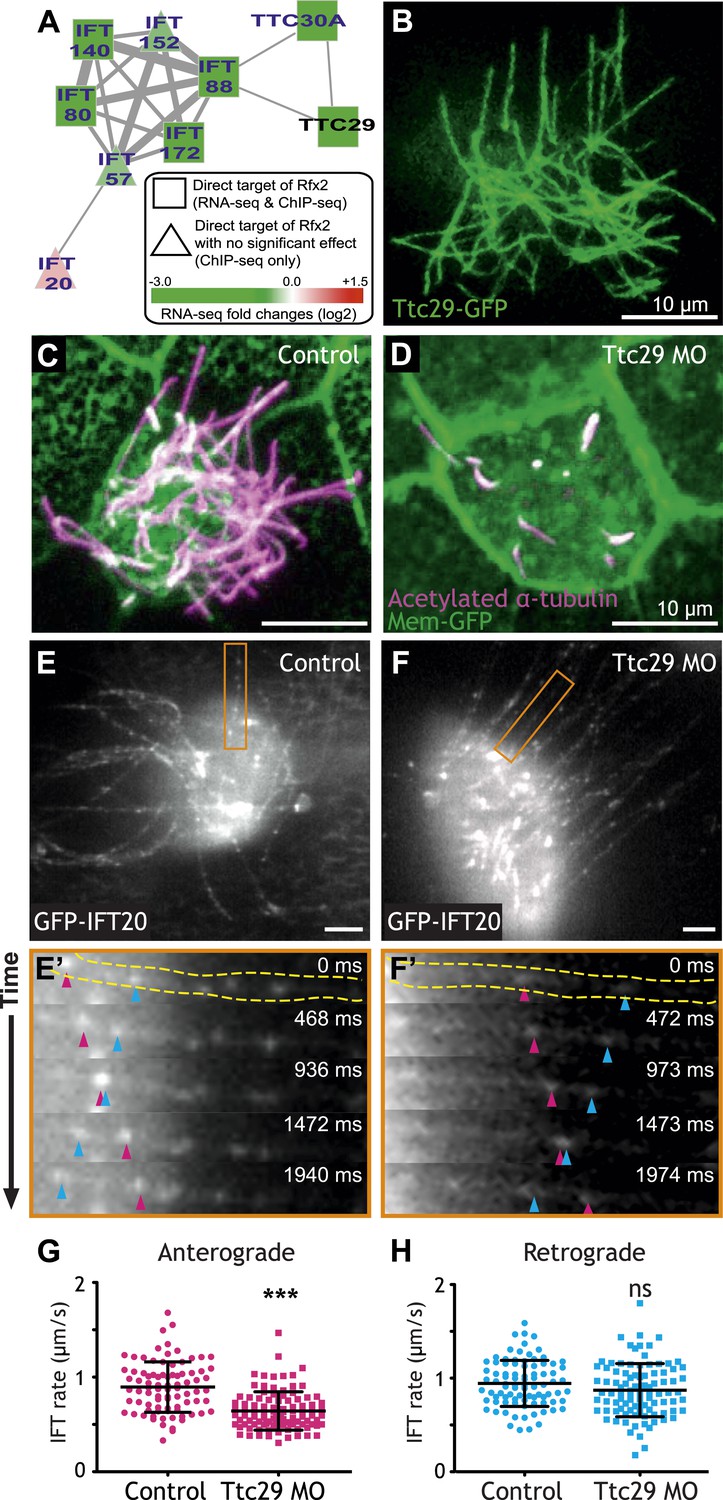
Ttc29 is required for ciliogenesis of MCCs by regulating Intraflagellar Transport.
(A) Ttc29 is clustered with IFT components in HumanNet. (B) Ttc29-GFP is localized in the axoneme. (C) A MCC of a stage 27 control embryo injected with membrane-GFP. Acetylated α-tubulin labels cilia and GFP labels the cell boundary. (D) A MCC of a stage 27 Ttc29 morpholino-injected embryo. Note that only a few short axonemes are shown following Ttc29 knockdown. (E) Still-frame of a control multiciliated cell expressing GFP-IFT20. The axoneme shown in the time series (E′) is labeled in orange (Video 1). (E′) A time-series of a single control axoneme from (E) shows processive bi-directional traffic (the distal tip of the axoneme is to the right; pink arrowheads denote an anterograde train over time, blue arrowheads indicate a retrograde train). (F) A single still frame from a Ttc29 MO treated multi-ciliated cell expressing GFP-IFT20 (Video 2). (F′) A time-series of a single axoneme from (F). Note that processive bi-directional traffic is qualitatively normal. (G) Quantification of anterograde GFP-IFT20 rates shows a significantly slower average anterograde rate upon Ttc29 MO treatment (Control: n = 97 IFT trains, 40 axonemes, 21 Cells, 6 embryos. Ttc29 MO: n = 100 IFT trains, 53 axonemes, 20 cells, 6 embryos. p < 0.0001). (H) Quantification of retrograde GFP-IFT20 rates reveals no significant difference between control and Ttc29 MO conditions (Control: n = 87 IFT trains, 40 axonemes, 21 cells, 6 embryos. Ttc29 MO: n = 94 IFT trains, 53 axonemes, 20 cells, 6 embryos. p = 0.0510).
Figure 4 with 3 supplements
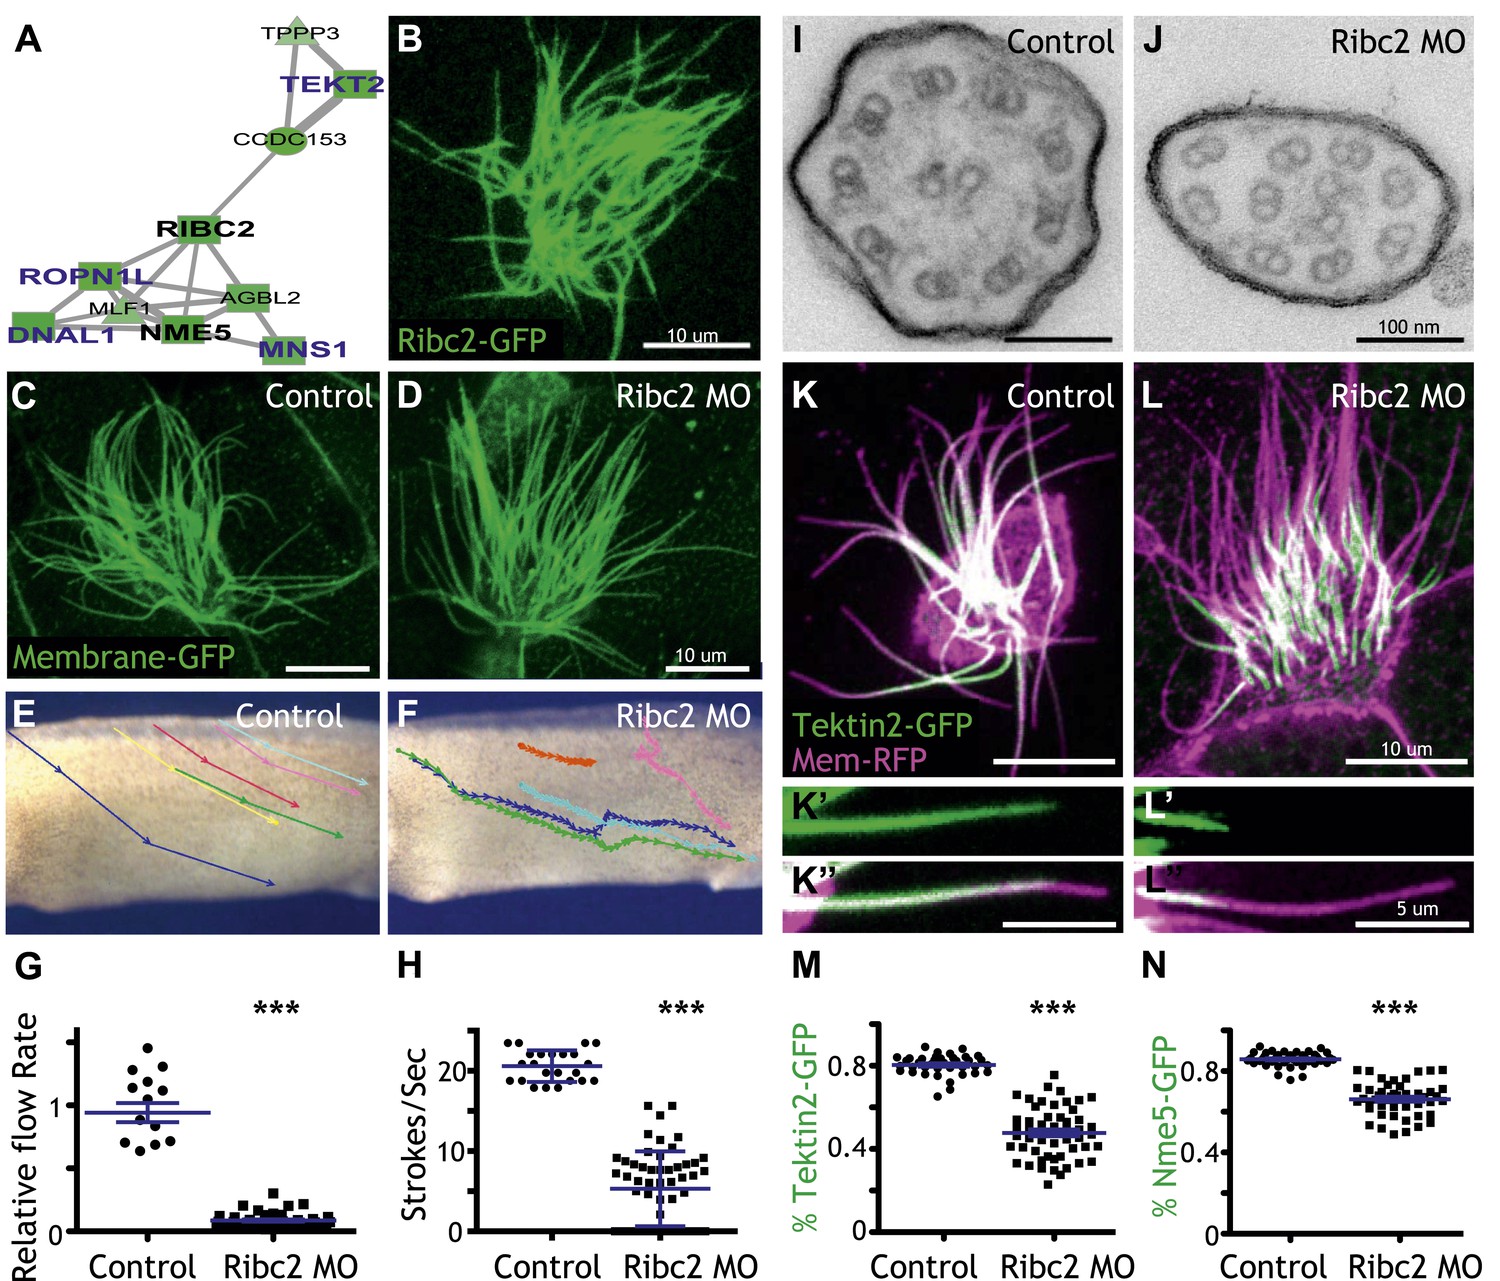
Ribc2 is required for ciliary motility.
(A) Ribc2 is clustered in HumanNet with known ciliary beating components, such as Dnal1, Ropn1l, and Mns1 (B) Ribc2-GFP is localized along the axoneme. (C) An MCC of a stage 27 control embryo injected with membrane-GFP. (D) An MCC of a stage 27 embryo injected with Ribc2 morpholino. Ribc2 is not essential for cilia assembly. Tracking of latex beads moving across the epidermis of the control embryo (E) and the Ribc2 morphant (F). An arrow represents the moving distance per time frame. The relative average flow rate is shown in (G). While the average flow rate of control is normalized to 1 ± 0.075 (mean ±SEM), it is significantly reduced to 0.085 ± 0.008 in Ribc2 morphants. (H) Quantification of ciliary beating using high-speed confocal (Videos 3 and 4). Beat frequency is 20.59 ± 0.410 strokes/s in control whereas only 5.29 ± 0.635 strokes/s following Ribc2 knockdown. Ultrastructure of axoneme from a control embryo (I) and a Ribc2 knockdown embryo (J) were visualized using TEM. Lack of dynein arms were observed in Ribc2 morphants. (K) A MCC of a stage 27 control embryo injected with Tektin2-GFP and membrane-RFP. Enlarged view of an axoneme is shown in (K′) (K′′). (L) A MCC of a stage 27 Ribc2 morphant. Enlarged view is shown in (L′) (L′′). (M) Tektin2-GFP generally decorates 80% (±0.8) of the axoneme as marked by membrane-RFP; this ratio is significantly reduced, to 48% (±1.6), following Ribc2 knockdown (N). Nme5-GFP generally decorates 86% (±0.5) of the axoneme; this ratio is significantly reduced, to 66% (±1.2), following Ribc2 knockdown. ***p < 0.0001 Mann–Whitney test.
Figure 4—figure supplement 1
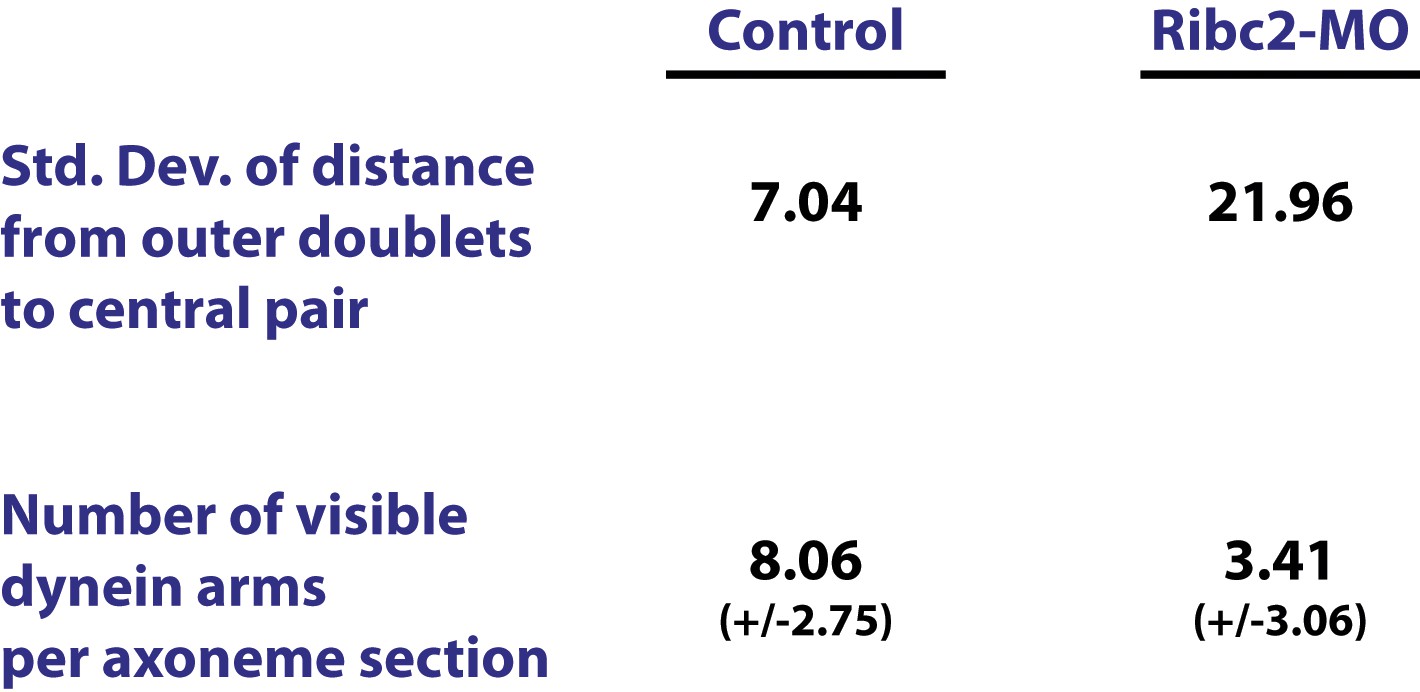
Ribc2 is required for axonemal organization.
Blind analysis of distance from outer doublets to central pair and visible dynein arms in control and Rfibc2 morphants.
Figure 4—figure supplement 2
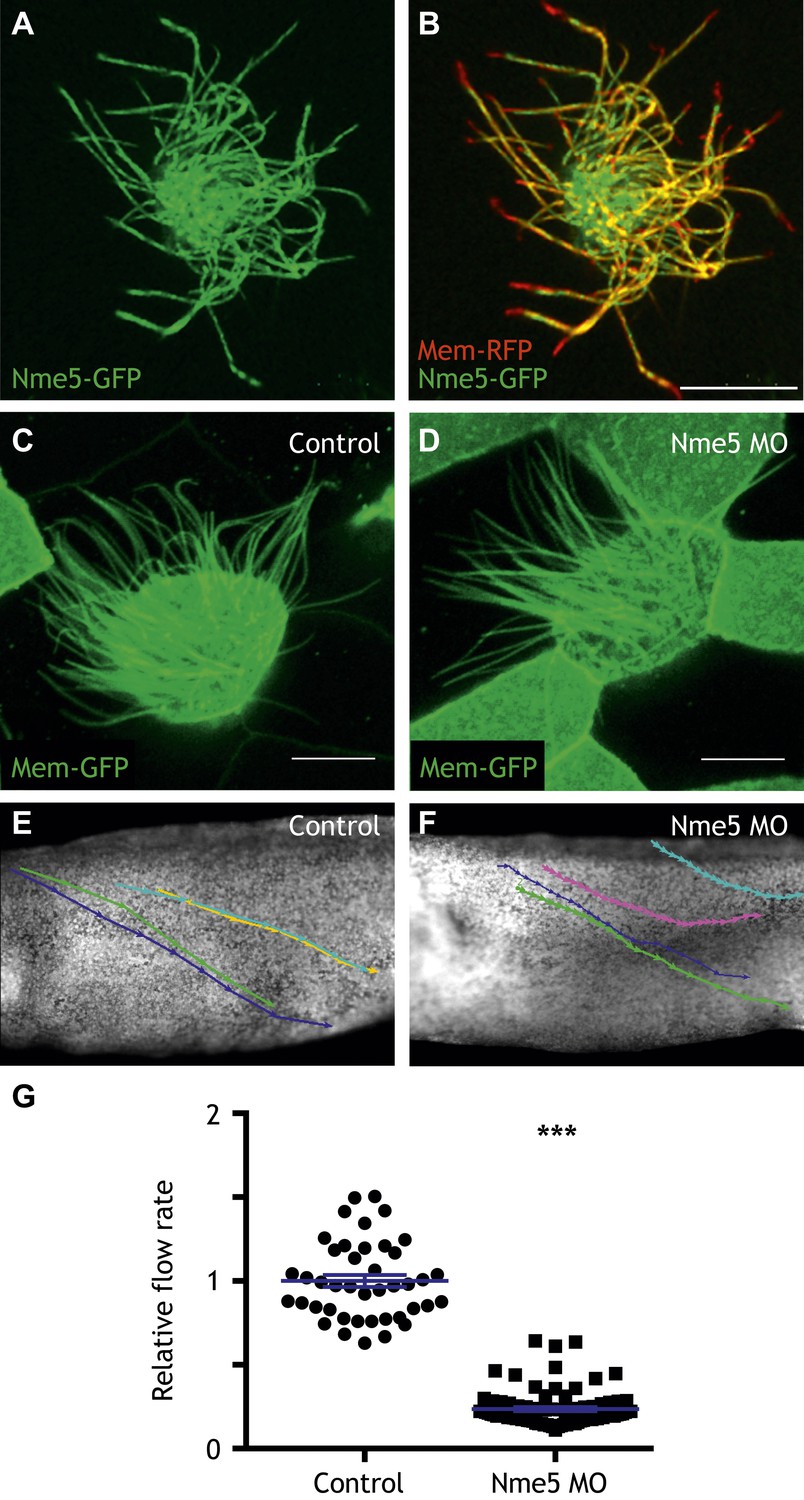
Nme5 is required for ciliary motility.
(A and B) A MCC of a stage 27 embryo injected with Nme5-GFP and membrane-RFP. (C) A MCC of a stage 27 control embryo injected with membrane-GFP. (D) A MCC of a stage 27 embryo injected with Nme5 morpholino. Ribc2 is not essential for cilia assembly. Tracking of latex beads moving across the epidermis of the control embryo (E) and the Ribc2 morphant (F). An arrow represents the moving distance per time frame. The relative average flow rate is shown in (G). While the average flow rate of control is normalized to 1 ± 0.036 (mean ±SEM), it is significantly reduced to 0.24 ± 0.011 in Nme5 morphants. Control: n = 42, 3 embryos. Ribc2MO: n = 88, 3 embryos. ***p < 0.0001 Mann–Whitney test. Scale bar: 10 µm.
Figure 4—figure supplement 3
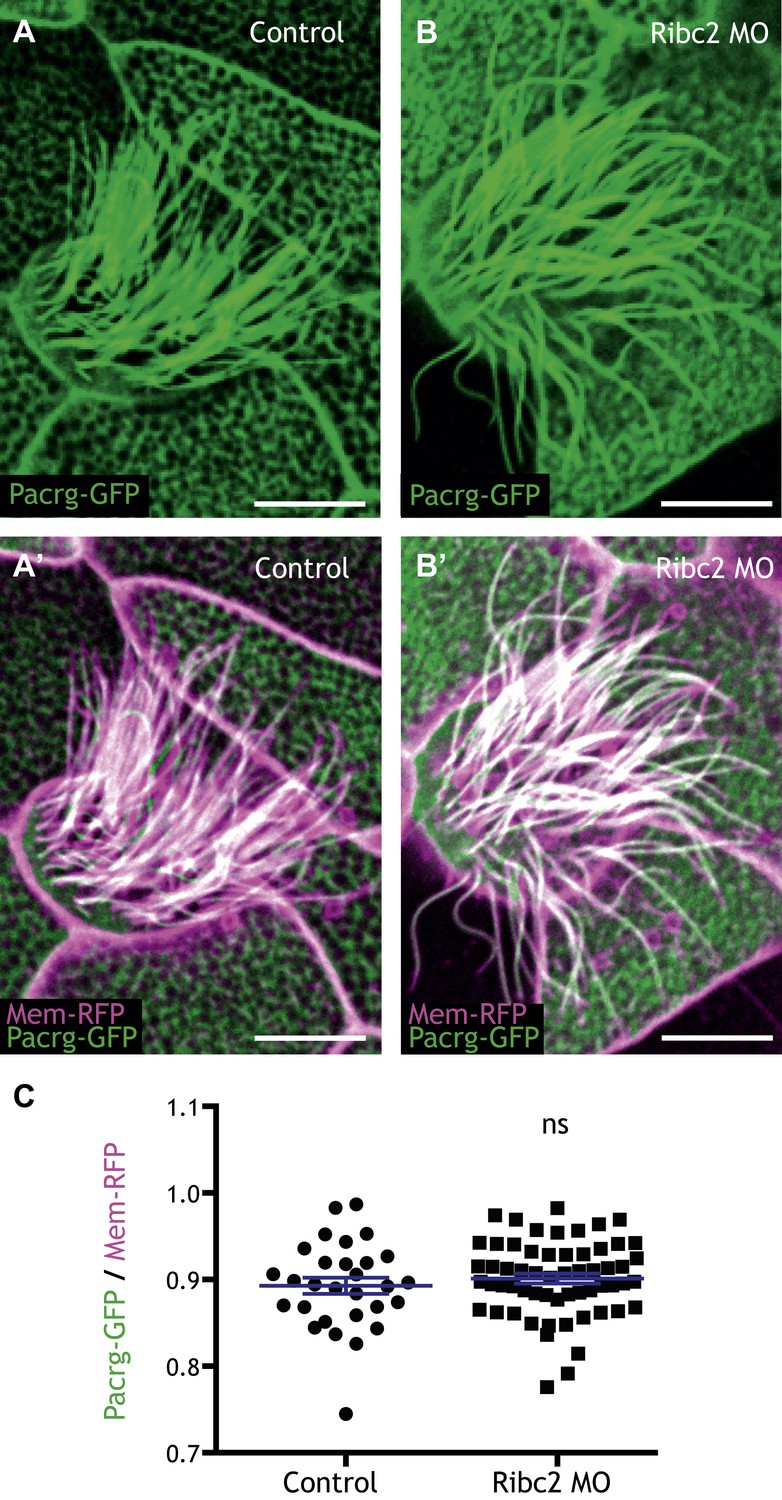
Ribc2 is not required for the axonemal localization of Pacrg-GFP.
(A) (A′) A MCC of a stage 27 control embryo injected with Pacrg-GFP and membrane-RFP. (B) (B′) A MCC of a stage 27 Ribc2 morphant. (C) The length ratio of Pacrg-GFP to membrane-RFP. The ratio is not significantly different between control embryos and Ribc2 morphants. Scale bar: 10 µm.
Figure 5
Rfx2 is essential for the insertion of nascent MCCs into the mucociliary epithelium.
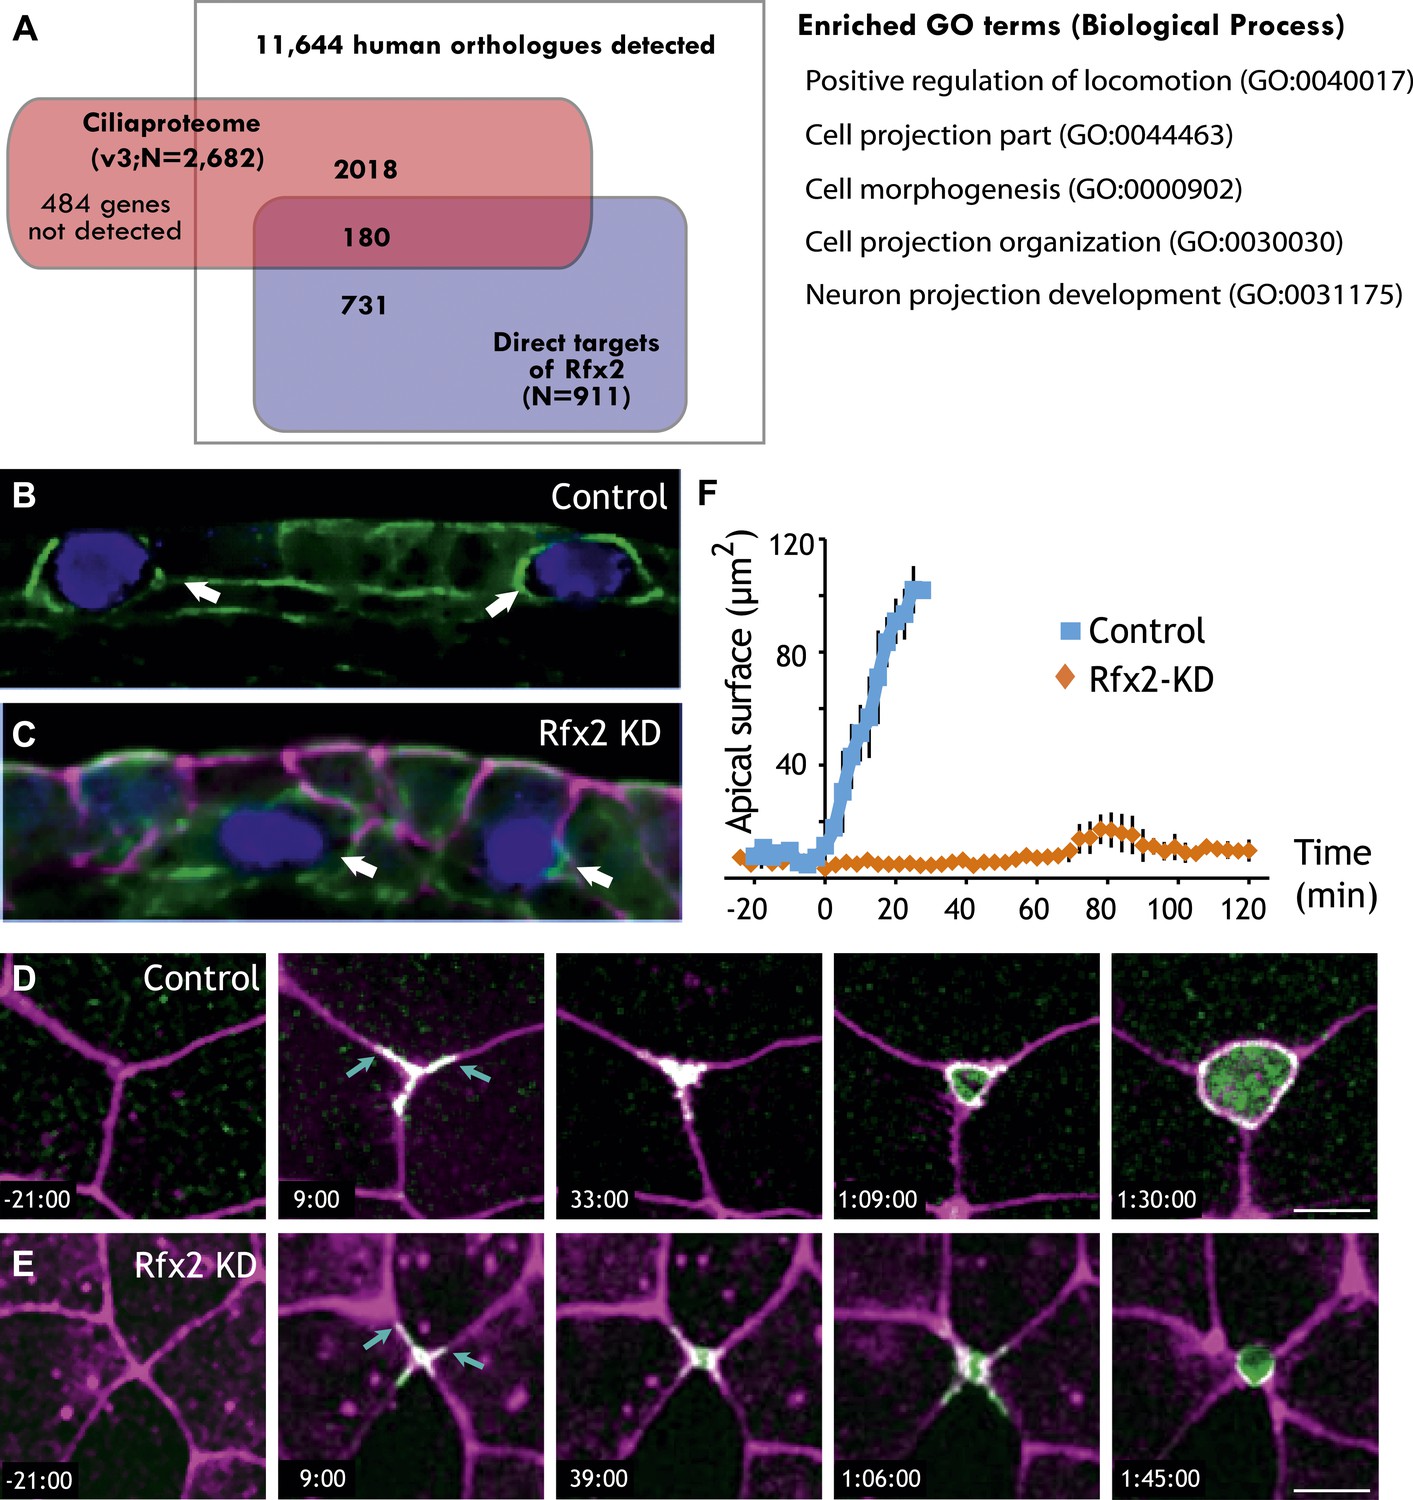
(A) Overlap of Rfx2 target genes and the ‘cilia proteome’ (as defined in Gherman et al., 2006; see ‘Materials and methods’). Out of 911 direct target genes of Rfx2 identified in this study, only 20% of them (180 genes) are annotated as known cilia genes. Right panel represents the Gene Ontology terms significantly enriched among direct targets of Rfx2 (biological process category only; Benjamini corrected p<0.05) (B) A cross-sectional view of a control embryo labeled with ciliated cell marker (cyan). Apical surface is up. MCCs have inserted into the mucociliary epithelium (arrows). (C) A cross-sectional view of an Rfx2 morpholino-injected embryo. MCCs fail to insert into the overlying epithelium (arrows). To observe the insertion of MCCs into the overlying epithelium of control embryos (E) and Rfx2 morphants (D), a MCC-specific α-tubulin enhancer element driving expression of Utrophin-GFP was used. (D) Note the control MCC first exhibited a star-shaped morphology and cell protrusions probed into overlying cell–cell boundaries (arrows). The probing phase then ceased and apical surface expanded (Videos 5 and 6). (E) Protrusions of the MCC were observed, indicating the initial probing was qualitatively normal following Rfx2 knockdown. However, apical surface expansion was strongly inhibited in MCCs (Video 7). (F) Quantification of apical surface area of MCCs of control embryos and Rfx2 morphants.
Figure 6
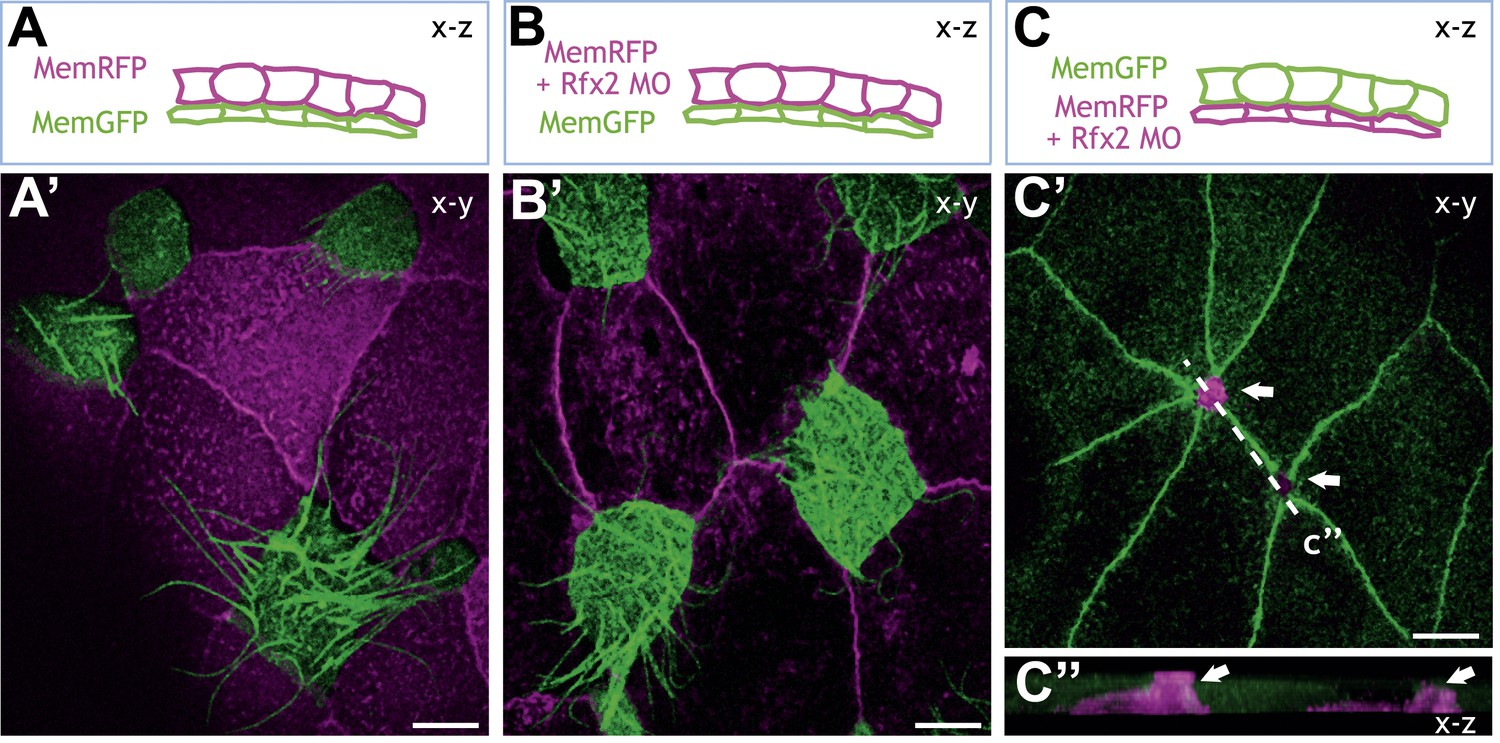
Rfx2 acts cell-autonomously to control insertion of nascent MCCs into the overlying epithelium.
(A)–(C) Illustration of the transplantation experiments. The superficial layer from either control (A) (A′) or Rfx2 knockdown embryos (B) (B′) was transplanted to the control host embryos. (C) (C′) the superficial layer from control embryos was transplanted to the Rfx2 knockdown embryos. At stage 26, MCCs derived from the control host have intercalated into the outer layer transplanted from either control (A′) or Rfx2 knockdown embryos (B′). (C′) MCCs, in which Rfx2 was knocked down, failed to insert properly into control outer epithelium. (C′′) A z-view of two MCCs in (C′).
Figure 7
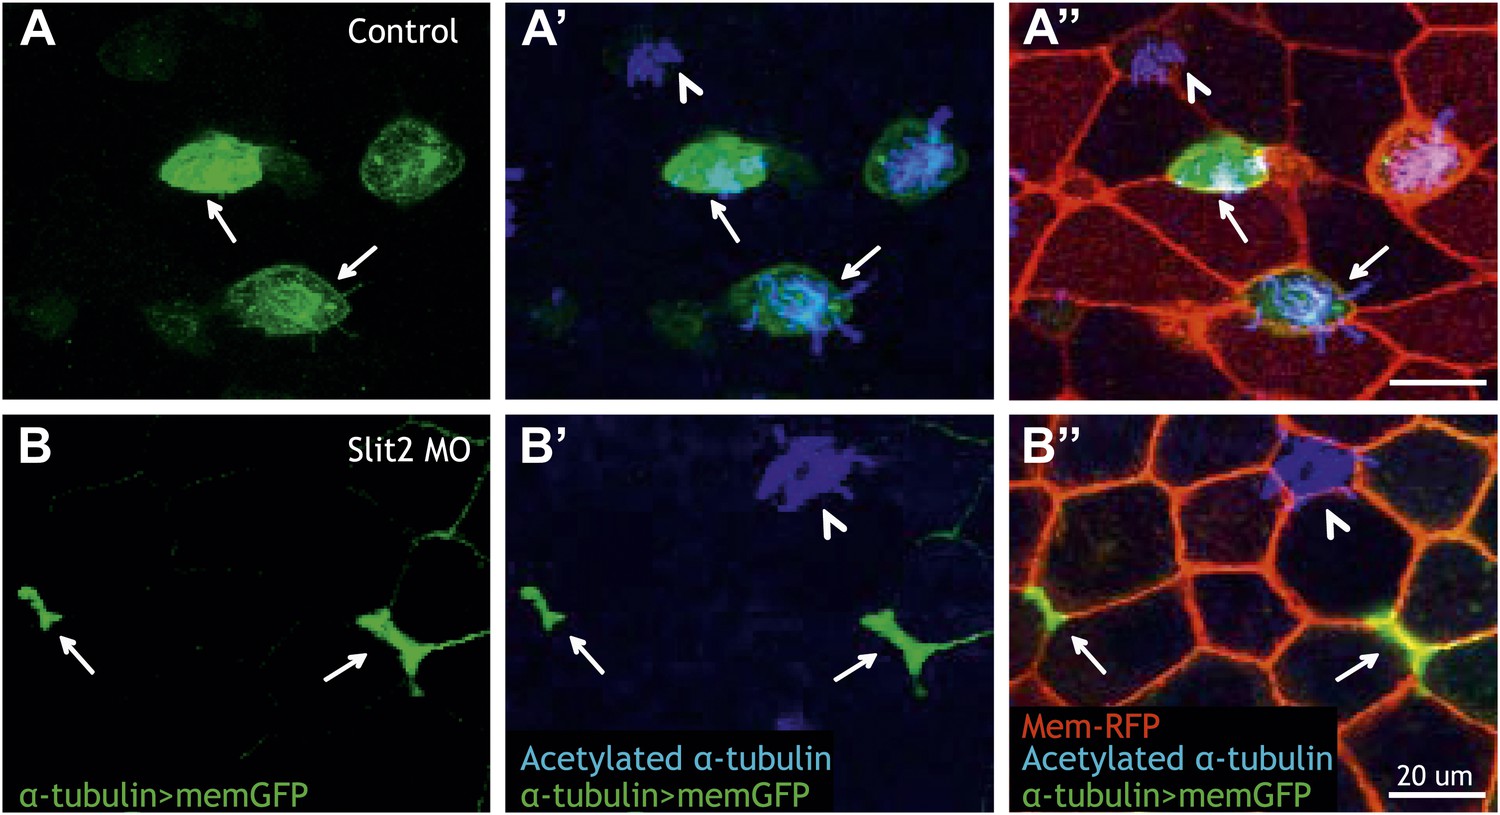
Slit2 is required for MCC insertion into the overlying epithelium.
(A) A control embryo injected with membrane-RFP and α-tubulin > membrane-GFP to label MCCs. Injected embryos were then fixed and stained with RFP, GFP, and α-acetylated tubulin. (B) Slit2 morpholino was injected with membrane-RFP and α-tubulin > membrane-GFP. Note that MCCs fail to insert into the mucociliary epithelium following Slit2 knockdown (arrows). In addition, MCCs (arrowheads) with no Slit2 morpholino insert into the superficial layer containing Slit2 morpholino. These data indicate Slit2 controls MCCs in a cell-autonomous fashion.
Figure 8
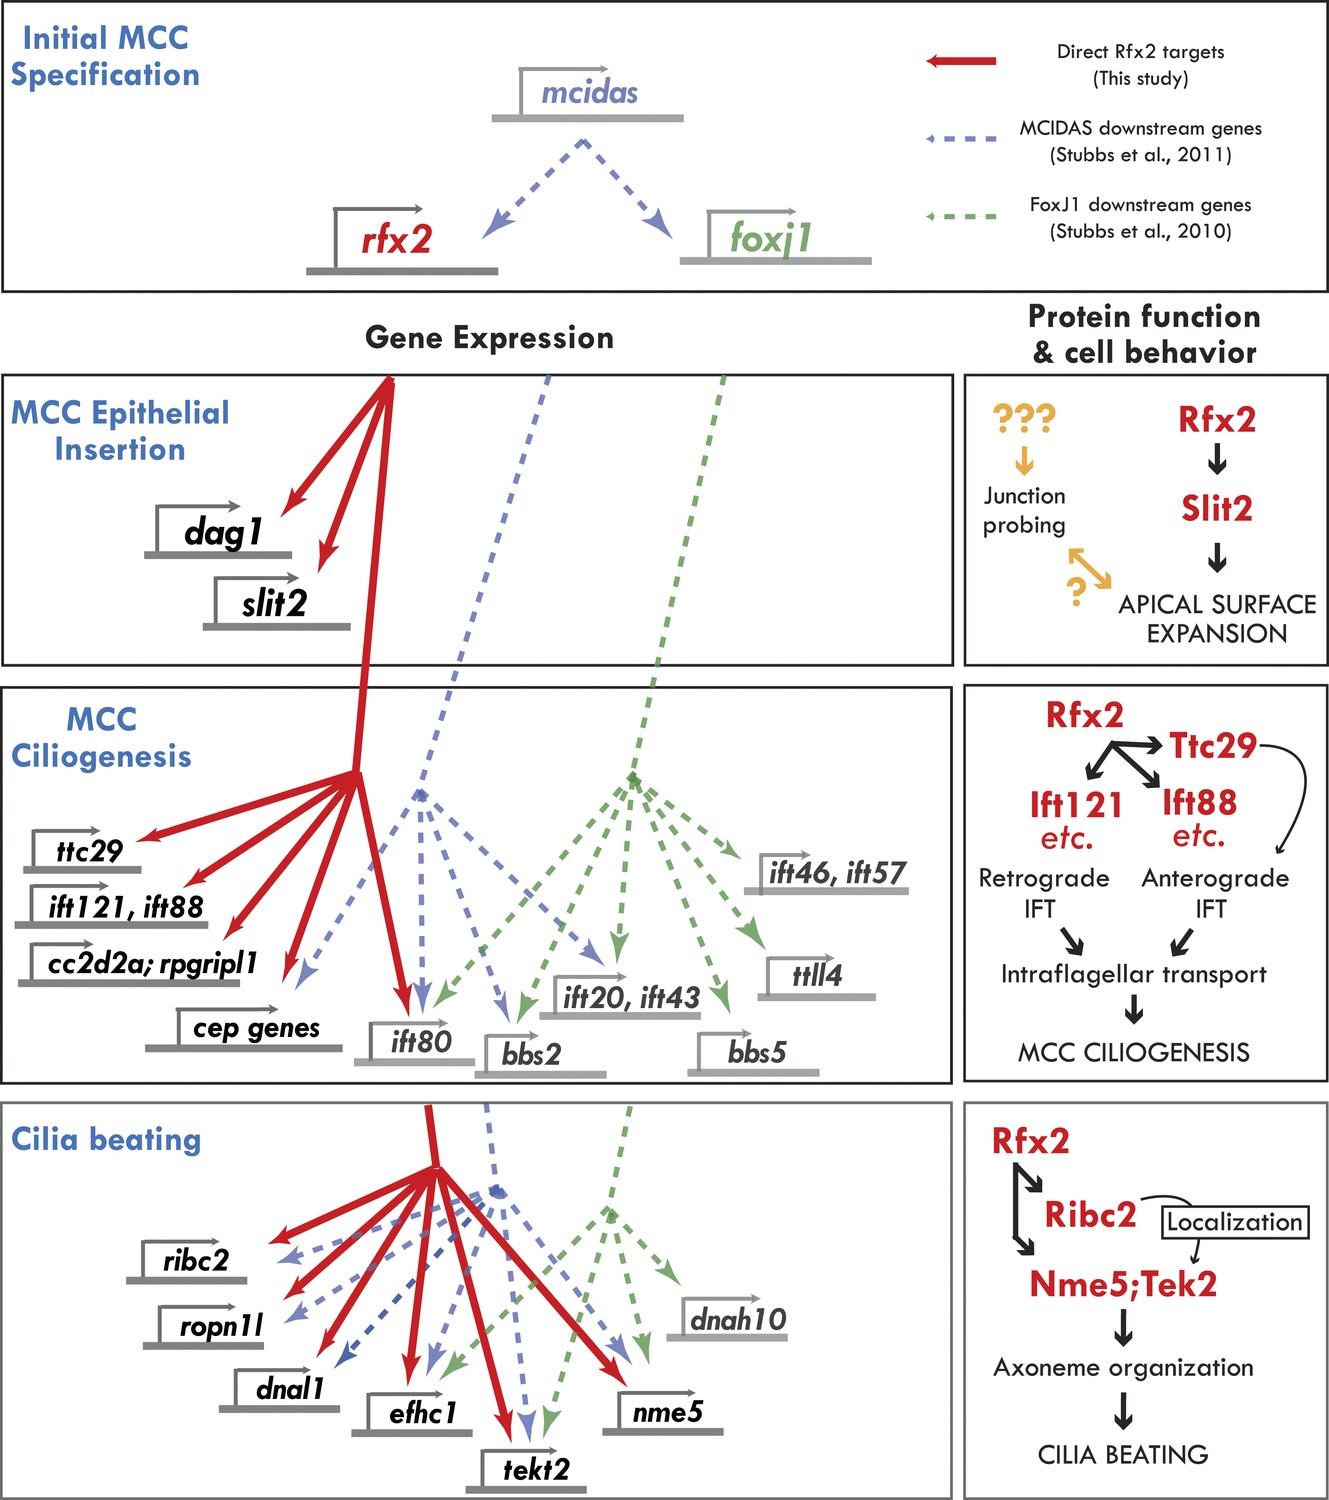
Genomic control of cellular functions in developing multiciliated cells.
Left panels (‘Gene Expression’) illustrate genetic controls as reported in Figure 2, Figure 2—figure supplements 2–4, and Supplementary file 1A–C. Solid red lines in this figure indicate direct control of transcription by Rfx2 (e.g., intersect of RNAseq and ChIPseq data as outlined in Figure 2). Previous genomic analyses of Mcidas and Foxj1 in Xenopus MCCs did not include ChiPSeq data, so the dashed blue and green lines shown here indicate only that a gene’s transcription was upregulated in response to overexpression of mcidas or foxj1, respectively as per (Stubbs et al., 2008; Stubbs et al., 2012). Right panels (‘protein function and cell behavior’) illustrate mechanistic insights found here for MCCs by live imaging studies (Figures 3–7, Figure 4—figure supplements 2 and 3).
Videos
Video 1
Dynamics of GFP-IFT20 in a control multiciliated cell.
A control multiciliated cell expressing GFP-IFT20 is shown. Processive bidirectional traffic can be observed. Also see Figure 3.
Video 2
Dynamics of GFP-IFT20 in a Ttc29-knockdown multiciliated cell.
A multiciliated cell of a Ttc29-knockdown embryo is shown. Anterograde GFP-IFT20 traffic showed a significantly slower average rate following Ttc29 knockdown. Also see Figure 3.
Video 3
Cilia beating of a control multiciliated cell.
A control multiciliated cell expressing membrane-GFP is shown. Beat frequency is 20.59 ± 0.410 strokes/s in control multiciliated cells.
Video 4
Cilia beating of a Ribc2-knockdown multiciliated cell.
A Ribc2-knockdown multiciliated cell expressing membrane-GFP is shown. Beat frequency is 5.29 ± 0.635 strokes/s following Ribc2 knockdown.
Video 5
The development of a control multiciliated cell.
A control multiciliated cell expressing membrane-GFP is shown.
Video 6
The insertion of a control multiciliated cell into the overlying epithelium.
A control multiciliated cell expressing Utrophin-RFP is shown. Note the control multiciliated cell first exhibited a probing phase and then an apical surface expansion phase.
Video 7
The insertion of a Rfx2-knockdown multiciliated cell into the overlying epithelium.
A Rfx2-knockdown multiciliated cell expressing Utrophin-GFP is shown. The initial probing was qualitatively normal following Rfx2 knockdown. However, apical surface expansion was strongly inhibited.
Additional files
-
Supplementary file 1
(A) Rfx2 target genes controlling ciliogenesis. Target genes are listed by gene ID. Column 2 displays log2-transformed fold-change for each genes between control and Rfx2 morphants (green for down-regulated, red for up-regulated). Column 3 displays the adjusted p-value for differential expression after multiple hypothesis testing correction. Columns 4 and 5 display the numbers of RNA-seq reads (not normalized) for control samples in each of two biological replicates; columns 6 and 7 show the number of RNA-seq reads (not normalized) for Rfx2 morphant samples in each of two biological replicates. Column 8 provides the peak fold enrichment for Rfx2 binding sites relative to the GFP-only control ChIP; Column 9 is the false discovery rate (%) of Rfx2 ChIP-seq peak calls. (B) Rfx2 target genes controlling cilia beating. Target genes are listed by gene ID. Columns are as per Supplementary file 1A. (C) Rfx2 target genes related to Slit/Robo signaling and neuronal migration/morphogenesis. Target genes are listed by gene ID. Columns are as per Supplementary file 1A.
- https://doi.org/10.7554/eLife.01439.027
Download links
A two-part list of links to download the article, or parts of the article, in various formats.
Downloads (link to download the article as PDF)
Open citations (links to open the citations from this article in various online reference manager services)
Cite this article (links to download the citations from this article in formats compatible with various reference manager tools)
Coordinated genomic control of ciliogenesis and cell movement by RFX2
eLife 3:e01439.
https://doi.org/10.7554/eLife.01439


