Super Spy variants implicate flexibility in chaperone action
- Howard Hughes Medical Institute, University of Michigan, United States
- Genome British Columbia Proteomics Centre, University of Victoria, Canada
- University of Michigan, United States
Figures
Figure 1 with 2 supplements
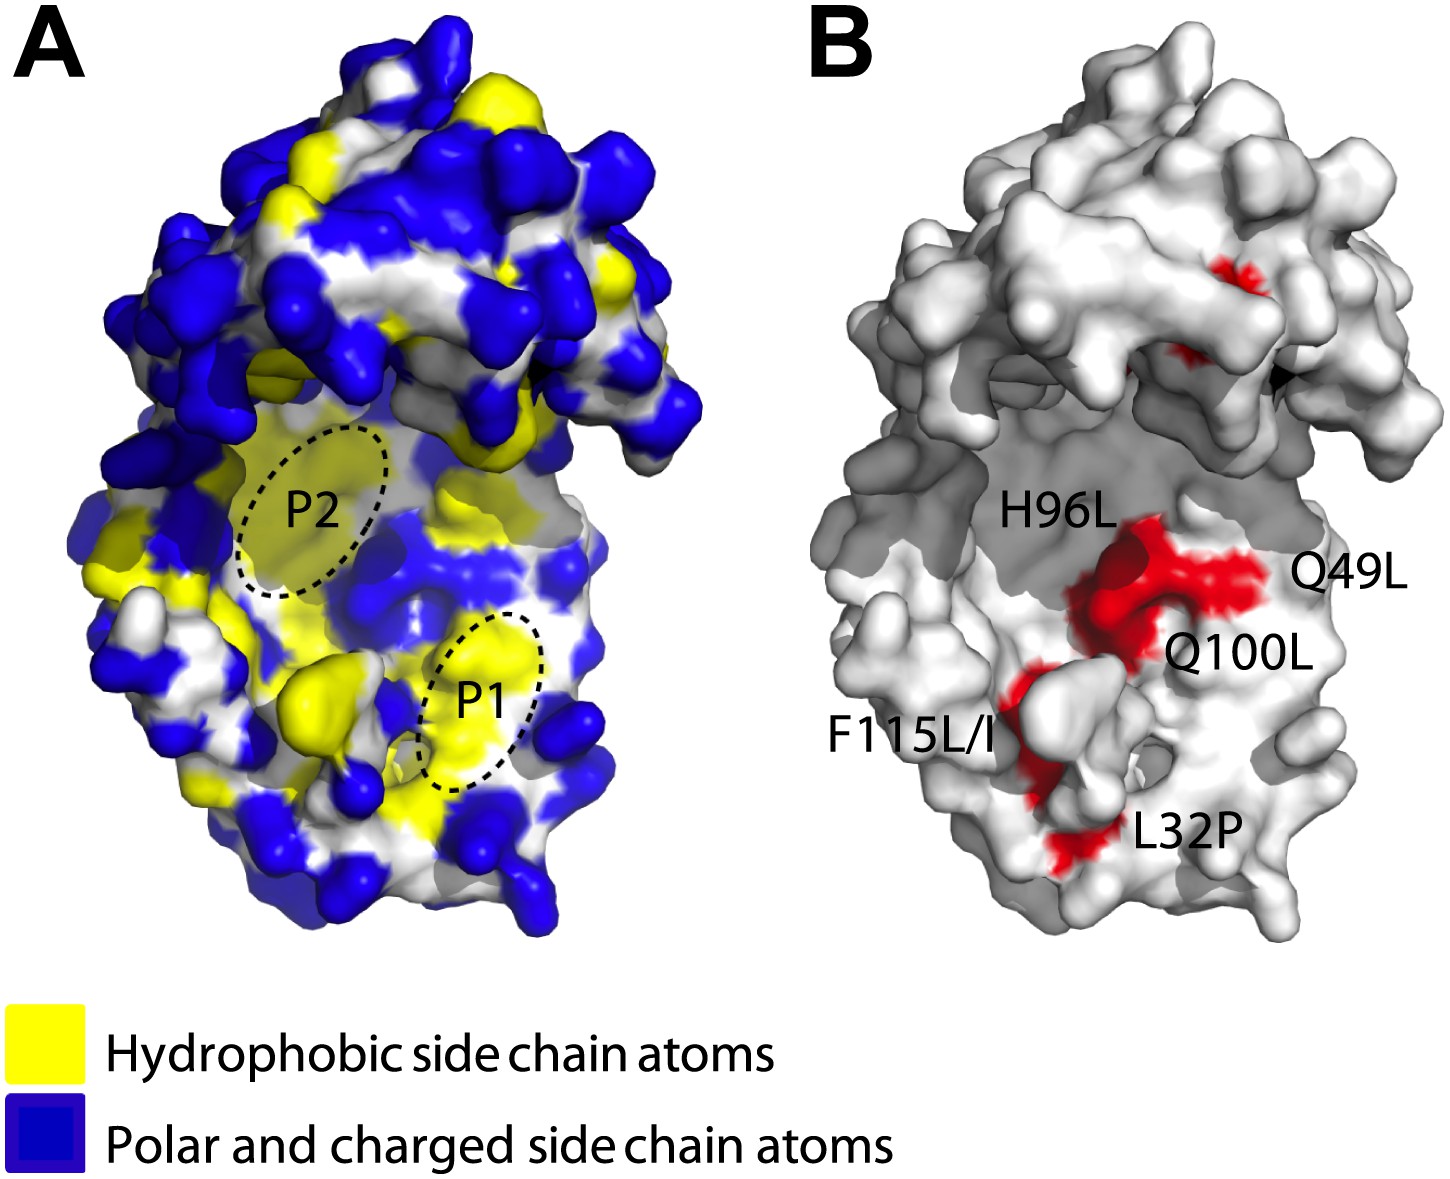
Surface presentations of the crystal structure of Spy (PDB ID: 3O39).
The majority of activity-enhancing mutations localize to areas adjacent to hydrophobic patches. (A) Surface properties of Spy. Backbone atoms are shown in white, hydrophobic side chain atoms in yellow, and polar and charged side chain atoms in blue. Black dashed lines circle the two predominant hydrophobic patches P1 and P2. (B) Sites accommodating beneficial mutations. Side chain atoms of the residues identified as mutations in the genetic selection are shown in red. Q25 is in the disordered N-terminus, which is not visible in the crystal structure. Q49L, H96L, and Q100L would expand the total hydrophobic area of P1 and P2.
Figure 1—figure supplement 1
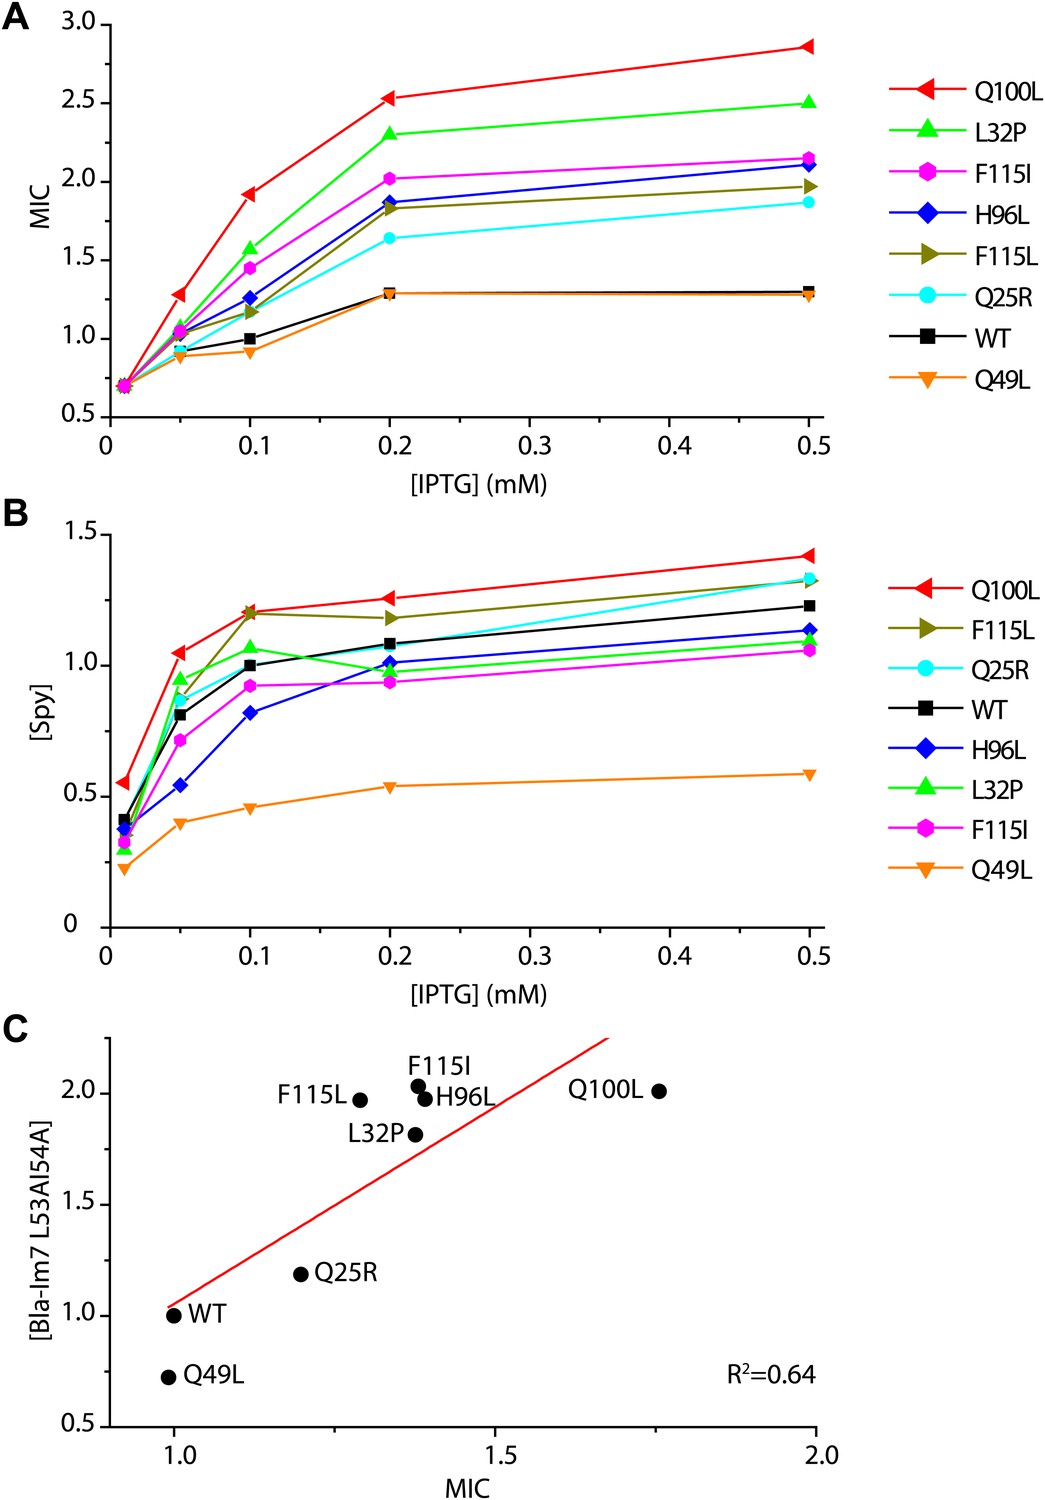
Determination of the in vivo specific activity of Spy variants.
(A) The minimal inhibitory concentration (MIC) of strains expressing the folding biosensor as well as the Spy variants measured in the presence of various concentrations of IPTG (0.01–0.5 mM). The MIC of penicillin V was measured by plating serially diluted cells (10−1 to 10−5 dilutions) on LB plates containing 0.5–7 mg/ml penicillin V as previously described (Foit et al., 2009). (B) The steady-state levels of different Spy variants increase upon induction with increasing amounts of IPTG (0.01–0.5 mM). (C) The steady-state levels of the Bla-Im7 L53A I54A biosensor in the presence of different Spy variants are linearly correlated with the relative MIC of the respective strains (R2 = 0.64). The data set shown here was measured when the respective co-expressed Spy variant was induced with 0.1 mM IPTG.
Figure 1—figure supplement 2

WebLogo representation of a ClustalW (Thompson et al., 2002) sequence alignment of 29 Spy orthologous sequences.
Residues are numbered according to the mature protein region of E. coli Spy. Short dashes indicate residues that are absent from E. coli Spy but are present in other aligned sequences. Red: basic residues K, R, and H; blue: acidic residues D and E; orange: hydrophobic residues including A, V, L, I, F, W, M, and P; black: polar uncharged residues including G, S, T, C, Y, N, and Q. Green boxes indicate the location of our Spy mutations with the original residues shown in green.
Figure 2 with 2 supplements
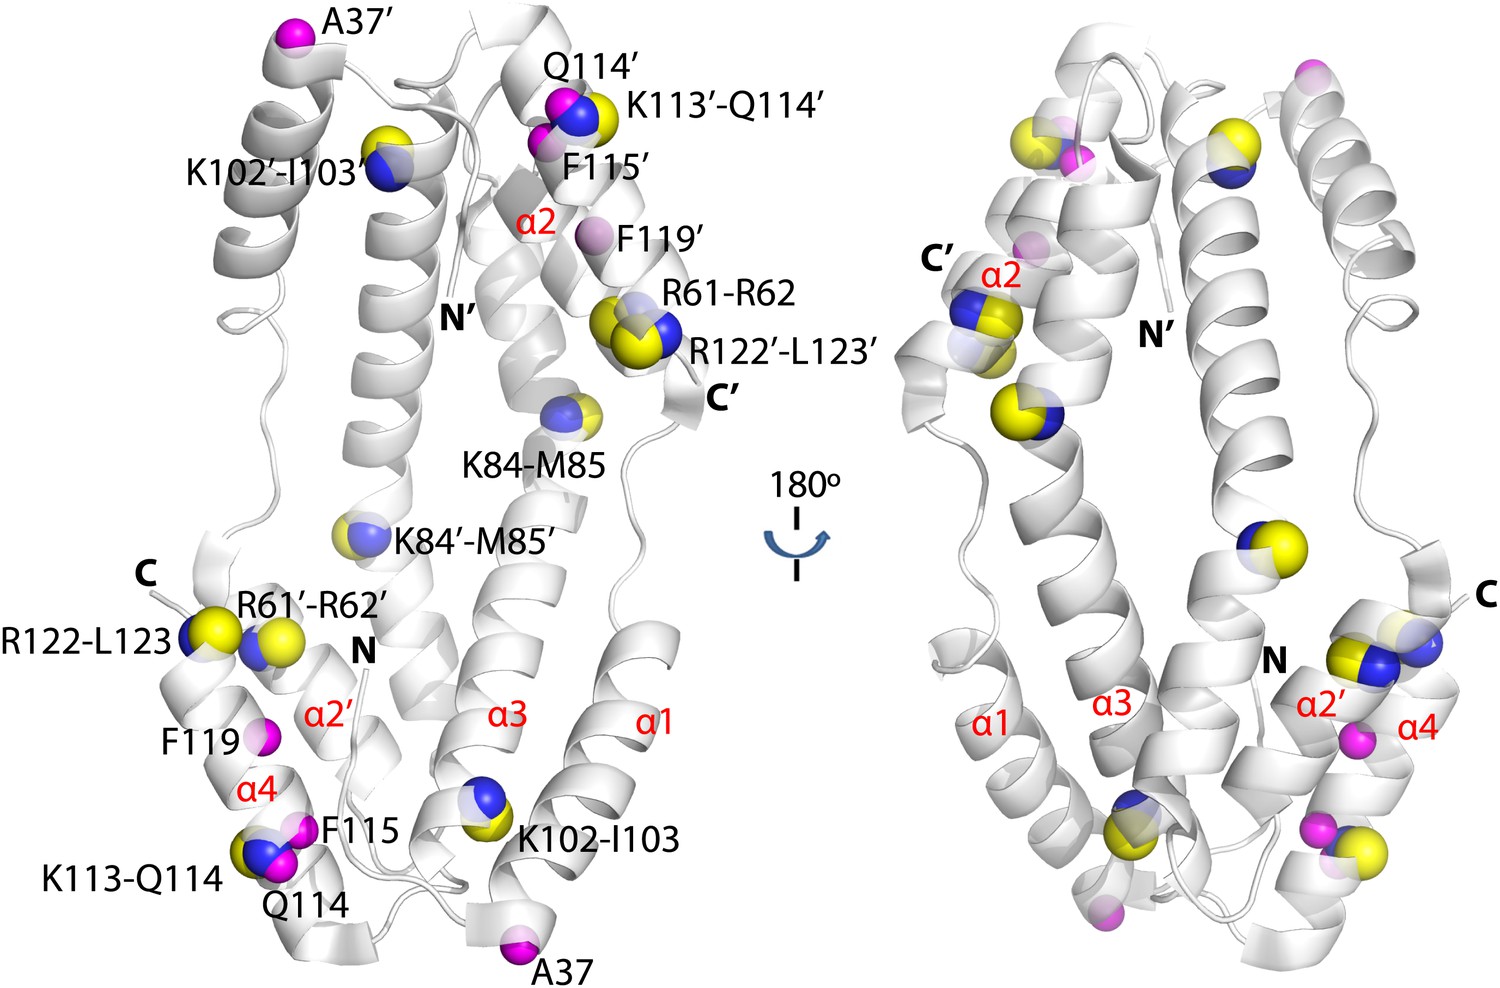
Hydogen-deuterium exchange and limited proteolysis reveal potential hot spots on Spy for Im7 L53A I54A or Im7 7-45 peptide binding.
Hydrogen atoms on the backbone amide bond that are protected upon addition of Im7 7-45 are shown as magenta spheres. Peptide bonds of Spy protected from trypsin upon addition of Im7 L53A I54A are shown as yellow and blue spheres, with yellow representing carbon atoms and blue representing nitrogen atoms.
Figure 2—figure supplement 1
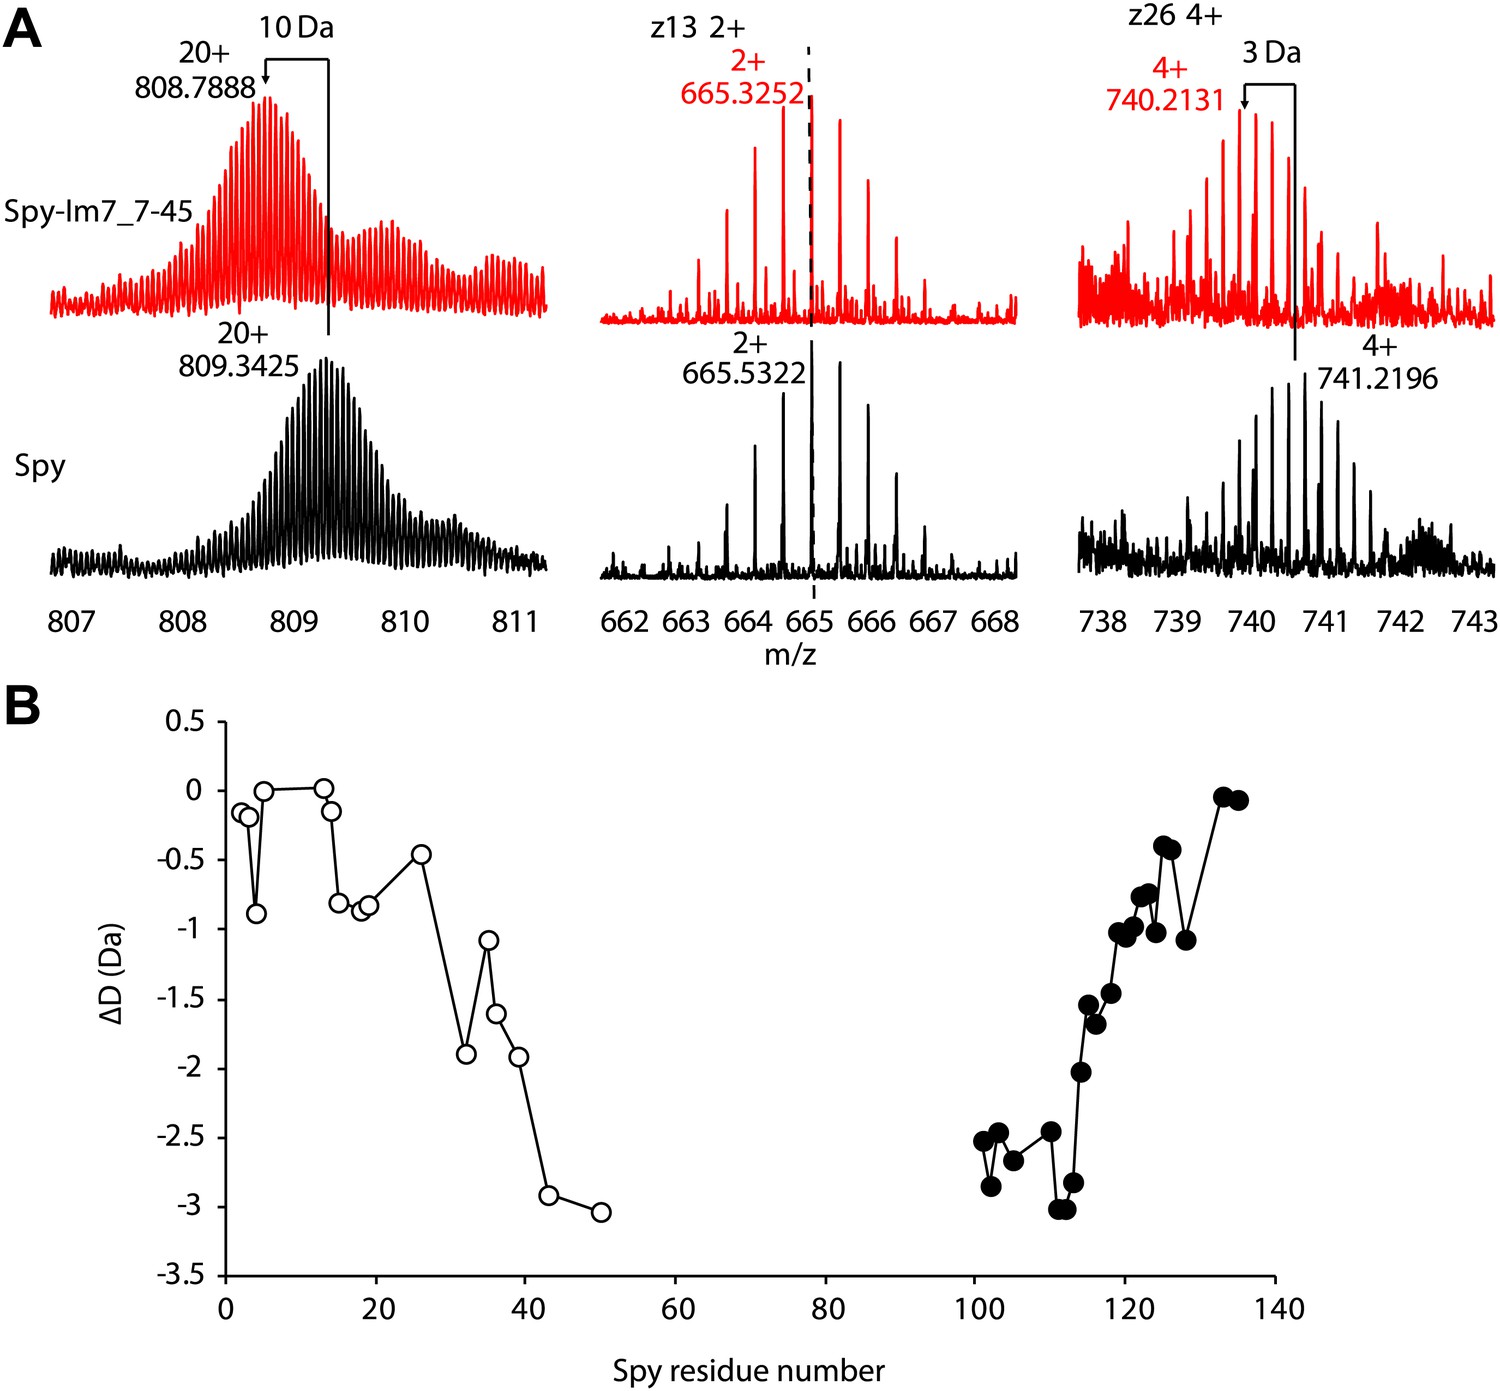
Hydrogen-deuterium exchange analysis of Spy and the Spy-Im7 7-45 complex by electron capture dissociation fourier transform ion cyclotron resonance mass spectrometry (ECD-FTICR-MS).
(A)The hydrogen-deuterium exchange pattern for free Spy (black) differs from that observed for the Spy-Im77-45 complex (red). The complex shows increased protection against exchange compared to free Spy. Representative c- and z- ion series observed for Spy and Spy-Im7 7-45 indicate that there is a significant difference in exchange within the N- and C-terminal regions. (B) Differential deuteration plot of Spy and Spy-Im7 7-45 residues based on mass differences between pairs of corresponding c- (open circles) and z- (closed circles) fragment ions of Spy and Spy-Im7 7-45. Most of the protection changes between Spy and Spy-Im7 7-45 can be attributed to residues located in N- and C-terminal regions. Sharp drops (c-series) or rises (z-series) on the plot indicate Spy residues that form new hydrogen bonding upon complex formation with Im7.
Figure 2—figure supplement 2

Limited proteolysis reveals potential Im7 binding sites in Spy.
The susceptibility of Spy's lysine and arginine residues to digestion by trypsin was measured in the presence or absence of Im7 L53A I54A. Protein samples were incubated with trypsin at a constant 100:1 mass ratio (protein: protease). At various times, aliquots were withdrawn, quenched, and analyzed by mass spectrometry. The residue numbers of trypsin-cleavable sites are shown along with their location in Spy's secondary structure (indicated by the cartoon). The bars indicate the time at which cleavage at that residue took place. A missing bar indicates that cleavage was not seen within the 8-min time frame. The unstructured termini are more accessible to trypsin in general, and many sites show apparent increased digestion in the presence of client compared to Spy alone. The interpretation of increased cleavage of these sites is not straightforward. The increased digestion might reflect some real structural rearrangement in Spy upon client binding so that these residues are more exposed to trypsin. Alternatively, they may not be involved in substrate binding and their increased digestion might be an artifact due to a higher total mass of trypsin, which was used to accommodate the addition of client. We were not able to distinguish these two possibilities. On the other hand, the sites showed decreased cleavage despite an increased amount of trypsin are more easily interpreted. Decreased cleavage suggests that they are protected, either by the substrate protein, or by other regions in Spy, which further implies a conformational change upon substrate binding. Cleavage at residues 61, 84, 102, 113, and 122 (circled) is significantly delayed when the client Im7 L53A I54A is present. We conclude that R61, K84, K102, K113, and R122 are sites but not necessarily the only sites affected by the binding events.
Figure 3 with 1 supplement
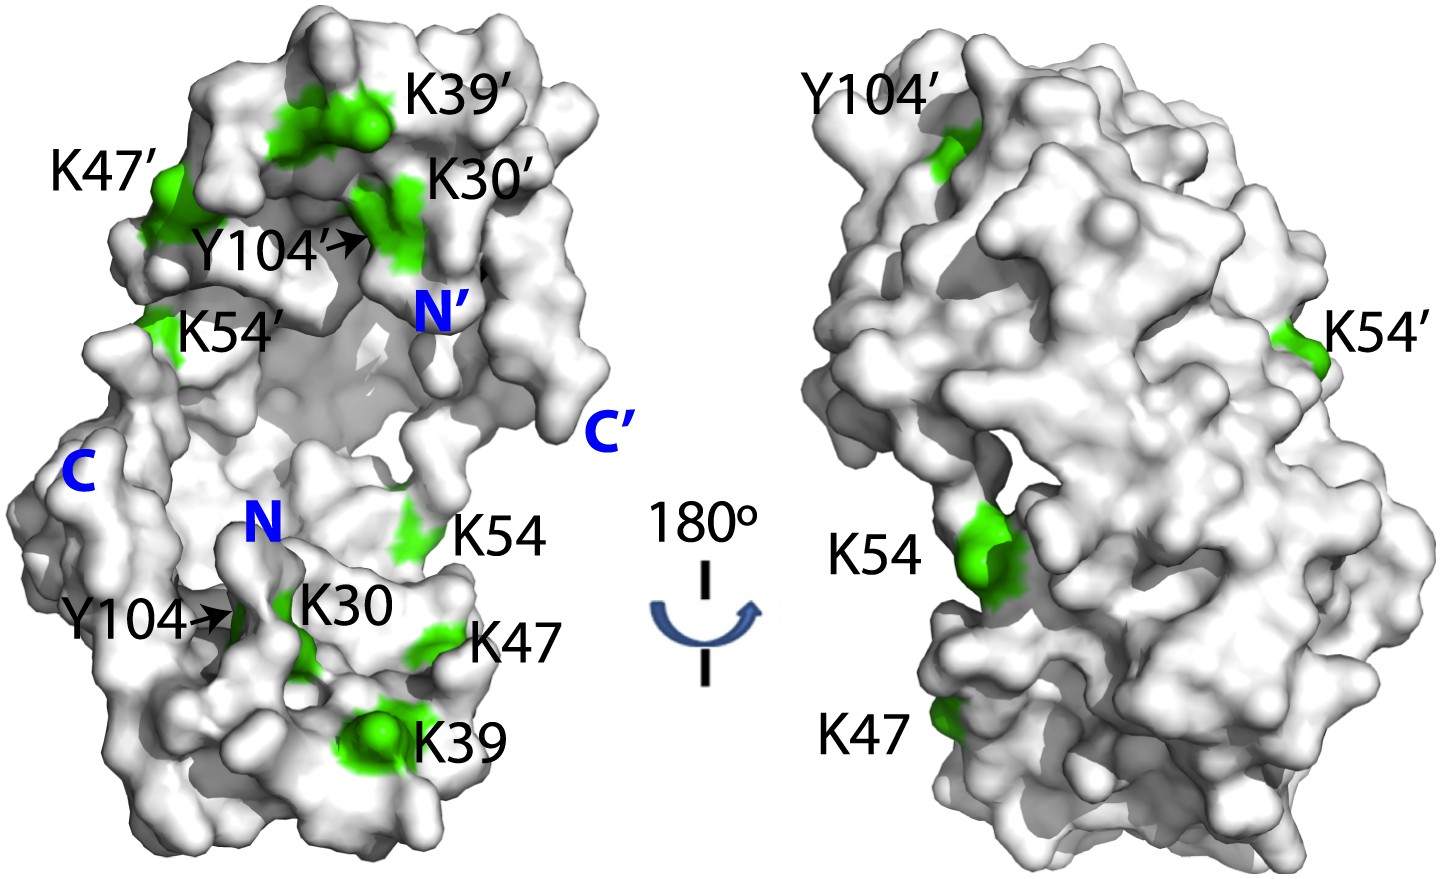
Crosslinked residues mapped onto the crystal structure of Spy.
Spy residues that were found crosslinked to Im7 7-45 peptide are shown in green. Crosslinking with CBDPS-H8/D8 implies a short distance between the N terminus of Im7 and Spy residues; these include Spy K20, K39, K47, K54, K130, and K132. Residues that can be crosslinked with CBDPS also include Spy K18 to Im7 K20, Spy K20 to Im7 K20, and Spy K30 to Im7 K43. Using ABAS, we identified crosslinking between the N terminus of Spy and E21 of Im7. Zero-length crosslinking using PICUP and EDC reagents identified contacts between Spy Y104 and Im7 Y10, and Spy K39 and Im7 E12, respectively. A summary of all identified crosslinks is provided in Table 3.
Figure 3—figure supplement 1
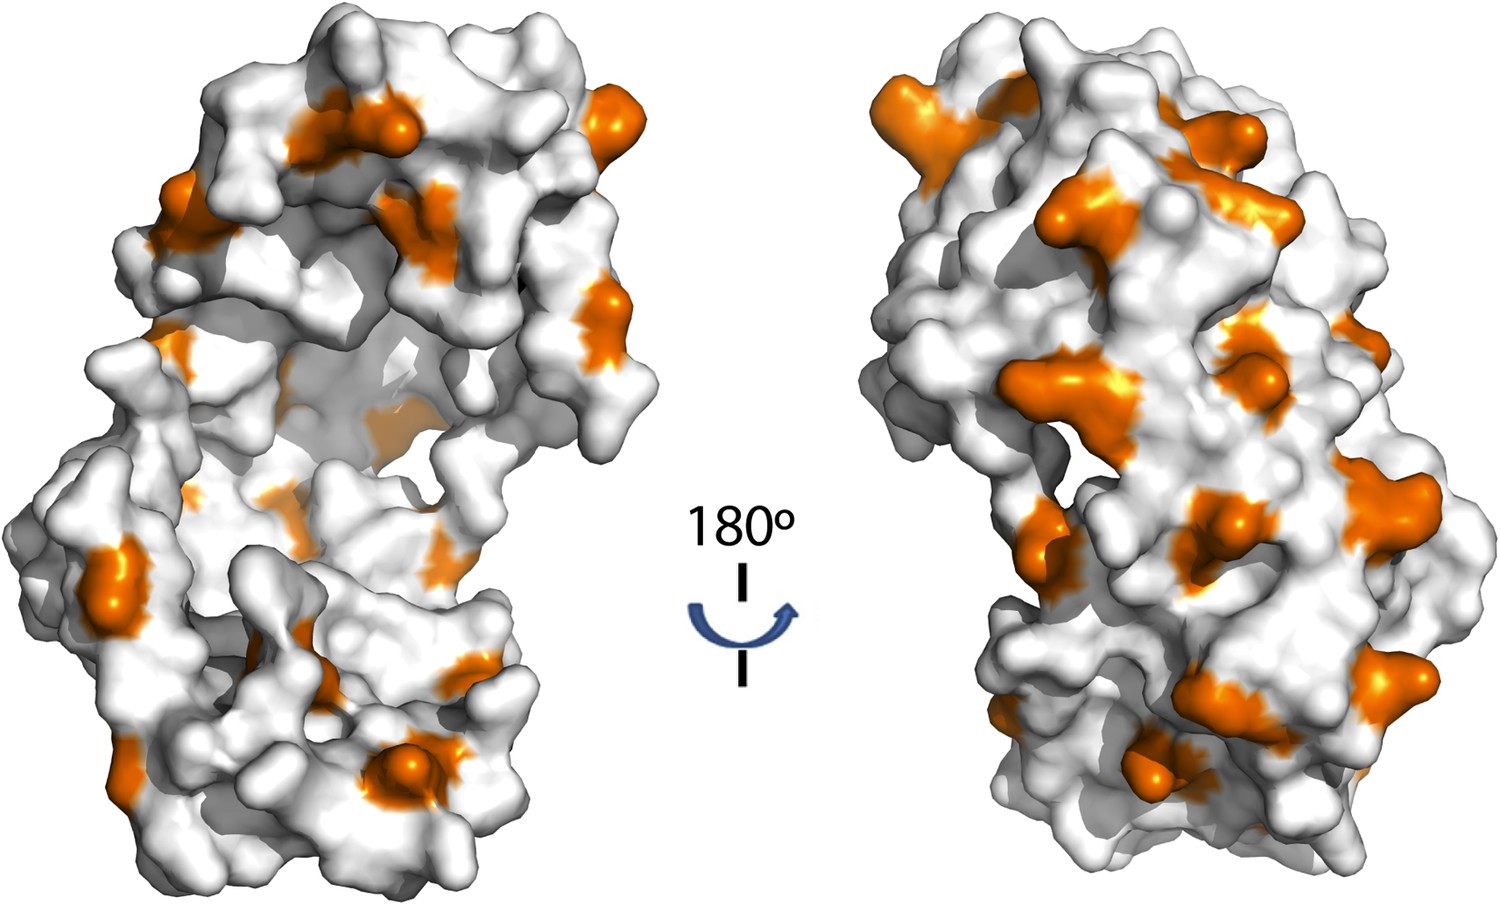
Distribution of lysine residues on the surface of Spy, lysine residues are copper colored.
https://doi.org/10.7554/eLife.01584.012
Figure 4 with 2 supplements
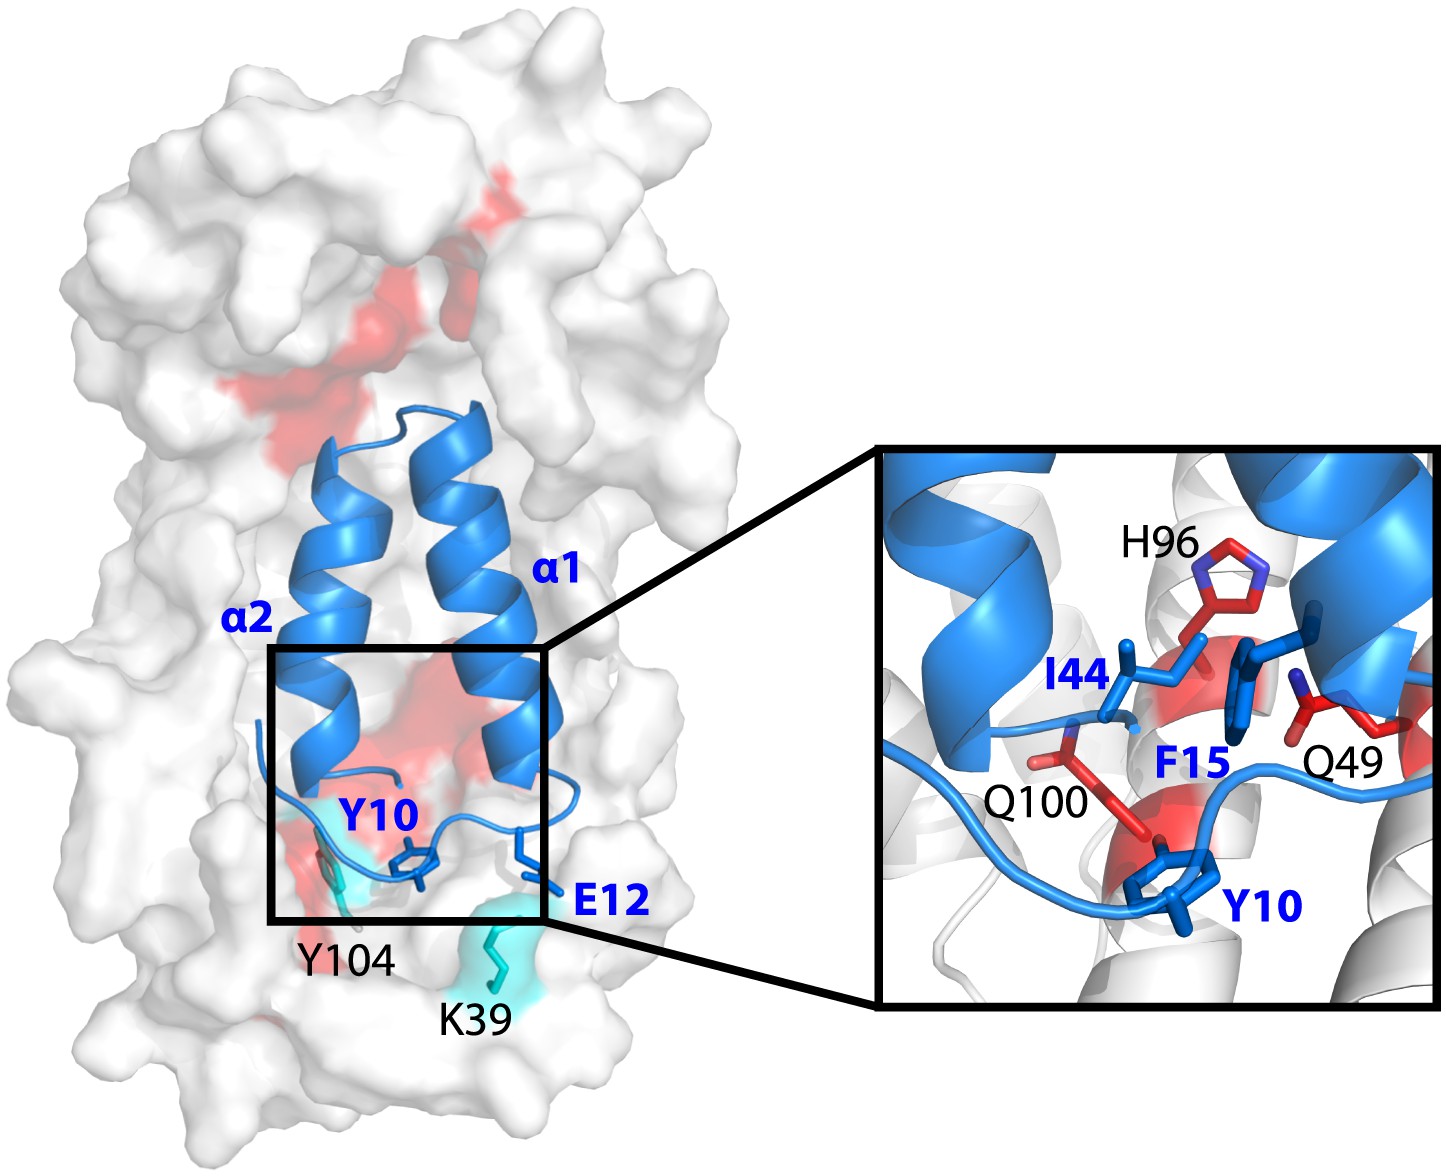
Model showing the position of the Im7 7-45 peptide bound on the concave surface of Spy.
Mutations that increase the specific activity of Spy are shown in red. Residues on Spy that are crosslinked to Im7 residues by PICUP or EDC are shown in cyan. The enlargement shows the position of residues Q49, H96, and Q100. Mutating these residues to leucine increases the hydrophobic interaction with Y10, F15, and I44 on Im7.
Figure 4—figure supplement 1
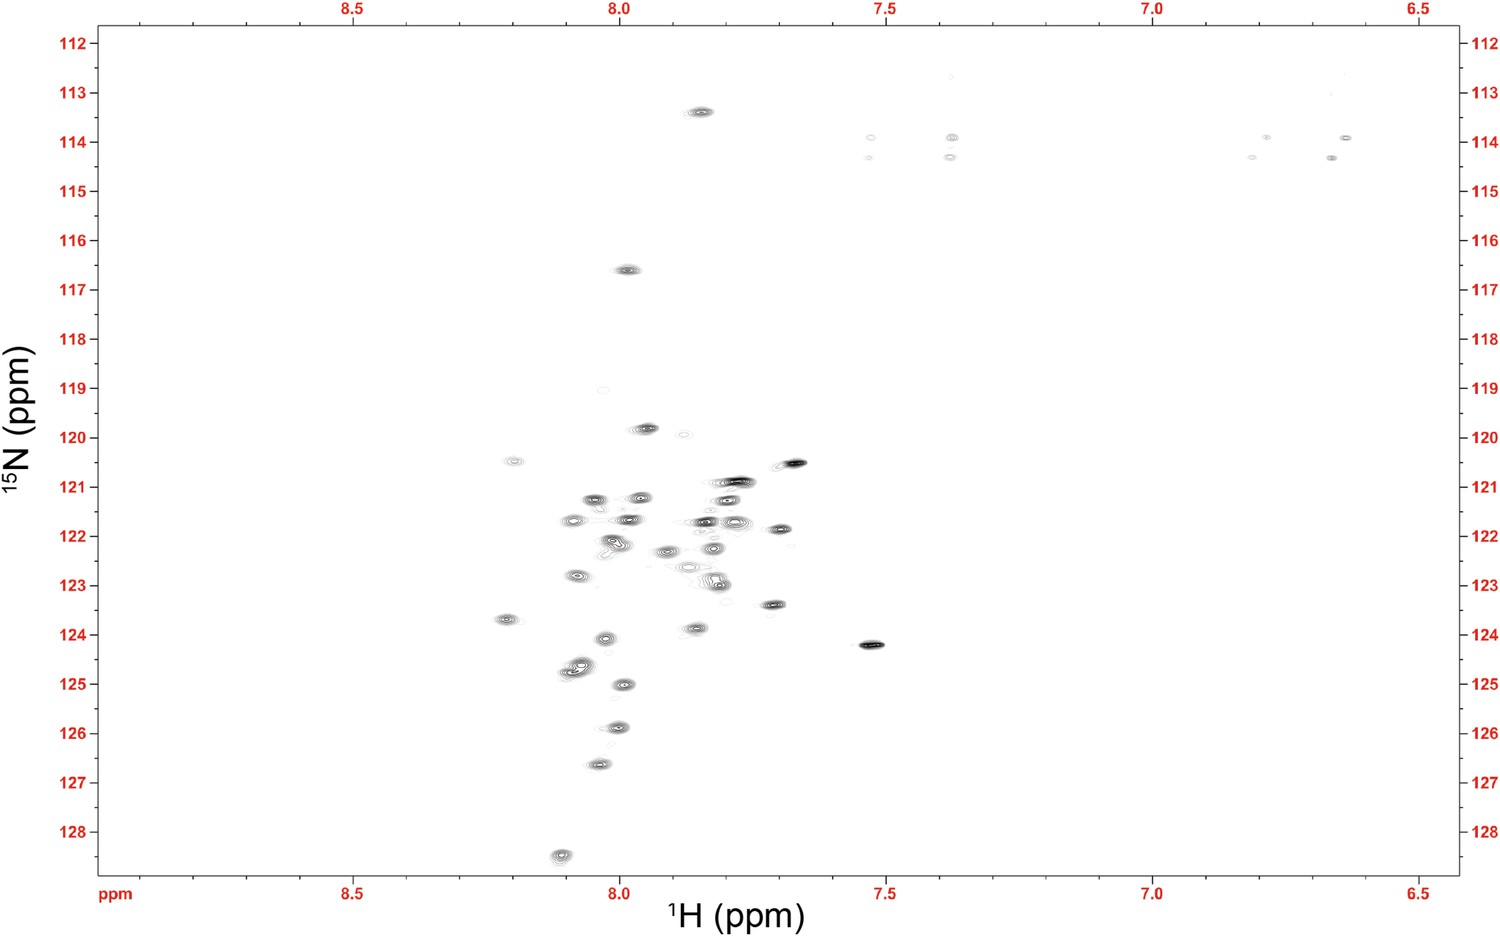
NMR spectrum of the Im7 7-45 peptide.
The average 1HN chemical shift (7.91 ppm) is substantially shifted upfield from the expected random coil value for this sequence (8.14 ppm) (Wang and Jardetzky, 2002). This difference verifies that the αhelical nature of Im7 is at least partially maintained in this fragment, suggesting that the αhelical model of Im7 7-45 used in the docking procedure is valid.
Figure 4—figure supplement 2
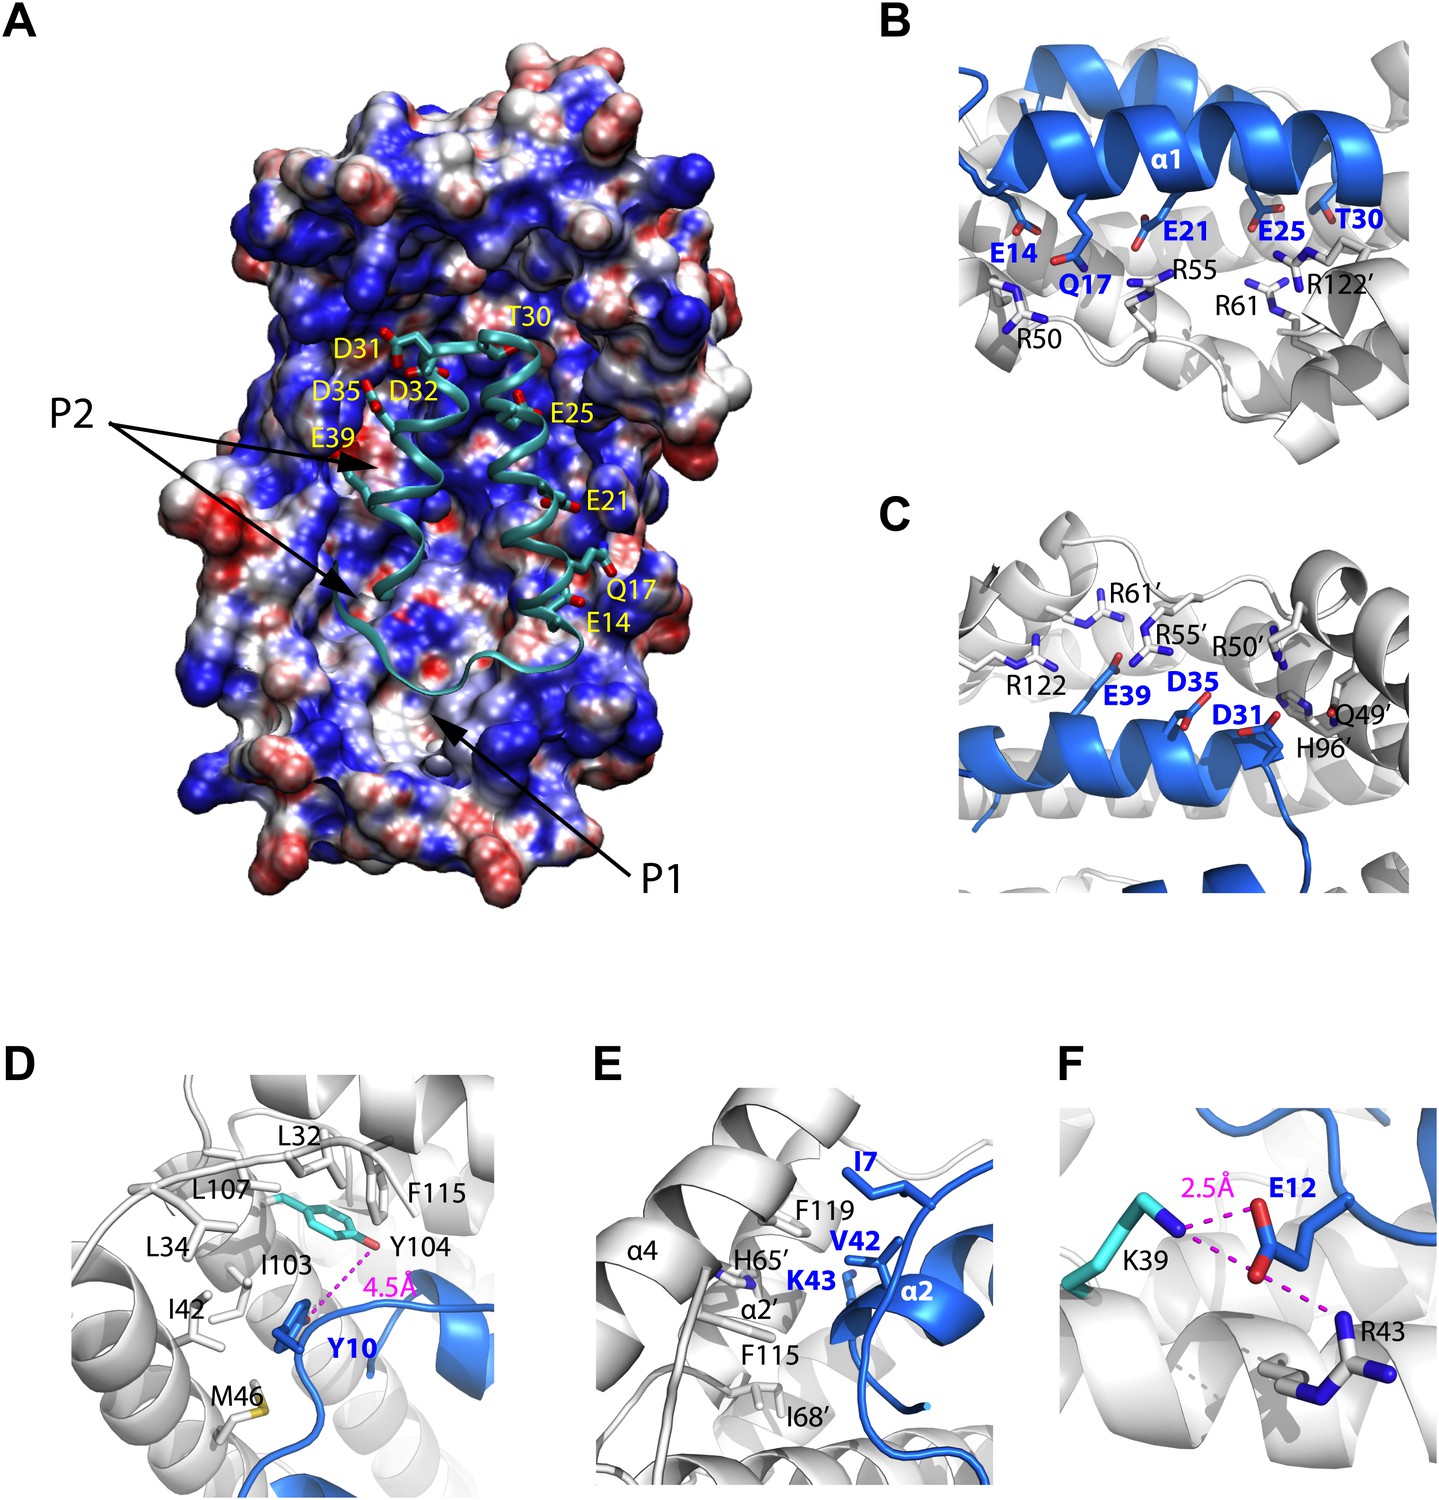
Models of the Spy-Im7 7-45 complex.
(A) The electrostatic potential of Spy mapped onto its solvent accessible surface. The surface is colored according to its electrostatic potential calculated with the Adaptive Poisson-Boltzmann Solver (APBS) plugin in Pymol (Baker et al., 2001). Red indicates a more negative potential (−10 kTe−1) and blue a more positive potential (+10 kTe−1). The Im7 7-45 peptide (cyan ribbon) is shown docked into the pocket of Spy. The polar and acidic residues in Im7 as well as the location of the ‘P1’ and ‘P2’ hydrophobic patches of Spy are labeled. The Poisson-Boltzmann (PB) calculation was performed using the PARSE force field for the atomic charges and radii that is available with the PDB2PQR server (http://nbcr-222.ucsd.edu/pdb2pqr_1.8/). The charges and radii were then used as input for the APBS Pymol plugin along with the default parameters (0.15 M ion concentration, 310 K, a 1.4 Å solvent radius, and dielectric constants of 2.0 and 78.0 for the protein and solvent, respectively). A similar result is obtained when directly viewing isosurfaces through the charge distribution grid resulting from the PB calculation. The Im7 7-45 peptide (cyan ribbon) is shown docked into the positively charged concave surface of Spy. The polar and acidic residues in Im7 are labeled. (B) E14, Q17, E21, E25 and T30 from α1 of Im7 associate with basic residues R50, R55, and R61 from Spy monomer A to form an extensive salt bridge and hydrogen-bonding network, with an extra contribution from R122’ from Spy monomer B. (C) D31, D35, and E39 on Im7 α2 are recognized by nearly the same set of basic residues, including H96’, R50’, R55’, andR61’ from Spy monomer B and R122 from Spy monomer A. (D) Residues composing the hydrophobic pocket that Y10 from Im7 is buried into are labeled. The distance between Spy Y104 and Im7 Y10 is shown. (E) Hydrophobic interaction at the N- and C-terminal tips of Im7. (F) Electrostatic interaction between Im7 Glu12 and Lys39 and Arg43 of Spy. The distance between Spy Lys39 and Im7 Glu12 is shown.
Figure 5 with 4 supplements
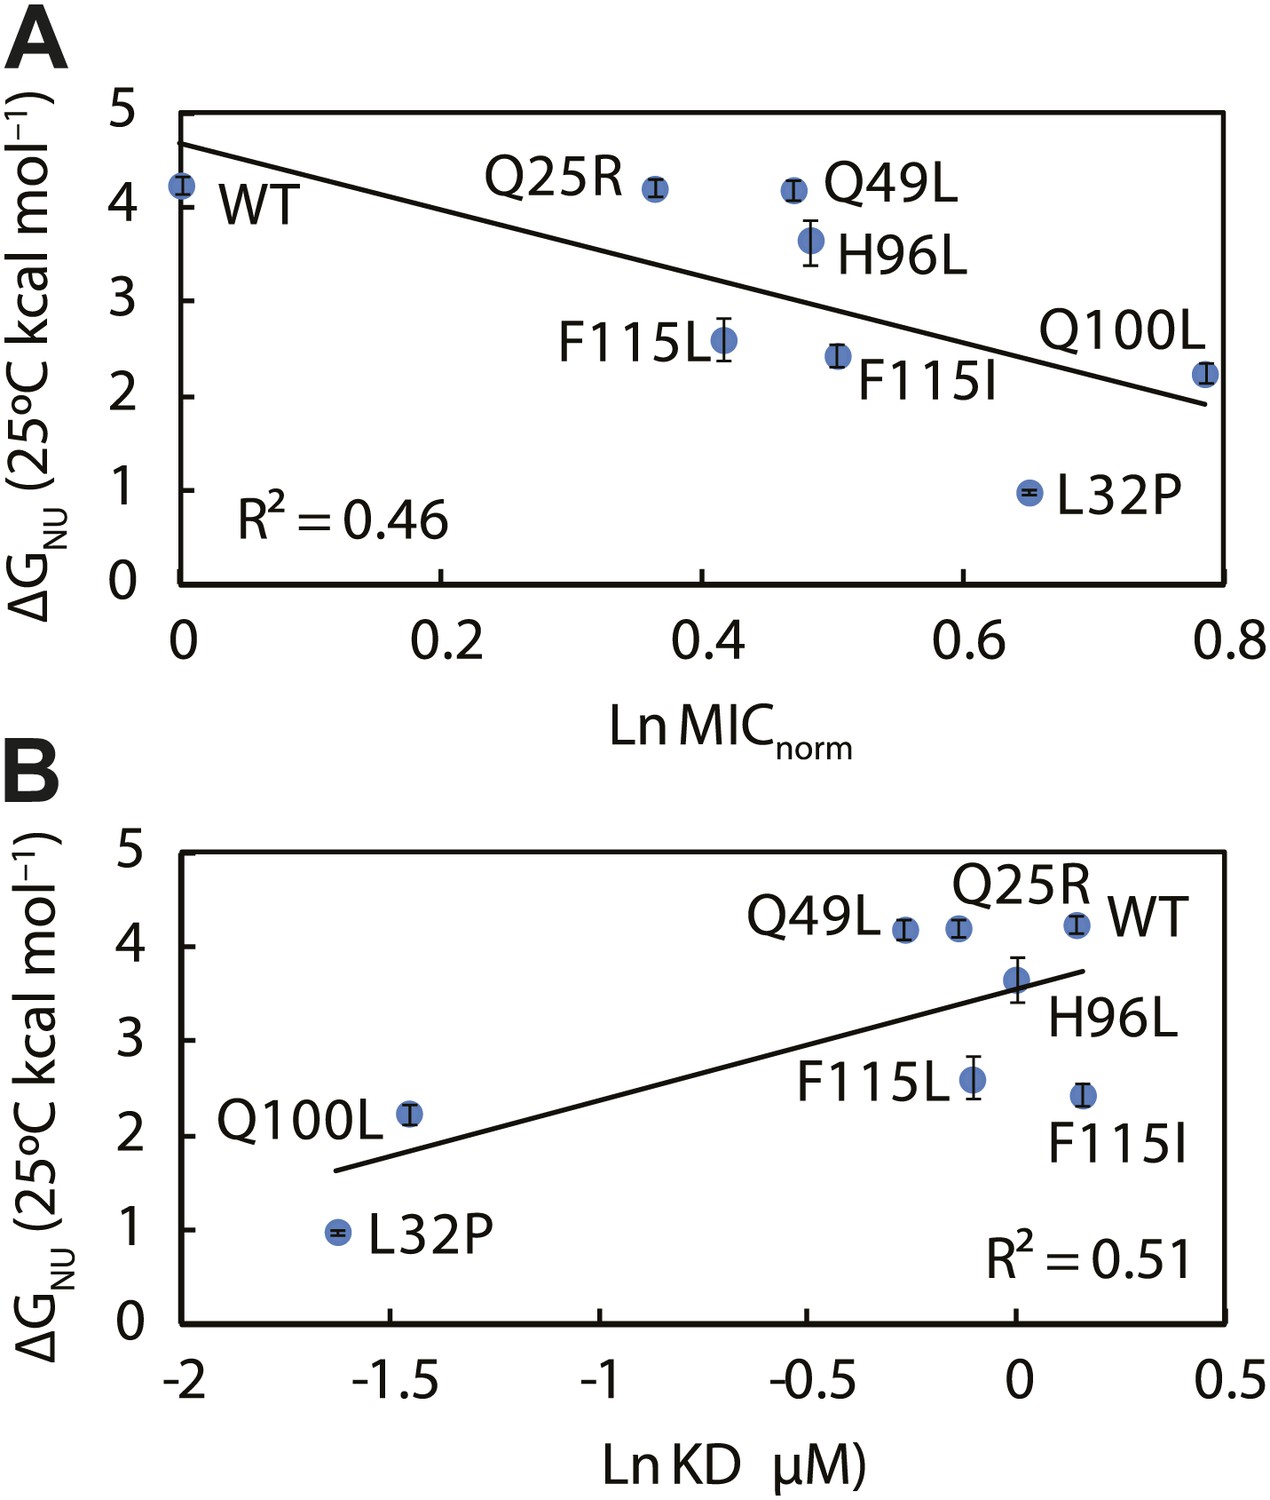
The thermodynamic stability of the Spy variants is inversely correlated with their chaperone activity and their affinity for its client protein.
(A) The in vivo chaperone activity of Spy variants is expressed as the normalized relative MIC of the strains expressing the variants plus the Bla-Im7 L53A I54A biosensor (SQ2068, LW53-59). (B) The binding activity of Spy variants towards Im7 L53A I54A is expressed as their dissociation constant (KD) to the client; smaller values indicate tighter binding.
Figure 5—figure supplement 1
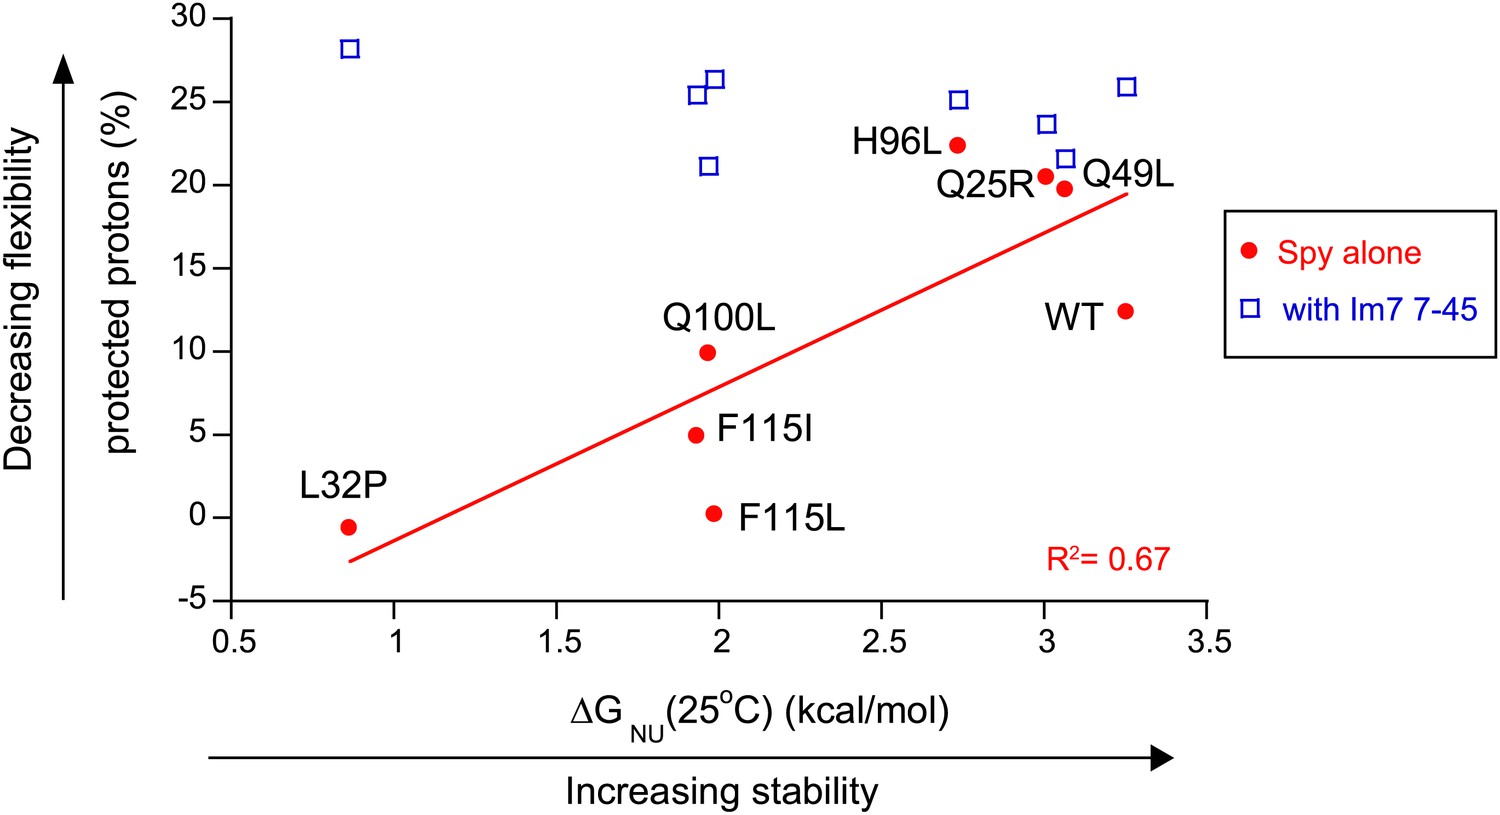
The more thermodynamically stable Spy variants are less flexible.
The flexibility of Spy variants is interpreted as the percentage of protected protons in the deuterium exchange analysis measured at 25°C and is inversely correlated with the stability of these Spy variants in the absence of client. This correlation is abolished when Spy variants were bound to the client peptide Im7 7-45.
Figure 5—figure supplement 2

Calculation of relative Spy activity in preventing α–lactalbumin (α -LA) aggregation.
(A) Typical aggregation curves of reduced unfolded α–LA in the absence or presence of wild type Spy added at four different Spy: α–LA ratios. (B) 22 Spy concentrations were used in the range of 0–2 Spy: α–LA ratios to produce a series of aggregation curves, from no inhibition to complete inhibition of aggregation. These concentrations were prepared from serial dilution of three starting concentrations. Light scattering endpoints at 300, 400, 500, and 600 s were obtained from the aggregation curves and plotted against Spy: α–LA ratios to make four standard curves. Shown in panel (B) is the standard curve generated at 400 S, which can be fit with an exponential equation: y = 0.004 + 0.108* exp(−8.46 × x).
Figure 5—figure supplement 3
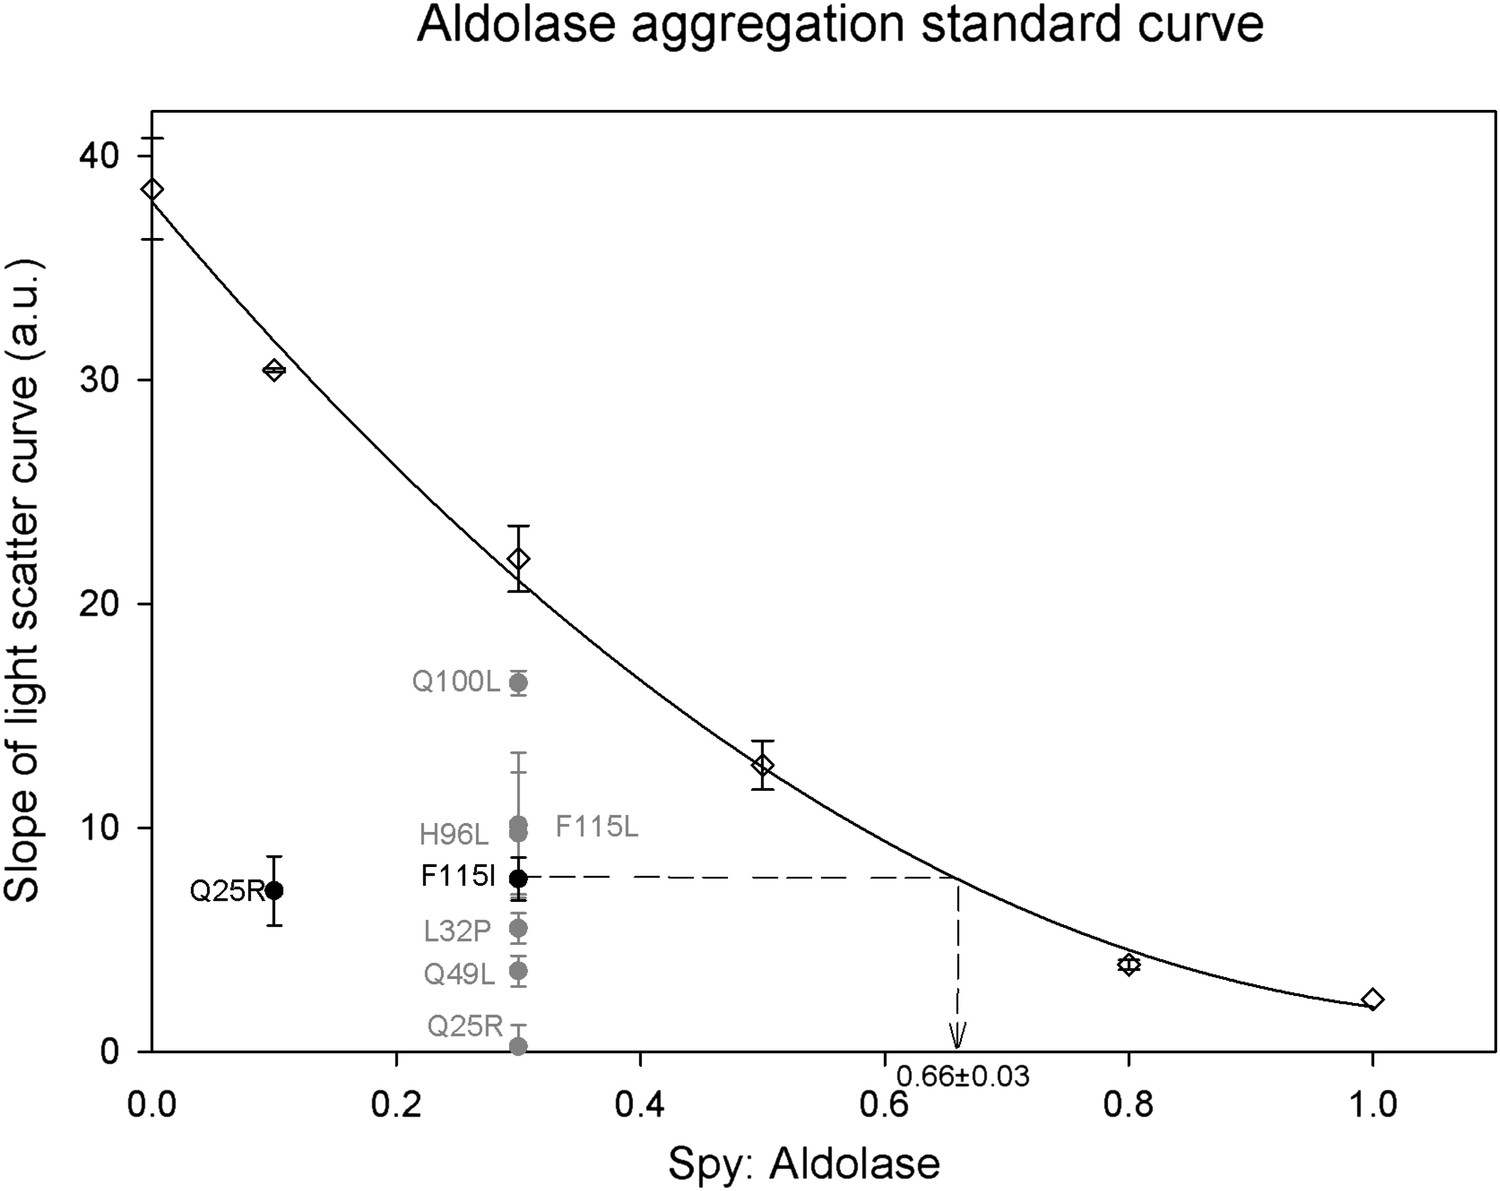
Calculation of relative Spy activity in preventing aldolase aggregation.
Six Spy concentrations were used in the range of 0–1 Spy: aldolase ratios to produce a series of aggregation curves from no inhibition to nearly complete inhibition of aggregation. All the ratios were repeated at least three times except for 0.1:1 and 1:1 which were done only twice and once respectively. A 0.3:1 ratio was chosen to evaluate the relative chaperone activity of the Spy mutants to the wild type since this ratio is locating in the middle range of the standard curve. The relative activity of the mutants was obtained by determining the average slope of the aggregation curves obtained for the mutants and interpolating this number back into the standard curve to calculate the ratio of wt Spy: aldolase that would give with an activity comparable to the mutant. All the mutants are significantly better than the wild type in preventing the aggregation of Aldolase denatured by guanidine. The calculation is diagramed in the figure for the F115I mutant. Each of the mutants were assayed at least three times. The most active mutant Q25R completely suppressed aggregation at a ratio of 0.3:1 putting it outside of the range of the standard curve, so for this mutant the assay was repeated at a ratio of 0.1:1. The fitted standard curve equation is y = 29.0861x2 − 65.0189x + 37.9414 and the R2 = 0.9967.
Figure 5—figure supplement 4

Calculation of the relative activity of Spy variants in the refolding of denatured aldolase.
The change in absorption at 340 nm of the aldolase substrate β-NADH upon hydrolysis by aldolase was used to determine aldolase activity. We measured the ability of Spy to refold aldolase by measuring how much aldolase activity was recovered from a denatured aldolase preparation following 5 min refolding in the presence and absence of Spy. Various concentrations of wild type Spy were first used in order to establish a standard curve. The standard curve was established by fitting all the relative refolding yields of nine different WT Spy ratios ranging from 0:1 to 1.75:1. The curve was fit using the following formula: y = 1.27711(x + 0.02196)0.18859, R² = 0.998. A Spy: aldolase ration of 0.25:1 was found to be located in the middle region of the standard curve so this amount of the Spy variants was used in order to establish if the variants were superior or inferior to wild type Spy. All were superior, although Q25R only marginally so. In order to establish activities of the Spy variants their influence on the refolding yields were related to the activity shown with wild type Spy. In the example shown 0.25:1 Spy H96L:aldolase performed as well as 0.474:1 Spy WT:aldolase, so Spy H96L is calculated to be 1.9-fold more active than is Spy WT.
Figure 6

Kinetic parameters characterizing the interaction of Spy variants with the client protein Im7 L53A I54A.
A linear correlation is seen between these in vitro parameters and the in vivo activity of these variants towards the same client (expressed as normalized MIC). Spy variants with better activity in vivo bind and release client slower and have an overall tighter affinity for the client.
Author response image 1
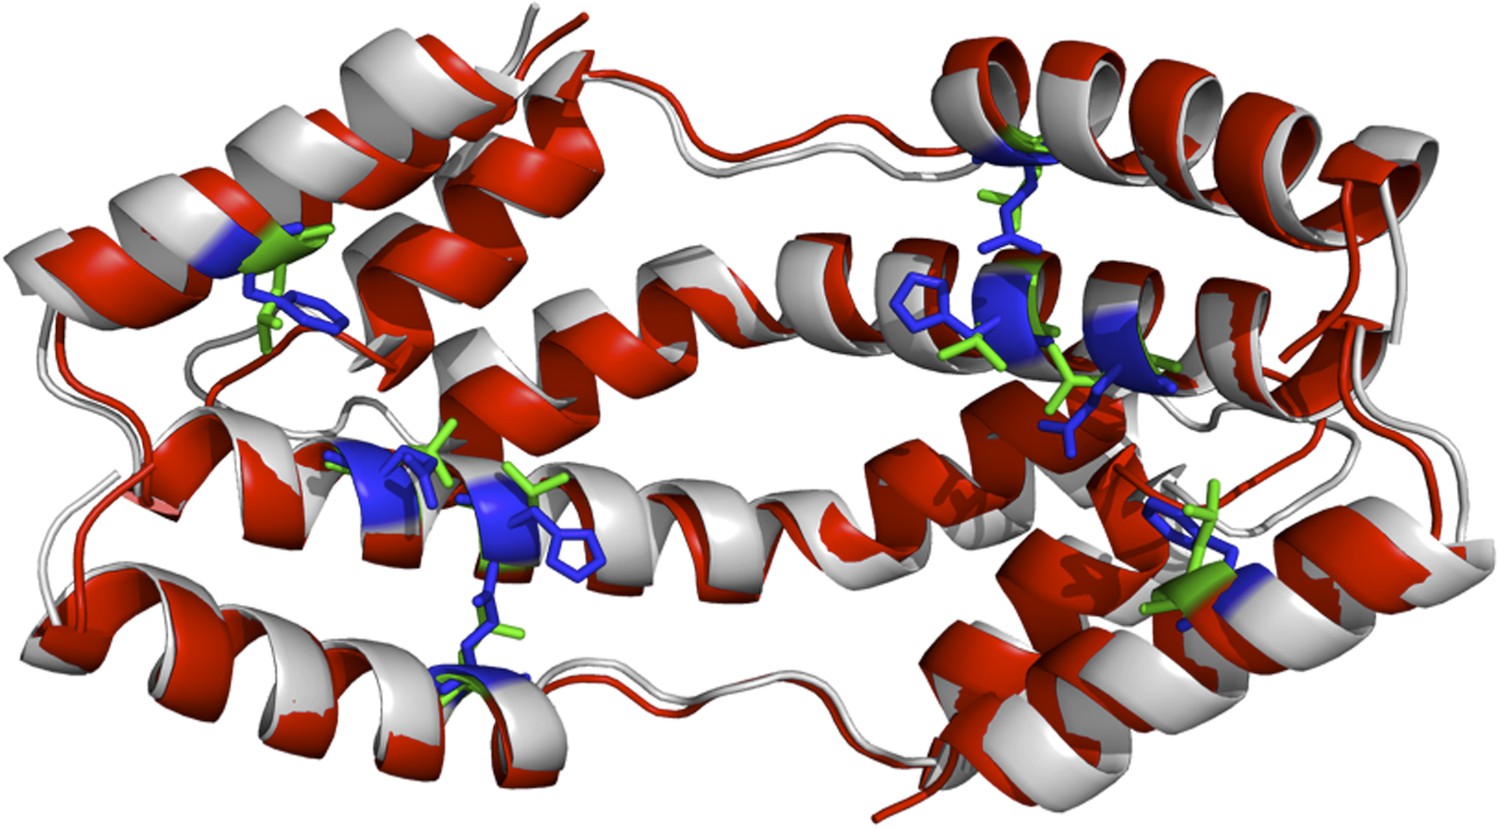
The I-TASSER model of the spy mutations (shown in red cartoon) superimposed onto the X-ray structure of wild-type Spy (shown in grey). Green and blue sticks are the mutated and original residues, respectively.
Author response image 2
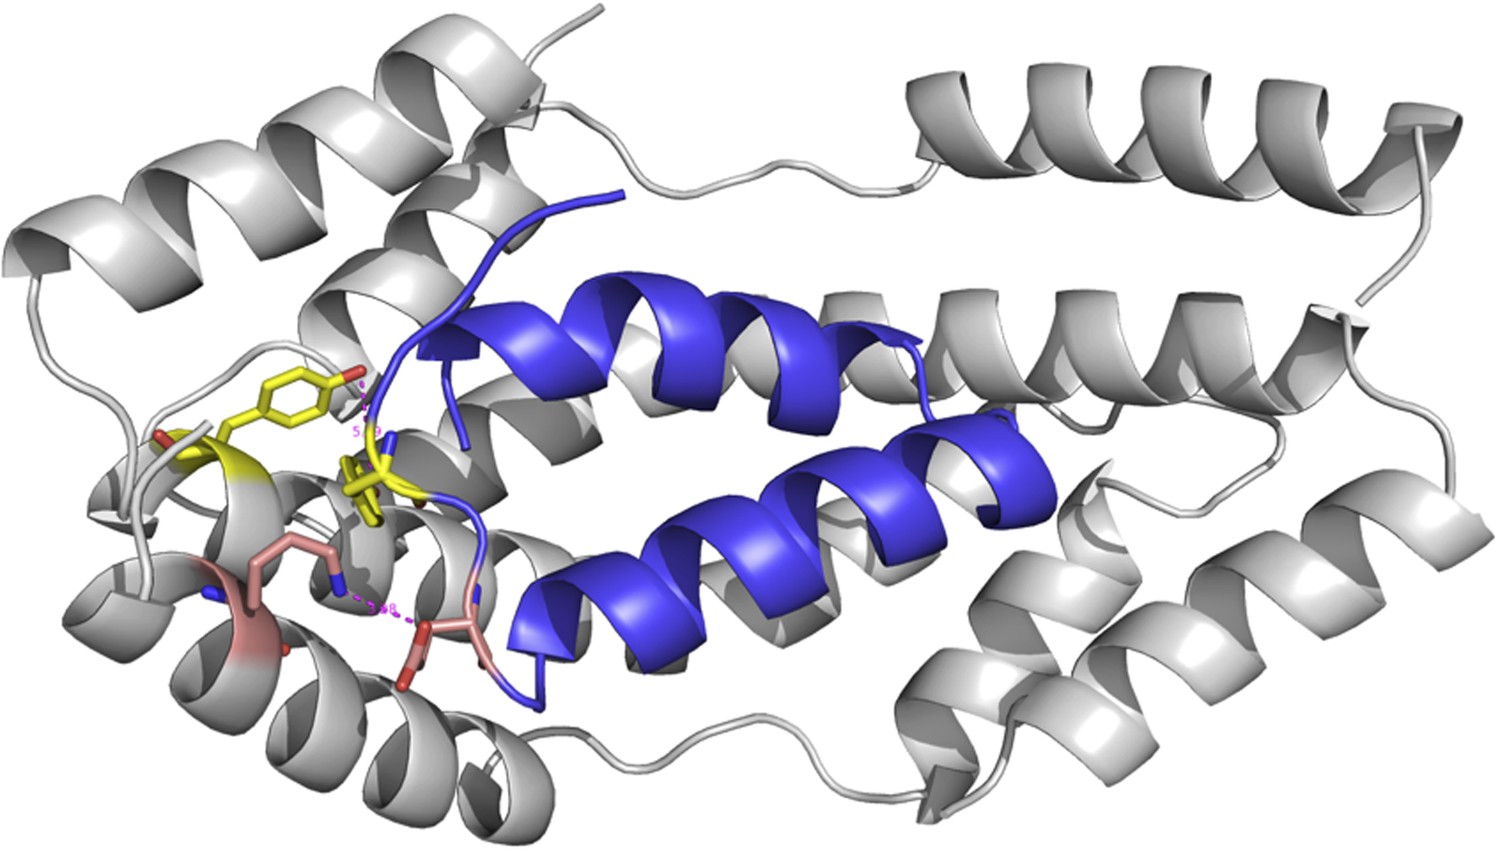
The modeled complex between Im7 7-45 peptide (blue cartoon) and mutated Spy structure (grey cartoon).
Tables
Table 1
Strain list
| Strain | Genotype or relevant characteristics | Source |
|---|---|---|
| SQ765 | MG1655 (F¯ λ¯ ilvG¯ rfb-50 rph-1), ΔhsdR | (Quan et al., 2011) |
| SQ2041 | SQ765, ΔampC, Δspy, pBR322 bla::GSlinker Im7 L53A I54A (Foit et al., 2009) | This study |
| SQ2068 | SQ2041, pCDFTrc-Spy | This study |
| LW53 | SQ2041, pCDFTrc-Spy Q100L | This study |
| LW54 | SQ2041, pCDFTrc-Spy L32P | This study |
| LW55 | SQ2041, pCDFTrc-Spy F115I | This study |
| LW56 | SQ2041, pCDFTrc-Spy Q49L | This study |
| LW57 | SQ2041, pCDFTrc-Spy F115L | This study |
| LW58 | SQ2041, pCDFTrc-Spy H96L | This study |
| LW59 | SQ2041, pCDFTrc-Spy Q25R | This study |
Table 2
Properties of Spy variants
| Spy variants | MICnorm | Activity (aldolase agg. Prev) | Activity (aldolase refold) | Activity (α-LA agg. Prev) | kon (× 105 mol−1 s−1) | koff (s−1) | KD (µM) | Tm (°C) | ΔHm (Kcal mol−1) | ΔCp (Kcal K−1 mol−1) | ΔGNU (25°C) (Kcal mol−1) |
|---|---|---|---|---|---|---|---|---|---|---|---|
| WT | 1 | 1 | 1 | 1 | 3.98 ± 0.11 | 0.456 ± 0.011 | 1.15 ± 0.027 | 48.1 ± 0.1 | 66.6 ± 1.5 | 0.64 | 4.24 ± 0.10 |
| Q25R | 1.44 | 6.90 ± 0.64 | 1.38 ± 0.31 | 2.44 ± 0.89 | 2.29 ± 0.13 | 0.198 ± 0.005 | 0.87 ± 0.034 | 46.3 ± 0.4 | 73.7 ± 0.8 | 0.98 | 4.20 ± 0.10 |
| L32P | 1.92 | 2.52 ± 0.11 | 4.85 ± 0.57 | 2.10 ± 0.74 | 1.51 ± 0.14 | 0.030 ± 0.002 | 0.20 ± 0.003 | 31.0 ± 0.2 | 52.1 ± 2.5 | 0.71 | 0.99 ± 0.02 |
| Q49L | 1.60 | 2.88 ± 0.14 | 4.25 ± 0.66 | 1.93 ± 0.66 | 2.30 ± 0.06 | 0.176 ± 0.009 | 0.76 ± 0.018 | 52.0 ± 0.2 | 59.9 ± 1.0 | 0.68 | 4.19 ± 0.10 |
| H96L | 1.62 | 2.02 ± 0.32 | 1.90 ± 0.32 | 1.64 ± 0.49 | 2.68 ± 0.14 | 0.266 ± 0.010 | 1.00 ± 0.022 | 50.1 ± 0.1 | 56.2 ± 3.0 | 0.71 | 3.66 ± 0.23 |
| Q100L | 2.19 | 1.34 ± 0.05 | 4.20 ± 0.44 | 2.12 ± 0.75 | 1.19 ± 0.13 | 0.027 ± 0.002 | 0.23 ± 0.013 | 53.8 ± 0.6 | 28.9 ± 1.1 | 0.23 | 2.24 ± 0.11 |
| F115L | 1.52 | 1.98 ± 0.32 | 4.85 ± 0.56 | 2.30 ± 0.83 | 2.73 ± 0.01 | 0.245 ± 0.007 | 0.90 ± 0.028 | 41.3 ± 0.2 | 56.6 ± 4.9 | 0.76 | 2.60 ± 0.22 |
| F115I | 1.65 | 2.21 ± 0.12 | 4.33 ± 0.49 | 2.34 ± 0.85 | 2.82 ± 0.15 | 0.328 ± 0.017 | 1.17 ± 0.097 | 41.7 ± 0.4 | 54.3 ± 1.5 | 0.98 | 2.43 ± 0.11 |
-
ΔGNU(25°C) is the free energy of stabilization at 25°C (NU dictates the transition from folded state to unfolded state), ΔHm is the change in enthalpy at Tm which is the melting temperature and ΔCp is the change in heat capacity associated with the unfolding of the Spy variant. agg. prev: aggregation prevention. Fold activity expresses relative to WT. Values after the ± sign are standard errors.
-
MICnorm is measured for cells (SQ2068, LW53-59) expressing the pBR322 bla::GSlinker Im7 L53A I54A plasmid and various Spy constructs. kon, koff, and KD are kinetic parameters describing the interaction between Im7 L53A I54A and the Spy variants.
Table 3
Spy-Im7 crosslinks
| Mass (Da) | Rt (min) | Δ (ppm) | Pr 1 | S | E | Res | Sequence* | Pr2 | S | E | Res | Sequence* | CL | Enz | ||||
|---|---|---|---|---|---|---|---|---|---|---|---|---|---|---|---|---|---|---|
| 1853.87609 | 16.47 | 0.4 | Spy | - | 12 | - | - | SADTTTAAPADAK† | P | Im7 | 21 | 24 | 21 | K | EIEK | E | ABAS | Tr |
| 1835.77969 | 20.77 | 0.6 | Spy | 15 | 18 | 18 | M | MHHK | G | Im7 | 20 | 25 | 20 | L | KEIEKE | N | CBDPS | PK |
| 1447.60195 | 22.43 | 0.6 | Spy | 16 | 18 | 18 | M | HHK | G | Im7 | 20 | 23 | 20 | L | KEIE | K | CBDPS | PK |
| 1704.73954 | 19.18 | 0.5 | Spy | 16 | 18 | 18 | M | HHK | G | Im7 | 20 | 25 | 20 | L | KEIEKE | N | CBDPS | PK |
| 2328.05587 | 21.48 | 1 | Spy | 16 | 24 | 20 | M | HHKGKFGPH | Q | Im7 | 20 | 25 | 20 | L | KEIEKE | N | CBDPS | PK |
| 1567.68178 | 21.40 | −0.2 | Spy | 17 | 18 | 18 | H | HK | G | Im7 | 20 | 25 | 20 | L | KEIEKE | N | CBDPS | PK |
| 3673.64206 | 53.63 | −0.4 | Spy | 19 | 30 | 20 | K | GKFGPHQDMMFK | D | Im7 | - | 20 | - | - | SISDYTEAEFVQLLK | E | CBDPS | Tr |
| 1781.79357 | 34.95 | −0.9 | Spy | 19 | 24 | 20 | K | GKFGPH | Q | Im7 | 19 | 23 | 20 | L | LKEIE | K | CBDPS | PK |
| 2038.92970 | 31.40 | −0.1 | Spy | 19 | 24 | 20 | K | GKFGPH | Q | Im7 | 19 | 25 | 20 | L | LKEIEKE | N | CBDPS | PK |
| 1925.84667 | 28.32 | −0.6 | Spy | 19 | 24 | 20 | K | GKFGPH | Q | Im7 | 20 | 25 | 20 | L | KEIEKE | N | CBDPS | PK |
| 1377.61083 | 33.10 | 0.3 | Spy | 29 | 31 | 30 | M | FKD | L | Im7 | 42 | 45 | 43 | F | VKIT | - | CBDPS | PK |
| 3793.80025 | 56.15 | −0.5 | Spy | 31 | 43 | 39 | K | DLNLTDAQKQQIR | E | Im7 | - | 20 | - | - | SISDYTEAEFVQLLK† | E | CBDPS | Tr |
| 3266.68723 | 45.13 | 1.1 | Spy | 31 | 43 | 39 | K | DLNLTDAQKQQIR | E | Im7 | - | 20 | 12 | - | SISDYTEAEFVQLLK | E | EDC | Tr |
| 3112.43551 | 53.53 | 0.1 | Spy | 44 | 50 | 47 | R | EIMKGQR | D | Im7 | - | 20 | - | - | SISDYTEAEFVQLLK | E | CBDPS | Tr |
| 3649.69333 | 51.73 | −0.7 | Spy | 51 | 61 | 54 | R | DQMKRPPLEER | R | Im7 | - | 20 | - | - | SISDYTEAEFVQLLK | E | CBDPS | Tr |
| 1838.84488 | 31.50 | 0.5 | Spy | 54 | 61 | 54 | M | KRPPLEER | R | Im7 | - | 8 | - | - | SIS | D | CBDPS | PK |
| 2958.53428 | 48.48 | 0.1 | Spy | 103 | 112 | 104 | K | IYNILTPEQK | K | Im7 | - | 20 | 10 | - | SISDYTEAEFVQLLK | E | PICUP | Tr |
| 1699.77183 | 31.88 | −0.3 | Spy | 123 | 130 | 130 | R | LTERPAAK | G | Im7 | - | 8 | - | - | SIS | D | CBDPS | PK |
| 2822.33254 | 55.33 | −0.5 | Spy | 127 | 132 | 130 | R | PAAKGK | M | Im7 | - | 20 | - | - | SISDYTEAEFVQLLK | E | CBDPS | Tr |
| 3055.37181 | 57.27 | −1.6 | Spy | 131 | 138 | 132 | K | GKMPATAE | - | Im7 | - | 20 | - | - | SISDYTEAEFVQLLK | E | CBDPS | Tr |
-
Rt: retention time; Δ: mass error for crosslink assignments; Pr: protein; S, E: starting and ending amino acid residues (sequence numbers) of the crosslinked peptides, respectively; Res: crosslinked residue (sequence number) within corresponding peptide; CL: crosslinking reagent used; Enz: digestion enzyme used. The crosslinked residues are bolded and underlined in the sequences.
-
*
The residues shown before and after the sequences are the preceding and following residues of the peptide sequence. They are shown to illustrate digest specificity.
-
†
The N-terminal serine was introduced from the Sumo fusion constructs, which were used for Spy or Im7 purification (Quan et al., 2011). The symbol ‘−’ is used to indicate this N-terminal serine.
Download links
A two-part list of links to download the article, or parts of the article, in various formats.
Downloads (link to download the article as PDF)
Open citations (links to open the citations from this article in various online reference manager services)
Cite this article (links to download the citations from this article in formats compatible with various reference manager tools)
Super Spy variants implicate flexibility in chaperone action
eLife 3:e01584.
https://doi.org/10.7554/eLife.01584


