Phosphoinositide-mediated oligomerization of a defensin induces cell lysis
- La Trobe University, Australia
Figures
Figure 1 with 1 supplement
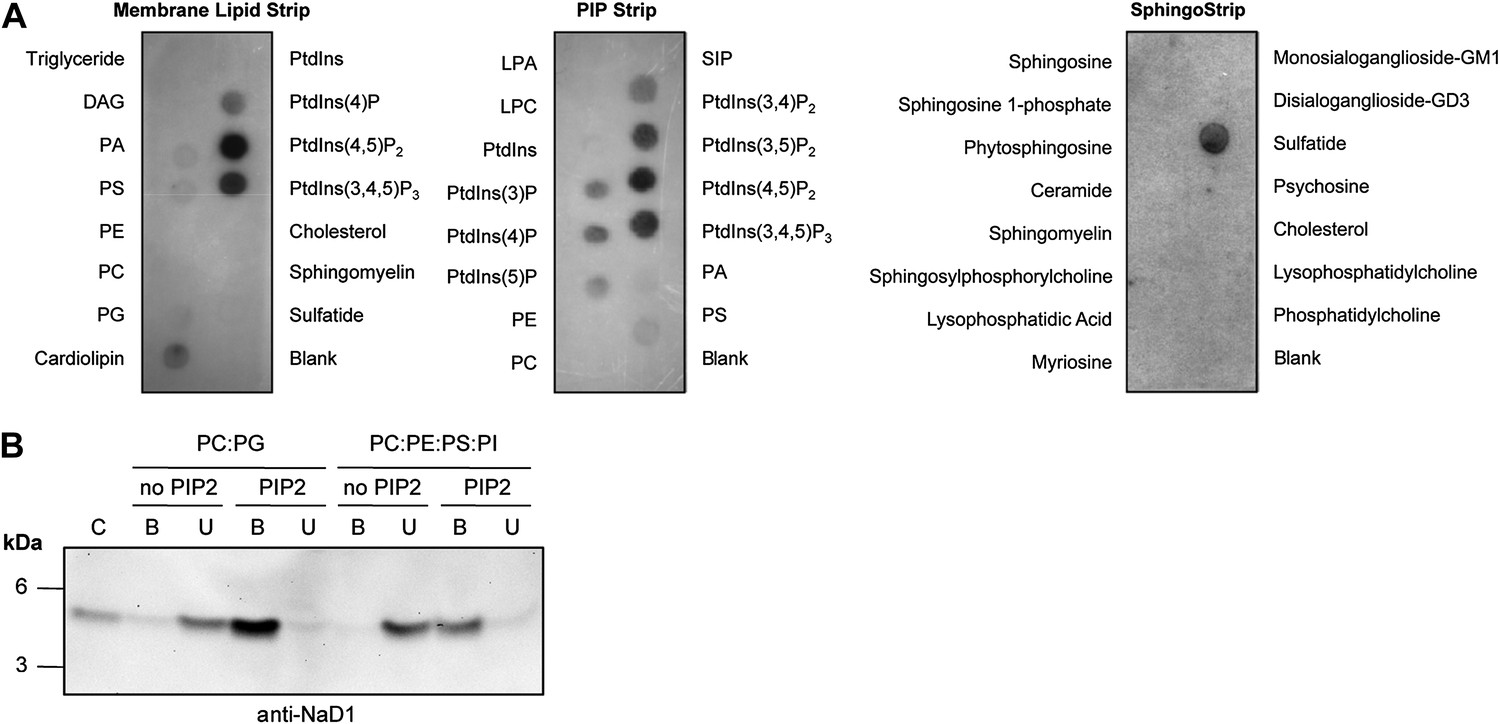
Interaction of NaD1 with lipids.
(A) Detection of NaD1 binding to cellular lipids by protein-lipid overlay assay. Blots are representative of at least two independent experiments for each strip. (B) Binding of NaD1 to PIP2-containing liposomes. NaD1 in A and B was detected using a rabbit anti-NaD1 antibody.
Figure 1—figure supplement 1
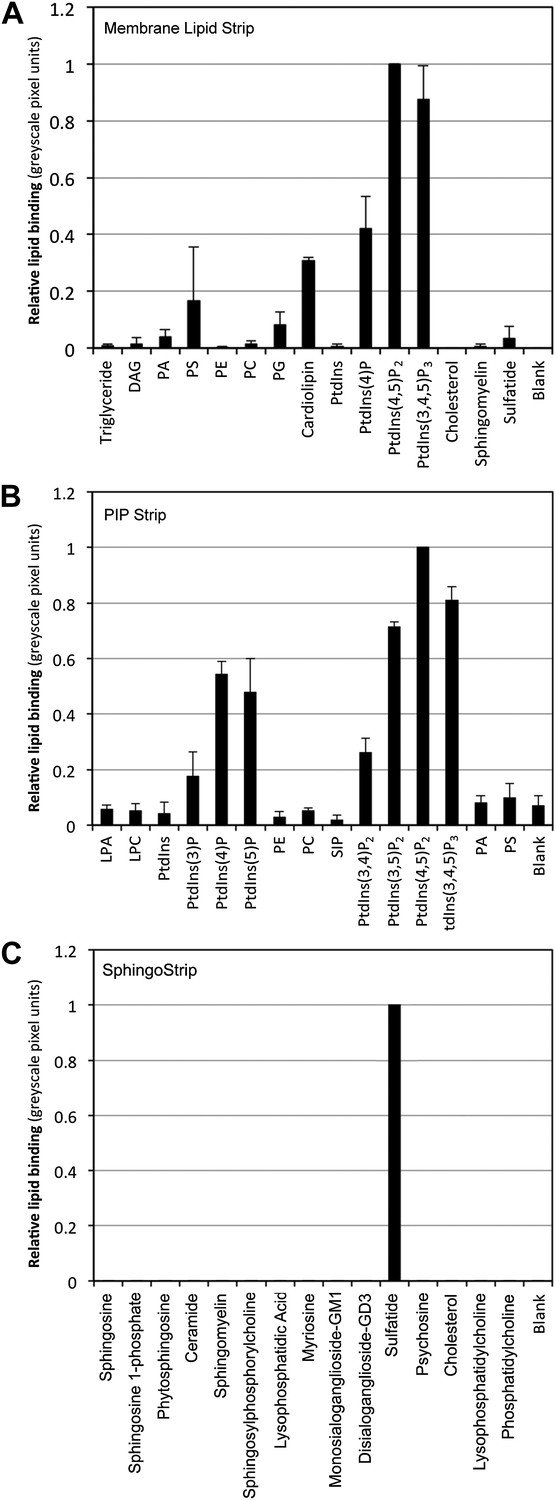
Relative binding of NaD1 to lipids.
Quantitation by densitometry of the relative binding of NaD1 to lipids (normalized to PtdIns(4,5)P2 in A and B, sulfatide in C) on a (A) Membrane Lipid Strip, (B) PIP Strip, and (C) SphingoStrip. Data shown as mean ± SD (n = 2) for A and C, and mean ± SEM (n = 3) for B.
Figure 2
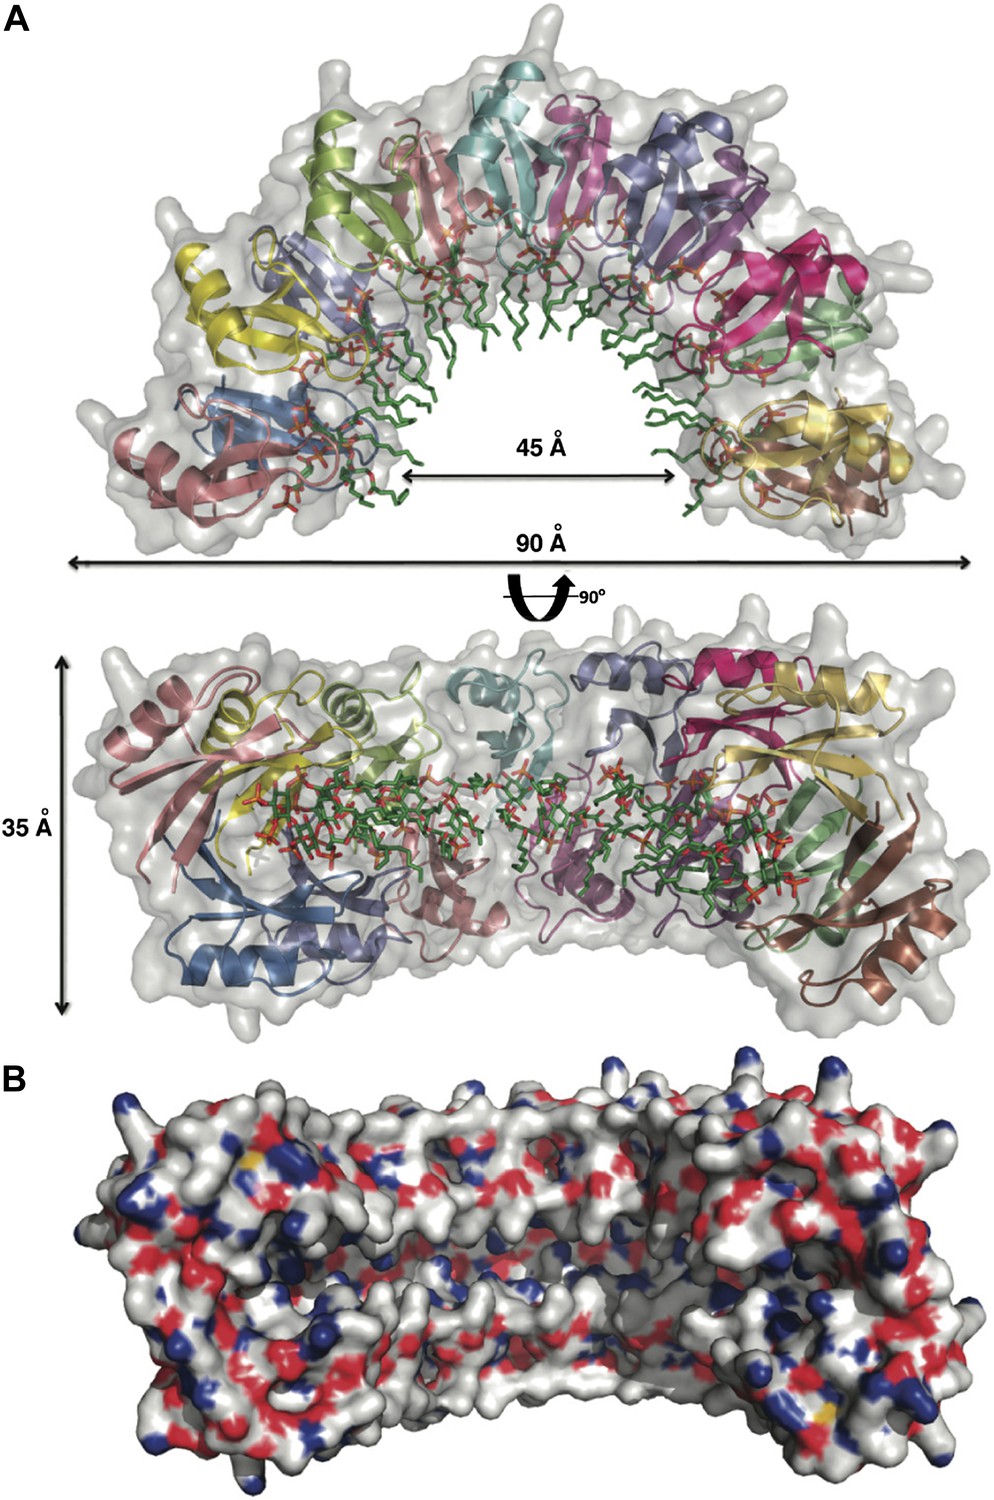
Crystal structure of the NaD1:PIP2 complex.
(A) Two orthogonal views of a cartoon representation of the NaD1:PIP2 oligomer comprising 14 NaD1 monomers (shown as ribbons) and 14 PIP2 molecules (shown as green sticks). The surface of the NaD1 oligomer is shown in gray. (B) Surface representation of the NaD1 14-mer, displaying the extended binding groove on the inside of the arch. Coloring is by atom type (N in blue, O in red, S in yellow, and C in gray). For clarity the 14 bound PIP2 molecules were omitted.
Figure 3 with 2 supplements
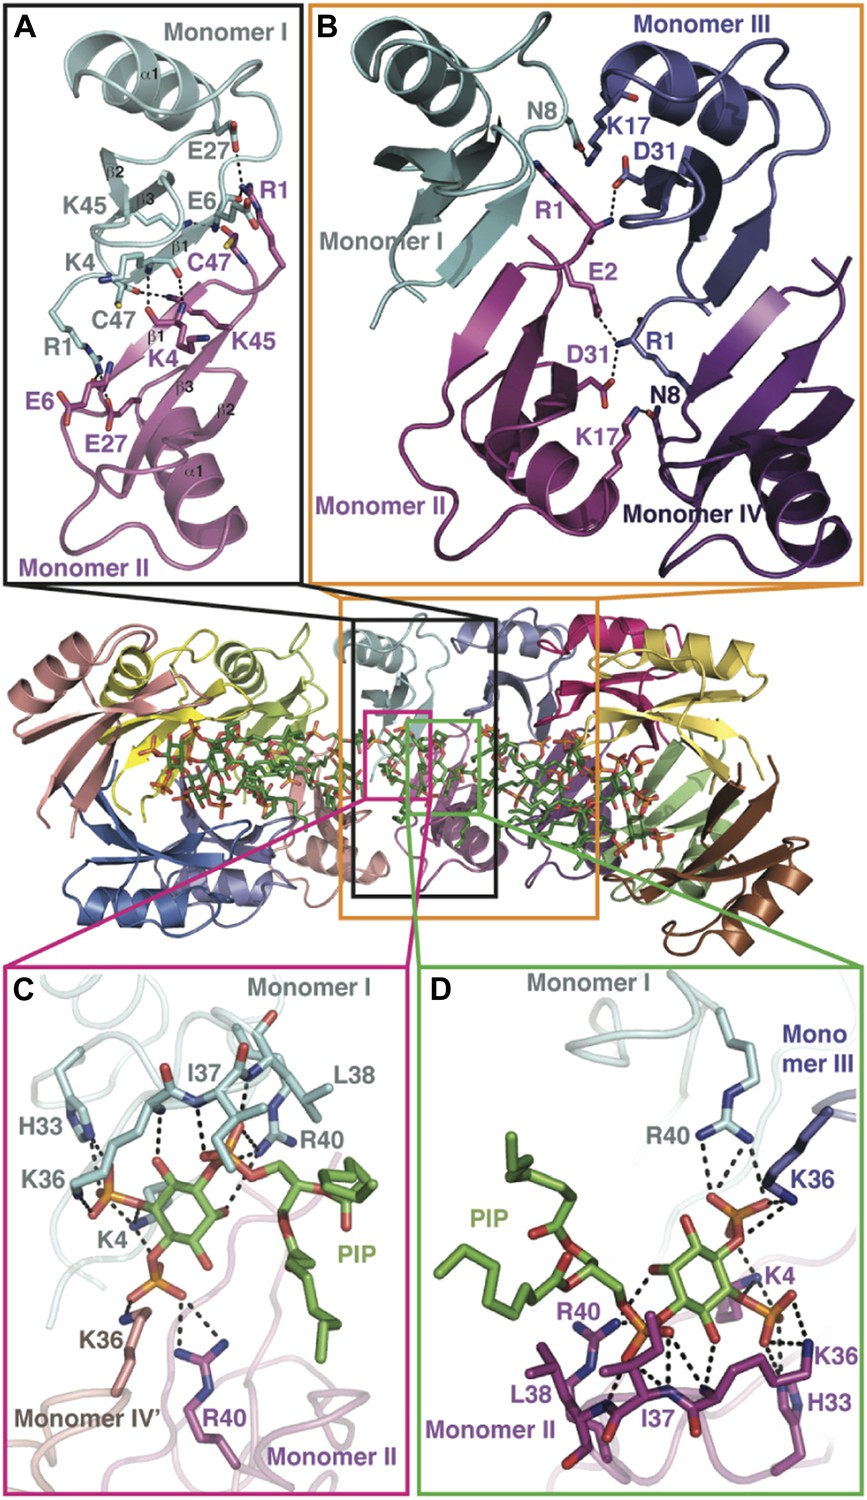
Detailed view of the crystal structure of the NaD1:PIP2 complex.
In all panels, hydrogen bonds and salt bridges are shown as black dotted lines. (A) View of the interface of two NaD1 monomers revealing the hydrogen bonding pattern, with monomer I shown in cyan and monomer II in magenta. Secondary structure elements are labeled in black. For clarity bound PIP2 molecules are omitted. (B) Cartoon diagram of four molecules of NaD1 forming a dimer of dimers. (C) PIP2 binding site on monomer I. Cartoon diagram of the PIP2 binding site in monomer I on dimeric NaD1. (D) PIP2 binding site on monomer II. Cartoon diagram of the PIP2 binding site on monomer II on dimeric NaD1.
Figure 3—figure supplement 1
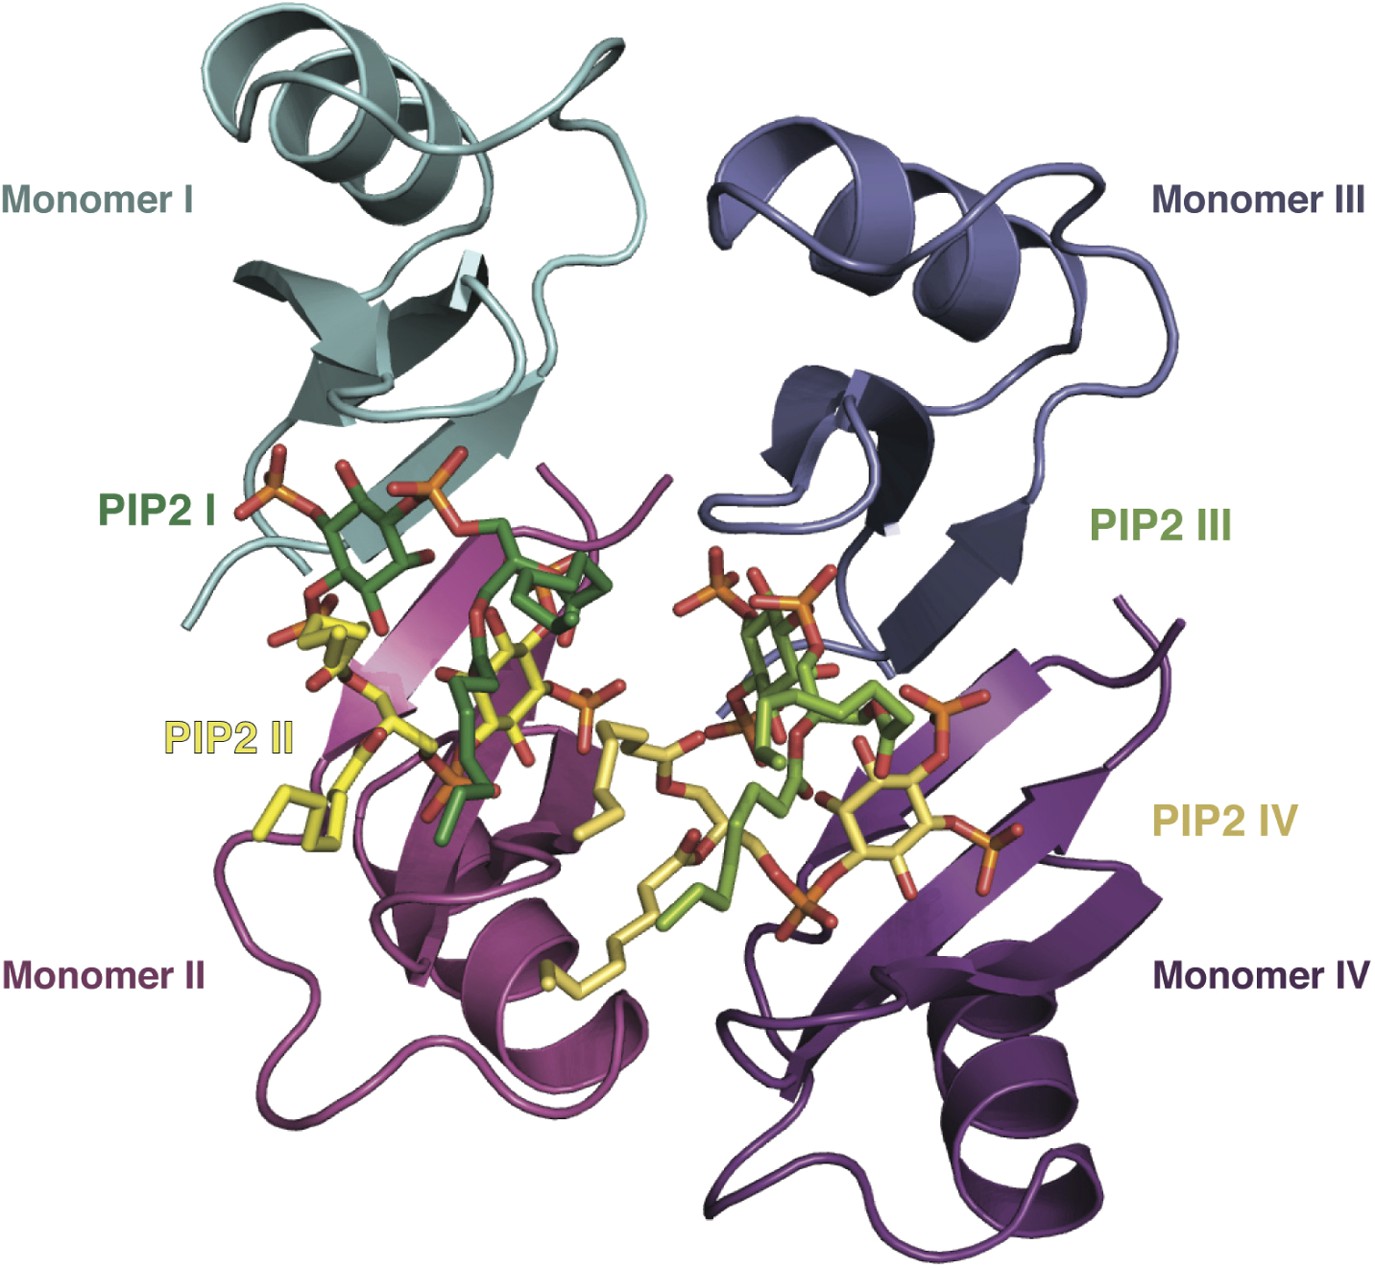
Cartoon of two NaD1 dimers with four bound PIP2 molecules.
https://doi.org/10.7554/eLife.01808.008
Figure 3—figure supplement 2
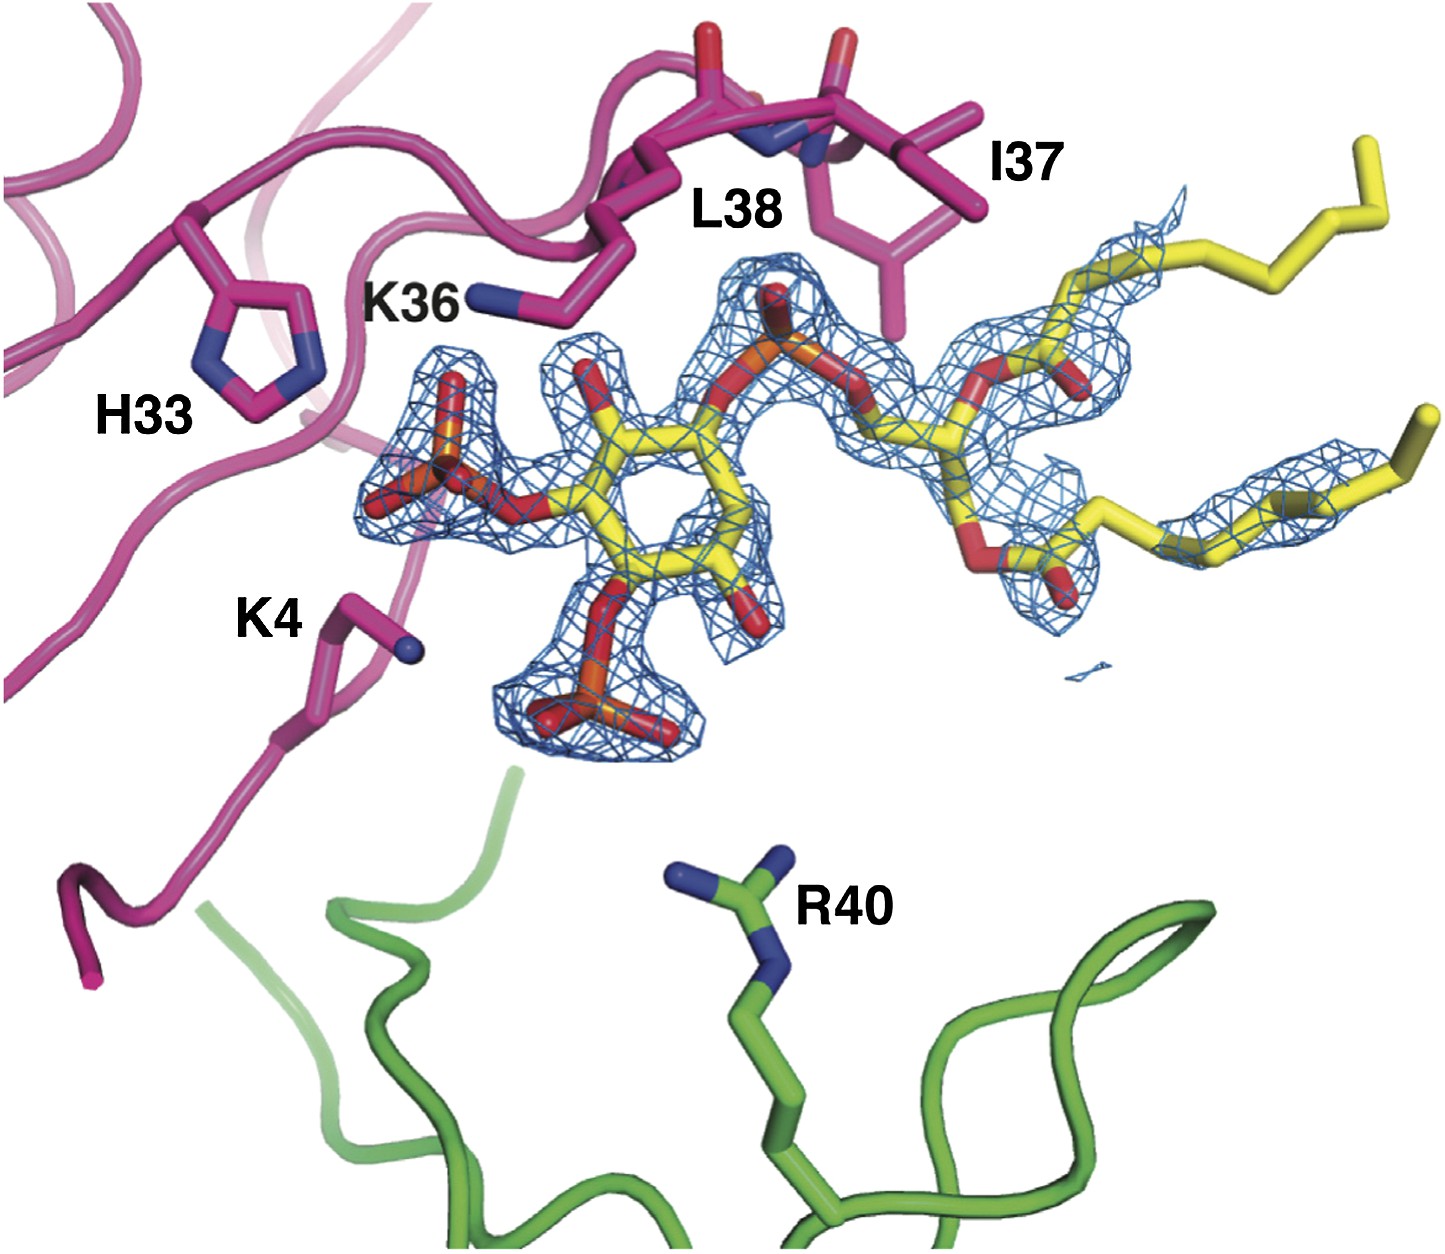
Simulated anneal omit map of a single PIP2 molecule bound to an NaD1 dimer, contoured at 1σ.
https://doi.org/10.7554/eLife.01808.009
Figure 4
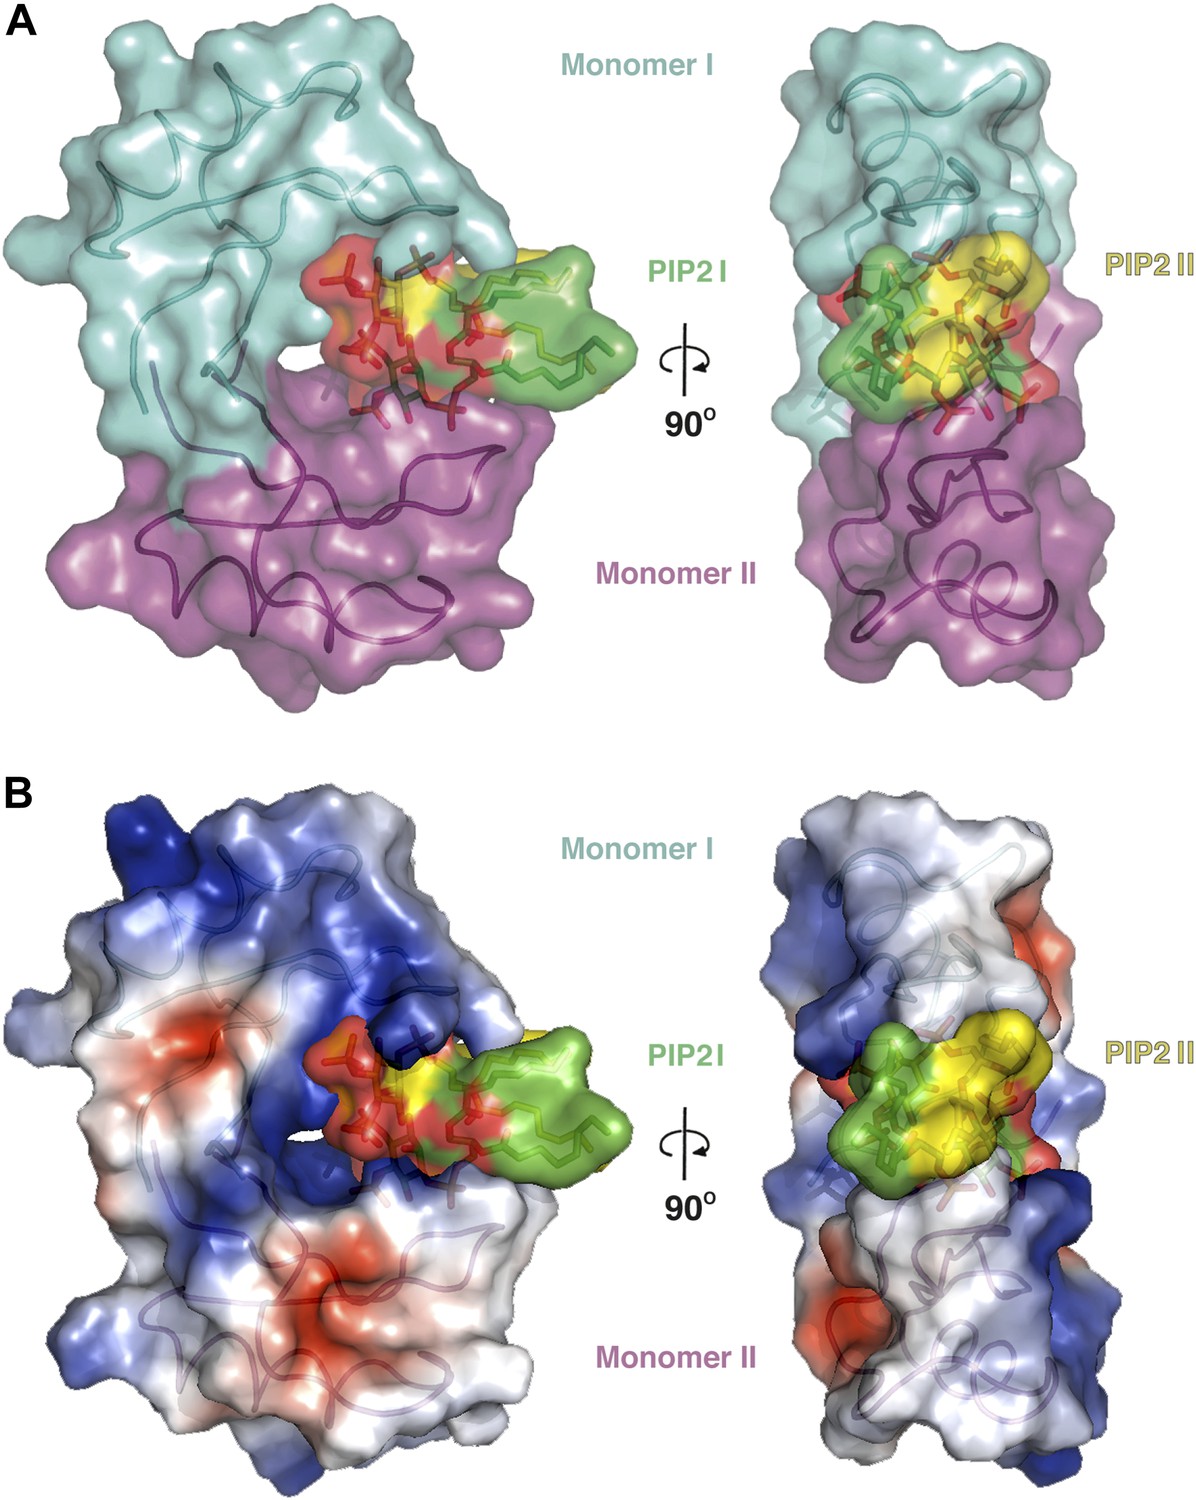
The dimeric NaD1 ‘cationic grip‘ with two bound PIP2 molecules.
(A) Surface view in two orientations of a NaD1 dimer (monomer I in cyan and monomer II in magenta) with two bound PIP2 molecules (yellow and green). (B) The same as in A except that the surface shows a qualitative electrostatic representation (blue is positive, red in negative, and white is uncharged or hydrophobic). Figure generated using Pymol.
Figure 5
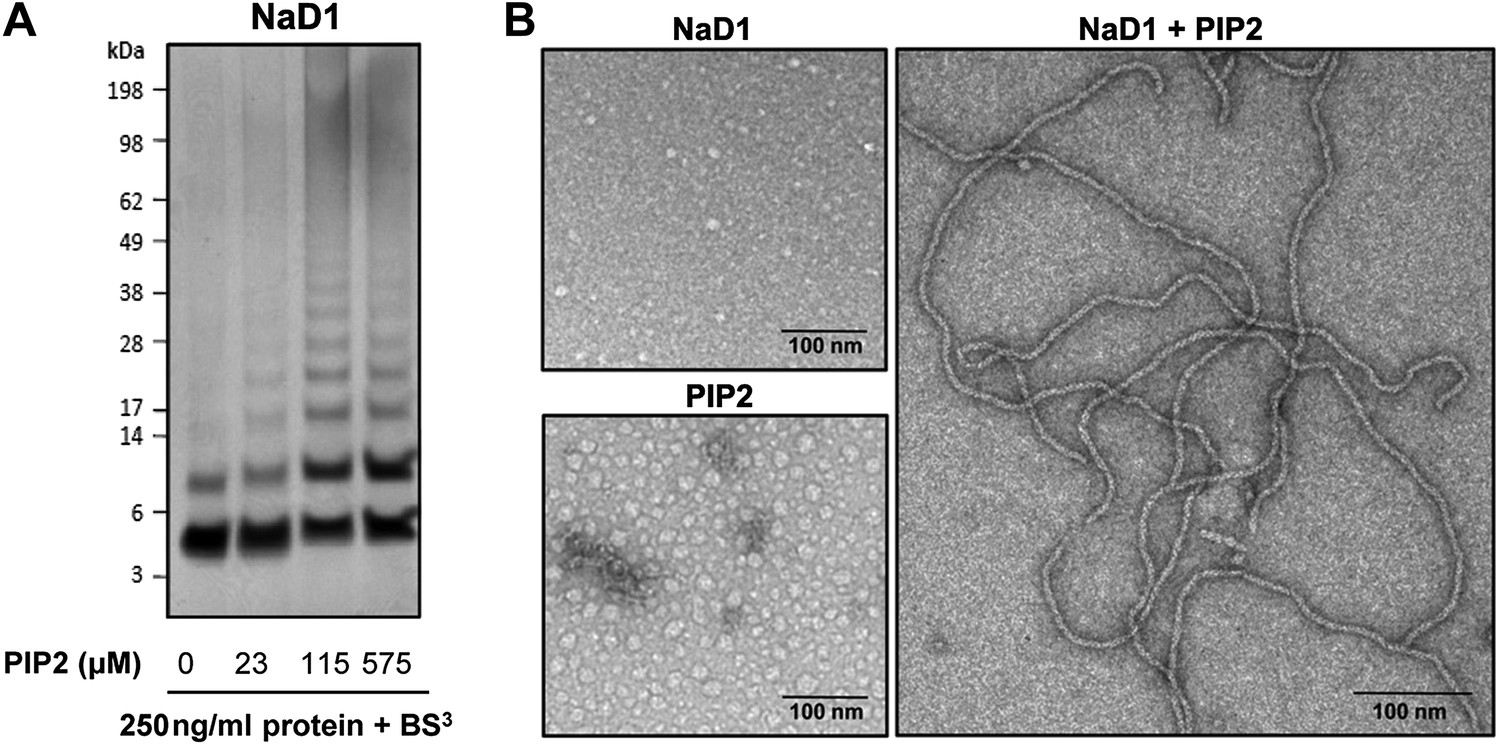
NaD1 forms oligomers with PIP2.
(A) Ability of NaD1 to form multimers in the presence of PIP2 as determined by protein–protein cross-linking with BS3 followed by SDS-PAGE and Coomassie Brilliant Blue staining. (B) TEM of NaD1:PIP2 complexes. TEM micrographs of NaD1 alone, PIP2 alone, or NaD1 in complex with PIP2. Data in A and B are representative of at least two independent experiments.
Figure 6 with 1 supplement
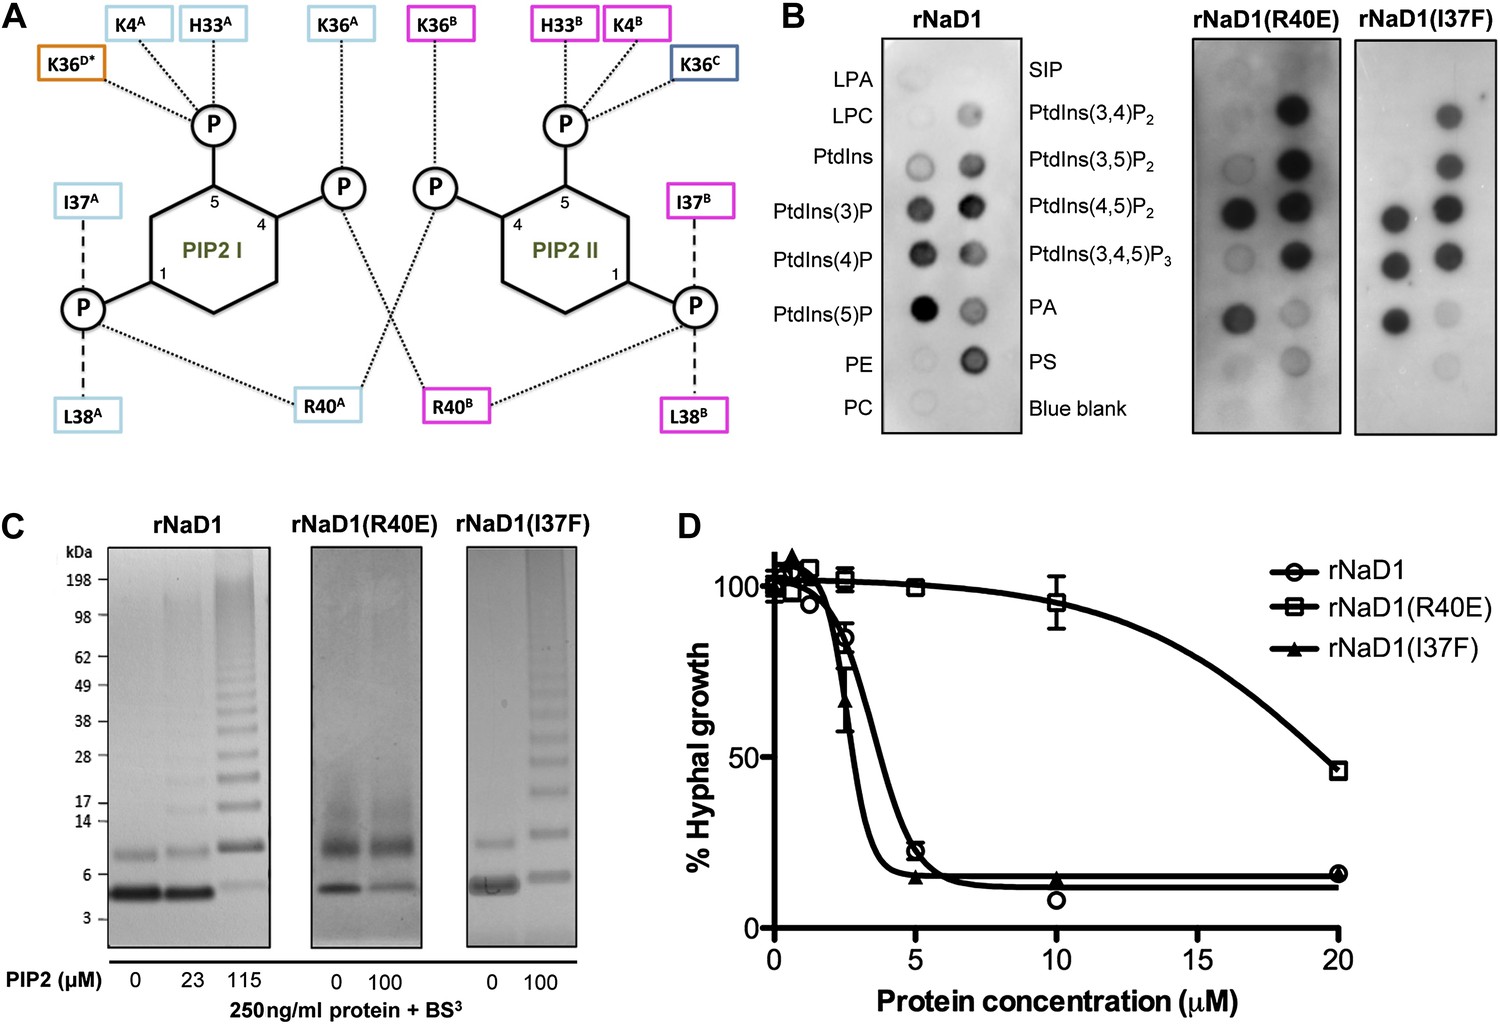
Multimerization of the NaD1:PIP2 complex.
(A) Schematic representation of residues from neighboring NaD1 monomers involved in binding two PIP2 molecules. Ability of rNaD1, rNaD1(R40E), and rNaD1(I37F) to (B) bind cellular lipids by protein-lipid overlay assay, (C) form multimers in the presence of PIP2 as determined by protein–protein cross-linking with BS3 followed by SDS-PAGE and Coomassie Brilliant Blue staining, and (D) to inhibit fungal cell growth. Error bars in D indicate SEM (n = 3). Data in B–D are representative of at least two independent experiments.
Figure 6—figure supplement 1
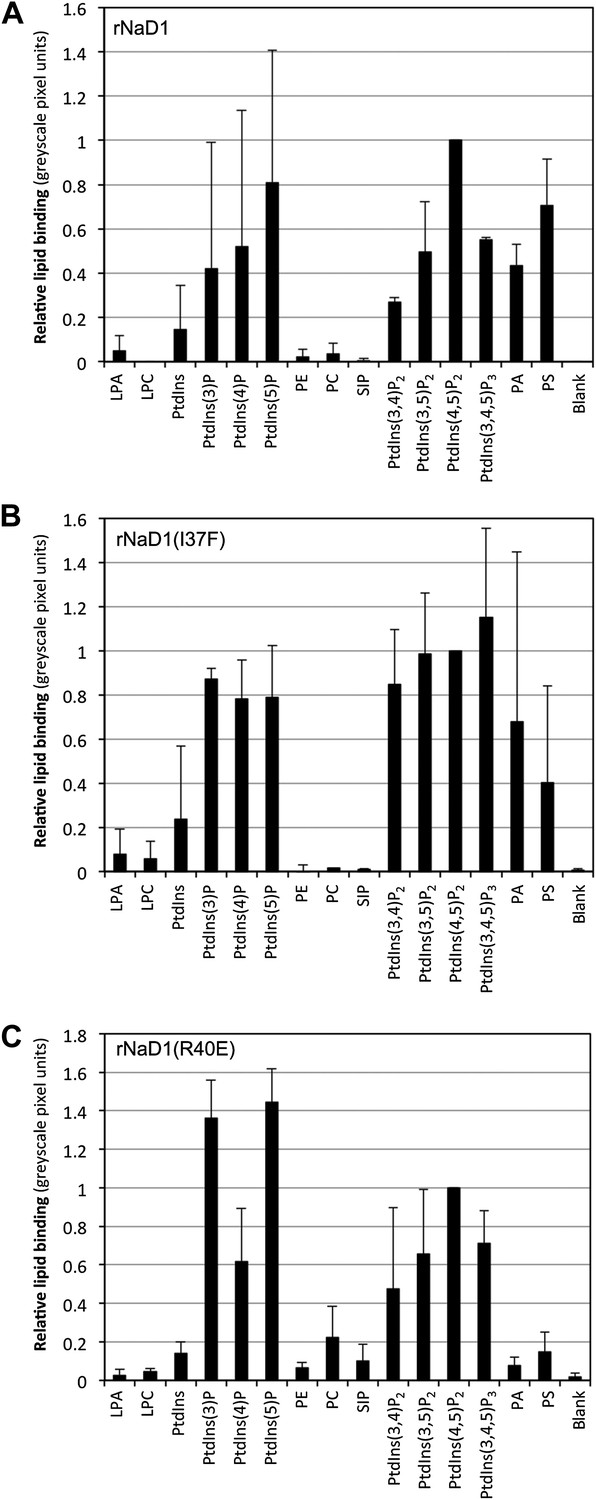
Relative binding of rNaD1, rNaD1(I37F), and rNaD1(R40E) to lipids.
Quantitation by densitometry of the relative binding (normalized to PtdIns(4,5)P2) of (A) rNaD1, (B) rNaD1(I37F), and (C) rNaD1(R40E) to lipids on PIP Strips. Data shown as mean ± SD (n = 2) for A and B, and mean ± SEM (n = 3) for C.
Figure 7 with 3 supplements
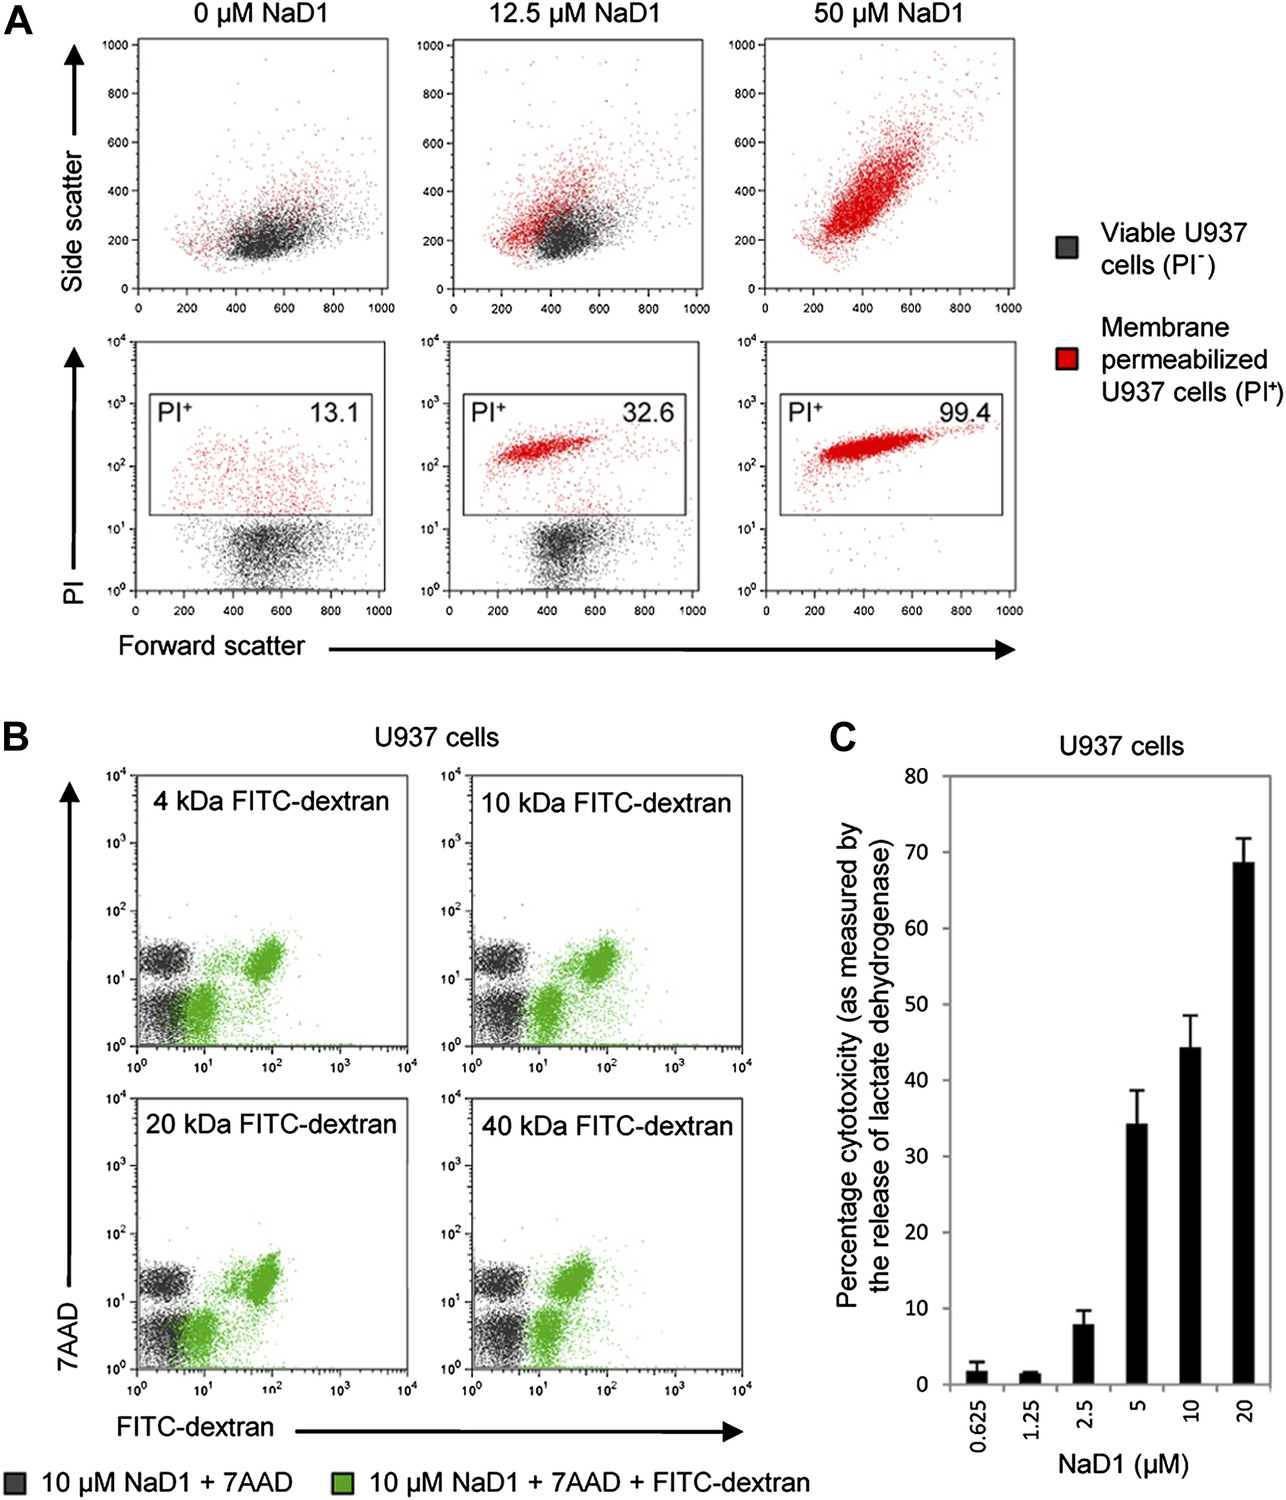
NaD1 kills mammalian tumor cells by membrane permeabilization.
(A) Forward scatter, side scatter, and PI uptake analysis of U937 cells treated with NaD1. (B) Binding of FITC-dextran and (C) LDH release by NaD1-treated U937 cells. Error bars in C indicate SEM (n = 3). Data in A–C are representative of at least two independent experiments.
Figure 7—figure supplement 1

NaD1 rapidly permeabilizes U937 cells.
Ability of NaD1 (0.5–20 μM) to mediate the release of ATP from U937 cells was examined using the ATP bioluminescence assay. The energy-dependency of the light-emitting luciferase-catalyzed oxidation of luciferin was used to indirectly measure the amount of ATP released by permeabilized cells over 30 min.
Figure 7—figure supplement 2
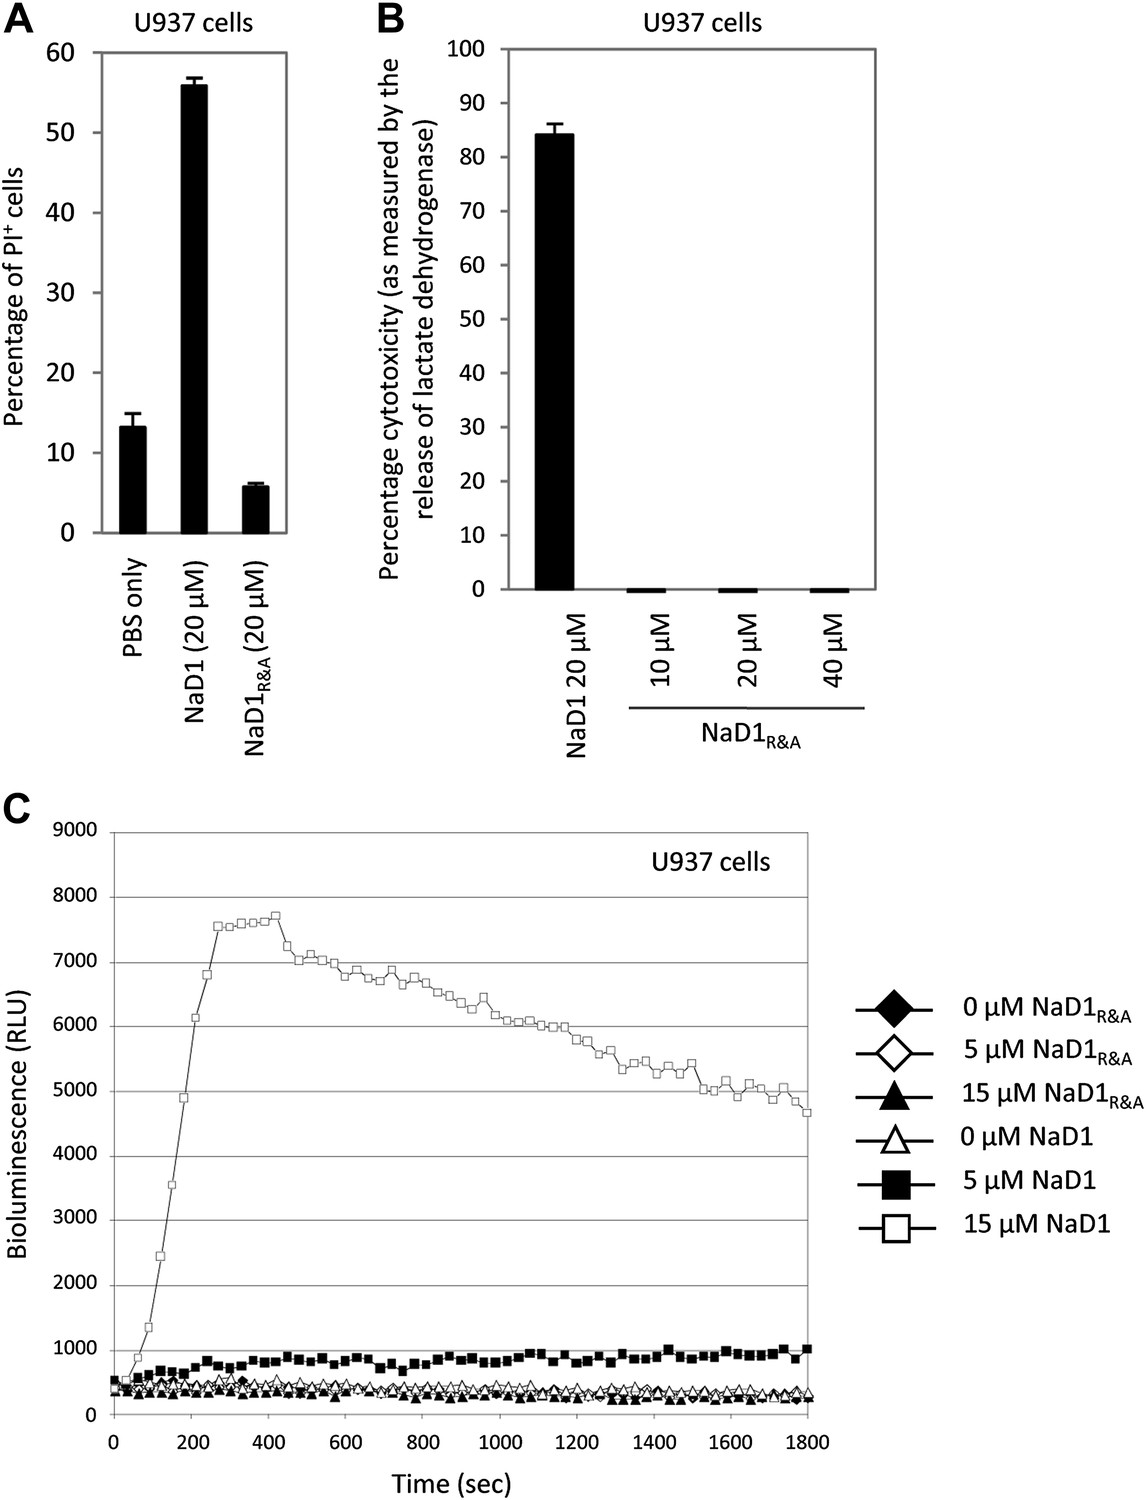
Reduced and alkylated NaD1 (NaD1R&A) does not permeabilize U937 cells.
Ability of NaD1R&A to permeabilize U937 cells was investigated using the (A) PI uptake, (B) LDH release, and (C) ATP bioluminescence assays, with native NaD1 being included as a positive control. Error bars in A and B indicate SEM (n = 3). Data in A–C are representative of at least two independent experiments.
Figure 7—figure supplement 3

Tumor/transformed cells are more susceptible to killing by NaD1 than normal/primary cells.
MTT cell viability assays were performed on the indicated cell lines. The IC50 values are shown as mean ± SD (n≥ 2).
Figure 8 with 2 supplements
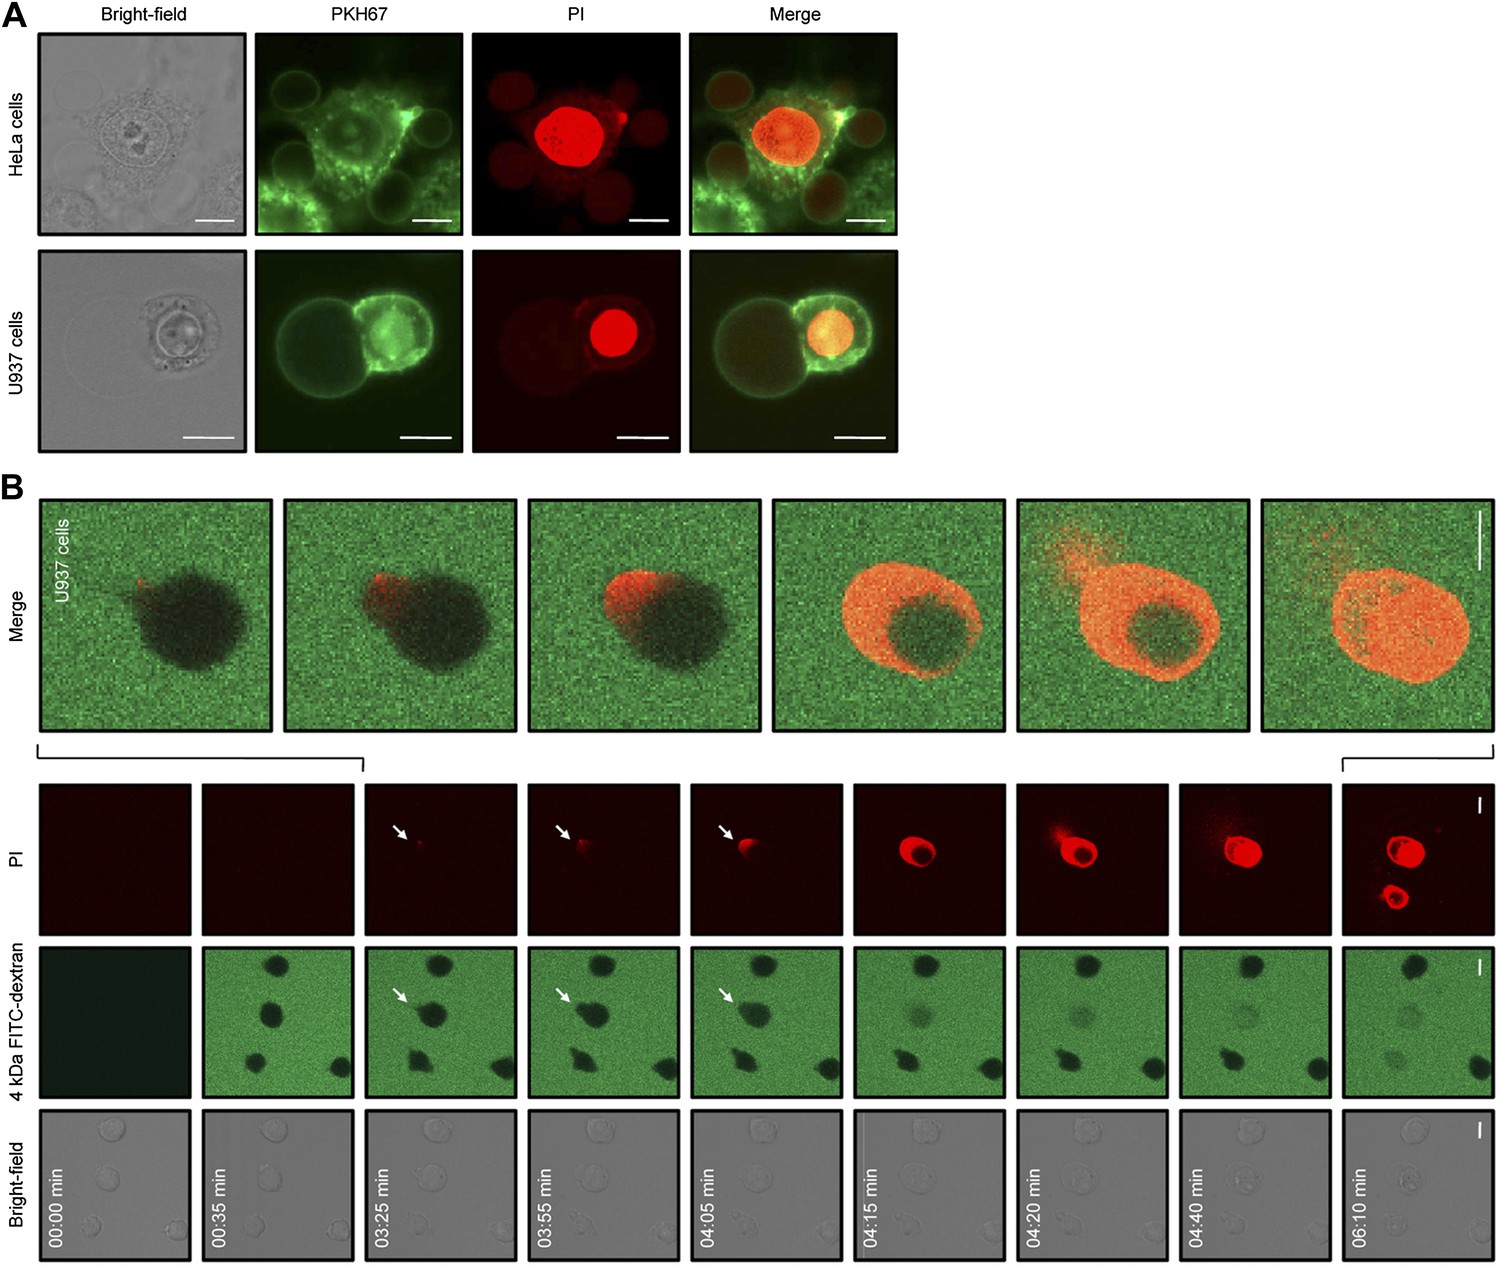
NaD1 induces membrane blebbing of tumor cells.
(A) CLSM of PKH67-stained NaD1 (10 μM) permeabilized HeLa and U937 cells. (B) CLSM of U937 cells treated with NaD1 (20 μM) in the presence of PI and 4 kDa FITC-dextran. Arrows indicate entry of PI. It should be noted that in this experiment the detector gain on the helium–neon laser (red channel) was increased compared to that used in A to enable visualization of the cell lysis events. Scale bars represent 10 μm. Data in A and B are representative of at least two independent experiments.
Figure 8—figure supplement 1
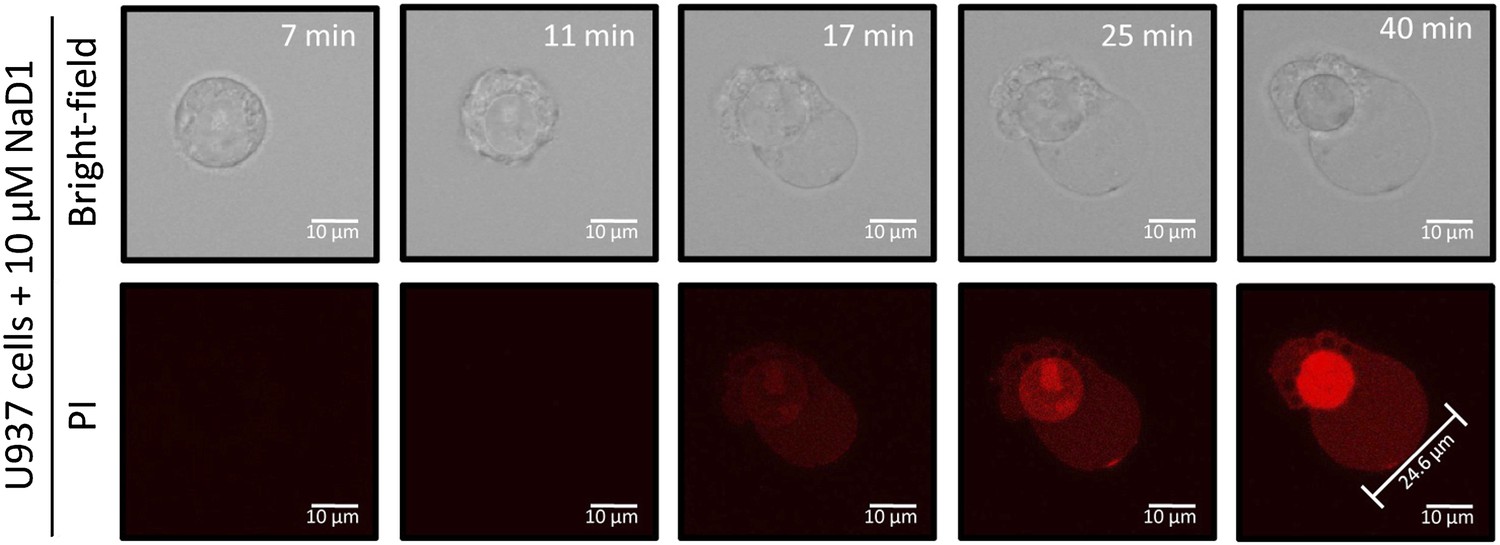
NaD1-induced membrane blebs do not retract once U937 cells are permeabilized.
Live confocal laser scanning microscopy (CLSM) of NaD1-treated U937 cells in the presence of PI. Cells were imaged over a period of 40 min, with NaD1 (10 μM) being added at 7 min.
Figure 8—figure supplement 2
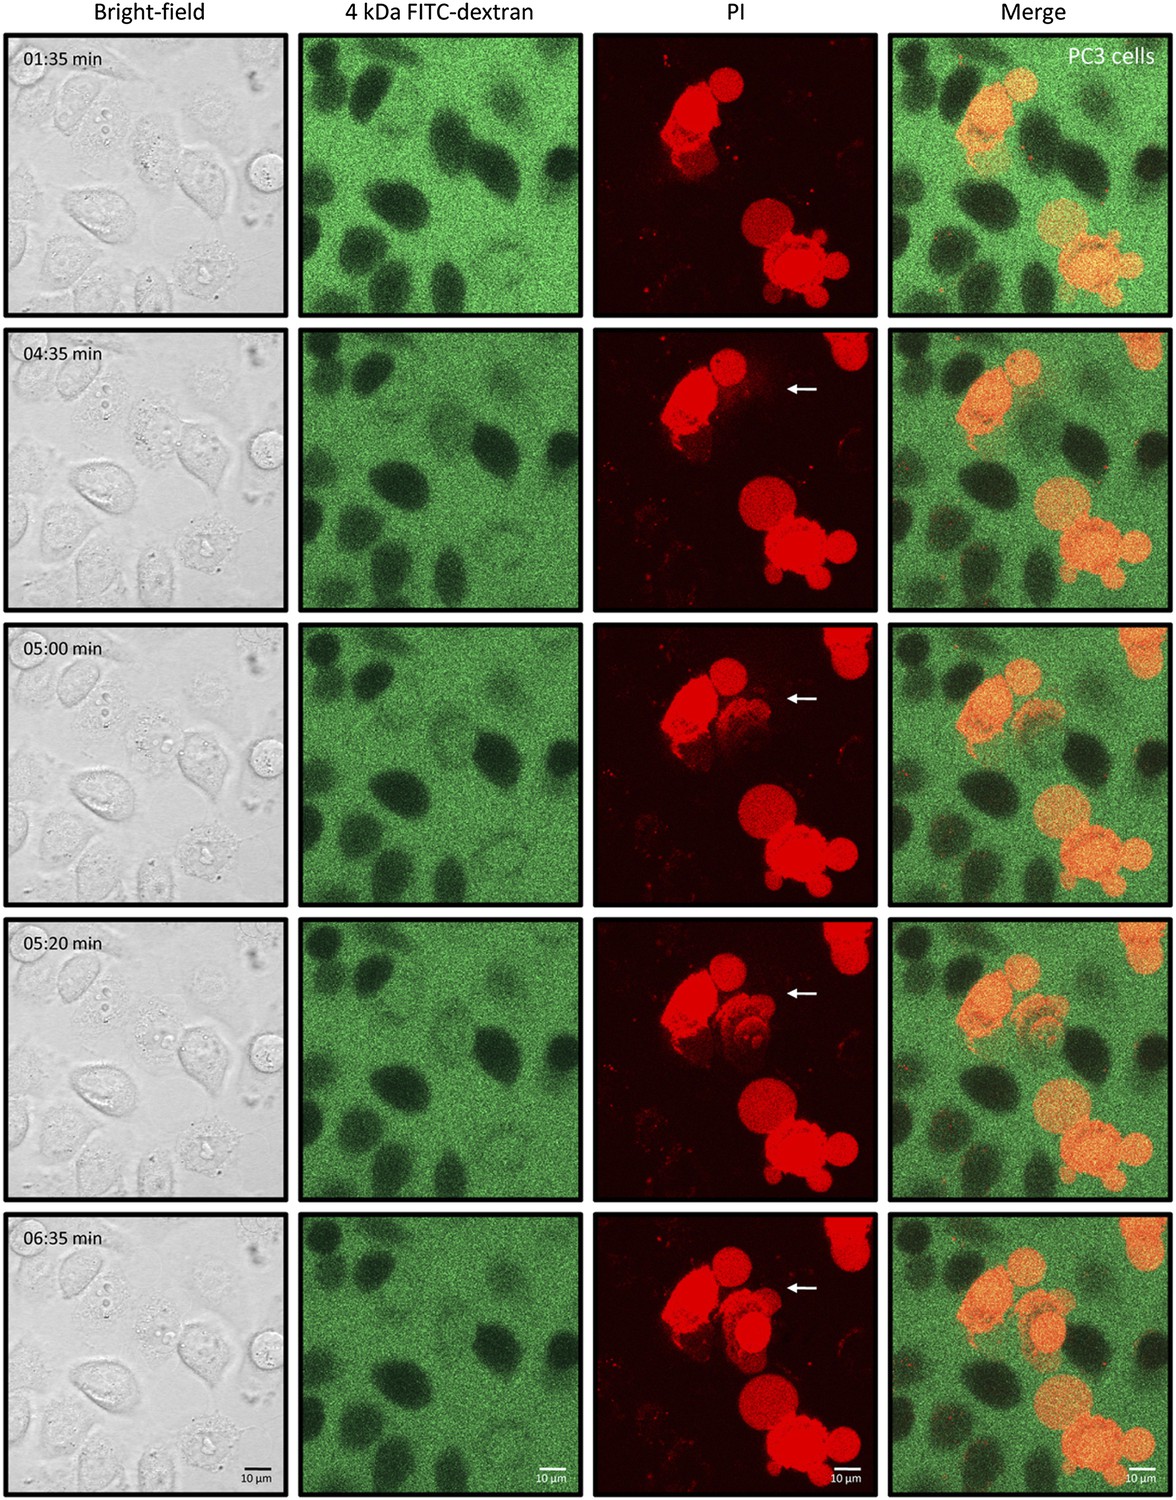
NaD1-mediated membrane permeabilization occurs at the blebs of PC3 cells.
Live CLSM of PC3 cells treated with NaD1 in the presence of PI and 4 kDa FITC-dextran. Cells were imaged over a period of 10 min (5 s/frame), with NaD1 (20 μM), and 4 kDa FITC-dextran (100 μg/ml) being added to cells at 30 s. It should be noted that individual PC3 cells show a variable rate of permeabilization by NaD1 reflecting a kinetic effect but eventually all cells are permeabilized under the experimental conditions.
Figure 9

Subcellular localisation of BODIPY-NaD1 in tumor cells.
(A) Detection of BODIPY-NaD1 binding to viable and permeabilized U937 cells by flow cytometry. (B) CLSM of subcellular localization of BODIPY-NaD1 (10 μM) on permeabilized U937, PC3, and HeLa cells. Scale bars represent 10 μm. Data in A and B are representative of at least two independent experiments.
Figure 10

Expression of GFP-PH(PLCδ) in HeLa cells significantly delays NaD1-mediated cell permeabilization compared with cells expressing free GFP.
(A) CLSM of NaD1 (10 μM) treated HeLa cells expressing GFP-PH(PLCδ). Scale bars represent 10 μm. (B) The average length of time taken for NaD1 (10 μM) to permeabilize (PI-positive) GFP-PH(PLCδ)-expressing vs free GFP-expressing HeLa cells were analyzed over a period of 15 min. For GFP-PH(PLCδ)-expressing cells, n = 21; for free GFP-expressing cells, n = 29. Error bars indicate SEM, * = p<0.005.
Figure 11
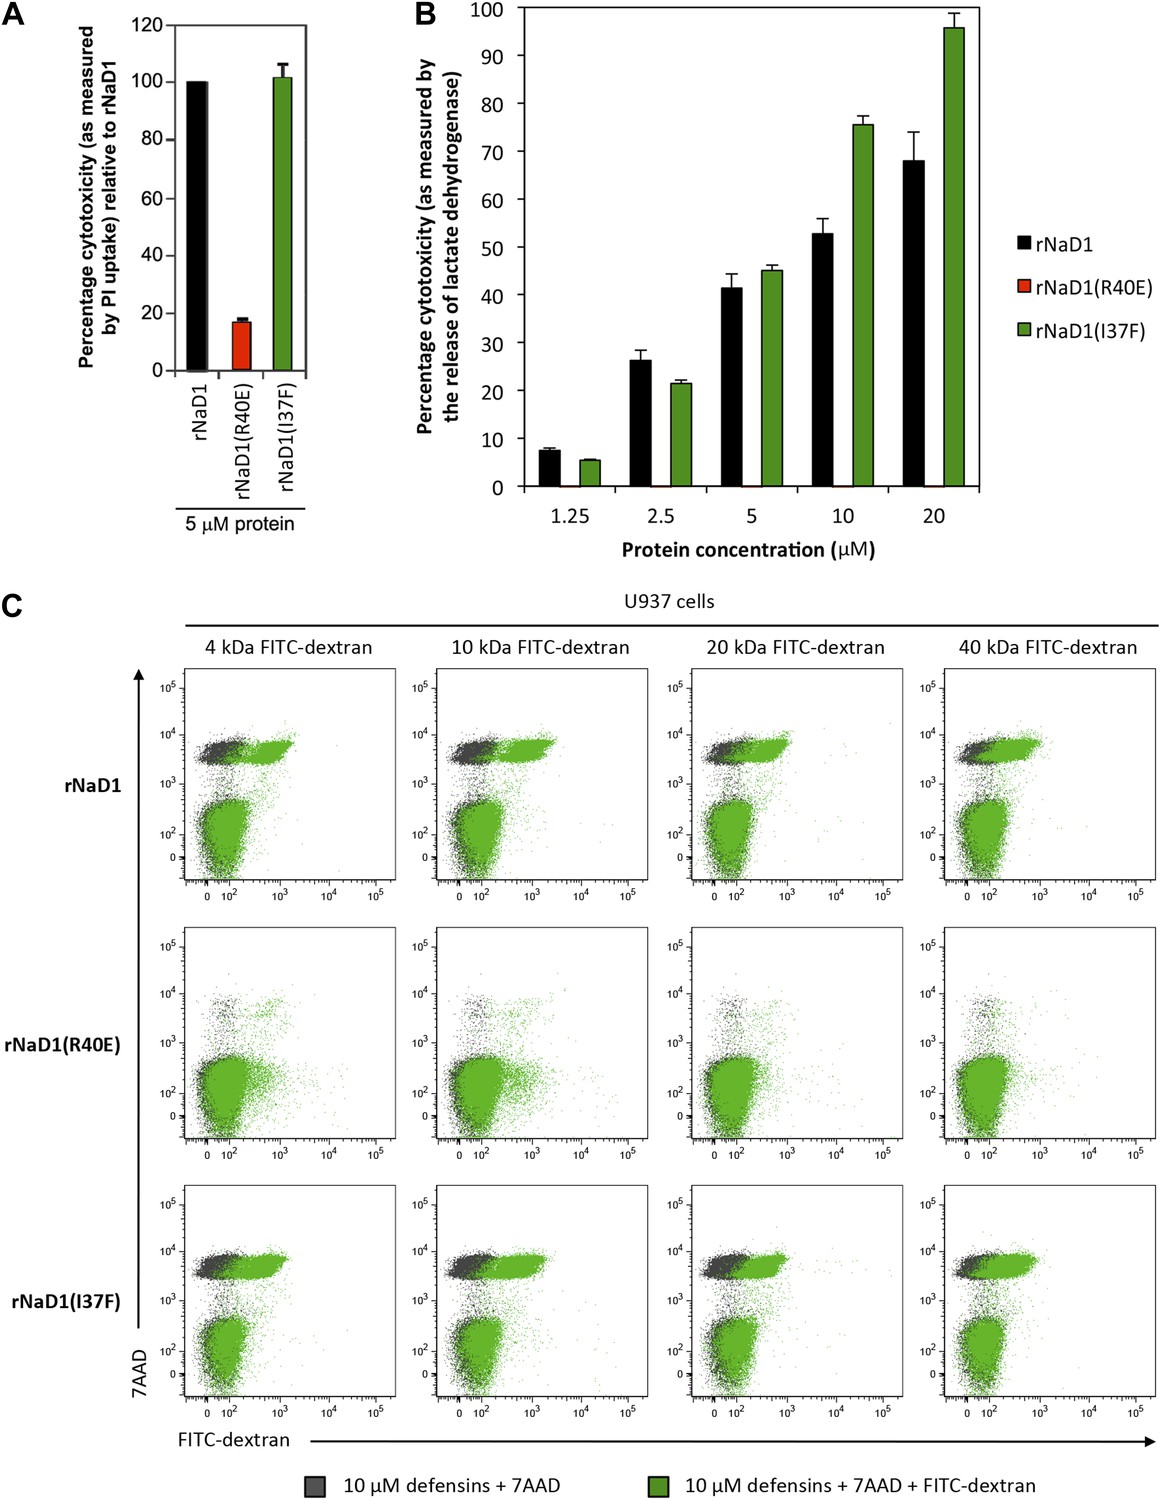
Permeabilization of U937 cells is impaired in rNaD1(R40E).
Ability of rNaD1, rNaD1(R40E) and rNaD1(I37F) to permeabilize U937 cells as assessed by (A) PI uptake, (B) LDH release, and (C) FITC-dextran binding assays. Error bars in A and B indicate SEM (n = 3). Data in A–C are representative of at least two independent experiments.
Figure 12
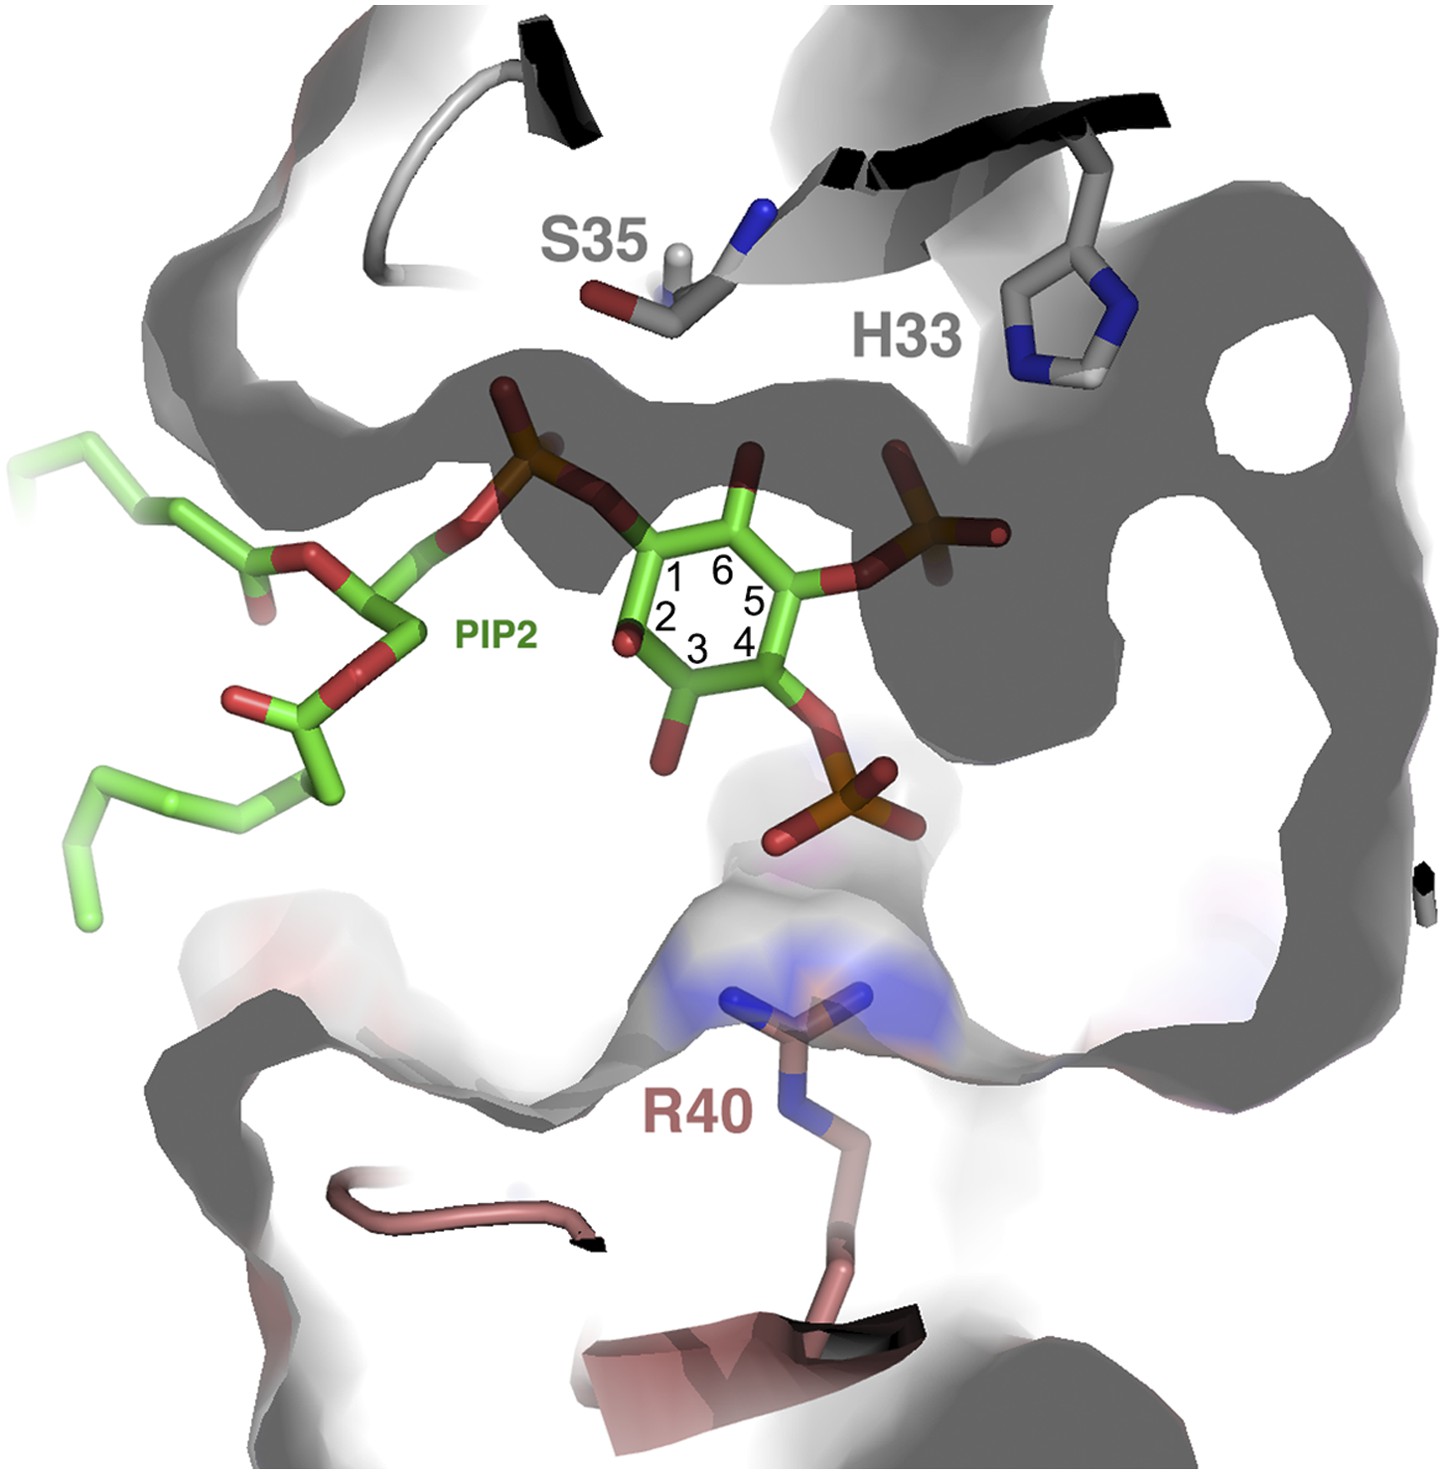
PIP2 fit into the NaD1 ‘cationic grip’.
Cut-away of PIP2 bound in the NaD1 cationic grip. NaD1 dimer surface is shown in gray, PIP2 in green and select NaD1 residues are shown as stick representation. NaD1 monomeric chains are colored in gray and salmon. Carbon atoms in the inositol ring are numbered (1–6).
Figure 13
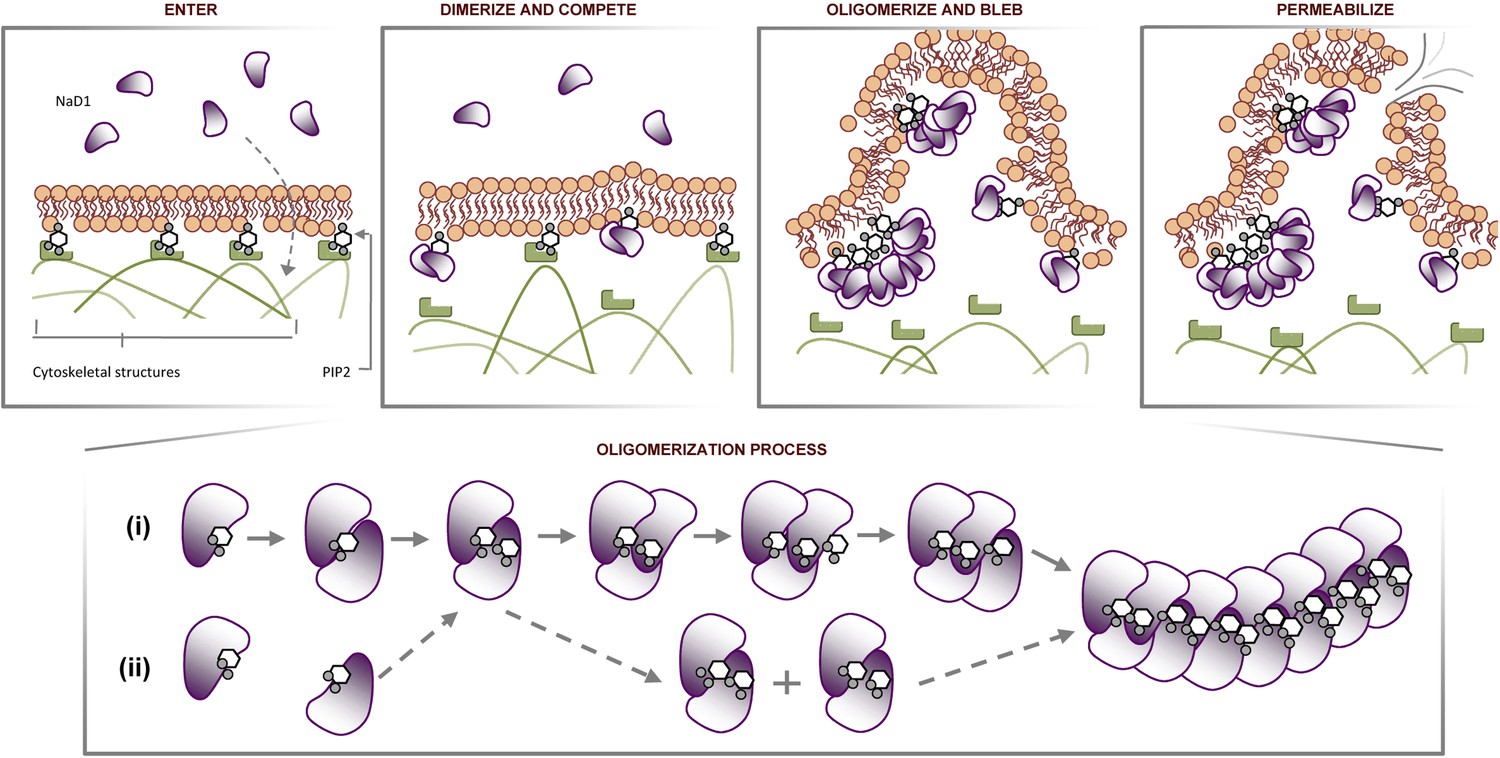
Proposed molecular mechanism of NaD1-mediated tumor cell lysis.
Schematic representation of NaD1-induced membrane blebbing and permeabilization. The assembly of NaD1:PIP2 oligomer can potentially be formed by (i) sequential recruitment of a NaD1 monomer followed by a PIP2 molecule or (ii) dimerization of two single NaD1:PIP2 complex followed by the recruitment of NaD1:PIP2 dimers.
Videos
Video 1
NaD1 rapidly induces membrane blebbing and permeabilization of HeLa cells.
Live CLSM of PKH67-stained HeLa cells in the presence of PI. Cells were imaged over a period of 10 min (5 s/frame), with NaD1 (10 μM) being added to cells at 1 min.
Video 2
Formation of a single large membrane bleb on a U937 cell following NaD1 treatment.
Three-dimensional reconstruction of CLSM images of a NaD1-treated (10 μM) PKH67-/PI-stained U937 cell.
Video 3
NaD1-mediated membrane permeabilization occurs at the blebs of U937 cells.
Live CLSM of U937 cells treated with NaD1 in the presence of PI and 4 kDa FITC-dextran. Cells were imaged over a period of 10 min (5 s/frame), with NaD1 (20 μM) and 4 kDa FITC-dextran (100 μg/ml) being added to cells at 30 s.
Video 4
BODIPY-NaD1 accumulates at the plasma membrane and certain intracellular organelles.
Three-dimensional reconstruction of CLSM images of BODIPY-NaD1-treated (10 μM) PI-stained PC3 cells.
Video 5
BODIPY-NaD1 accumulates at the plasma membrane and certain intracellular organelles.
Three-dimensional reconstruction of CLSM images of BODIPY-NaD1-treated (10 μM) PI-stained HeLa cells.
Video 6
Expression of GFP-PH(PLCδ) in HeLa cells delays NaD1-mediated cell permeabilization.
Live CLSM of GFP-PH(PLCδ) transfected HeLa cells treated with NaD1 in the presence of PI. Cells were imaged over a period of 15 min (5 s/frame), with NaD1 (10 μM) being added to cells at 30 s.
Video 7
Expression of free GFP in HeLa cells does not delay NaD1-mediated cell permeabilization.
Live CLSM of free GFP transfected HeLa cells treated with NaD1 in the presence of PI. Cells were imaged over a period of 20 min (5 s/frame), with NaD1 (10 μM) being added to cells at 30 s.
Tables
Table 1
Data collection and refinement statistics
| NaD1:PIP2 native | |
|---|---|
| Data collection | |
| Space group | C2221 |
| Cell dimensions | |
| a, b, c (Å) | 79.64, 132.04, 153.01 |
| α, β, γ (°) | 90.00, 90.00, 90.00 |
| Wavelength (Å) | 0.9537 |
| Resolution (Å)* | 40.84–1.6 (1.69–1.60) |
| Rsym or Rmerge* | 0.092 (0.617) |
| I/σI* | 11.6 (2.2) |
| Completeness (%)* | 99.7 (94.7) |
| Redundancy* | 6.7 (5.4) |
| Refinement | |
| Resolution (Å) | 40.37–1.6 |
| No. reflections | 105745 |
| Rwork/Rfree | 0.155/0.184 |
| No. atoms | |
| Protein | 10326 |
| Ligand/ion | 845 |
| Water | 816 |
| B-factors | |
| Protein | 21.5 |
| Ligand/ion | 28.9 |
| Water | 31.2 |
| R.m.s. deviations | |
| Bond lengths (Å) | 0.010 |
| Bond angles (°) | 1.651 |
-
*
Values in parentheses are for highest resolution shell.
Download links
A two-part list of links to download the article, or parts of the article, in various formats.
Downloads (link to download the article as PDF)
Open citations (links to open the citations from this article in various online reference manager services)
Cite this article (links to download the citations from this article in formats compatible with various reference manager tools)
Phosphoinositide-mediated oligomerization of a defensin induces cell lysis
eLife 3:e01808.
https://doi.org/10.7554/eLife.01808


