Single molecule FRET reveals pore size and opening mechanism of a mechano-sensitive ion channel
- University of Illinois at Urbana-Champaign, United States
- Victor Chang Cardiac Research Institute, Australia
- University of New South Wales, Australia
Figures
Figure 1
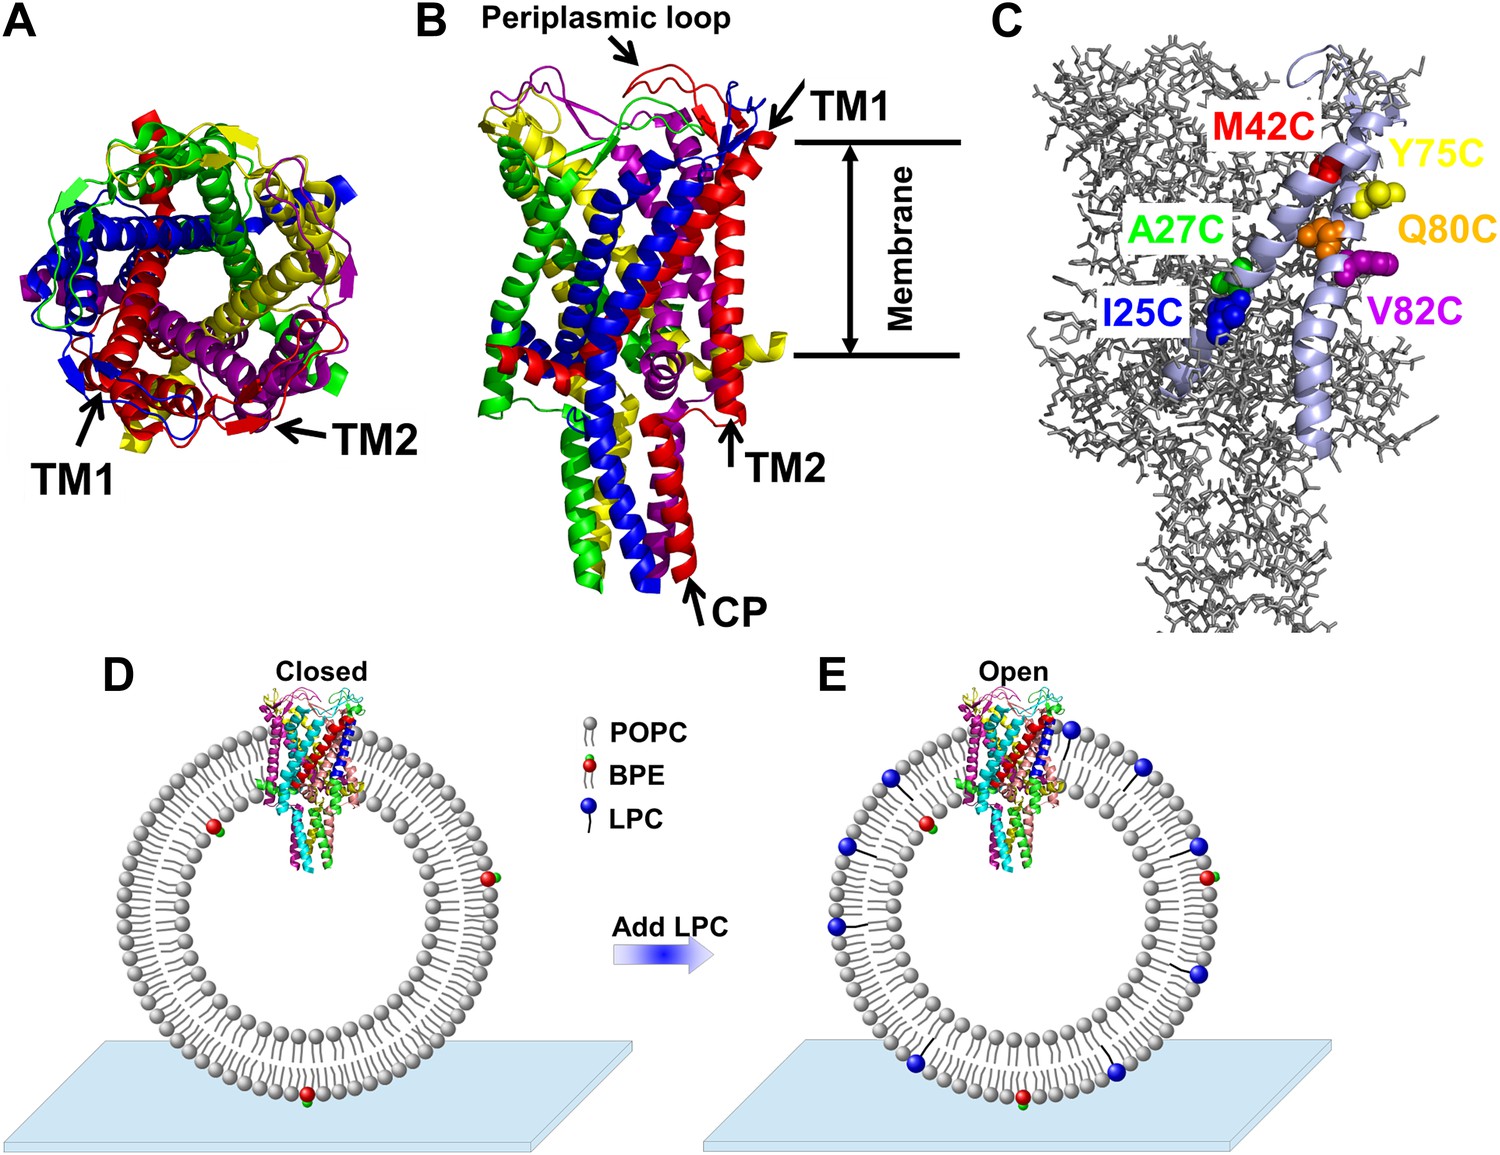
Cartoon representation of the structure of MscL in the closed conformation in the (A) top view and (B) side view (PDB ID: 2OAR [Chang et al., 1998; Steinbacher et al., 2007]), and scheme of single molecule FRET setup.
MscL is a homo-pentamer consisting of five identical subunits. Each subunit consists of one cytoplasmic α-helix (CP) and two transmembrane α-helices (TM1 and TM2), which extend through the cell membrane and are joined by a periplasmic loop (Chang et al., 1998). (C) Residues measured using smFRET. Three residues on each of the transmembrane helices (M42C, A27C and I25C on TM1; Y75C, Q80C and V82C on TM2) were chosen. Note that no residues on the CP were chosen because the complete deletion of the CP does not change the gating parameters substantially (Anishkin et al., 2003). (D) Labeled MscL proteins were reconstituted into liposomes, which were then immobilized on a coverslip and used for smFRET experiments. (E) The addition of LPC traps the protein in the open conformation (Perozo et al., 2002b).
Figure 2

The opening models for MscL.
The MscL opens from (A and B) the closed state, to (C and D) the open state via the barrel-stave model or (E and F) the open state via the helix-tilt model. The top figures (A, C, E) are top views and the bottom figures (B, D, F) are the side views. TM1 helices are shown in red while TM2 in blue. In the barrel-stave model (C and D), TM1 swings away from the pore center but TM2 remains stationary upon channel activation, generating an open pore lined by both TM1 and TM2 and the helices are more parallel to the membrane normal than the membrane plane. In the helix-tilt model (E and F), both TM1 and TM2 swing away from the symmetry axis and both helices tilt toward the plane of membrane.
Figure 3 with 3 supplements
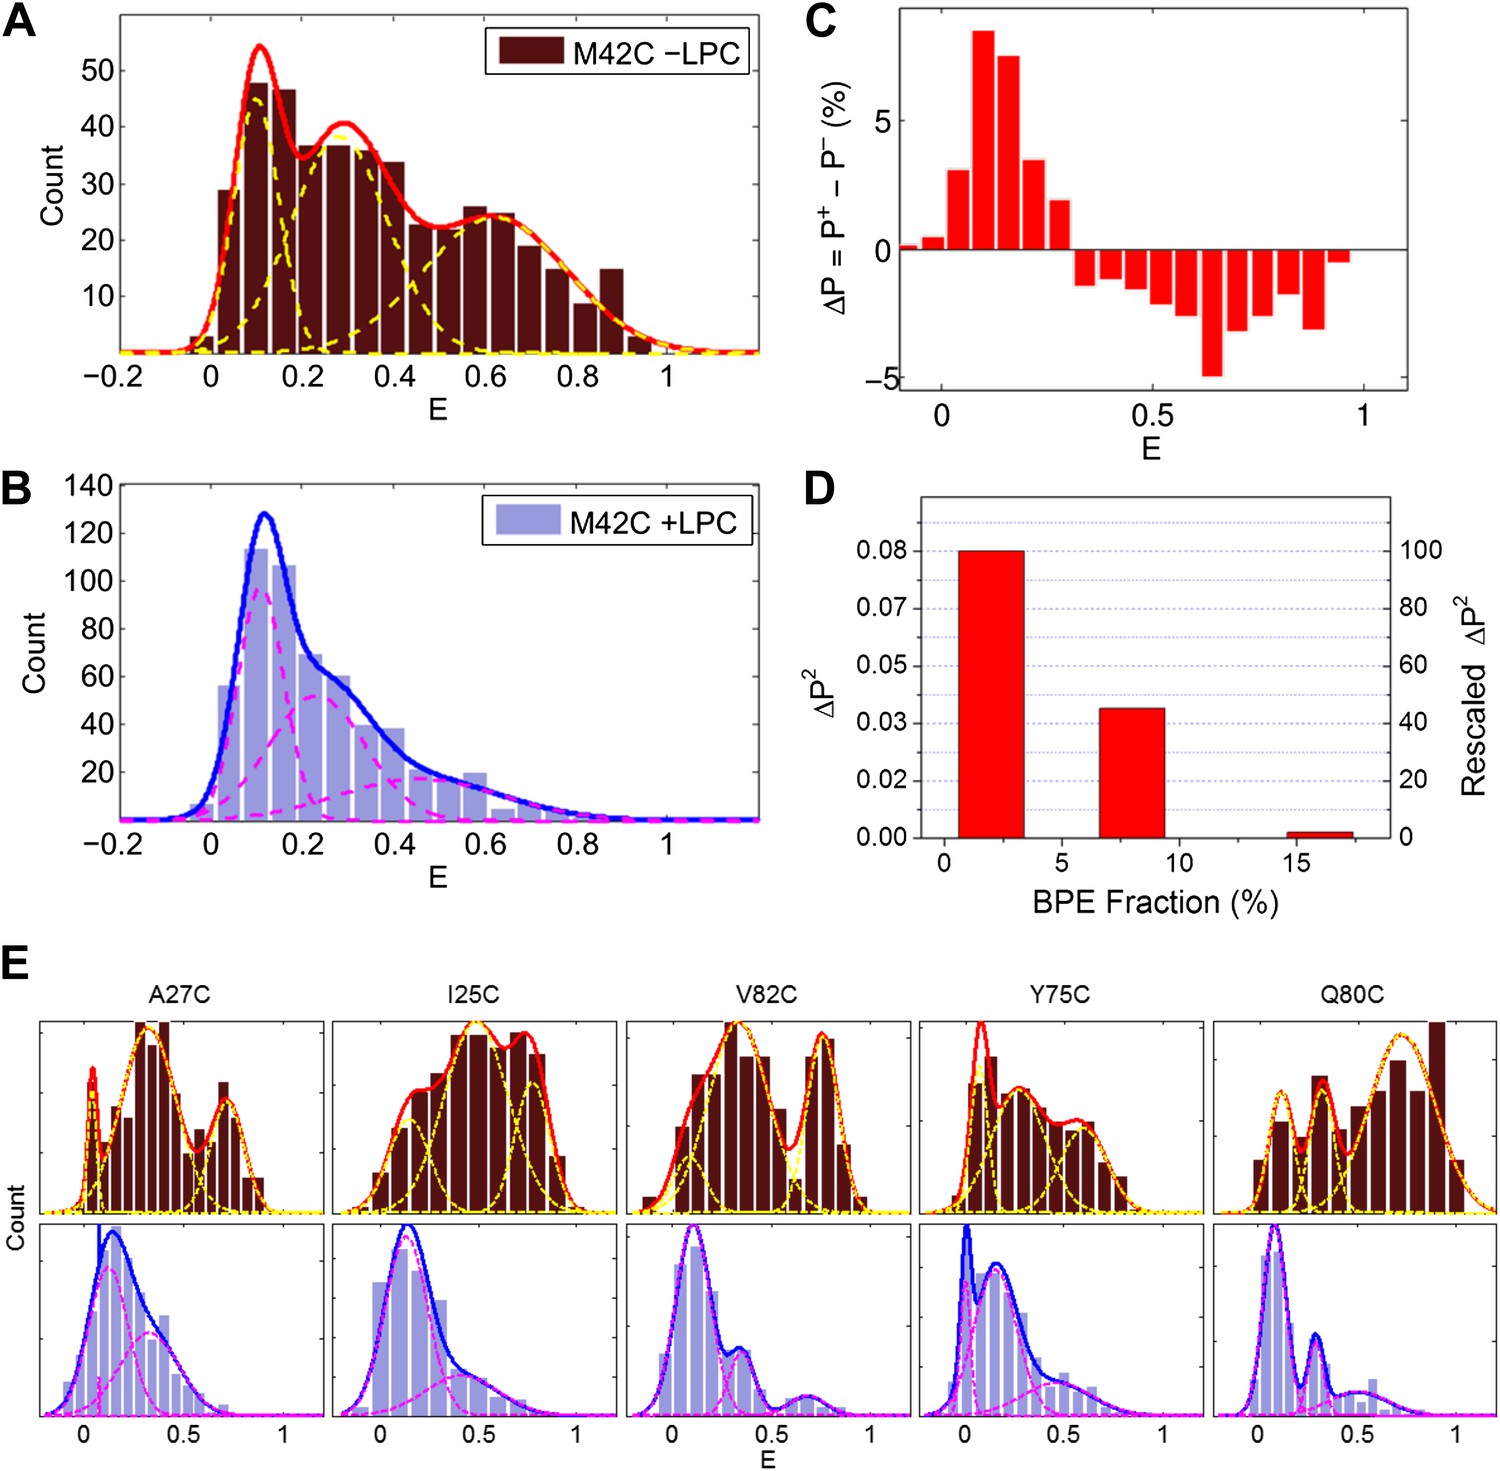
Single molecule FRET results for MscL M42C.
The distribution of FRET efficiency of M42C in the (A) absence and (B) presence of LPC were plotted and fitted with Gaussians. (C) The difference between the normalized FRET distributions under the two conditions (±LPC), ΔP, emphasizes the diminishing of the third peak at E ∼0.6 after adding LPC. (D) The variance between the normalized FRET distributions under the two conditions (±LPC), ΔP2, decreases as the fraction of BPE in the liposomes is increased from 2% to 16%. (E) Histograms of FRET efficiencies in the absence (top row, −LPC) and presence (bottom row, +LPC) of LPC for the other five residues (I25C, A27C, Y75C, Q80C, and V82C) measured in the current study.
Figure 3—figure supplement 1
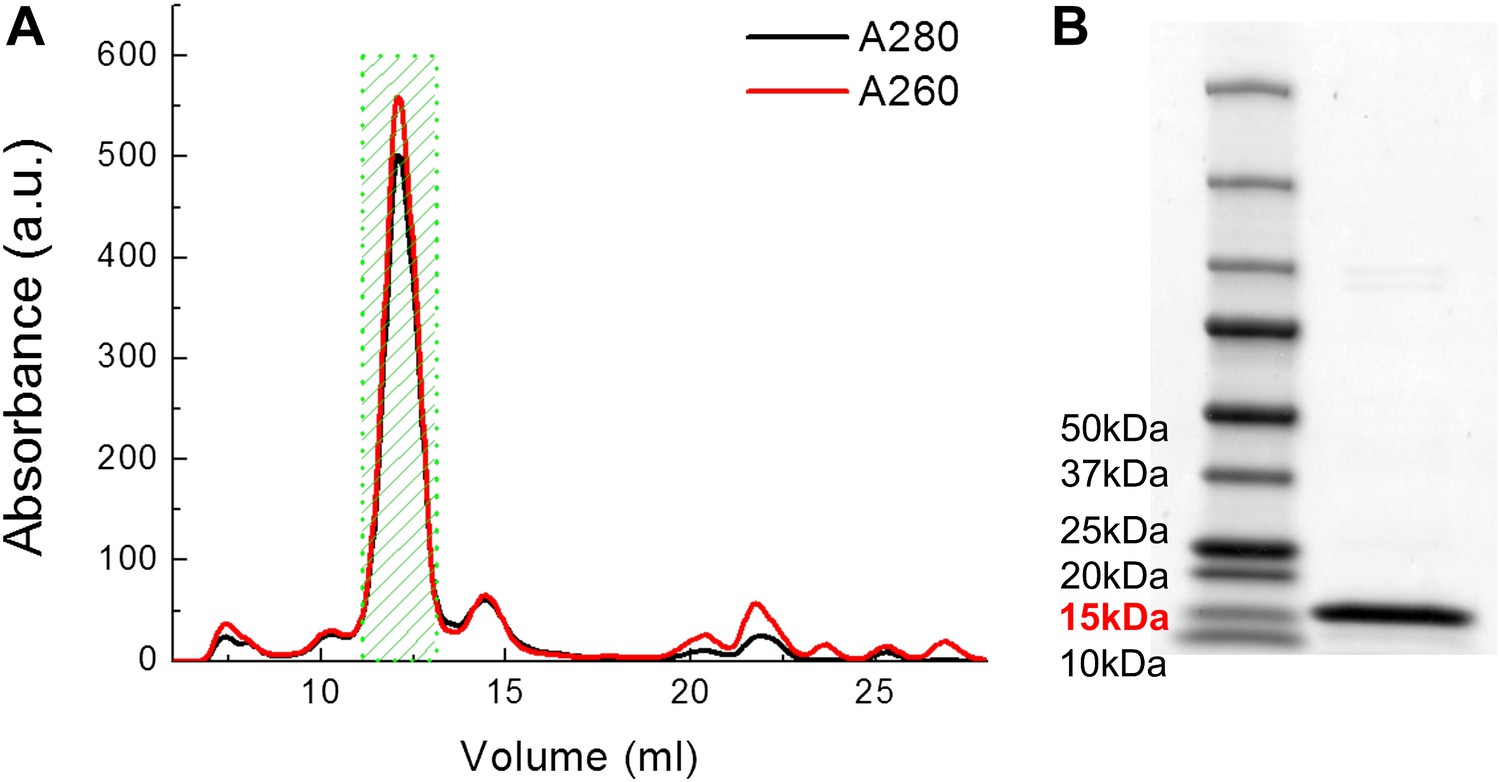
Examples of FPLC traces and SDS-PAGE gel for purification of MscL.
(A) Absorbance at 280 nm (black) and 260 nm (red) of MscL proteins are monitored during the running of FPLC. Fractions of 0.5 ml are collected and the fractions corresponding to MscL (green area, 2 ml) is used in the later experiments. (B) The purity of MscL after FPLC purification is estimated and verified by SDS-PAGE. The purity is in general >95% (in terms of mass). For this specific sample, the purity is ∼97% (2.3% for very faint bands at high molecular weight).
Figure 3—figure supplement 2
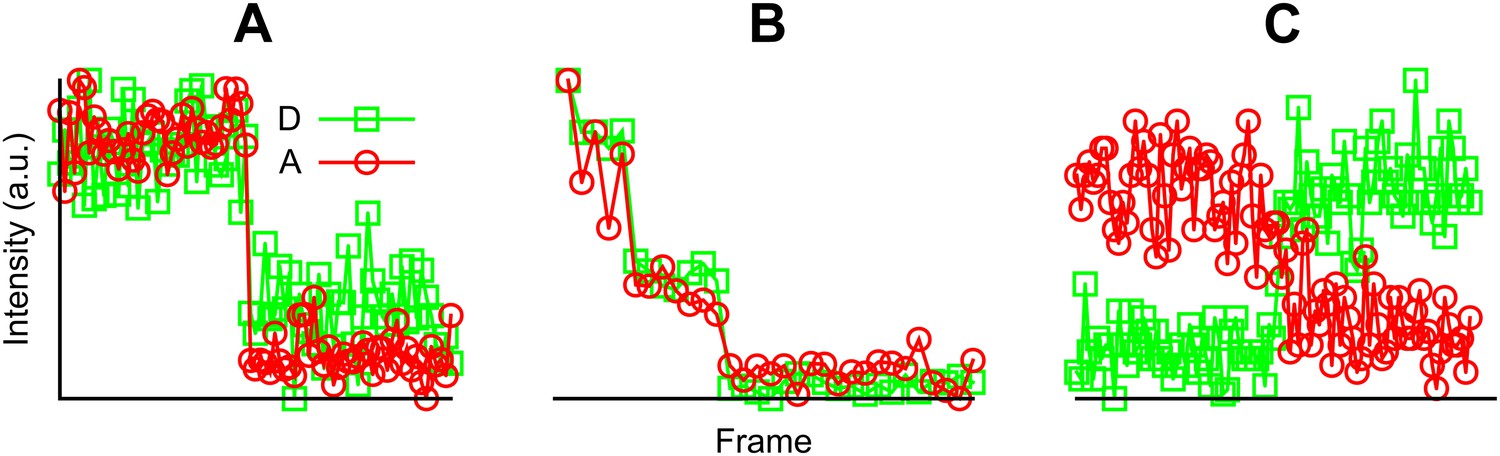
Examples of fluorescent intensity traces showing (A) a single photobleaching step, (B) multiple photobleaching steps, and (C) a single photobleaching step but the acceptor photobleached first.
https://doi.org/10.7554/eLife.01834.007
Figure 3—figure supplement 3
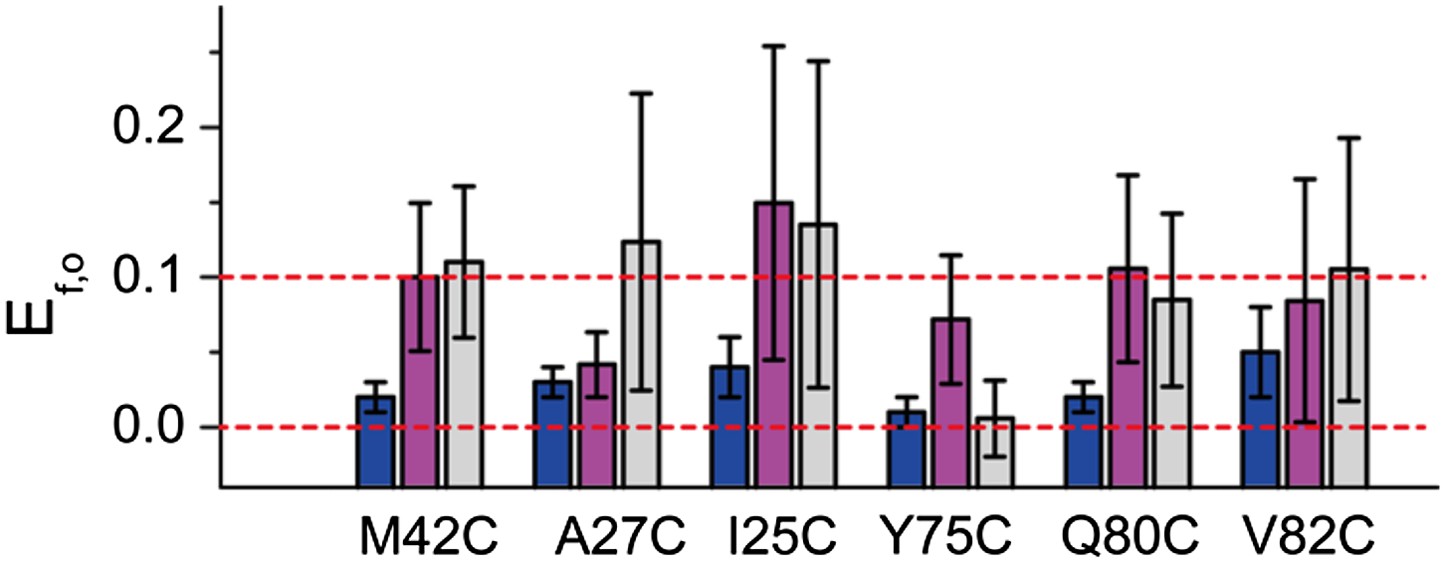
FRET efficiencies between non-neighboring subunits (Ef,o).
Ef,o is consistent and compatible with the final model. The final model satisfies Rn,o, from which Rf,o can be calculated based on geometry. The corresponding Ef,o are shown as blue bars. As a comparison, the measured Ef,o values (as well as errors) are shown as magenta and gray bars. Note that both samples before and after adding LPC give Ef,o (as–LPC sample is a mixture of closed and open states). The values from samples without LPC are shown in magenta while the values from samples with LPC are shown in gray. We found that the measured Ef,o values are consistent (within error) from samples without and with LPC. We also found that all mutants (except that M42C is slightly off) give Ef,o measurements compatible (within error) with the final model.
Figure 4 with 3 supplements

Movement of residues.
(A) Each residue (highlighted in green) defines a circumcircle (dashed red circle) of radius r (or diameter D, where D, as shown, is Dclosed, although upon opening would be Dopen), centered at the pore center (O). Upon channel activation, the protein expands (radius changes from rclose to ropen), or equivalently, the residue moves by Δr = ropen−rclose, measured from the pore center (O). (B) Sketch of MscL from closed state (blue pentagon) to open state (purple pentagon). The residue of interest (vertices of the pentagons) moves Δr from the pore center. (C and D) Translational movements (Δr) of residues on TM1 and TM2 measured via smFRET. All the residues move away from the pore center, arguing in favor of the helix-tilt model.
Figure 4—figure supplement 1

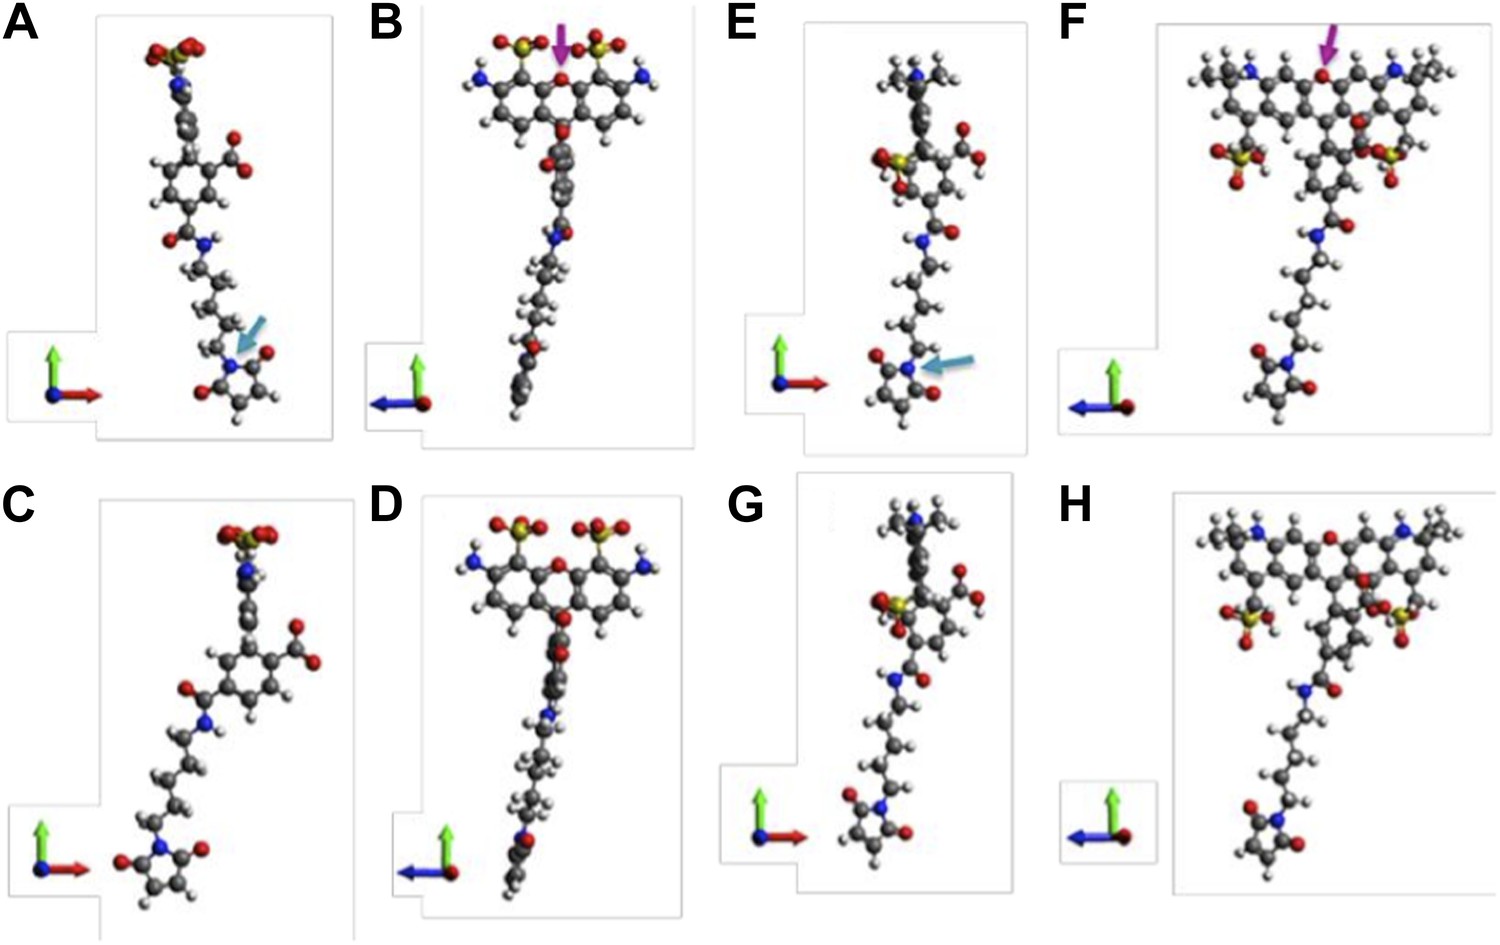
Molecular structures of fluorophores used in the experiments.
(A and B) 5′ isomer of Alexa Fluor 488 (donor); (C and D) 6′ isomer of Alexa Fluor 488 (donor); (E and F) 5′ isomer of Alexa Fluor 568 (acceptor); (G, H) 6′ isomer of Alexa Fluor 568 (acceptor). The donor is 17.1 Å (5′-isomer) or 16.3 Å (6′-isomer) while the acceptor is 17.4 Å (5′-isomer) or 17.4 Å (6′-isomer).
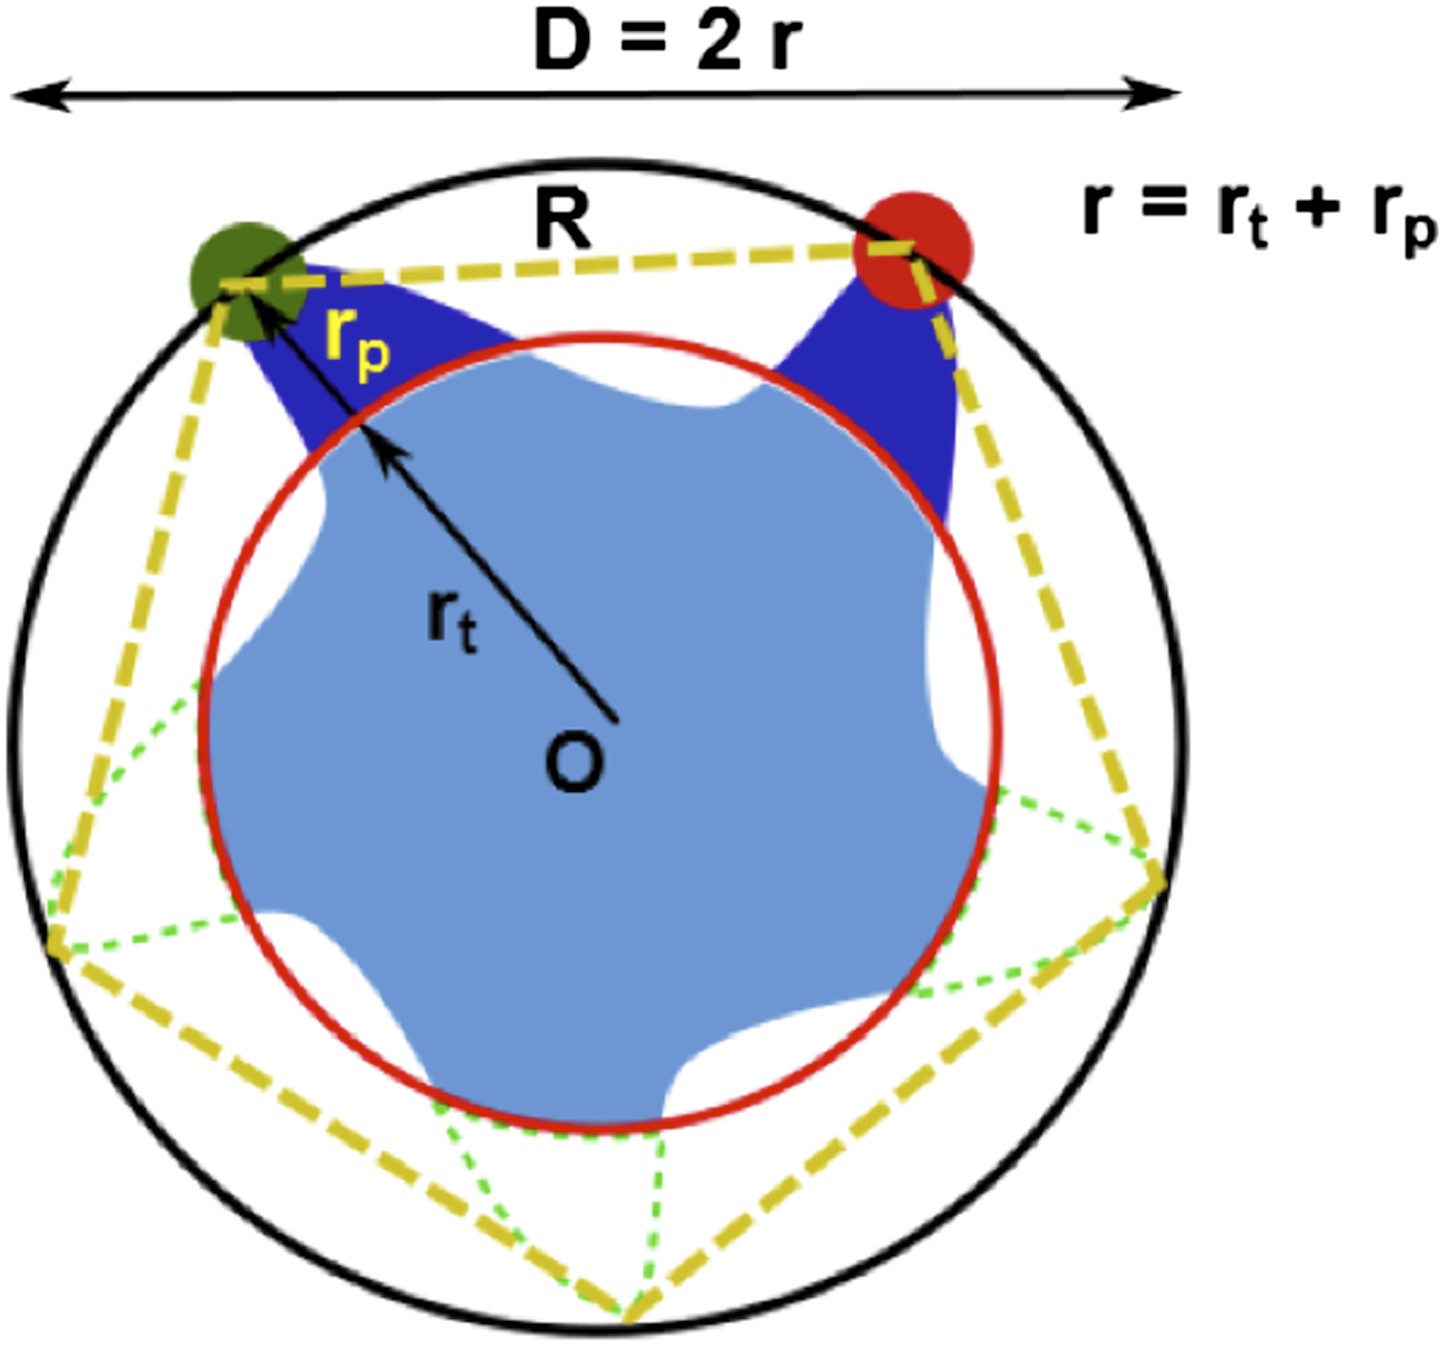
Figure 4—figure supplement 2
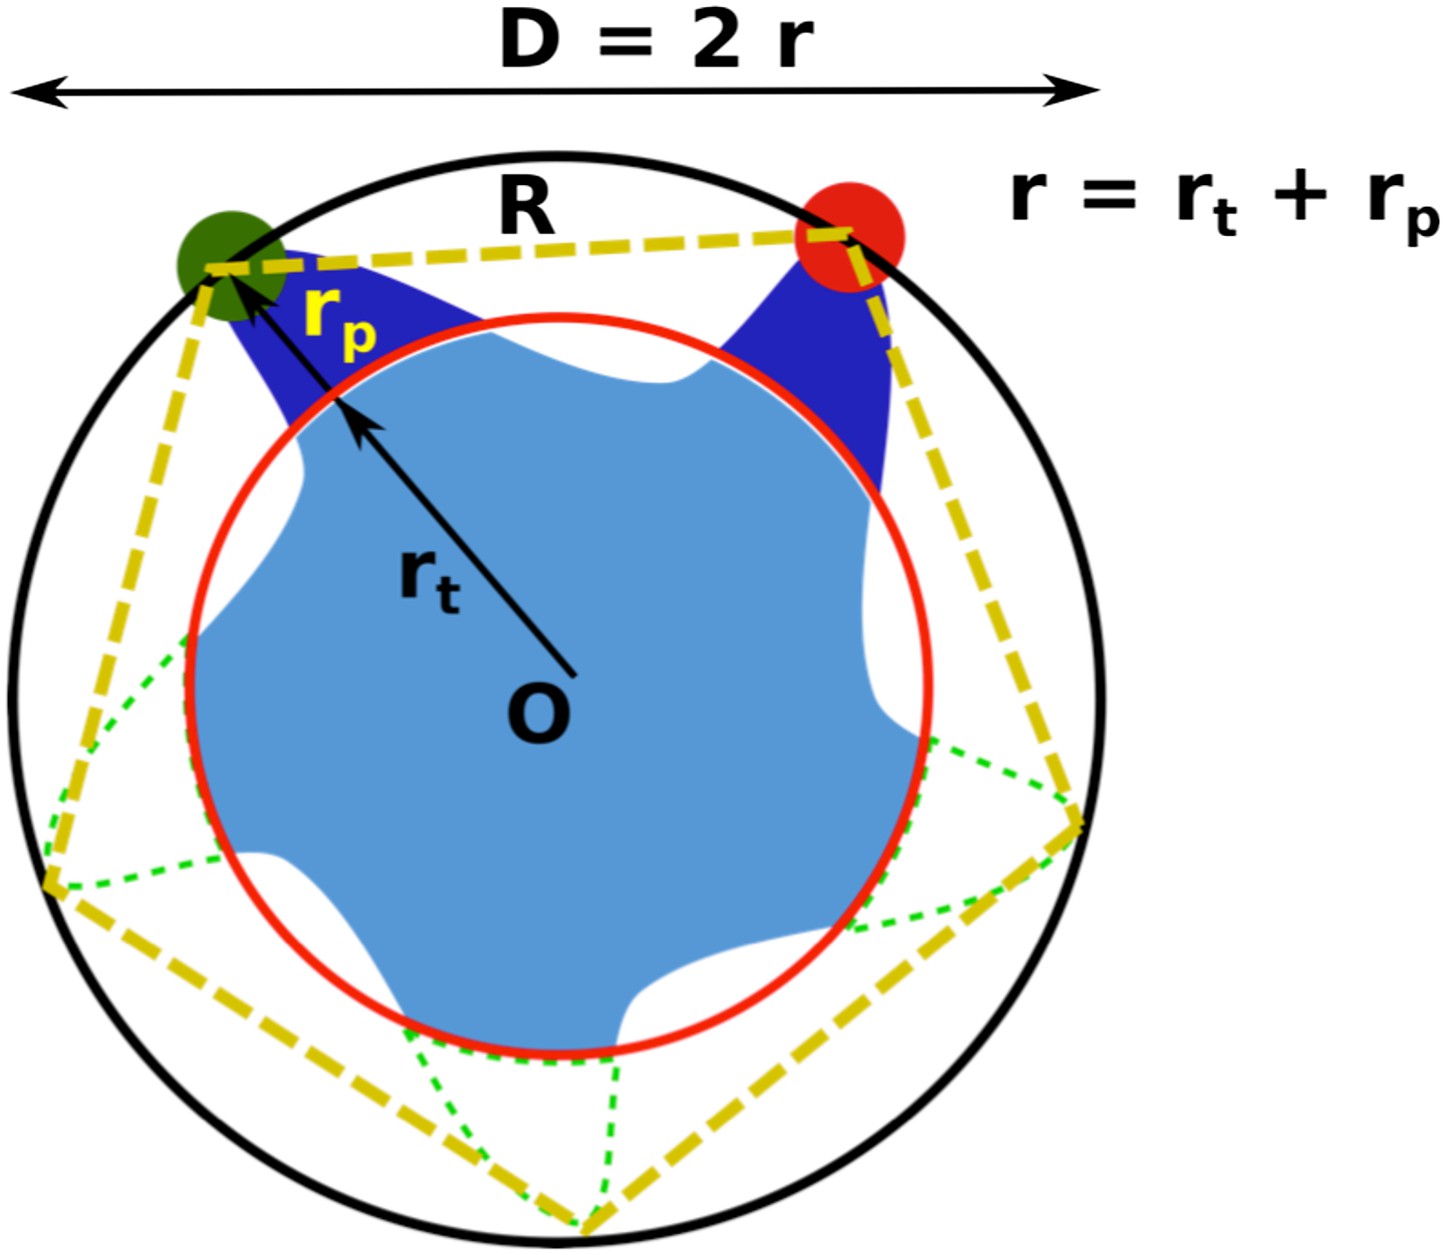
Geometric analysis of the distances of interest while taking into account the finite size of fluorescent probes and the breaking of fivefold symmetry of the protein due to attachment of probes.
https://doi.org/10.7554/eLife.01834.012
Figure 4—figure supplement 3
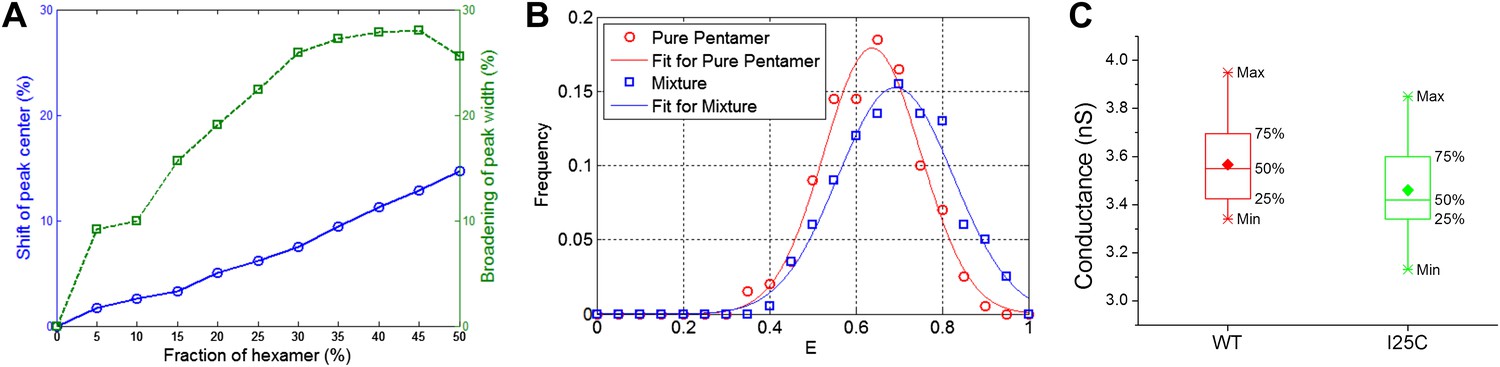
Effect of hexameric MscL in protein preparation.
(A) Effect of impurities on FRET peak (averaged over 100 simulations for each fraction of hexamers). (B) The peak broadening in a simulation for ∼30% hexamers as observed in Gandhi et al. (2011). (C) The conductance of wild-type EcoMscL (WT) and a mutant (I25C), agreeing with that of an EcoMscL pentamer.
Figure 5 with 1 supplement
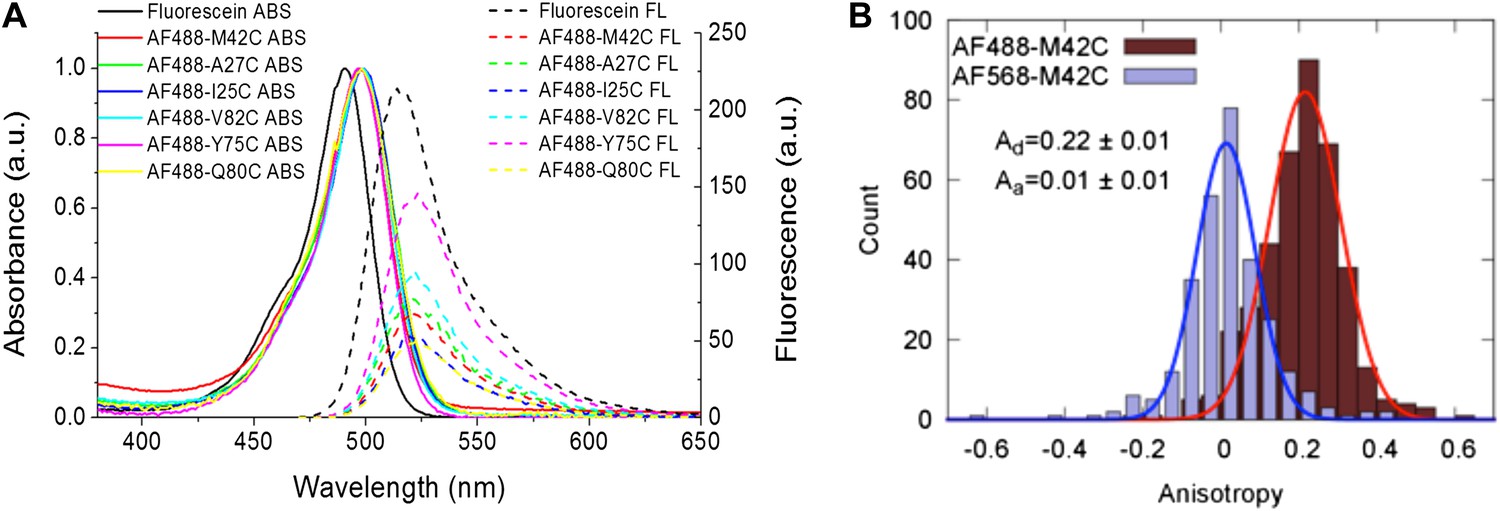
Measurement of R0.
(A) Absorbance and fluorescence spectra of AF488-MscL and fluorescein (as a standard), used to determine the quantum yield of AF488 conjugated to MscL mutants. (B) Anisotropy of AF488 and AF568 conjugated to MscL mutant (M42C), corrected for the intrinsic polarization properties of the microscope, and for the high numerical aperture of the objective.
Figure 5—figure supplement 1

Anisotropy of AF488 and AF568 conjugated to MscL mutants, corrected for the intrinsic polarization properties of the microscope, and for the high numerical aperture of the objective.
https://doi.org/10.7554/eLife.01834.015
Figure 6 with 1 supplement

Activation thresholds, Pa, of MscL mutants at the proximity of the narrowest pore constriction.
The activation thresholds were determined by electro-physiological recordings by patch-clamping without and with 10 mM DTT. Three recordings in the presence of DTT are shown as examples: (A) G22C, (B) I24C, and (C) I25C. (D) Comparison of the mutants with the wild type (WT) shows that the thresholds for mutants G22C and I24C are more than twice higher than the wild type, indicating the function of the channel was affected by the mutations. This was also observed via ensemble and single molecule FRET experiments. However, the mutation I25C does not affect the gating parameter substantially.
Figure 6—figure supplement 1

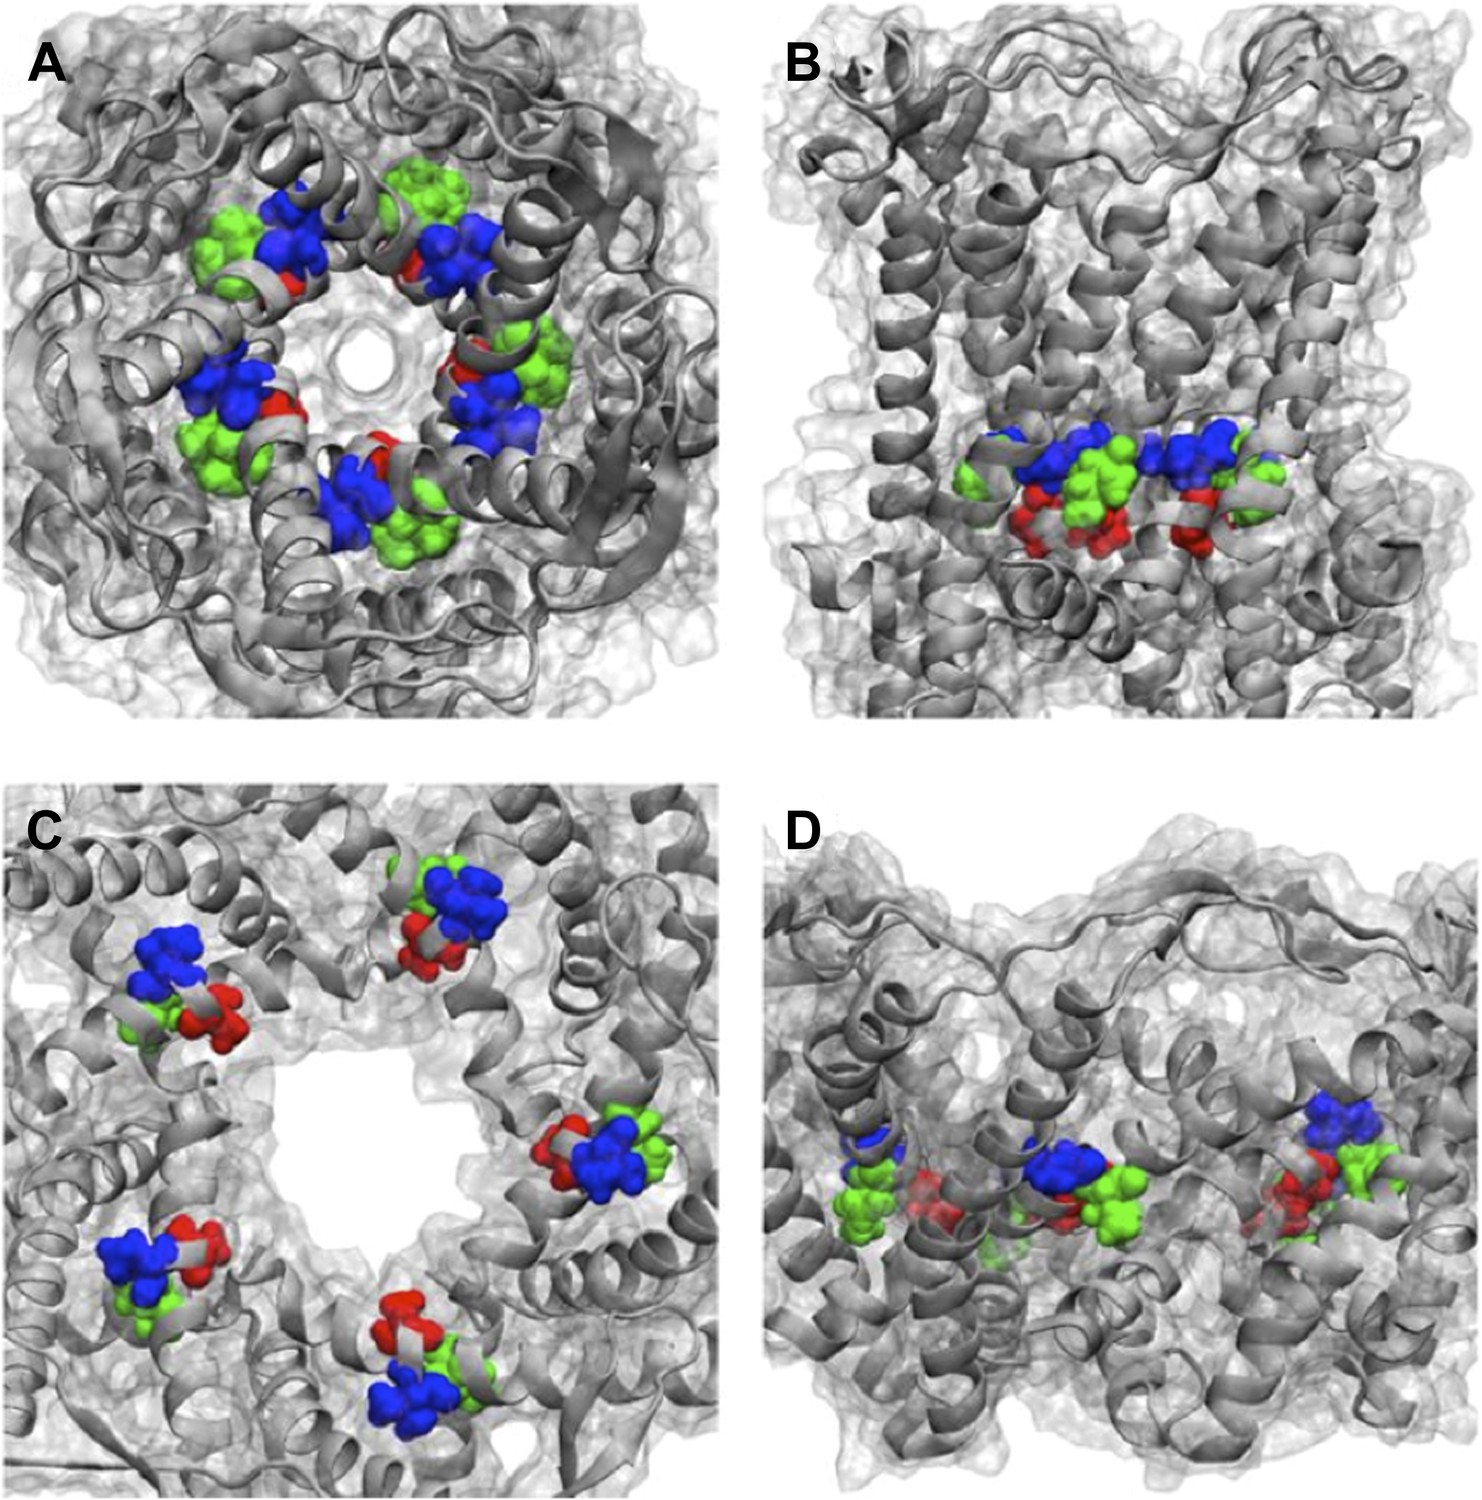
Positions of MtMscL mutants at the proximity of the narrowest pore constriction.
(A) Top view and (B) side view of the close state as seen in the crystal structure. (C) Top view and (D) side view of the open state modeled from smFRET measurement. Three residue are shown: A20 (red), V22 (blue), and I23 (green), which are equivalent to G22, I24, and I25, respectively, in E coli MscL. A20 and V22 are closer to the pore than I23. I23 is the only one among then that is facing outward from the channel axis and is accessible from the periphery of the protein.
Figure 7 with 2 supplements
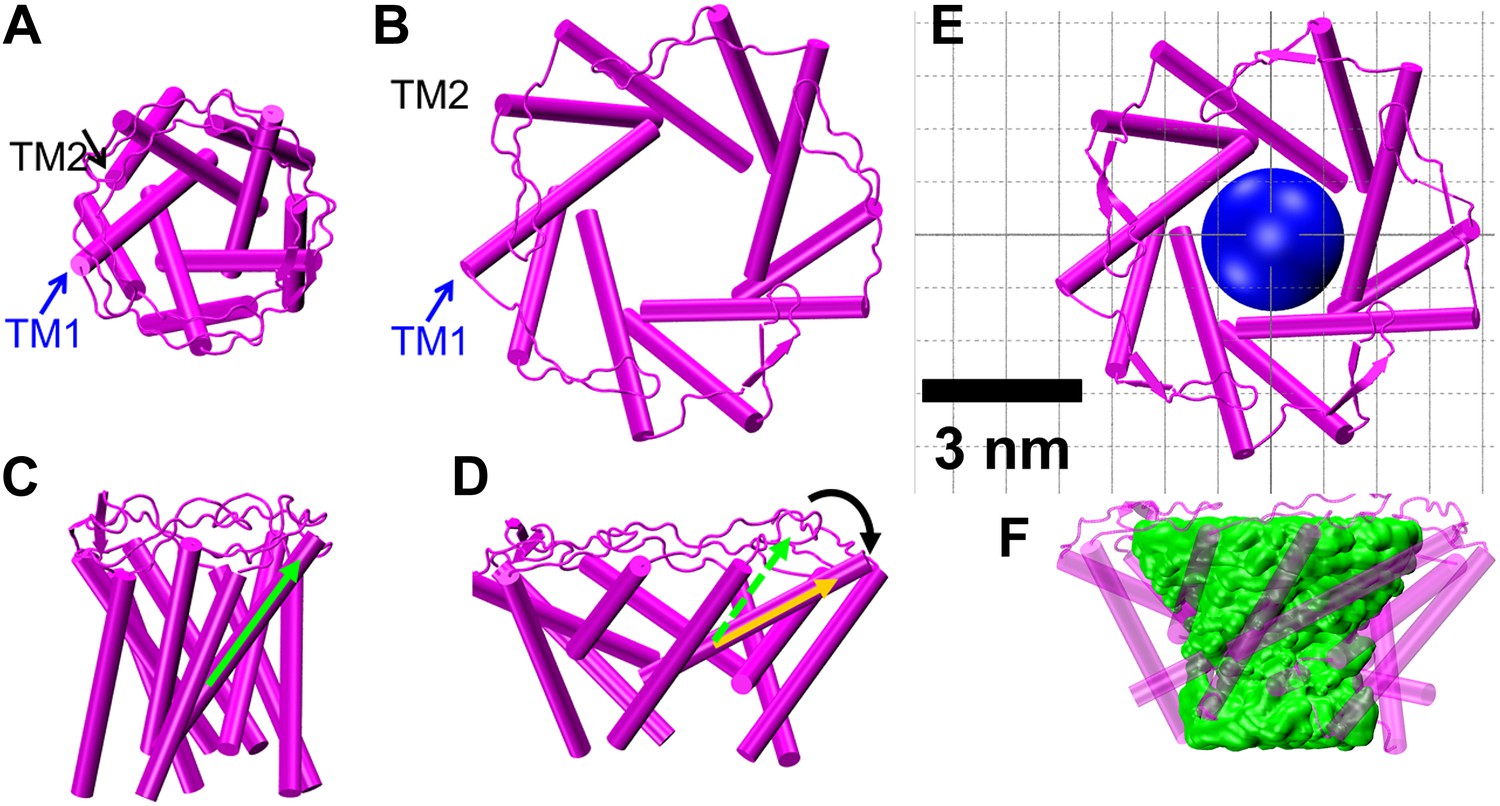
Model of the MscL structure in the open conformation.
(A and C) The crystal structure of MscL in the closed state is shown for comparison (PDB: 2OAR [Chang et al., 1998; Steinbacher et al., 2007]). (B and D) The structure of MscL in the open state (Source Code 1 and 2) was developed based on the smFRET measurements, satisfying all the distance constraints measured from smFRET experiments. In the open conformation, the pore is mainly lined by TM1 (indicated by blue arrows), consistent with the helix-tilt model. In addition, both TM1 and TM2 tilt toward the membrane plane (horizontal) upon channel activation, which is emphasized by the green and yellow arrows in the side views. The green arrows show the orientation of TM1 in the closed state while the yellow arrow indicated the orientation of TM1 in the open state. The angle between the two arrows is 27°. (E) A sphere with a diameter of 2.7 nm (blue) is shown in the MscL channel in the top view. (F) The surfaces of water molecules (green) inside the tunnel of MscL (magenta) are drawn and the narrowest constriction is ∼2.7–2.8 nm.
Figure 7—figure supplement 1

Developing a model for the open structure of MscL by inserting virtual springs.
For each measured residue (highlighted in green), 10 springs were inserted: five springs between identical residues from adjacent monomers (red) and five between residues from non-adjacent monomers (yellow). The equilibrium lengths of the springs are based on the smFRET measurements.
Figure 7—figure supplement 2
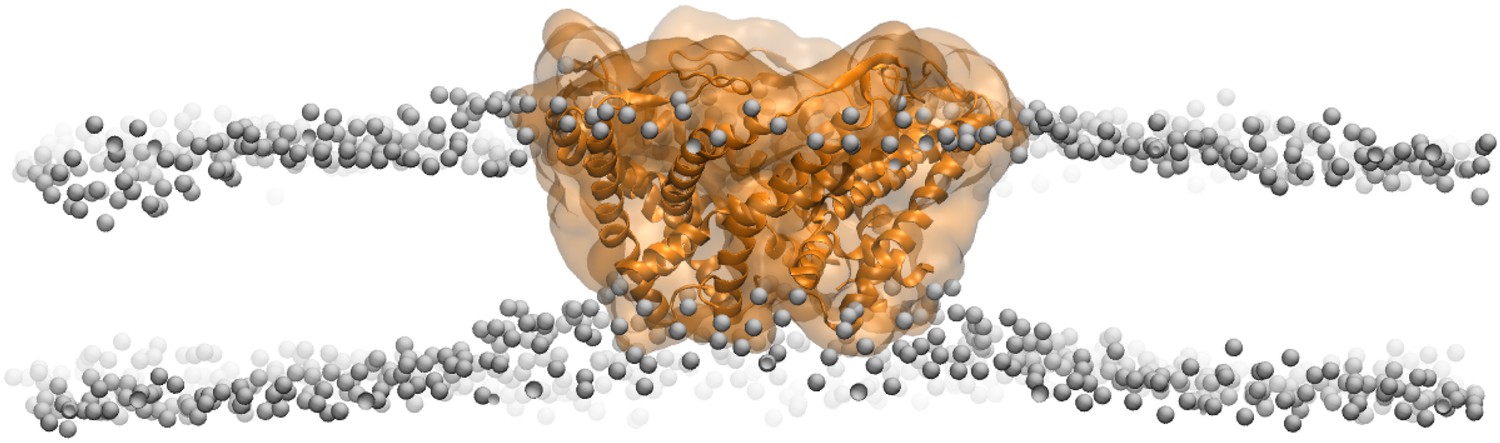
Side views of MscL open model (orange) in the POPC lipid bilayers.
For clarity purpose, the POPC bilayer is described only by phosphorus atoms displayed as glossy gray van der Waals spheres. A thinning membrane was observed near the channel when lipids try to match the flatting MscL in the open state.
Author response image 1
Geometric analysis of the distances of interest.
Author response image 2

Molecular structures of fluorescent probes used in the smFRET experiments. (A, B) Alexa Fluor 488; (C, D) Alexa Fluor 568.
Author response image 3
Molecular structures of fluorophores used in the experiments. (A, B) 5’ isomer of Alexa Fluor 488; (C, D) 6’ isomer of Alexa Fluor 488; (E, F) 5’ isomer of Alexa Fluor 568; (G, H) 6’ isomer of Alexa Fluor 568.
Author response image 4
Positions of MtMscL mutants at the proximity of the narrowest pore constriction. (A) Top view and (B) side view of the close state as seen in the crystal structure. (C) Top view and (D) side view of the open state modeled from smFRET measurement. Three residue are shown: A20 (red), V22 (blue), and I23 (green), which are equivalent to G22, I24, and I25, respectively, in E coli MscL. A20 and V22 are closer to the pore than I23. I23 is the only one among then that is facing outward from the channel axis and is accessible from the periphery of the protein.
Tables
Table 1
The best model of the fittings of FRET efficiency distribution were determined by calculating the corrected Akaike information criterion and Bayesian information criterion: , where LM is the maximum likelihood by the model, k the number of parameters of the model, N the number of datapoints used in the fit (Akaike, 1974; Schwarz, 1978; Sugiura, 1978)
| # of fitting peaks | − ln LM | AICc | BIC |
|---|---|---|---|
| M42C; No LPC | |||
| 1 | −1.9 | 0.3 | 8.4 |
| 2 | −43.4 | −76.6 | −56.4 |
| 3 | −56.4 | −96.4 | −64.3 |
| 4 | −58.1 | −93.5 | −49.5 |
| M42C; With LPC | |||
| 1 | −190.9 | −377.9 | −369.2 |
| 2 | −279.5 | −549.0 | −527.3 |
| 3 | −290.7 | −565.1 | −530.5 |
| 4 | −292.7 | −563.0 | −515.5 |
-
The lowest AICc and BIC values give the best fitting model: three peaks (bold values).
Table 2
Measurements of smFRET experiments
| Residue | Helix | Qd | Ad | Aa | R0 (nm) | Enc | Eno | ΔRn (nm) | Δr (nm) | ΔD (nm) |
|---|---|---|---|---|---|---|---|---|---|---|
| 42 | TM1 | 0.33 | 0.22 | 0.01 | 5.5+0.4−0.3 | 0.63 | 0.23 | 1.7+0.7−0.5 | 1.4+0.6−0.4 | 2.8+1.1−0.8 |
| 27 | TM1 | 0.28 | 0.12 | 0.09 | 5.3+0.4−0.3 | 0.72 | 0.33 | 1.5+0.6−0.4 | 1.3+0.5−0.3 | 2.5+0.9−0.6 |
| 25 | TM1 | 0.42 | 0.19 | 0.06 | 5.7+0.5−0.4 | 0.78 | 0.42 | 1.4+0.6−0.5 | 1.2+0.6−0.4 | 2.4+1.1−0.8 |
| 75 | TM2 | 0.62 | 0.19 | 0.11 | 5.6+0.6−0.5 | 0.60 | 0.16 | 2.4+1.0−0.7 | 2.0+0.8−0.6 | 4.0+1.6−1.2 |
| 80 | TM2 | 0.22 | 0.18 | 0.09 | 5.1+0.5−0.3 | 0.72 | 0.29 | 1.6+0.7−0.4 | 1.4+0.6−0.4 | 2.7+1.1−0.8 |
| 82 | TM2 | 0.39 | 0.24 | 0.13 | 6.1+0.7−0.6 | 0.76 | 0.35 | 1.6+0.9−0.8 | 1.4+0.8−0.6 | 2.7+1.5−1.3 |
-
Qd is the quantum yield of donor (AF488) after conjugation to each MscL mutant. Ad and Aa are the anisotropy of donor (AF488) and acceptor (AF568) after conjugation, respectively. R0 is the Förster radius. Enc and Eno are the FRET efficiencies in the closed and open states, respectively. ΔR is the change in the distances between donor and acceptor (ΔRn = Rno−Rnc, Figure 4A,B). ΔD is the change of the protein diameter (ΔD = Do−Dc). Δr is the translational movement of the residue, measured from the pore center, Δr = ΔD/2. Note that the errors shown in the table are the maximum possible errors due to anisotropic orientation of the dyes. The actual errors are expected to be much smaller.
Table 3
Measurements of smFRET experiments
| Residue | Helix | Enc | Eno | Rnc (nm) | Rno (nm) | ΔRn (nm) | Δr (nm) | ΔD (nm) |
|---|---|---|---|---|---|---|---|---|
| 42 | TM1 | 0.63 | 0.23 | 5.0+0.4−0.3 | 6.7+0.5−0.4 | 1.7+0.7−0.5 | 1.4+0.6−0.4 | 2.8+1.1−0.8 |
| 27 | TM1 | 0.72 | 0.33 | 4.6+0.3−0.2 | 6.0+0.4−0.3 | 1.5+0.6−0.4 | 1.3+0.5−0.3 | 2.5+0.9−0.6 |
| 25 | TM1 | 0.78 | 0.42 | 4.6+0.4−0.3 | 6.0+0.5−0.4 | 1.4+0.6−0.5 | 1.2+0.6−0.4 | 2.4+1.1−0.8 |
| 75 | TM2 | 0.60 | 0.16 | 5.7+0.5−0.4 | 8.1+0.8−0.6 | 2.4+1.0−0.7 | 2.0+0.8−0.6 | 4.0+1.6−1.2 |
| 80 | TM2 | 0.72 | 0.29 | 4.4+0.4−0.3 | 5.9+0.5−0.4 | 1.6+0.7−0.4 | 1.4+0.6−0.4 | 2.7+1.1−0.8 |
| 82 | TM2 | 0.76 | 0.35 | 4.7+0.5−0.5 | 6.2+0.7−0.6 | 1.6+0.9−0.8 | 1.4+0.8−0.6 | 2.7+1.5−1.3 |
-
Enc and Eno are the FRET efficiencies in the closed and open states, respectively. Rnc and Rno are the distances between donor and acceptor. ΔR is the change in the distances between donor and acceptor (ΔRn = Rno−Rnc). ΔD is the change of the protein diameter (ΔD = Do−Dc). Δr is the translational movement of the residue, measured from the pore center, Δr = ΔD/2. Note that the errors shown in the table are the maximum possible errors due to anisotropic orientation of the dyes. The actual errors are expected to be much smaller.
Additional files
-
Source code 1
All-atom model of the open structure of MscL developed in this study.
- https://doi.org/10.7554/eLife.01834.023
-
Source code 2
Backbone model of the open structure of MscL developed in this study.
- https://doi.org/10.7554/eLife.01834.024
Download links
A two-part list of links to download the article, or parts of the article, in various formats.
Downloads (link to download the article as PDF)
Open citations (links to open the citations from this article in various online reference manager services)
Cite this article (links to download the citations from this article in formats compatible with various reference manager tools)
Single molecule FRET reveals pore size and opening mechanism of a mechano-sensitive ion channel
eLife 3:e01834.
https://doi.org/10.7554/eLife.01834


