T cells translate individual, quantal activation into collective, analog cytokine responses via time-integrated feedbacks
- Memorial Sloan Kettering Cancer Center, United States
- Weill Cornell Medical College, United States
- Ben Gurion University, Israel
Figures
Figure 1
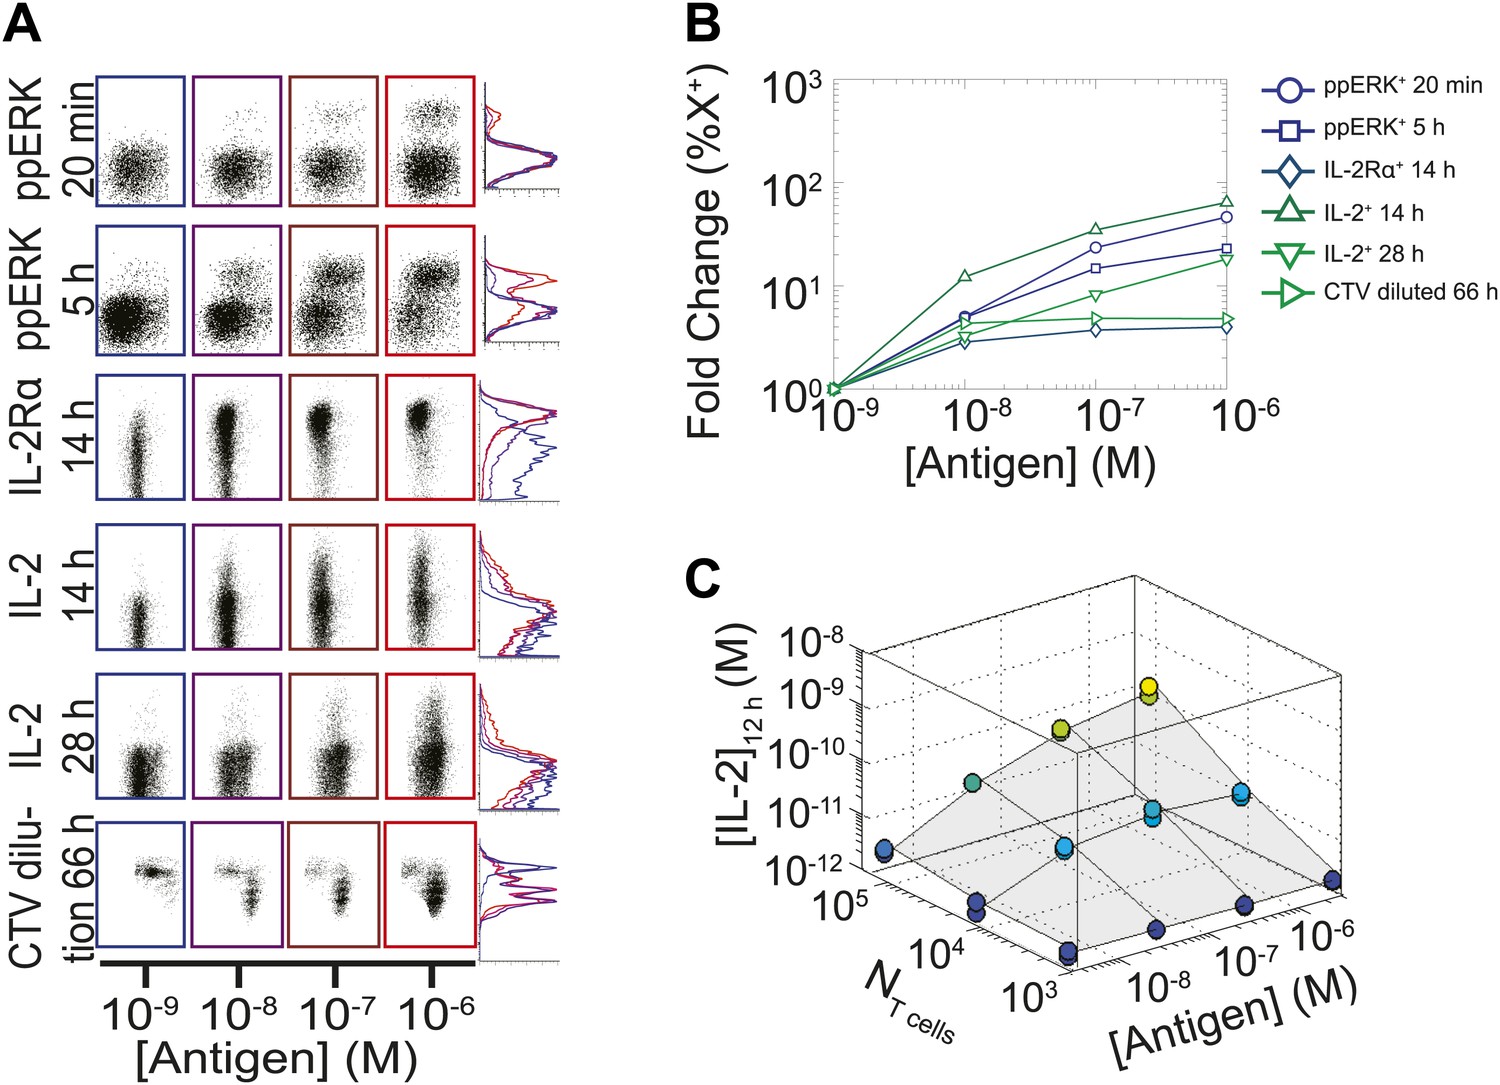
Limited dynamic range of T lymphocyte activation snapshots at the individual cell level.
Varied numbers (NTcell) of 5C.C7 TCR Transgenic Rag2−/− T cells were cultured in duplicate in 200 µl of complete medium with 5.105 I-Ek-expressing B10.A Cd3e−/−splenocytes pulsed with varied concentrations of K5 peptide ([Antigen]). (A and B) Cells were harvested at varied timepoints and analyzed by flow cytometry for phosphorylation of ERK, upregulation of IL-2Rα, production of IL-2 via a Miltenyi IL-2 secretion assay, or dilution of Cell Trace Violet (CTV) upon cell proliferation. These measurements demonstrate (A) the bimodality of T cell activation as well as (B) the limited dynamics range of response for varied doses of antigens. (C) Supernatants were also collected at 12 hr and [IL-2] was measured by ELISA.
Figure 2
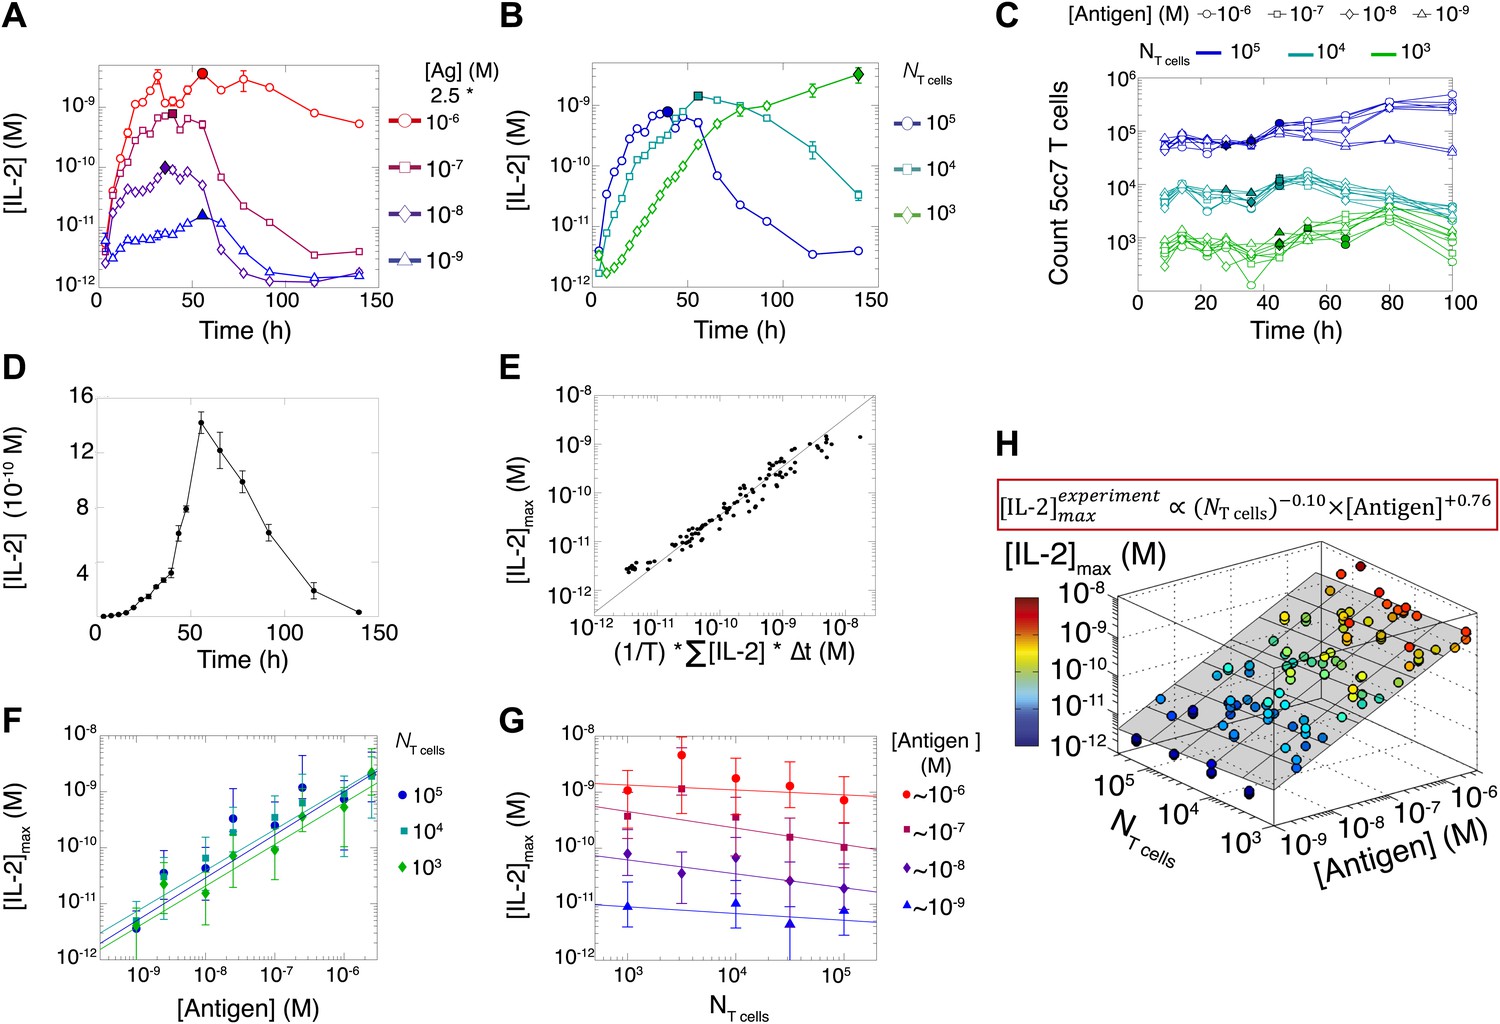
Dynamics and scaling of IL-2 production and consumption by T cells in vitro.
For T cell cultures described in Figure 1, (A and B) supernatants were collected at different timepoints (typically every 4 hr), and [IL-2] was measured by ELISA. For each condition, we recorded the maximal concentration of accumulated [IL-2] ([IL-2]max, filled symbol). Data are represented as mean ± SEM. (C) Number of live T cells in cultures as a function of time. For a given quantity of stimulating antigen (indicated by the symbol), the filled point marks the time at which the cytokine accumulation of smaller populations (104 and 103 T cells) is equal to or surpasses the larger population’s [IL-2 ]max (105 cells). (D) Nonlinear accumulation and consumption of IL-2 for a culture of 104 T cells activated with 5.105 B10.A Cd3e−/− splenocytes pre-pulsed with 250 nM of K5 antigen illustrated in linear scale. (E) Correlation of [IL-2]max with the total accumulated [IL-2] over time for 118 different conditions (varied doses of antigen and varied numbers of T cells) over six experiments. (F) [IL-2]max scales almost linearly with [Antigen] over a large dynamic range. (G) [IL-2]max is practically independent of NTcell. These data were compiled from independent experiments in which T cells were stimulated with either 1, 2, or 2.5 * 10−6/10−7/10−8/10−9 M antigen. Thus, results in (G) are grouped according to order of magnitude of antigen dose. (H) Scaling law for experimentally determined [IL-2]max as a function of [Antigen] and NTcell. The grey plane is fitted for the PLSR result.
Figure 3
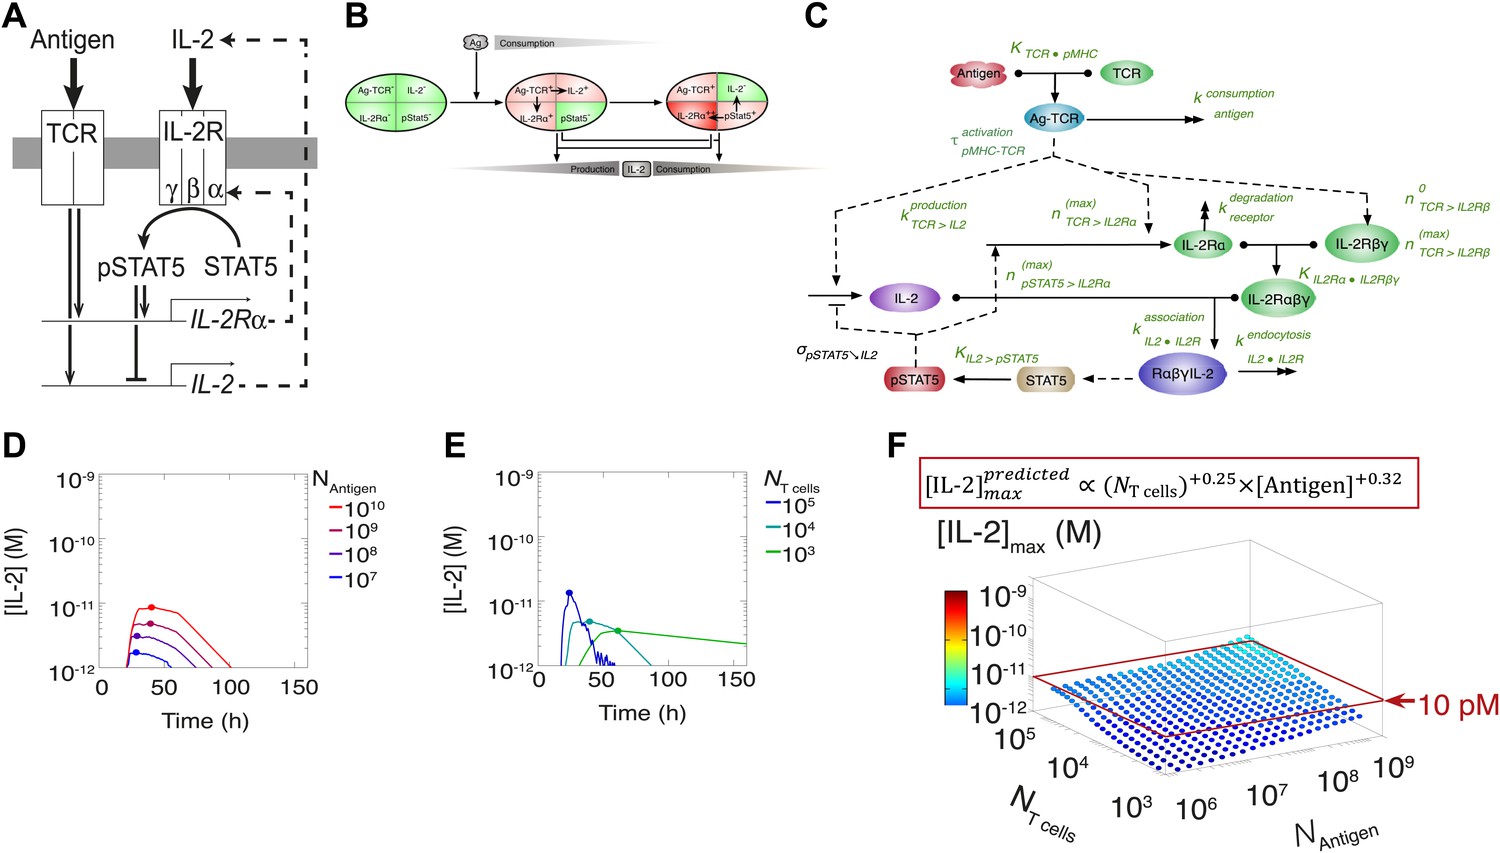
Shortcomings of the classical model of the IL-2 pathway.
(A) Sketch of the classical pathway for IL-2 secretion and consumption. (B) Cartoon representation of progression through cellular states during production and consumption of IL-2: from naive (IL-2Rα−, IL-2−) to activated IL-2 producers (IL-2Rα+, IL-2+ and IL-2Rα+) and finally to IL-2 consumers (IL-2Rα++, IL-2−). (C) Biochemical model of IL-2 regulation as described in the literature (‘classical model’); parameters in green are derived from experiments. Classical model prediction of IL-2 dynamics for (D) 104 T cells stimulated with varied quantities of antigen and (E) varied numbers of T cells stimulated with 108 molecules of antigen. (F) Two-dimensional dependency for [IL-2]max as a function of [Antigen] and NTcell, as predicted by the above classical model. The red border represents the theoretical 10 pM ceiling of [IL-2] that cells can secrete before switching off IL-2 secretion.
Figure 4
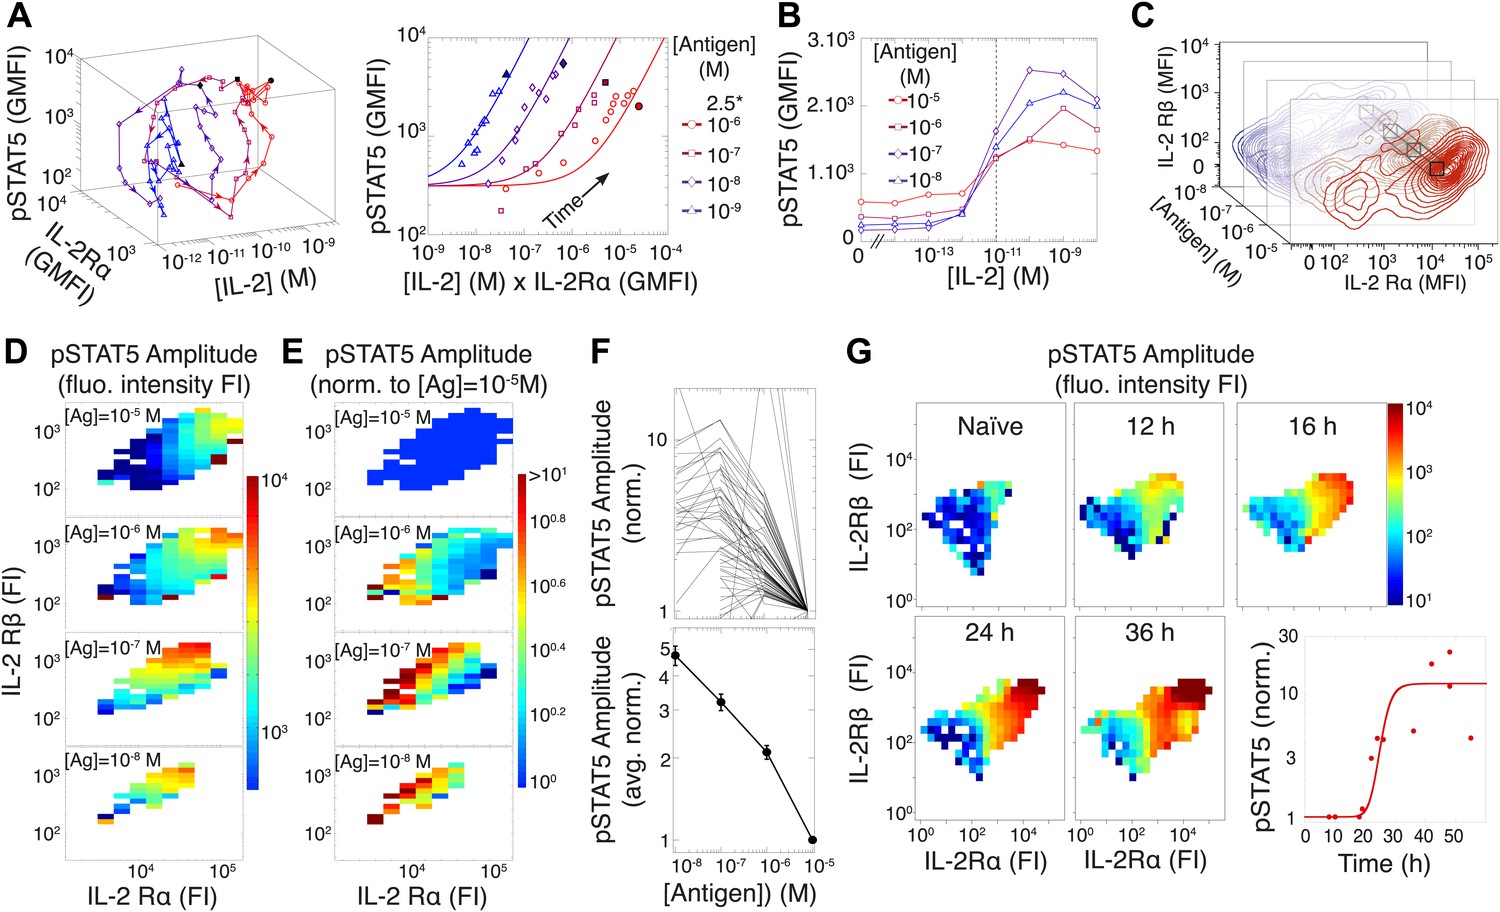
Experimental characterization of the antigen-driven inhibition of IL-2 signaling.
(A) Dynamics of IL-2 pathway over 150 hr (arrows indicate progression in time) for 105 5C.C7 T cells activated in vitro by splenocytes pulsed with varied [K5] antigen (left). STAT5 phosphorylation was measured as the geometric mean fluorescence intensity (GMFI) at different times before reaching the maximal [IL-2] concentration (filled symbol), and correlated with the product of [IL-2] and IL-2Rα GMFI for activated cells (right, representative of more than four experiments). (B) STAT5 phosphorylation in response to exogenous IL-2 for cells 48 hr post activation with splenocytes pulsed with varied doses of antigen. pSTAT5 is reported as GMFI for all activated IL-2Rα+ T cells. (C) Distributions of the abundance of IL-2Rα and IL-2Rβ at 48 hr post activation with splenocytes pulsed with varied doses of antigen. Cell-to-cell variability analysis (CCVA) parses these distributions to compare the signaling responses among populations of cells (bins) defined by set levels of IL-2Rα and IL-2Rβ (e.g., black cross-section across antigen doses). (D) and (E) Cell-to-cell variability analysis, see Experimental Procedures for details. pSTAT5 responses for cultures in (C) were parsed according to binned levels of IL-2 receptors. Amplitudes of pSTAT5 for 10 nM ≤ [K5] ≤ 10 µM for each IL-2Rα/IL-2Rβ bin were presented (D) as fluorescence intensity (FI) or (E) as a FI normalized to the pSTAT5 amplitude for [K5] = 10 µM. (F) Normalized pSTAT5 amplitude are reported for individual bins of IL-2Rα and IL-2Rβ levels (top) or averaged across all IL-2Rα and IL-2Rβ levels (bottom). Error bars are computed as the SEM across all bins. (G) Cell-to-cell variability analysis of pSTAT5 response to IL-2 for varied levels of IL-2Rα and IL-2Rβ at different time points. Inset: time dependence of the average pSTAT5 amplitude measured for individual bins of IL-2Rα and IL-2Rβ over time (n = 3 independent experiments).
Figure 5
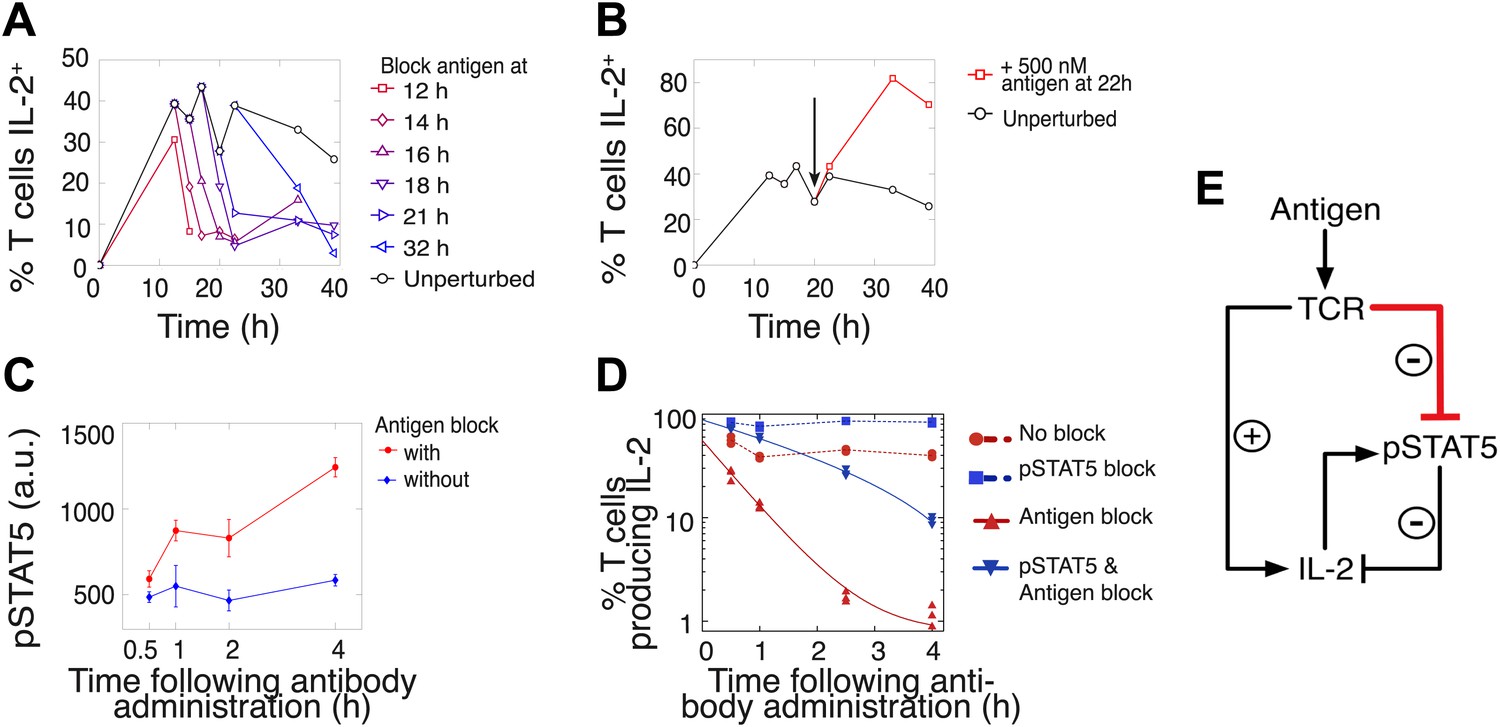
Coherent feed-forward loop regulation of IL-2 secretion.
(A and B) 3 × 10⁴ 5C.C7 TCR-transgenic Rag2−/− T cells co-cultured with 3.5 × 10⁵ APCs pre-pulsed with 500 nM K5 antigen. (A) Blocking of cognate pMHC ligand via administration of 20 μg/ml α-I-Ek antibody at varied time points during IL-2 production causes a rapid drop (detected here within 2 hr) in the number of IL-2-producing cells. (B) Addition of K5 antigen at t = 22 hr to cultures increases the numbers of IL-2-producing cells. (C) Phosphorylation of STAT5 is rapidly enhanced upon blocking of cognate pMHC ligand via administration of 20 μg/ml α-I-Ek antibody. (D) Cells activated with 1 μM of K5 antigen were treated with a JAK inhibitor or carrier control at 9 hr. Cells of each condition were then treated with antigen-blocking reagent anti-I-Ek or control anti-H2-Db at 30 hr. IL-2 production was measured via cytokine capture assay. All conditions performed in triplicate. (E) Sketch of the antigen-driven inhibition of IL-2 signaling (red), which makes IL-2 production contingent on antigen availability.
Figure 6
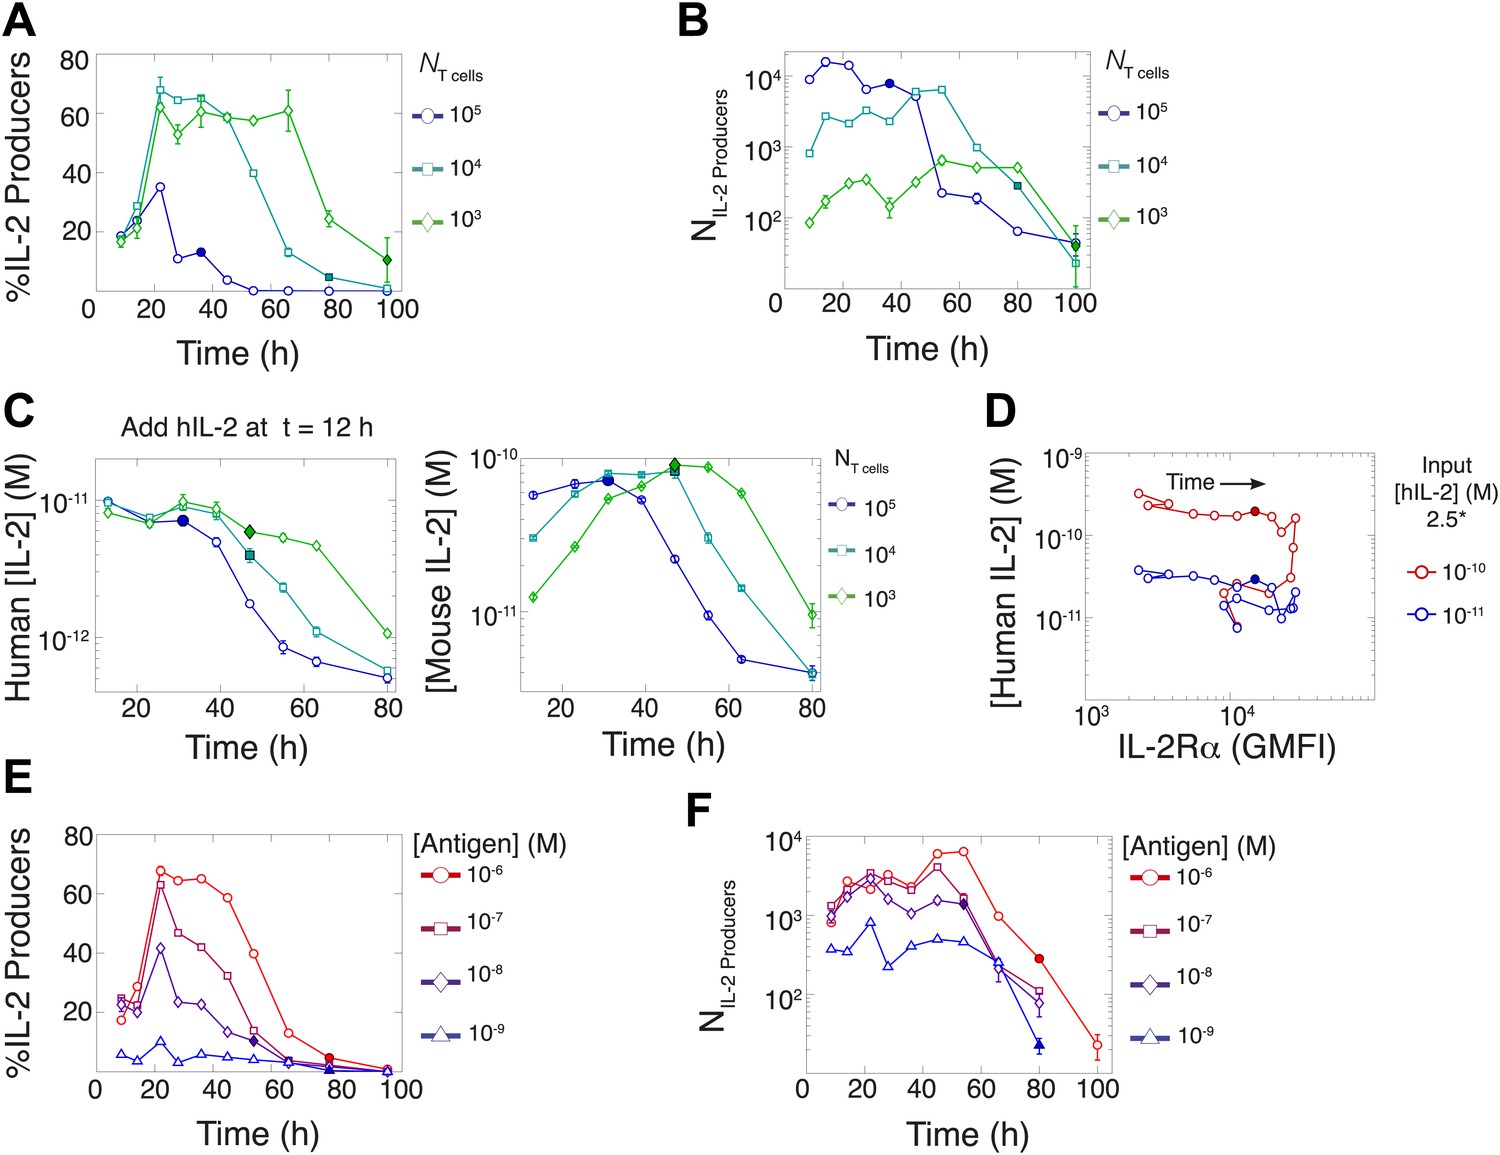
Count of IL-2 producing cells and rate of IL-2 consumption do not account for scaling law in IL-2 accumulation.
We quantitate IL-2 production at the individual cell level for cultures as described in Figure 1. Percentage (A) and counts (B) of T cells producing IL-2 as a function of time for varied numbers of 5C.C7 T cells, activated with splenocytes pulsed with 1 µM K5 antigen. (C) Negligible IL-2 consumption during IL-2 production phase. Varied numbers of 5C.C7 T cells were activated by splenocytes pulsed with 1 µM K5 antigen and cultured with 10 pM of human IL-2 added 12 hr post initial activation, in triplicate. Left: human IL-2 and Right: mouse IL-2 detected in cultures over time. Graphs are representative of three experiments. (D) Depletion of added human IL-2 as a function of IL-2Rα upregulation. 50,000 5C.C7 T cells were stimulated with 200,000 APCs pulsed with 500 nM K5 antigen during experiment tracking the consumption of 250 or 50 pM human IL-2 added at 6 hr after the start of co-culture. Timepoints were taken every 6 hr between 6 and 96 hr of culture. Percentage (E) and counts (F) of T cells producing IL-2 as a function of time for 104 T cells activated with splenocytes pulsed with varied doses of K5 antigen.
Figure 7 with 1 supplement
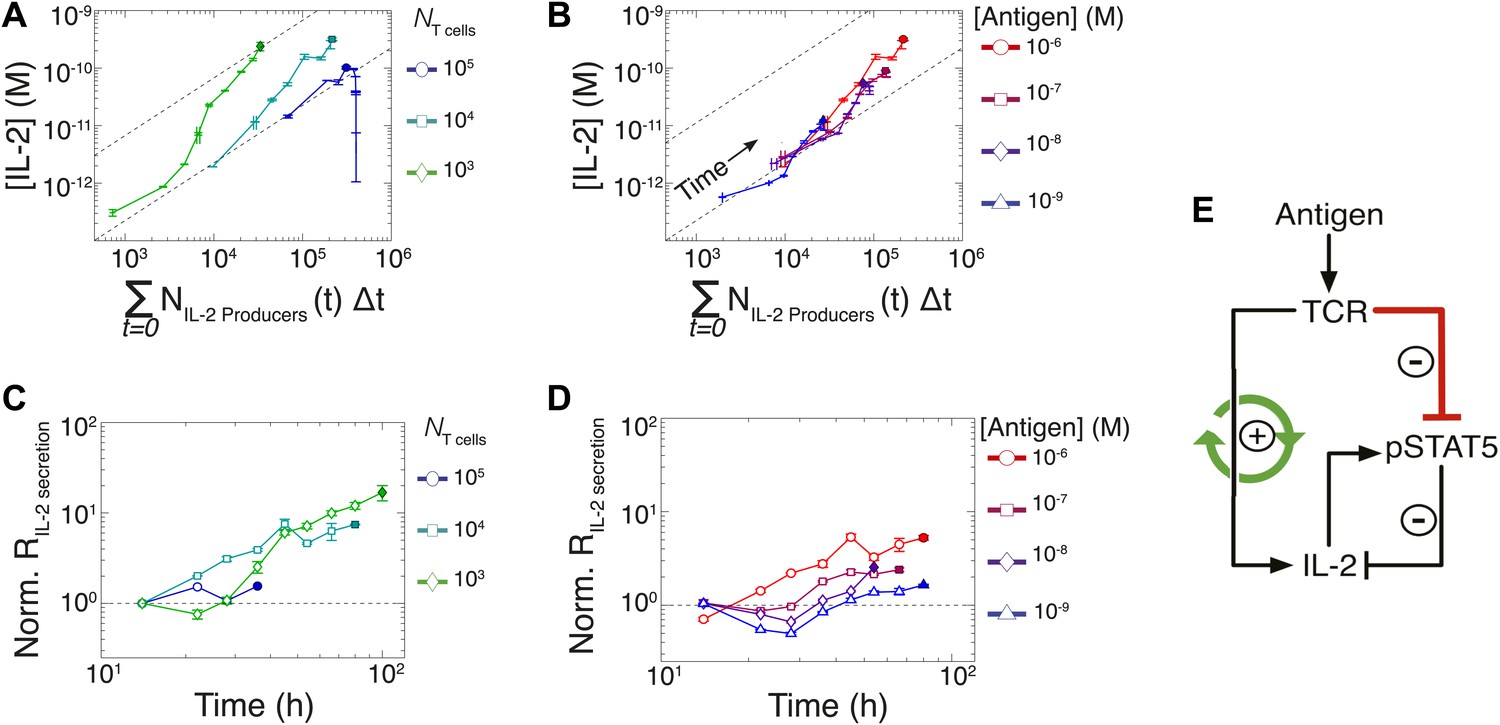
Experimental characterization of the nonlinear acceleration of IL-2 secretion in activated T cells.
(A and B) The integral of the number of IL-2 producers over time following activation is compared to [IL-2] (measured in duplicate) accumulated (A) for 1 µM K5 antigen with different numbers of T cells or (B) for 104 T cells exposed to different quantities of antigen. (C and D) Fold increase from the average initial rate of IL-2 production per cell as a function of time for varied number of T cells (C) or for varied doses of antigens (D). The average rate of IL-2 secretion was estimated to be 7.5 molecules per second (Figure 8—figure supplement 1). (E) Sketch of the positive feed-forward loop (in green) accounting for the acceleration in IL-2 secretion over sustained periods of antigenic stimulation.
Figure 7—figure supplement 1
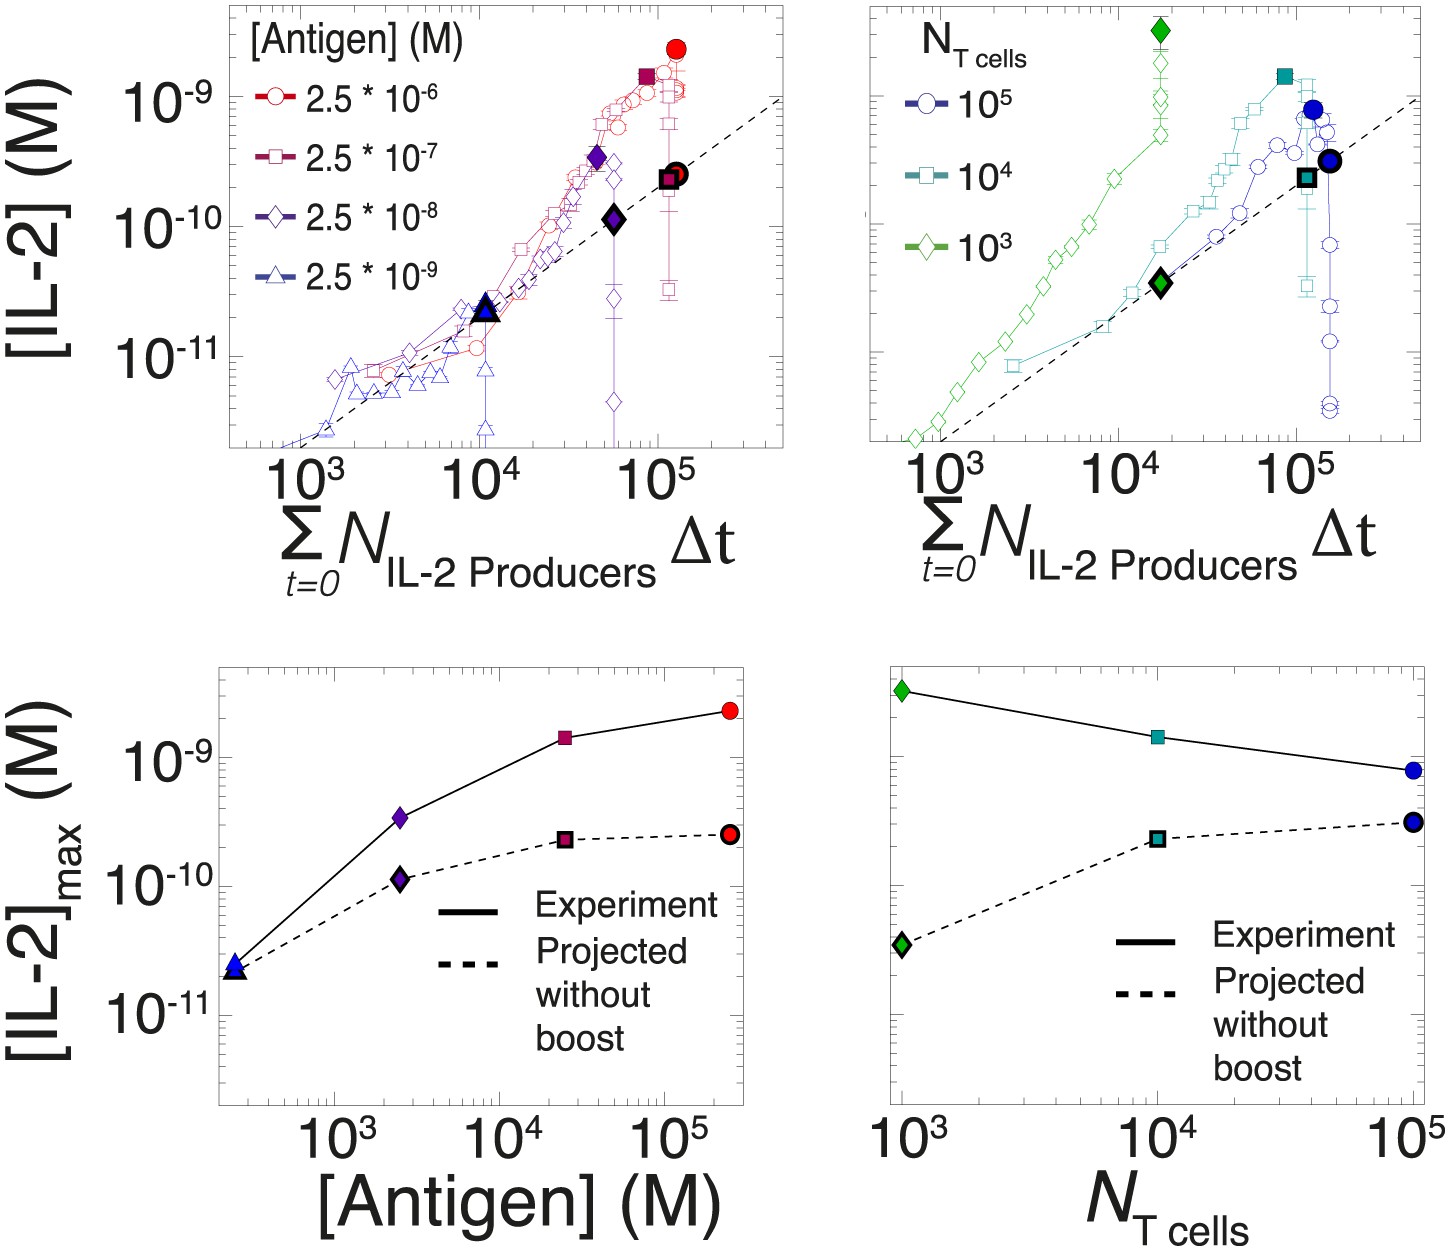
Criticality of IL-2 boost to achieve antigen-scaling and population-size-independence in [IL-2]max.
Top projected values of [IL-2]max if IL-2 secretion is maintained at a constant rate per cell for experimental conditions similar to those described in Figure 7A–B. A constant rate of IL-2 production per cell would yield a linear correlation between the cumulative number of IL-2 producing cells over time and the [IL-2] in the media (dotted line). Points in bold (on the dotted line) indicate the projected [IL-2]max if IL-2 secretion were constant per cell. Bottom: discrepancy between observed and projected [IL-2]max scaling with antigen dose and population size . If the IL-2 secretion rate per cell was constant, the dynamic range of [IL-2]max scaling with antigen dose would saturate (left); additionally, [IL-2]max would scale directly with T cell population size (right). Therefore, a boost in IL-2 production is necessary to achieve the large scalability and population size-independence of [IL-2]max. These results are representative of more than three independent high time-resolution experiments.
Figure 8 with 1 supplement
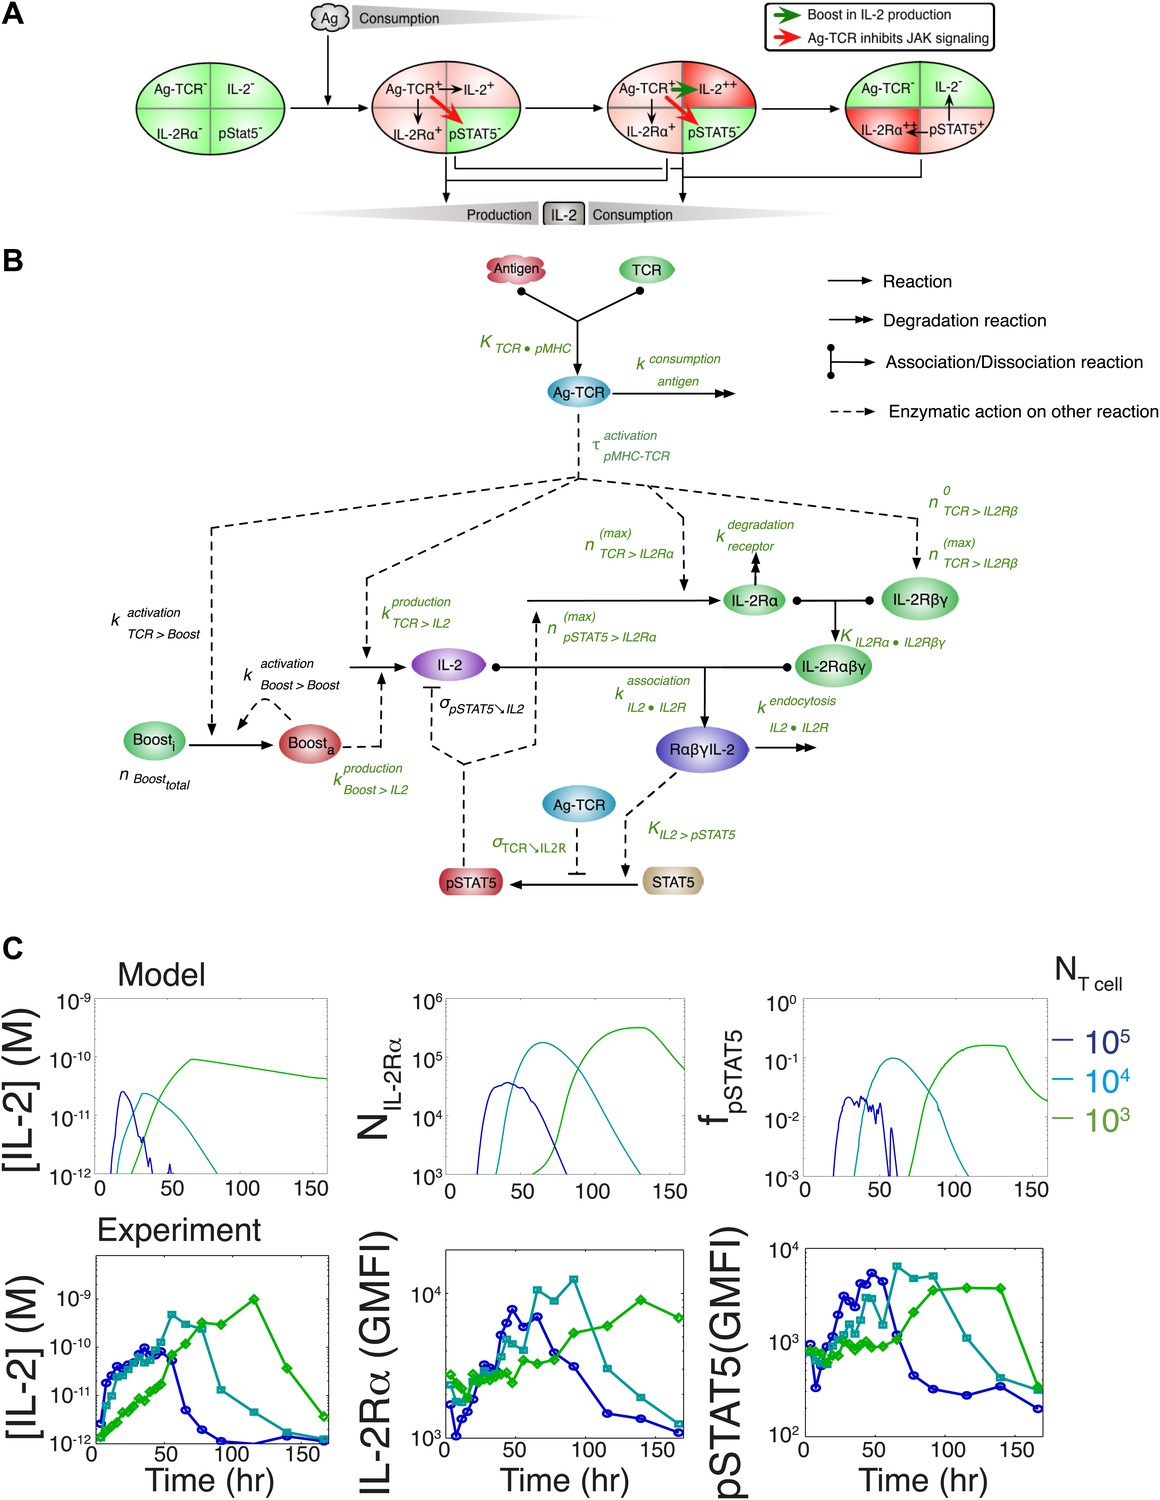
Computational model of IL-2 pathway.
(A) Cartoon representation of progression through cellular states during production and consumption of IL-2. Highlighted arrows indicate new regulation uncovered in Figures 5 and 7. (B) Molecular reaction network of IL-2 pathway used to build the mathematical model on the basis of Figure 8A. Detailed description of the model is given in ‘Materials and methods’. Chemical reactions are represented by solid lines, and dashed lines represent the enzymatic activity of chemical reactions. The parameters associated with the reactions are indicated in the diagram and the values of the parameters are listed in the ‘Materials and methods’. Experimentally determined/estimated parameters are colored in green. Phenomenologically determined parameters are colored in black. (C) Comparison of model-simulated (top row) and experimentally observed (bottom row) temporal dynamics of IL-2, IL-2Rα and pSTAT5 for three different numbers of 5C.C7 T cells in 200 μl medium. T cells are co-cultured with 5.105 APCs prepulsed with 25 nM of K5 antigen; in the model simulation, the antigen dose is 1 × 10⁸ molecules. Kinetics are representative of six independent experiments.
Figure 8—figure supplement 1
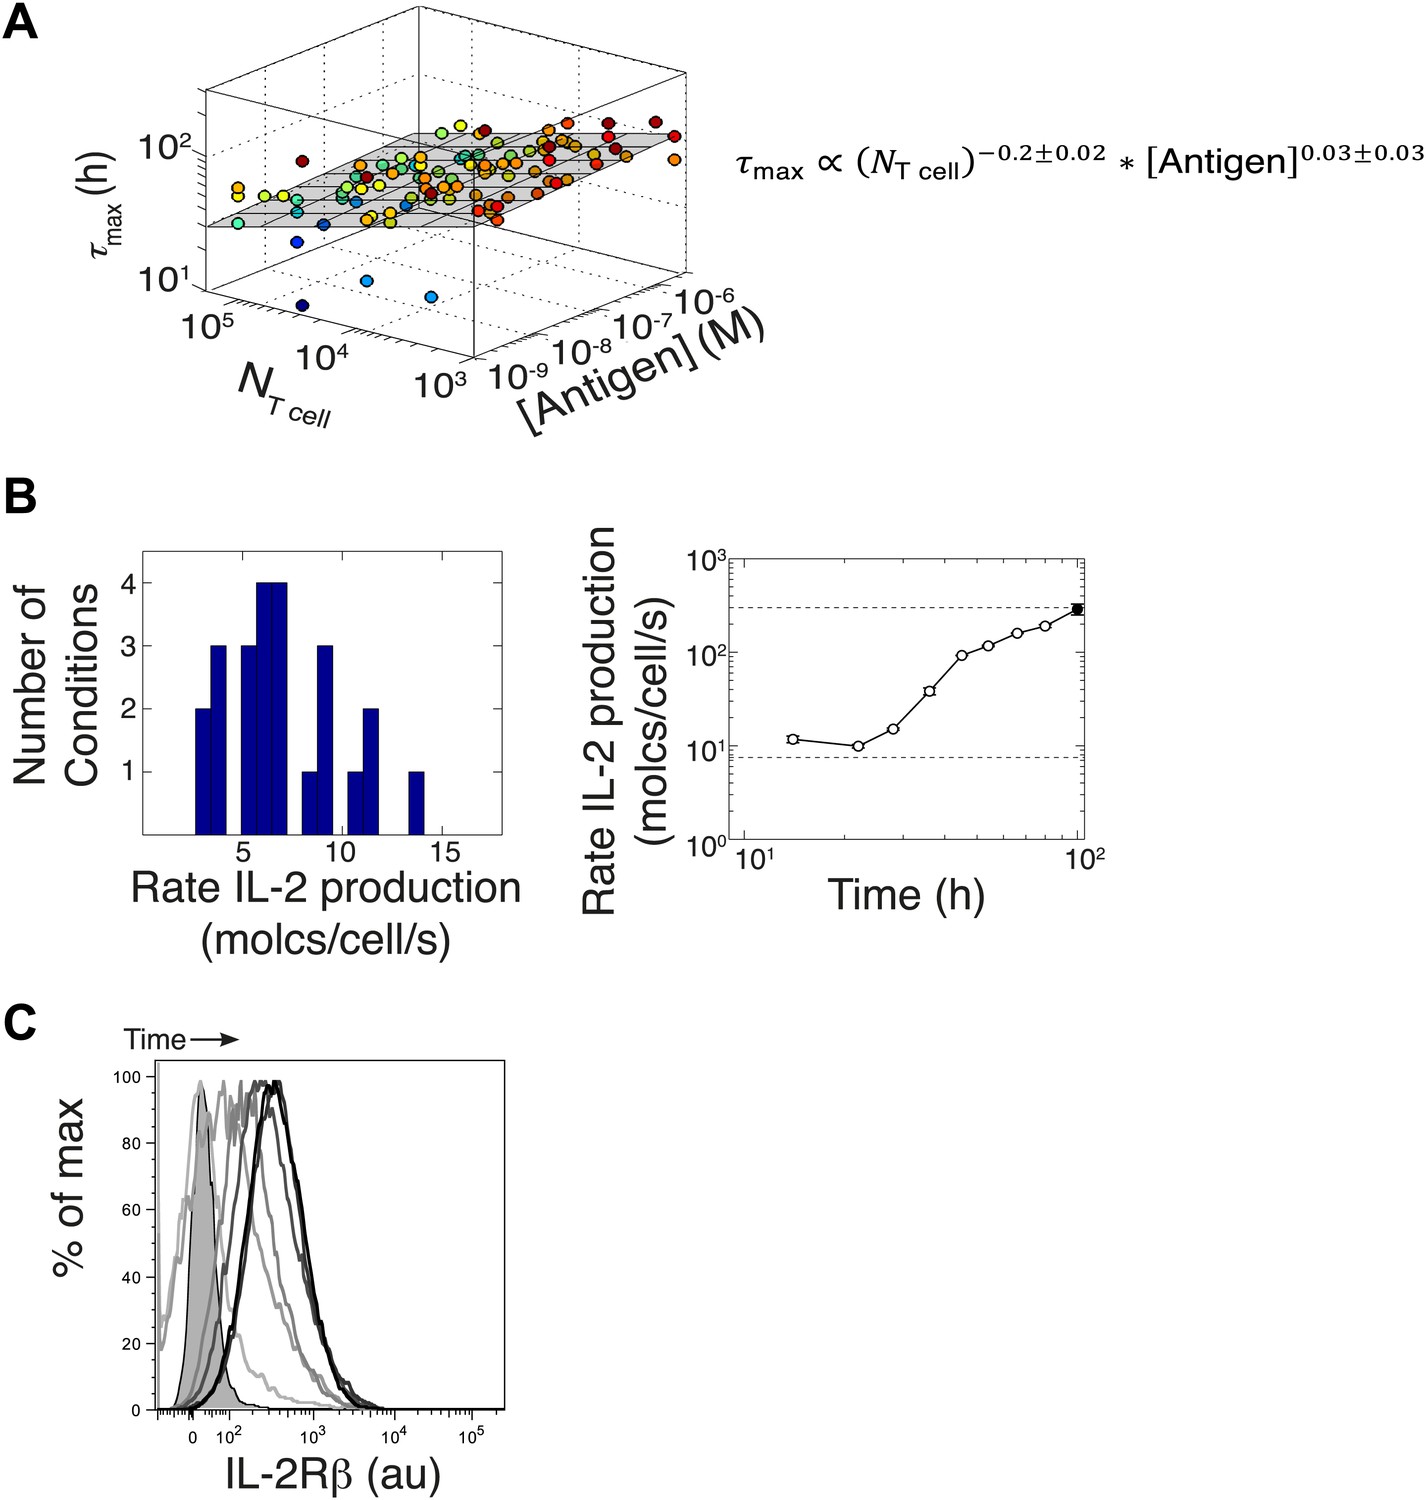
Additional experimental measurements to parametrize the computational model.
(A) Variation of time to reach [IL-2]max (τmax) with number of T cells and antigen dose. Data from six different experiments are plotted together. The grey plane is the best fits to the data, using partial least square regression in MATLAB. The fitting coefficients and standard error of mean for the experimental data are given. We find that the dependency with number of T cells and antigen dose for the time to reach [IL-2]max (τmax) is weak. We emphasize here that since the variation in duration for IL-2 production is very small, this cannot be a sufficient mechanism to establish the wide dynamic range of antigen dose scaling and population size-independence of IL-2 accumulation. (B) Left: parameterizing the basal rate of IL-2 production per cell. The apparent rate is estimated in molecules per second per cell, as with V being the reaction volume (V = 2.10−4 l), [IL-2] the measured concentration of IL-2 (in Molar) and Δt the time interval between measurements (expressed in seconds). Distribution of IL-2 secretion rates per cell at 8 hr after the start of co-culture for T cell populations of all sizes (105, 104, and 103 T cells per well) stimulated with a range of different antigen quantities (1 μM, 100 nM, 10 nM, and 1 nM K5). We estimated the basal rate of IL-2 production to be 7.5 molecules per cell per second. Right: parameterizing the rate acceleration for IL-2 production per cell. Maximal acceleration trajectory taken by 103 T cells stimulated with 1 μM K5. Error bars show standard error of mean of two replicates. Data is representative of four high time resolution experiments. We estimated the maximal boost in IL-2 secretion to be 30-fold over the basal rate of IL-2 secretion, hence 225 molecules per second per cell. (C) Parameterizing the upregulation of IL-2Rα, hours after the start of co-culture. Shown: single cell IL-2Rβ distributions for 105 5C.C7 T cells stimulated with 2.5 μM K5 antigen at 12, 24, 36, 48, 78, and 140 hr. Unstained control is shaded.
Figure 9
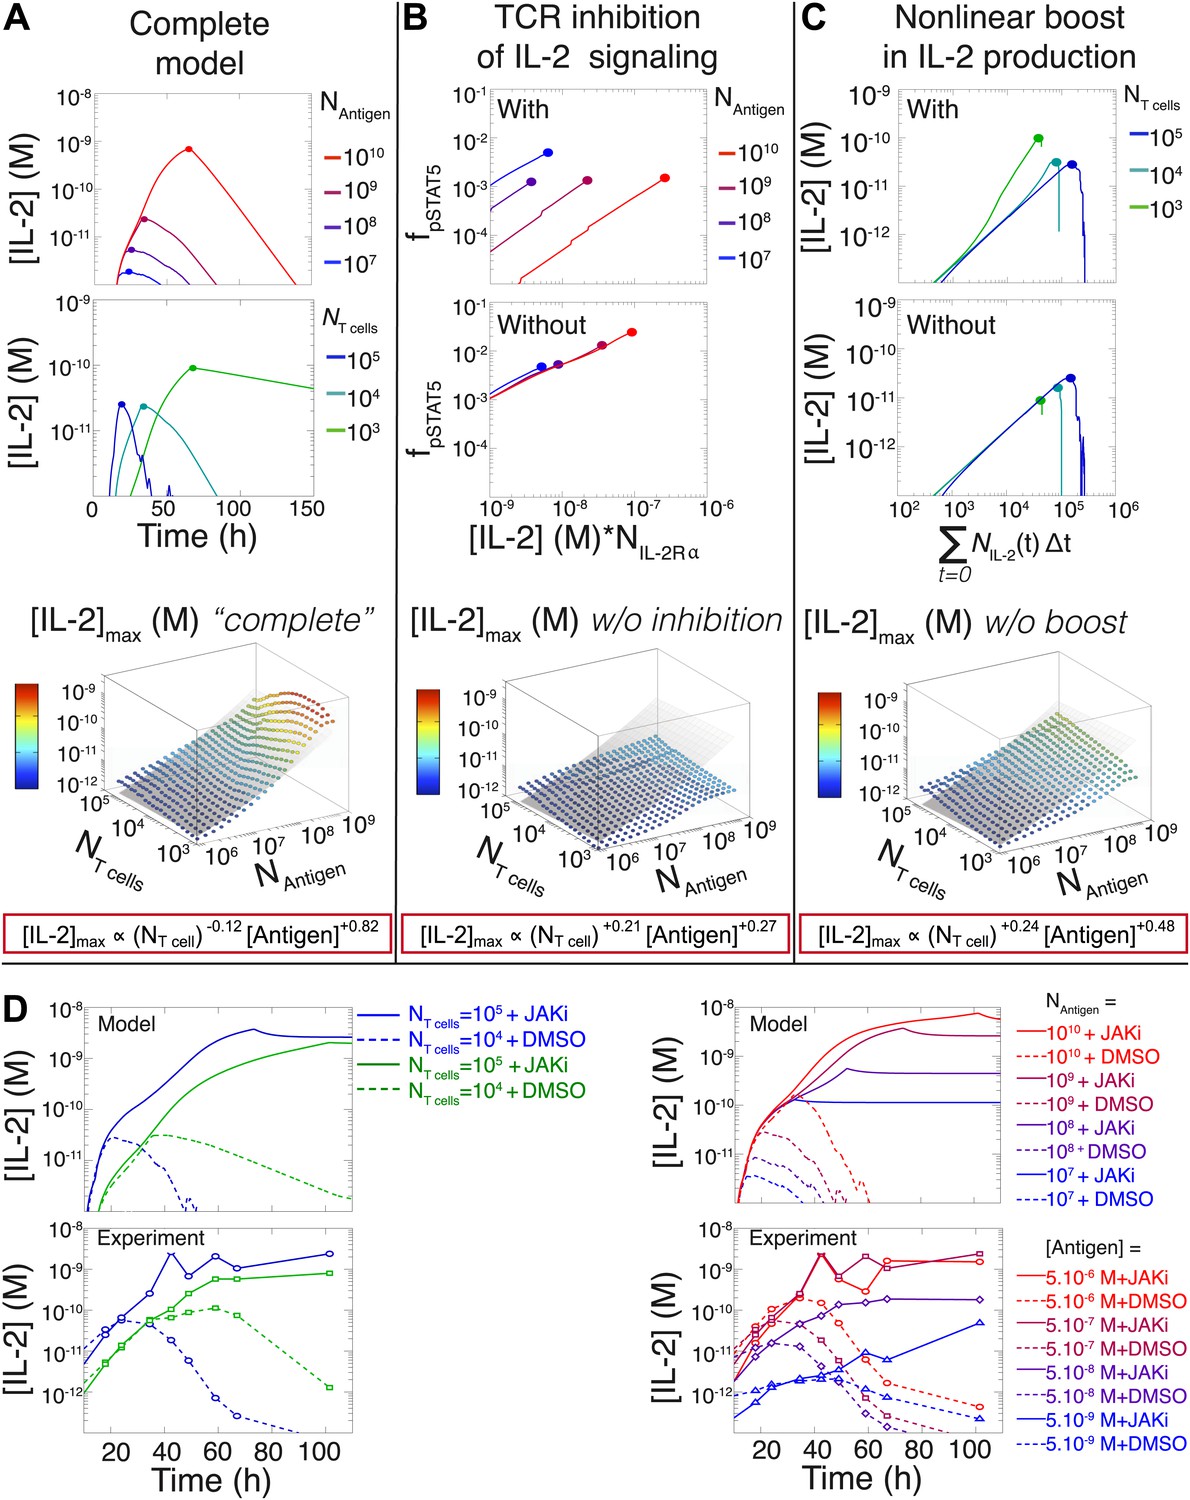
Mathematical modeling accounts for the scaling law in IL-2 dynamics.
(A) Simulated dynamics of [IL-2] for different quantities of antigen molecules, NAntigen (top) and numbers of T cells, NT cell (middle). [IL-2]max dependency with NAntigen and NT cell (bottom-filled circles) can be fitted with Equation 3 (bottom–grey plane). (B) Dependence of pSTAT5 response on NAntigen, with (top) or without (middle) TCR inhibition of pSTAT5. Abrogating TCR inhibition leads to low saturation in [IL-2]max and spurious scaling with NT cell and NAntigen (bottom). (C) Our model recaptures the acceleration of IL-2 secretion as a function of cumulative numbers of IL-2 producing cells (top). Upon removing the boost in IL-2 secretion (middle), low NT cell fail to accumulate comparable [IL-2]max to high NT cell (bottom). (D) Model prediction (top row) and experimental validation (bottom row) of IL-2 accumulation kinetics with JAK inhibitor (JAKi—solid line) or without (DMSO—dashed line) for different numbers of T cells (left) activated with different quantities of K5 peptide (right).
Figure 10 with 1 supplement
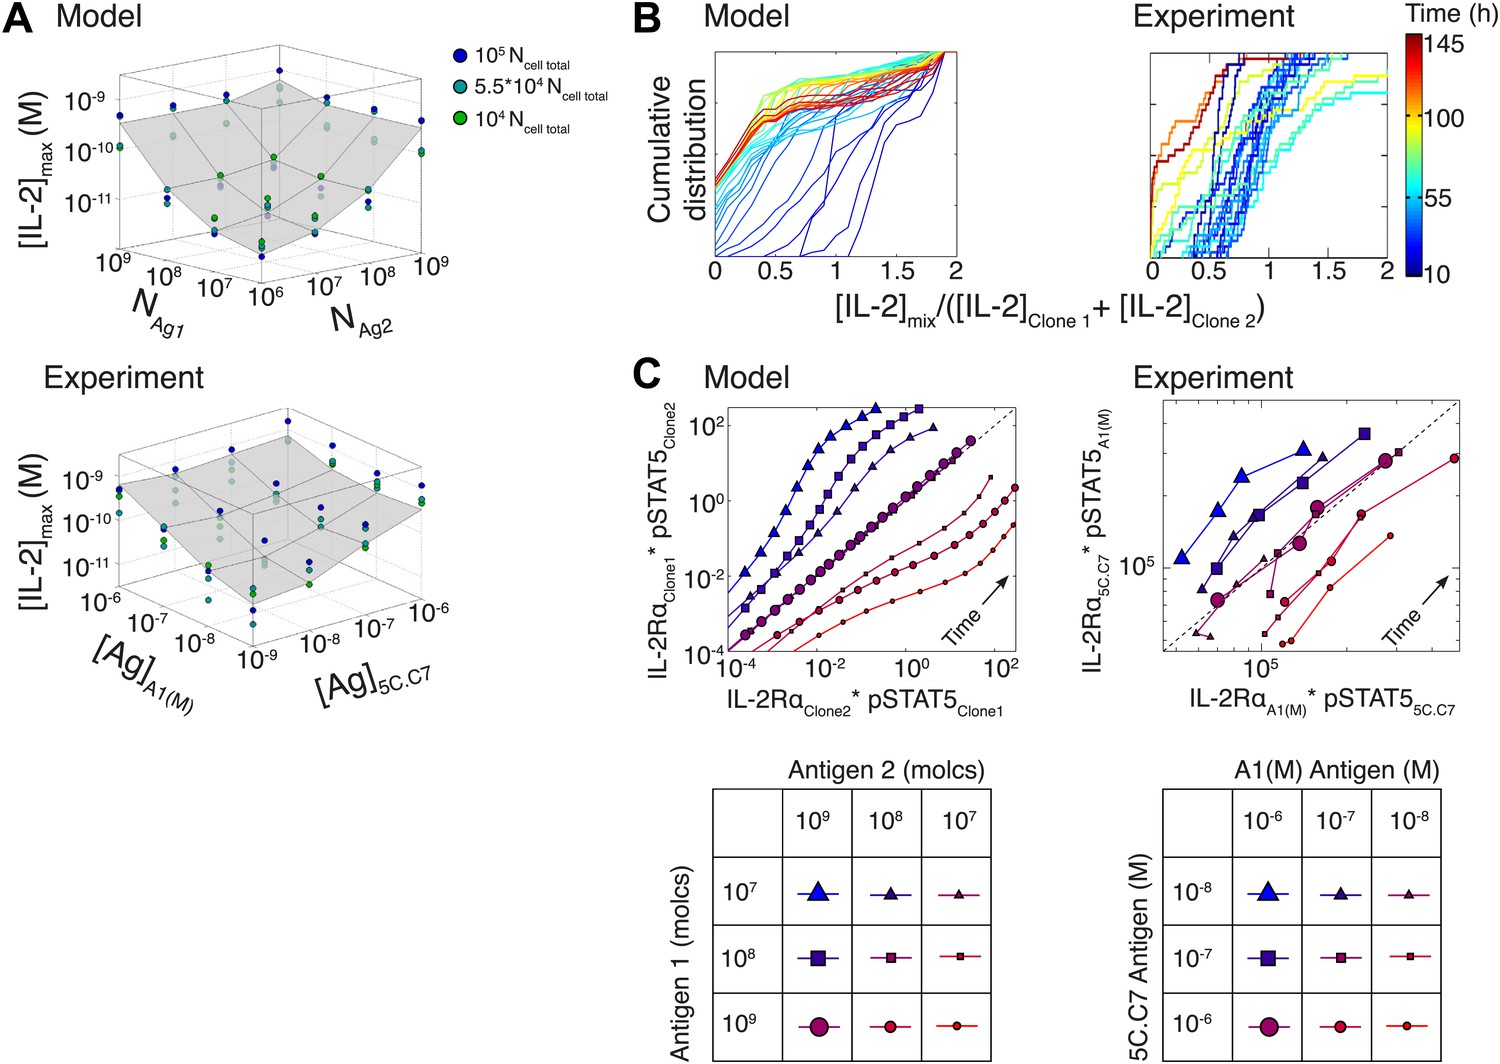
Testing the model of IL-2 regulation through mixed culture of two T cell clones.
5C.C7 and A1(M) TCR transgenic T cells were cultured at varied precursor frequencies (5.103 and 5.104 T cells/well) with titrated concentrations (10−6/10−7/10−8 M) of cognate antigens (K5 and HY peptides) pulsed on separate splenocytes. Graphs show two experiments and are representative of three experiments. (A) Model predictions (top) and experimental validation (bottom) of [IL-2]max for mixed cultures. Color represents total number of T cells (5.103 + 5.103, 5.103 + 5.104, 5.104 + 5.104). (B) Model (left) and experimental (right) cumulative distributions of the ratio of [IL-2] accumulated by the mixed culture to the sum of [IL-2] accumulated independently by each clone over all conditions. (C) Model prediction (left) and experimental validation (right) that pSTAT5 response to shared IL-2 can resolve the relative activating doses of antigen for 5.104 cells of each clone. Marker shape: [Antigen1] = [K5], marker size: [Antigen2] = [HY], color: ratio [K5]/[HY].
Figure 10—figure supplement 1
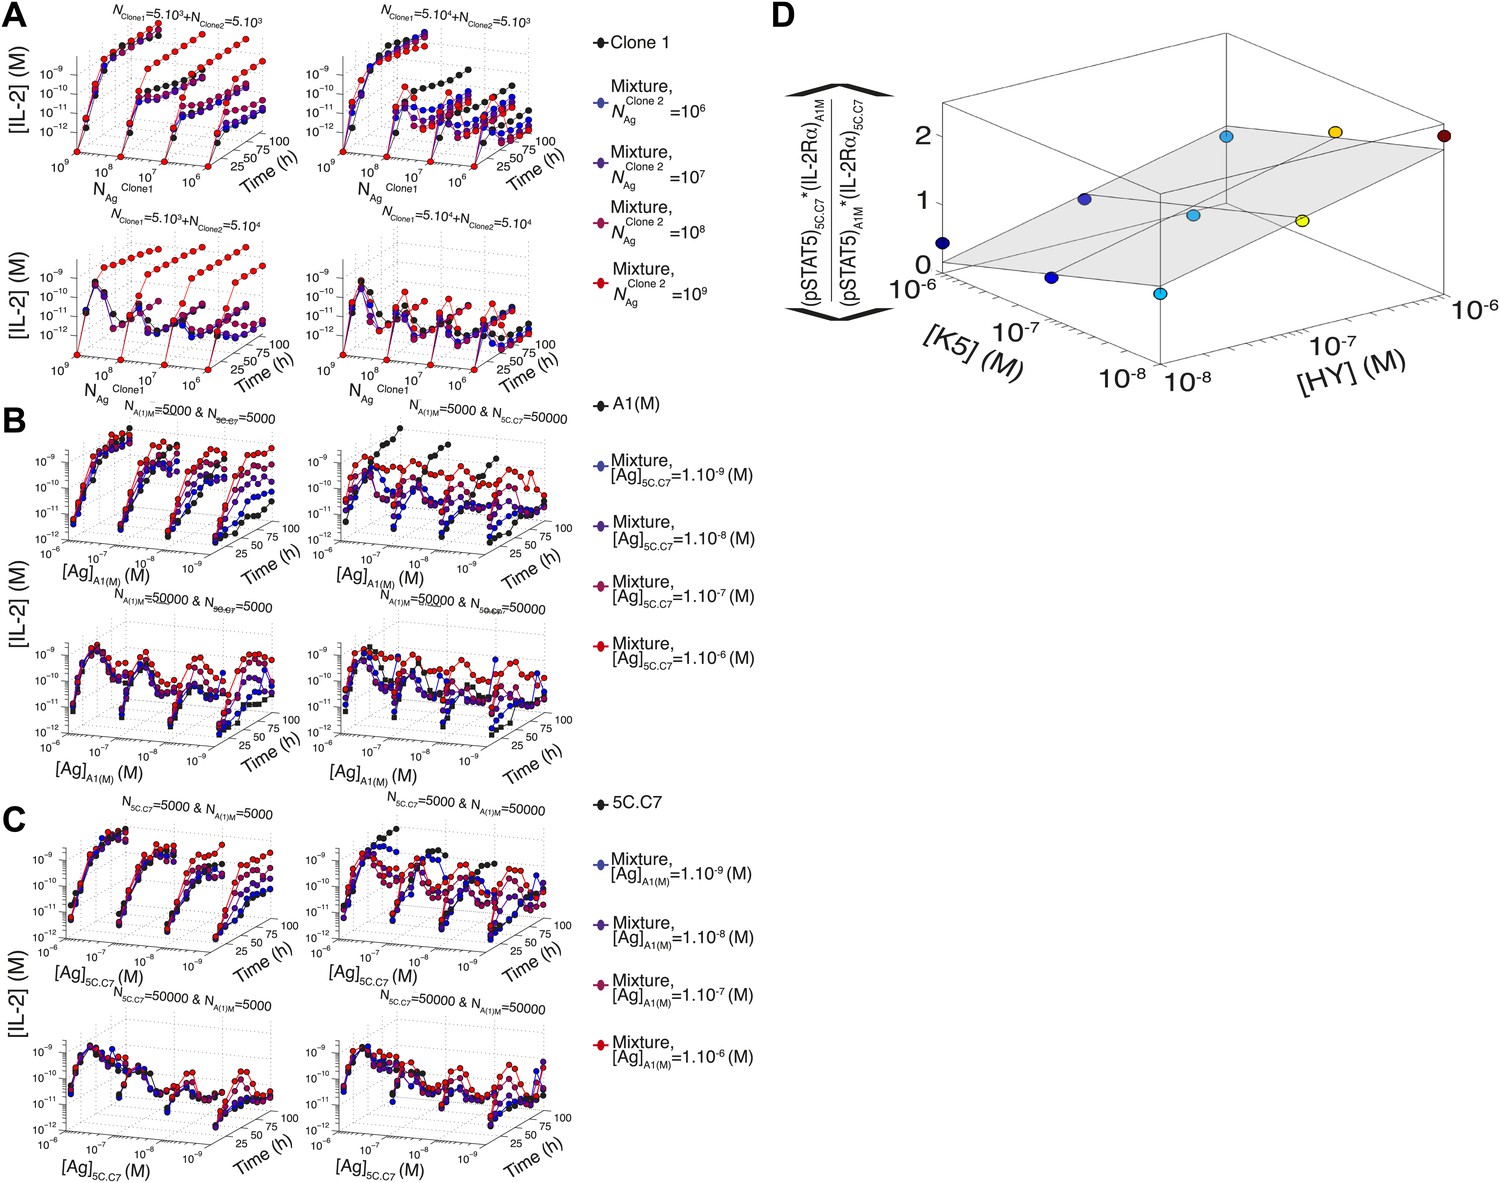
Additional computational predictions and experimental validation for a mixed culture of two T cell clones.
(A) Model prediction of the temporal dynamics of IL-2 accumulation by a mixture of two different clones of T cells. For given numbers of clone 1 and clone 2 cells in the mixture (indicated at the top of each box), the temporal kinetics of [IL-2] in the 200 µl medium are plotted for combinations of varied doses of antigen 1 (y-axis) and antigen 2 (indicated by the line color). Due to the symmetry in the model between clone 1 and clone 2, we present temporal [IL-2] dynamics with respect to clone 1 only. (B) Experiment: temporal dynamics of IL-2 are plotted as in (A) for different numbers of T cells from 5C.C7 and A1(M) TCR transgenic mice with varied doses of K5 antigen. (C) Experiment: temporal dynamics of IL-2 are plotted as in (A) for different numbers of T cells from 5C.C7 and A1(M) TCR transgenic mice with varied doses of HY antigen. (D) Scaling for the inhibitory cross-talk between TCR and IL-2 signaling for a mixed culture of 5C.C7 and A1(M) T cells (see ‘Materials and methods’ for details).
Figure 11
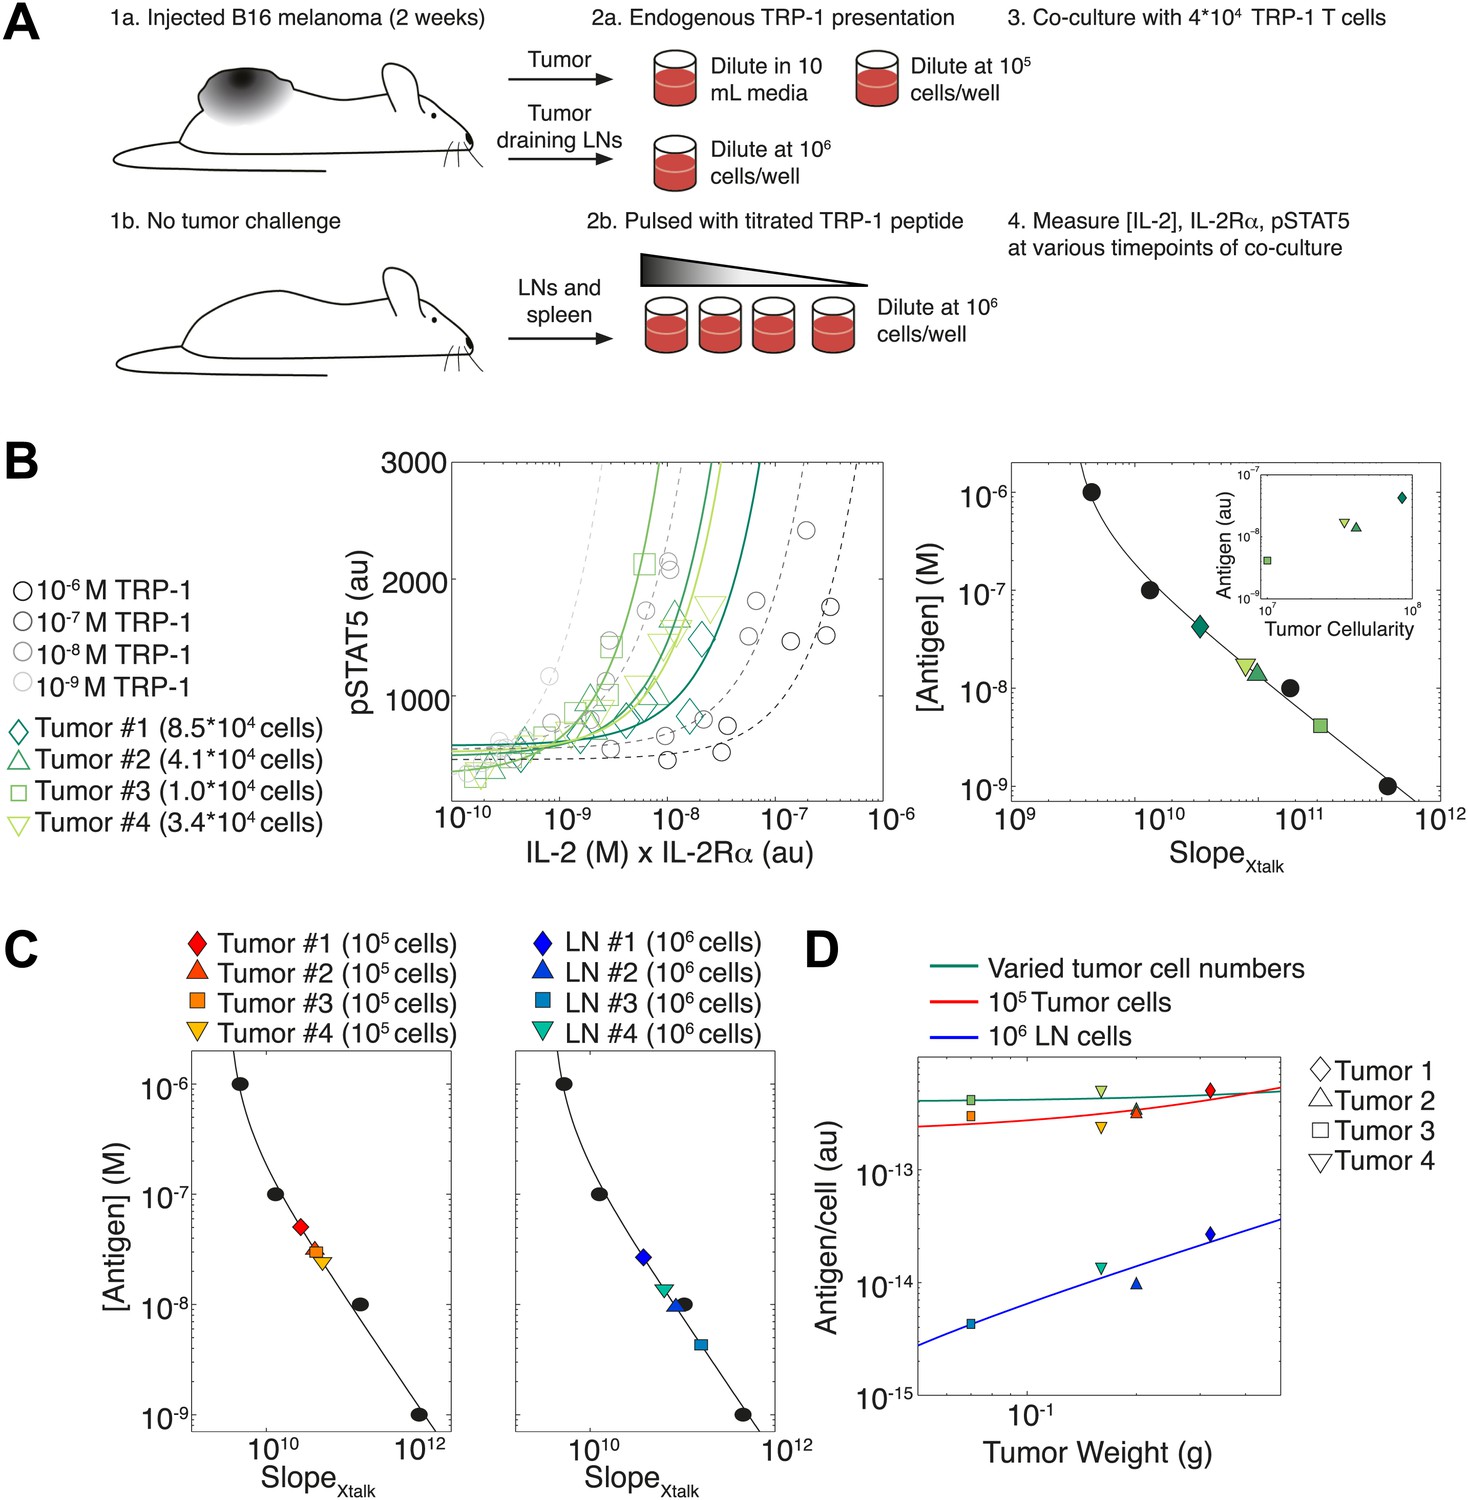
Applying antigen-driven inhibition of IL-2 signaling to estimate tumor antigenicity.
(A) Schematic of experimental design. (B) Left: pSTAT5 increase over the first 52 hr of culture as a function of IL-2 and IL-2Rα for titrated TRP1 peptide pulsed on C57BL/6 splenocytes (Calibration Series, gray) and tumor samples diluted in equivalent volumes (Sample Series, green). Trajectories were fit with the equation Graphs are representative of four experiments. Right: antigen dose as a function of , as established by Calibration Series (black). Calibration curve allows estimation of effective antigenicity of tumor samples. Antigenicity of tumors scales with tumor cellularity (insert). (C) Back-calculated antigenicity for 105 cells of each mouse’s tumor (left) and 106 cells of each mouse’s tumor draining lymph nodes (right). (D) Correlation of tumor weight to estimations of antigen presentation per cell for each tissue.
Download links
A two-part list of links to download the article, or parts of the article, in various formats.
Downloads (link to download the article as PDF)
Open citations (links to open the citations from this article in various online reference manager services)
Cite this article (links to download the citations from this article in formats compatible with various reference manager tools)
T cells translate individual, quantal activation into collective, analog cytokine responses via time-integrated feedbacks
eLife 3:e01944.
https://doi.org/10.7554/eLife.01944


