MEMO1 binds iron and modulates iron homeostasis in cancer cells
- Department of Biochemistry, Microbiology and Immunology, University of Saskatchewan, Canada
- Protein Characterization and Crystallization Facility, University of Saskatchewan, Canada
- Department of Pathology and Laboratory Medicine, University of Saskatchewan, Canada
- Department of Molecular and Medical Genetics, Oregon Health and Sciences University, United States
- National Magnetic Resonance Facility at Madison (NMRFAM), University of Wisconsin, United States
- Cancer Research Department, Saskatchewan Cancer Agency, Canada
- Division of Oncology, University of Saskatchewan, Canada
Figures
Figure 1 with 5 supplements
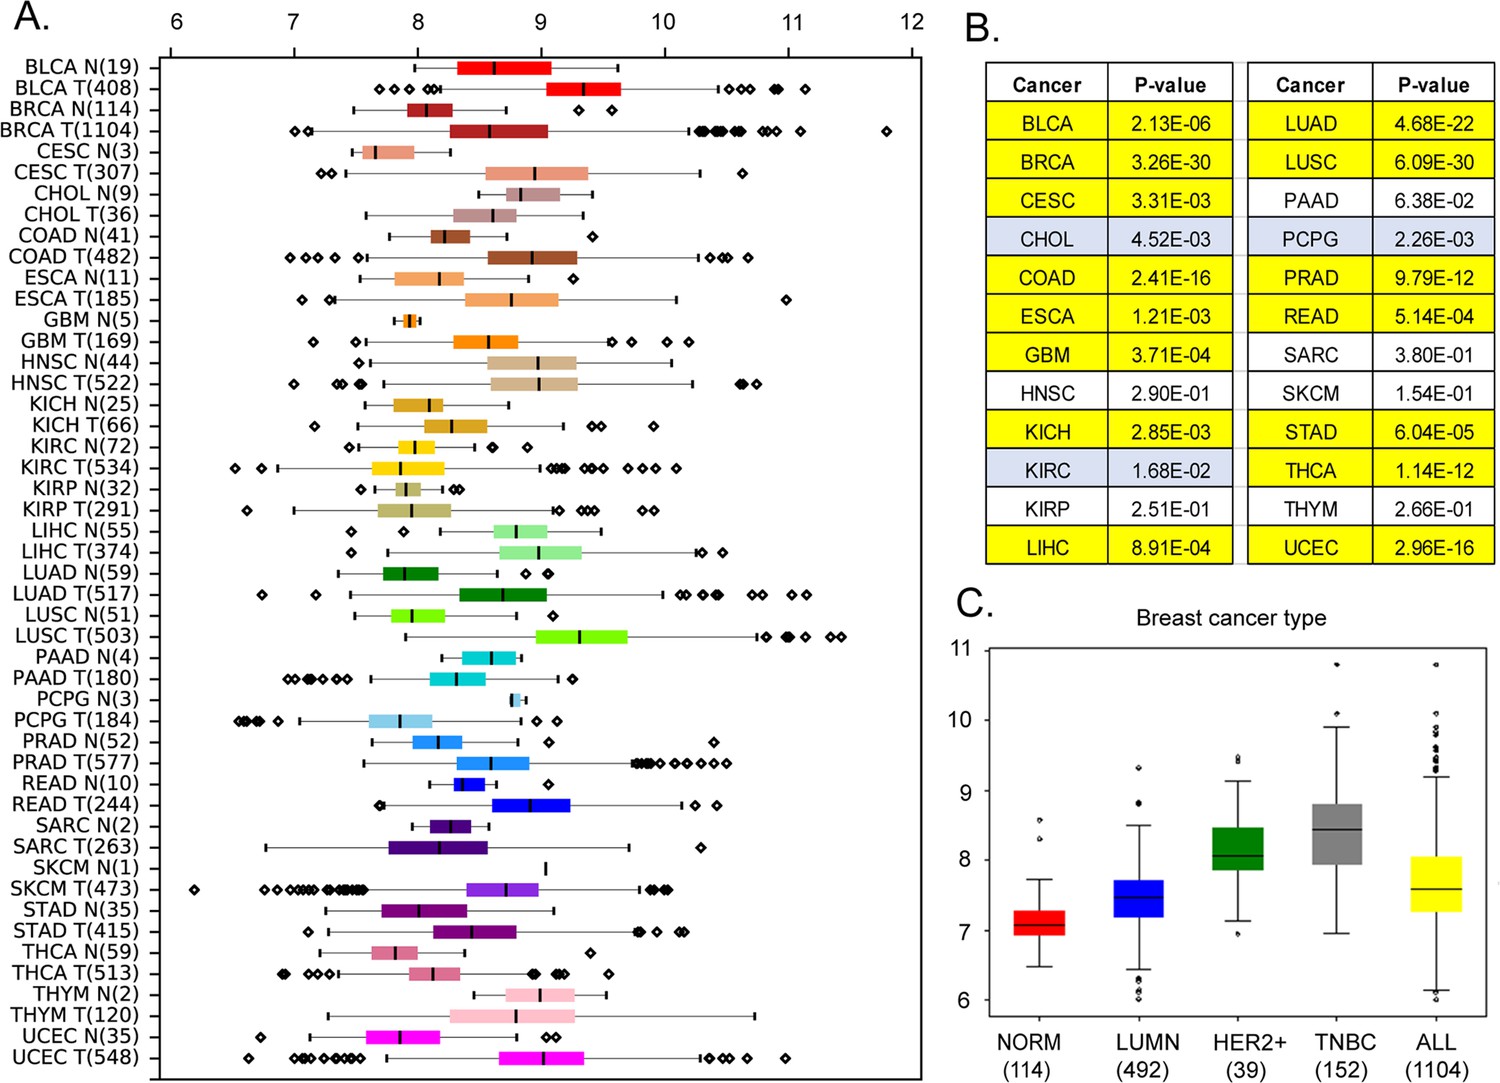
Expression levels of MEMO1 in tumors and corresponding normal tissue in various malignancies.
The data is from The Cancer Genome Atlas (TCGA) database (https://www.cancer.gov/tcga). (A) Tissue profile of MEMO1 expression in cancer. Standard TCGA cancer type abbreviations are used (BRCA – breast cancer, SKCM – melanoma). (B) Statistically significant differences in MEMO1 expression levels between the tumors and the corresponding normal tissue (p<0.05 by Mann-Whitney U-test) are highlighted in yellow (higher expression in tumors) or blue (lower expression in tumors). (C) Subtype analysis of MEMO1 expression in breast cancer, including luminal (blue), HER2 positive (green), and triple-negative breast cancer (TNBC, gray). All differences vs. normal breast tissue (red) are highly significant (p<10–17). Note the logarithmic scale (RSEM log2) on the transcript level axis in A and C.
-
Figure 1—source data 1
MEMO1 expression in various cancers compared to normal tissue.
- https://cdn.elifesciences.org/articles/86354/elife-86354-fig1-data1-v2.xlsx
Figure 1—figure supplement 1
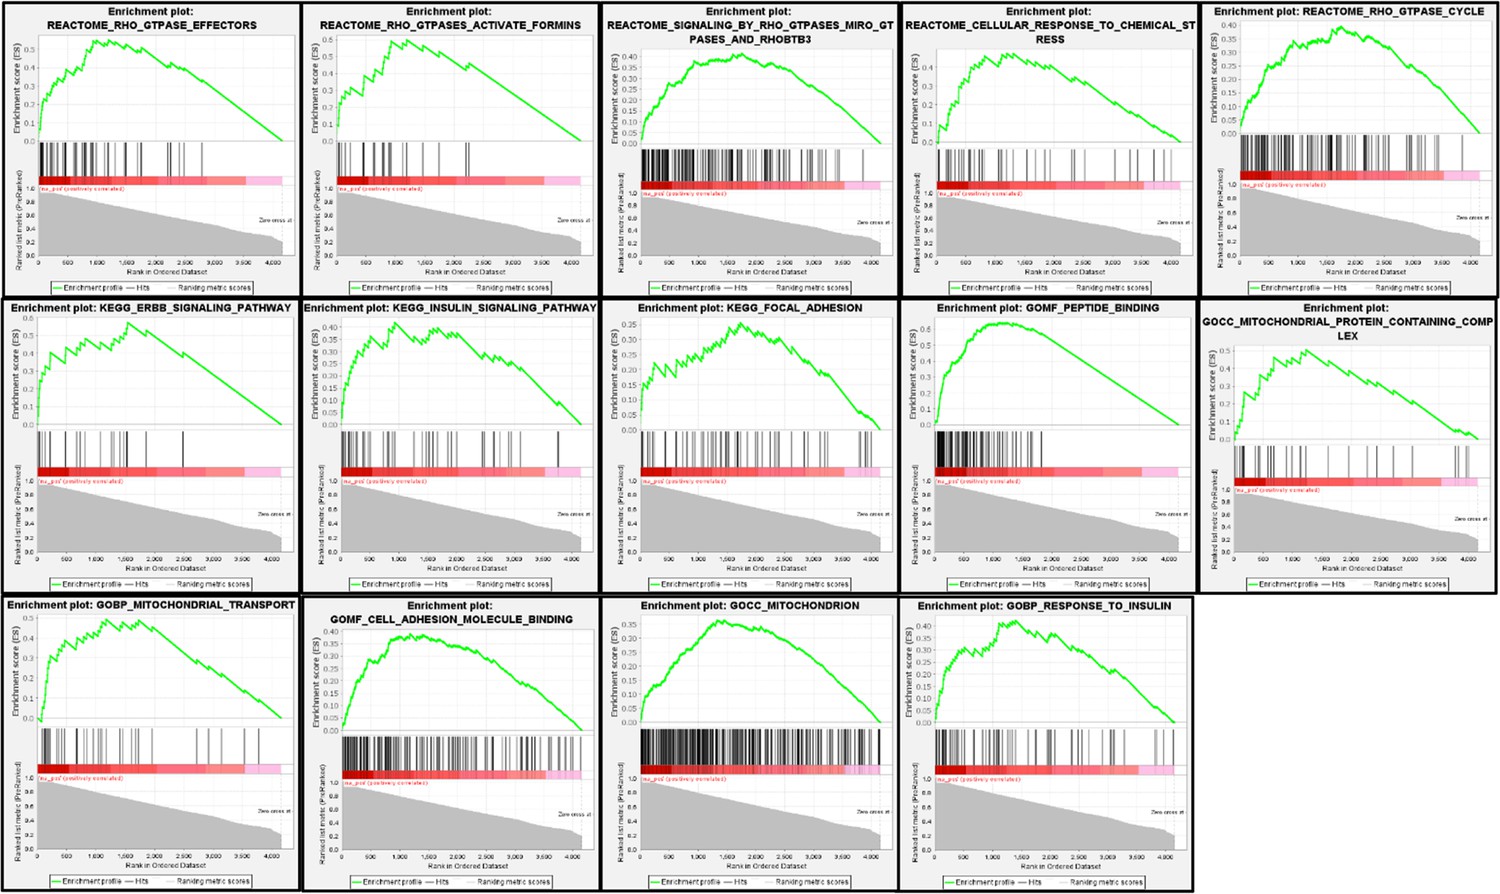
Enrichment plots for MEMO1 loss-of-function genetic interaction hits.
Figure 1—figure supplement 2
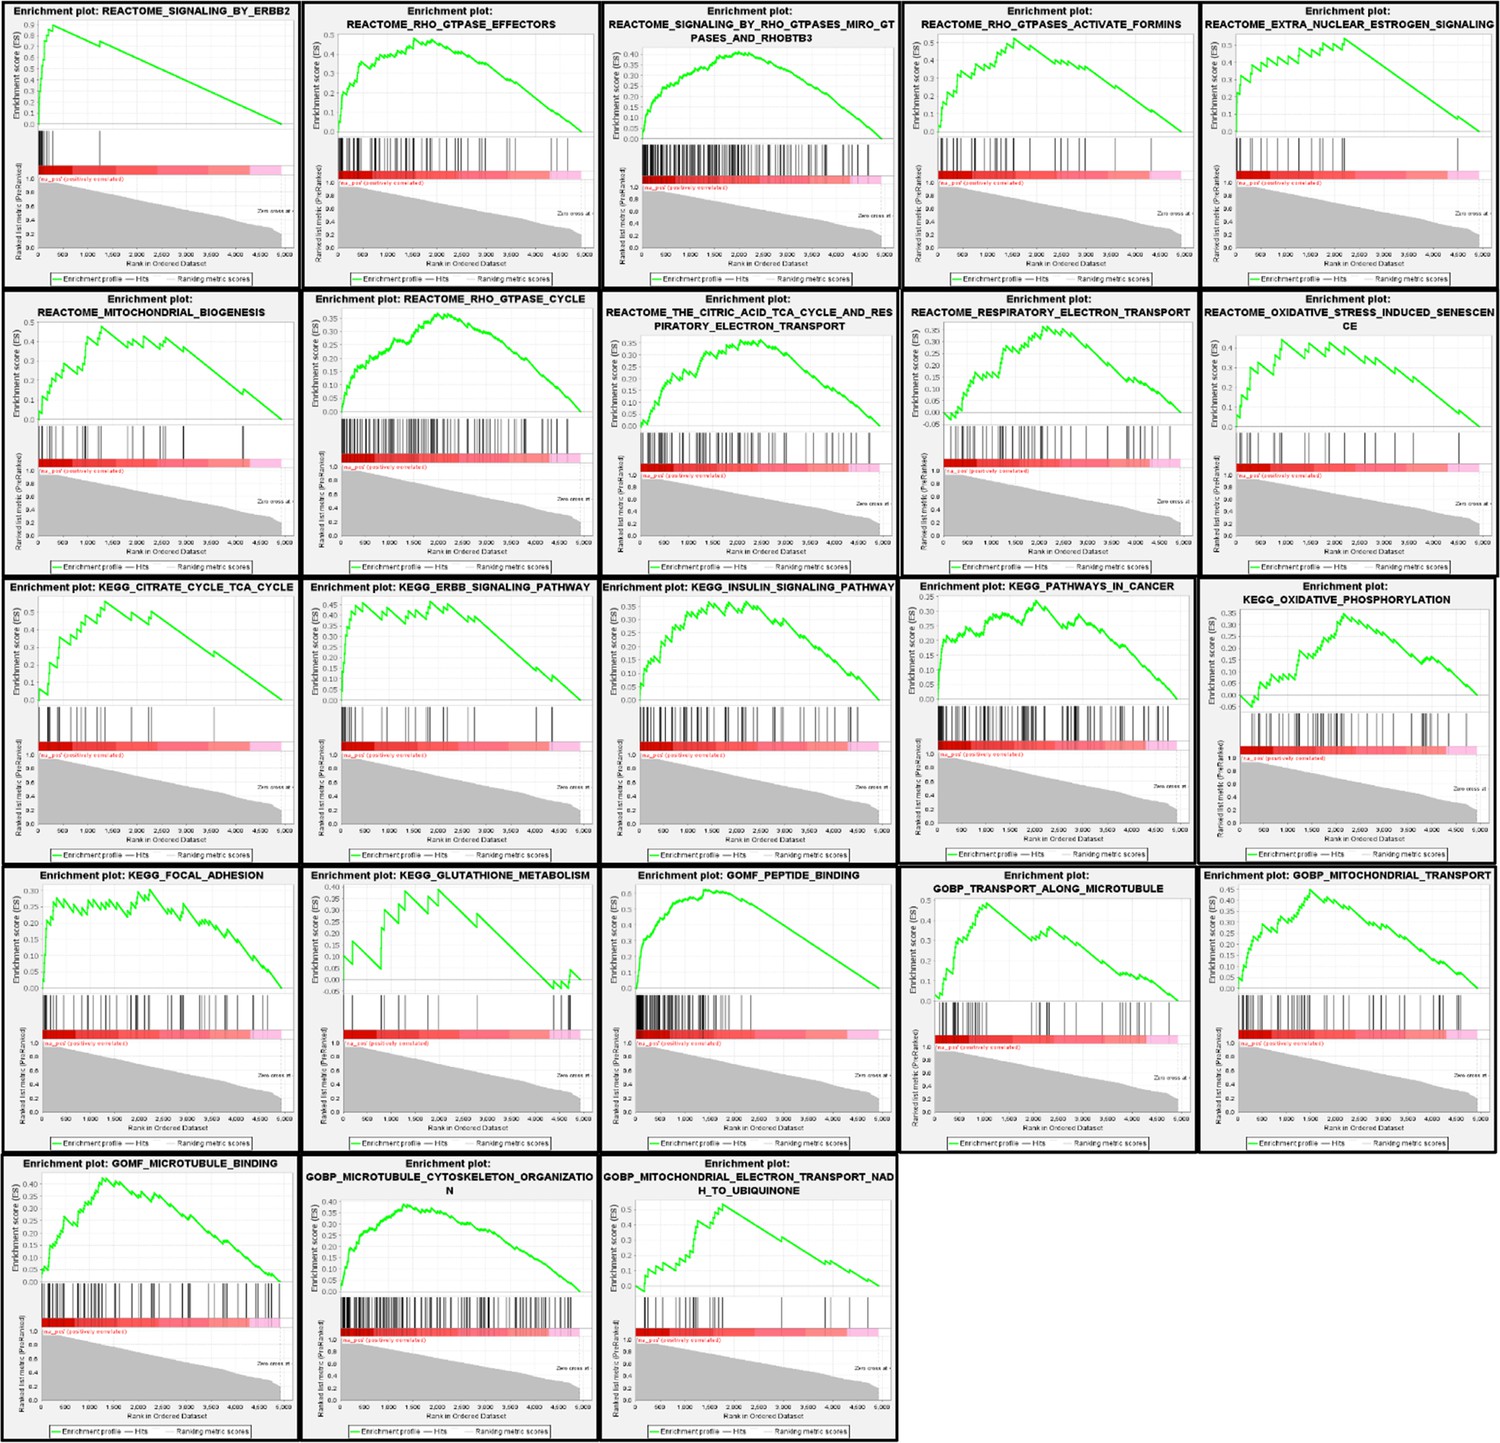
Enrichment plots for MEMO1 gain-of-function genetic interactions hits.
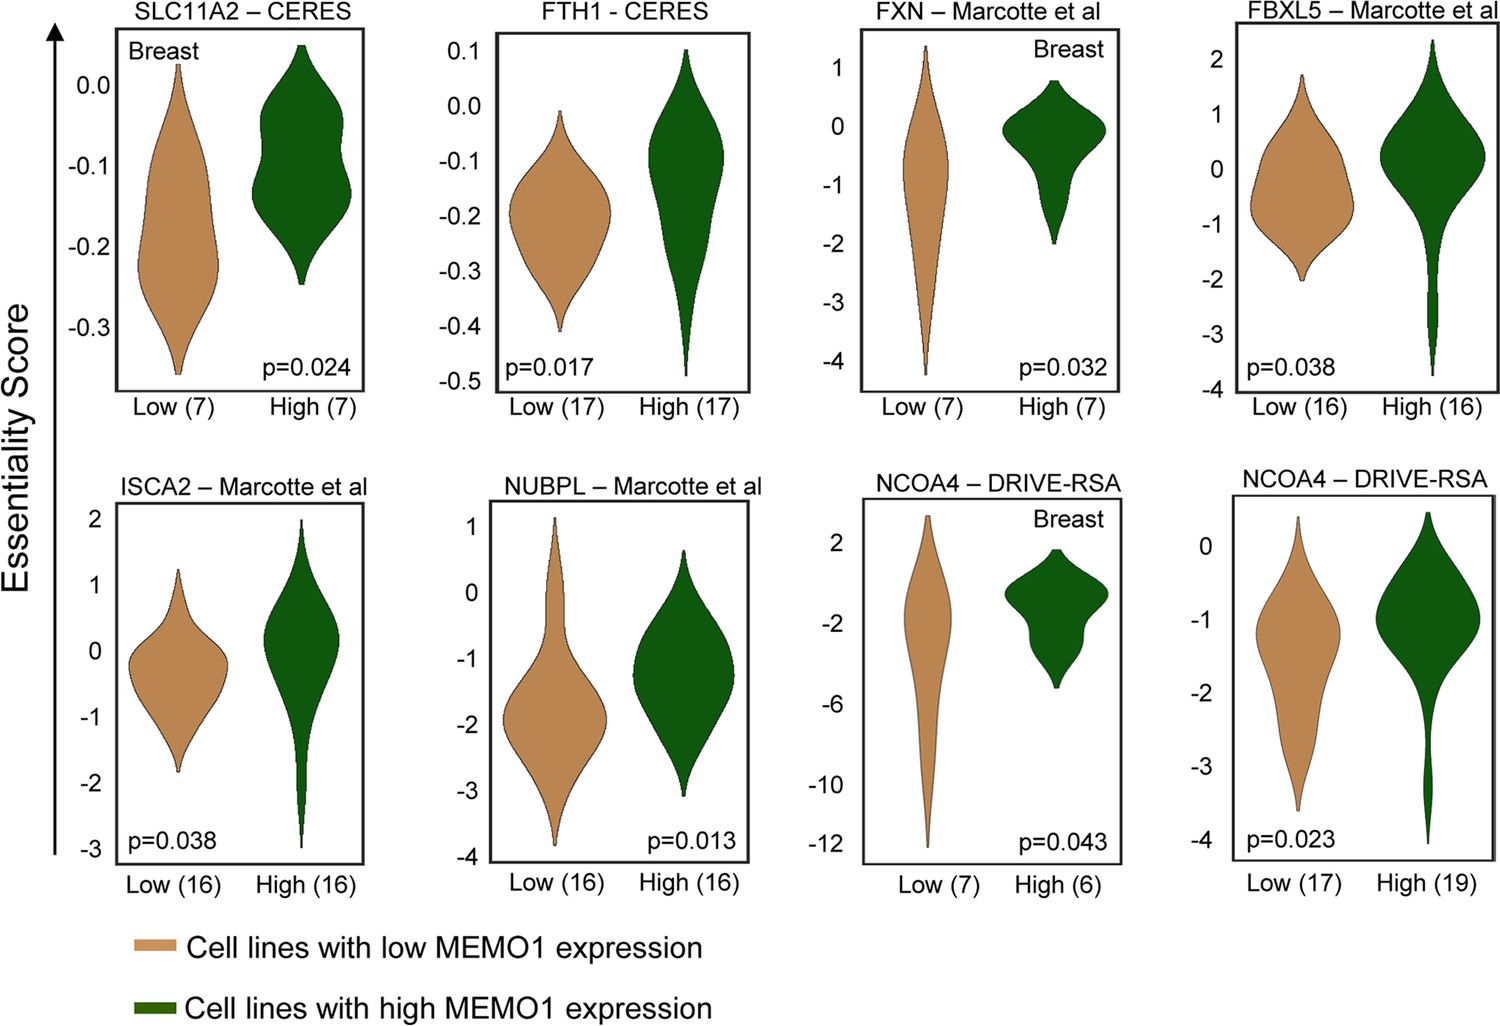
Figure 1—figure supplement 3
Iron-related genes exhibiting gain-of-function (GOF) interactions with MEMO1.
Gene essentiality score distribution in the low- and high-MEMO1 expressing groups with the number of cell lines in each group is shown (Supplementary file 1A).
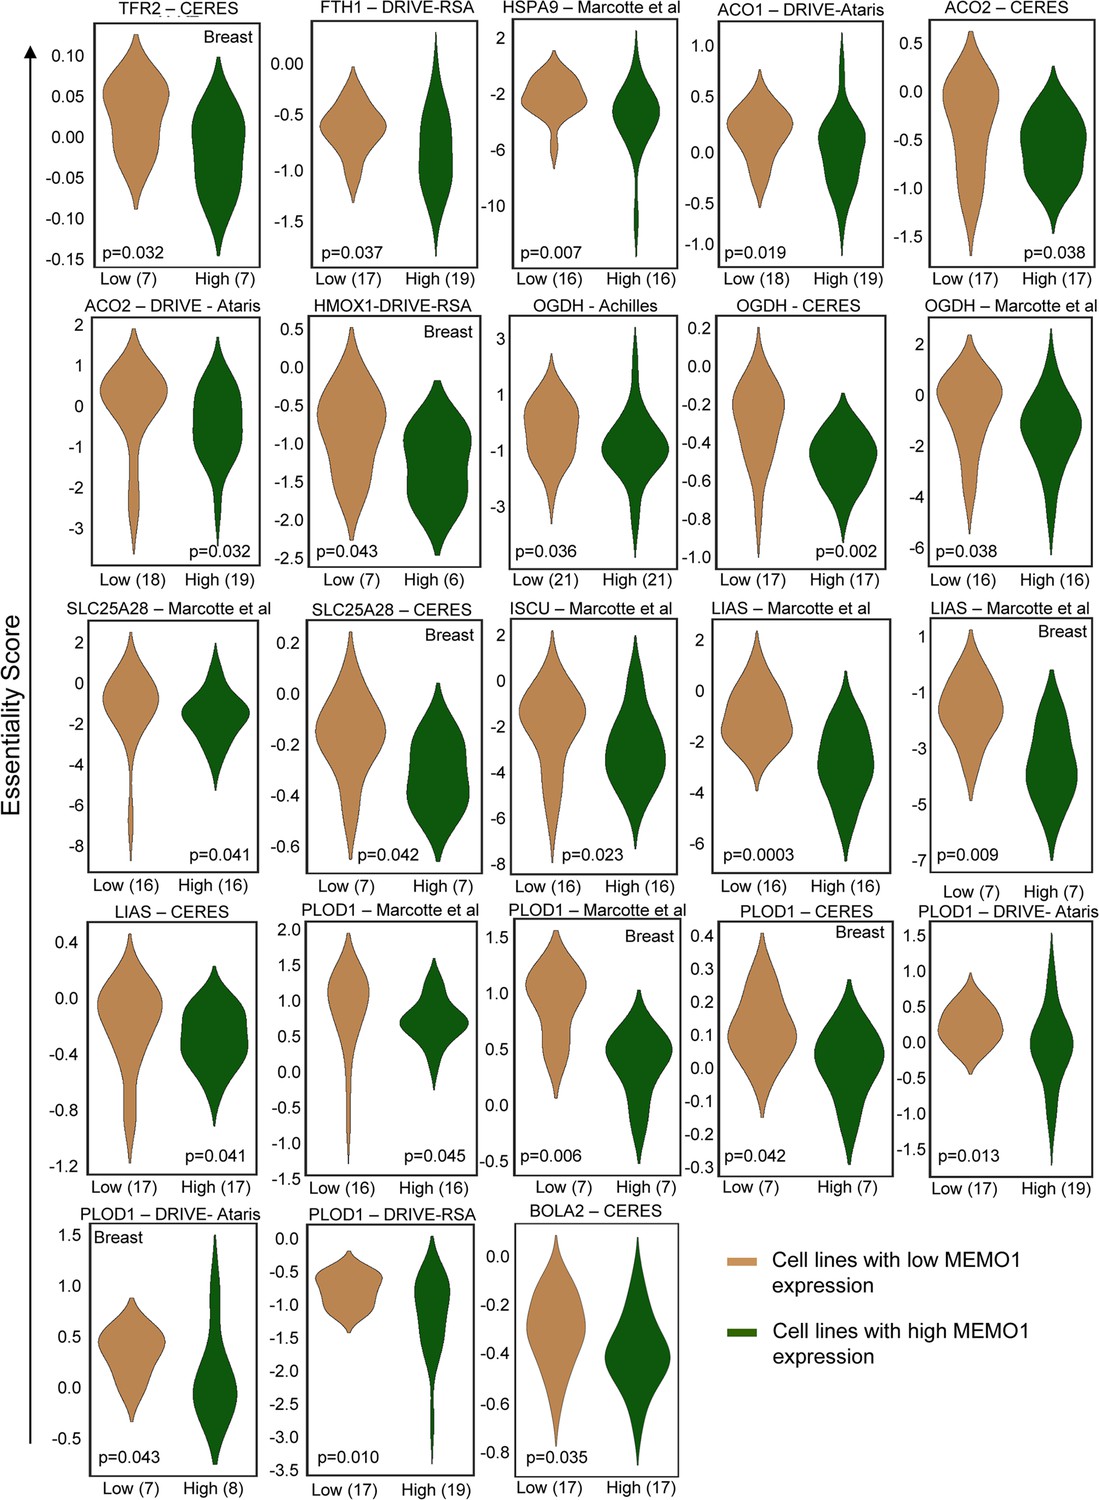
Figure 1—figure supplement 4
Iron-related genes exhibiting loss-of-function (LOF) interactions with MEMO1.
Gene essentiality score distribution in the low- and high-MEMO1 expressing groups with the number of cell lines in each group is shown (Supplementary file 1B).
Figure 1—figure supplement 5
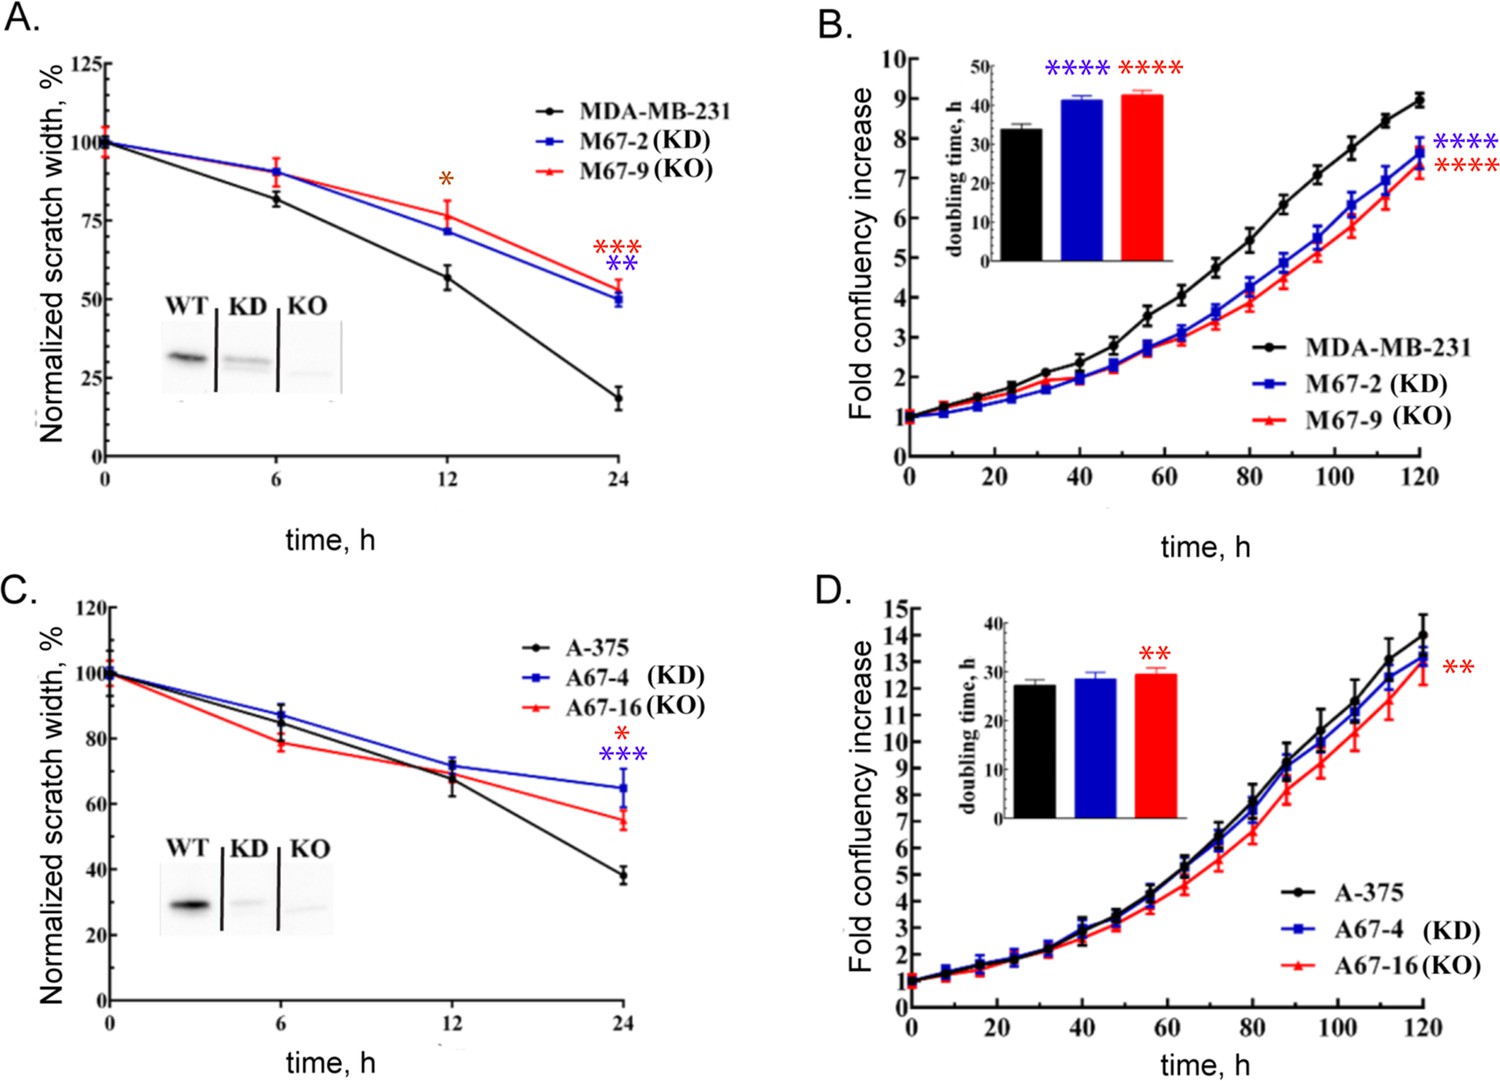
MEMO1 knockout and knockdown in breast cancer and melanoma cell lines result in decrease in cellular motility and cell growth rate.
(A) Wound healing assay for breast cancer cell lines MDA-MB-231 (parental), M67-2 (MEMO1 knockdown), and M67-9 (MEMO1 knockout). MEMO1 western blots demonstrating MEMO1 expression levels in the parental cell line (WT) and in the CRISPR/Cas9 knockdown (KD) and knockout (KO) are shown in the inset. (B) Growth curves of MDA-MB-231, M67-2, and M67-9 cells. (C) Wound healing assay for A-375, A67-4 (MEMO1 knockdown), and A67-16 (MEMO1 knockout) cells. MEMO1 western blots demonstrating MEMO1 expression levels in the parental cell line (WT) and in the CRISPR/Cas9 knockdown (KD) and knockout (KO) are shown in the inset. (D) Growth curves of A-375, A67-4, and A-67-16 cells. Statistically significant differences, KD (blue) and KO (red) vs. the parental cell line are shown (* for p<0.05, ** for p<0.01, *** for p<0.001, and **** for p<0.0001).
Figure 2 with 5 supplements
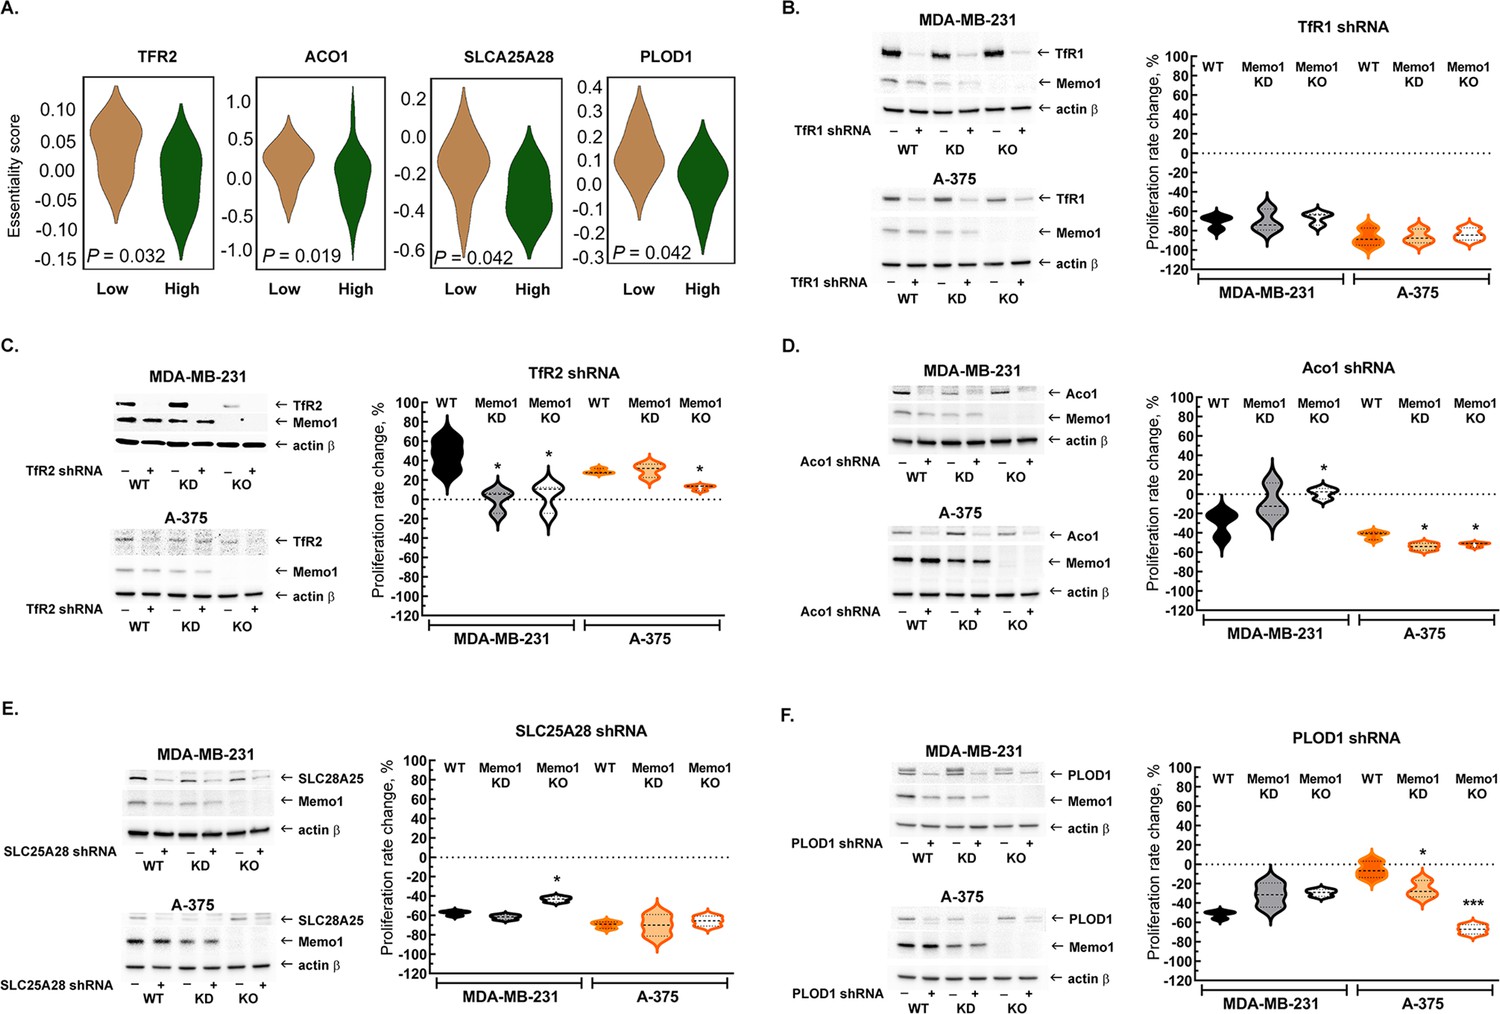
Interactions between MEMO1 and iron-related genes.
(A) Gene essentiality score distribution for the selected genes in the high- and low-MEMO1 expressing groups in multiple cancer cell lines as shown by the database analysis (Supplementary file 1A). A negative essentiality score indicates decreased cell proliferation with the gene knockdown or knockout compared to the control, a positive score indicates no effect. Effects of the TFR1 (B), TFR2 (C), ACO1 (D), SLC25A28 (E), and PLOD1 (F) shRNA knockdowns at different MEMO1 expression levels (WT – parental cell line, KD – MEMO1 knockdown, KO – MEMO1 knockout). Protein levels were detected by western blot (left panels). The relative shRNA effect on cell proliferation (right panels) is expressed as the difference between the proliferation rates with the shRNA targeting the gene of interest and the control shRNA (against the red fluorescent protein) divided by the proliferation rate with the control shRNA. Statistically significant differences vs. WT are marked (* for p<0.05 and *** for p˂0.001).
Figure 2—figure supplement 1
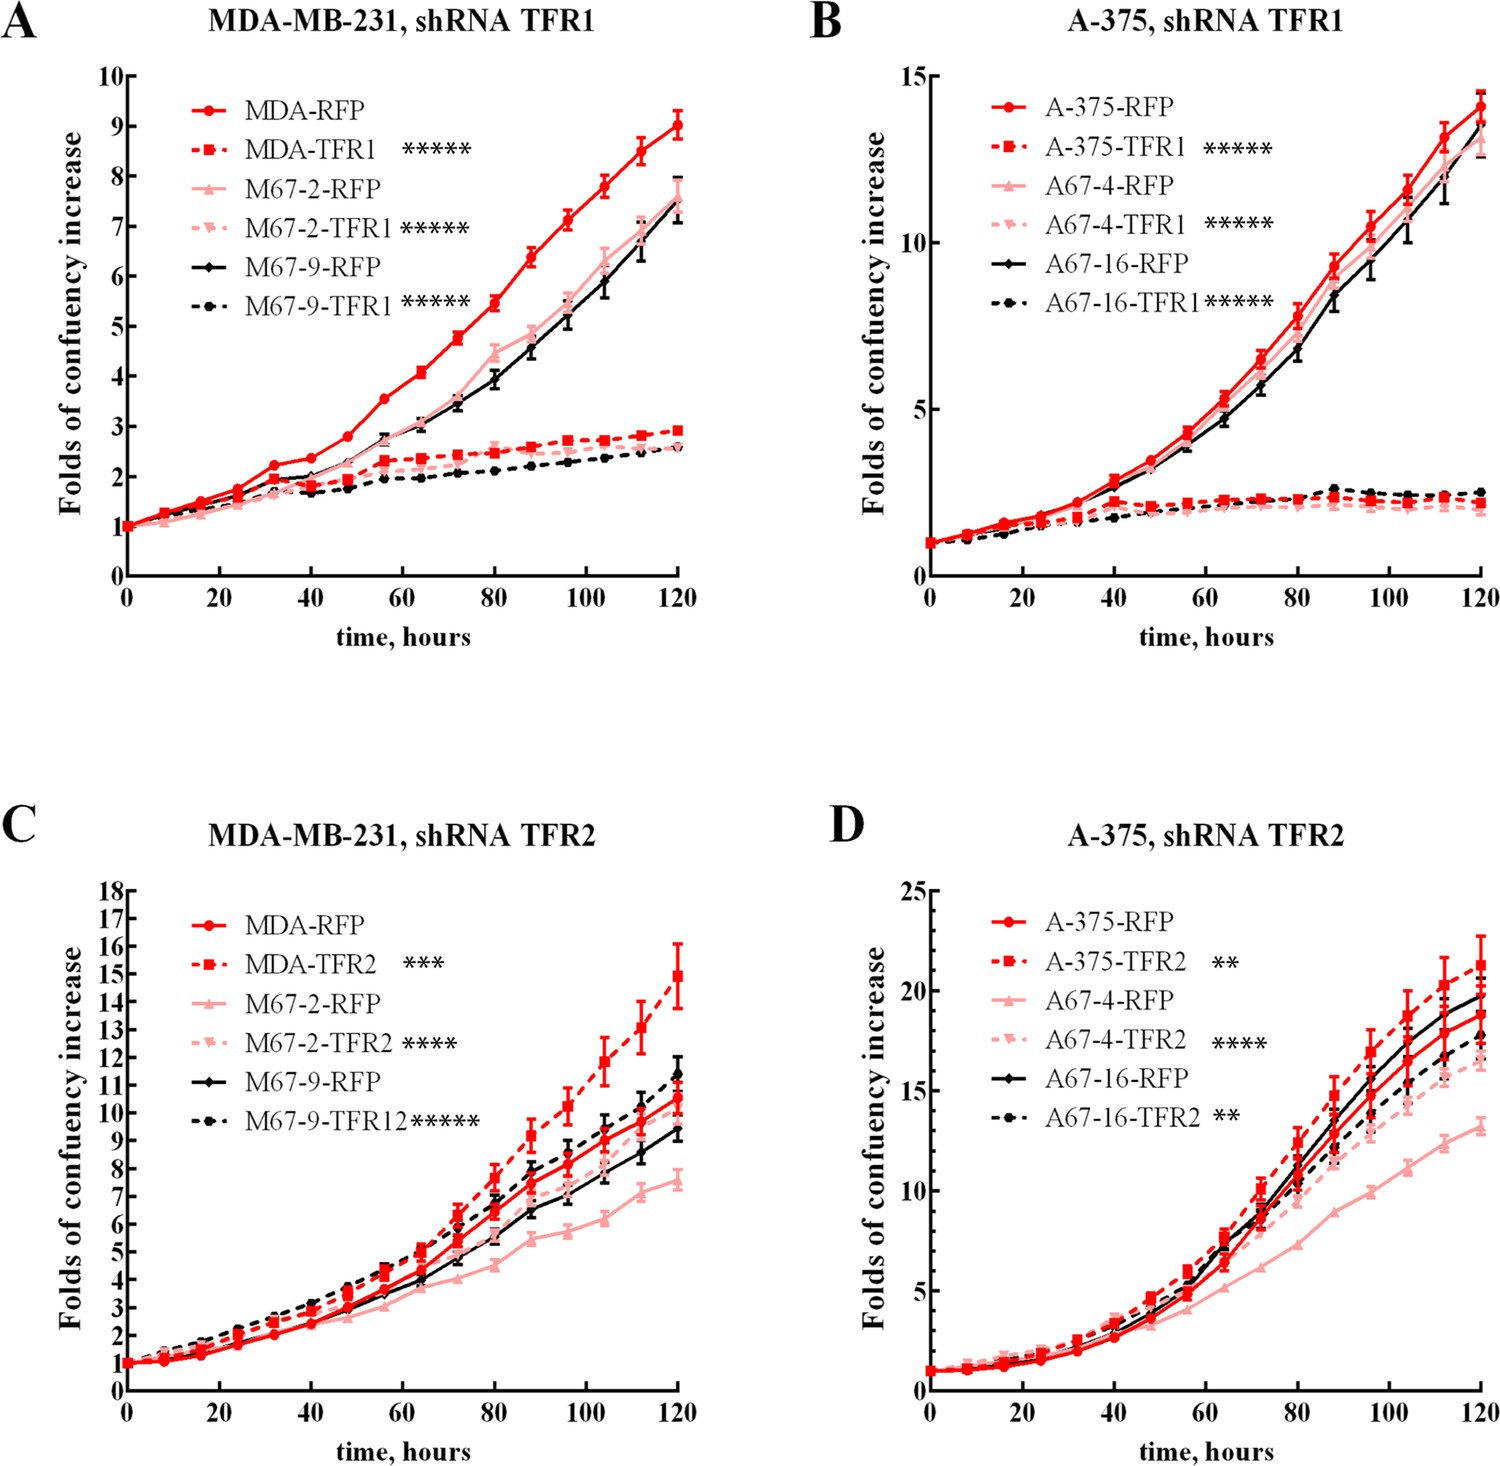
Proliferation of TFR1 and TFR2 knockdowns cell lines.
Growth curves of MDA-MB-231 (A, C) and A-375 (B, D) with high expression of MEMO1 (MDA-RFP and A-375-RFP, red solid lines), low expression of MEMO1 (M67-2-RFP and A67-4-RFP, pink solid lines), and no MEMO1 expression (M67-9-RFP and A67-16-RFP black solid lines), in comparison with the same cell lines transduced with TFR1 (A, B) or TFR2 (C, D) shRNA (corresponding dashed lines). Statistically significant differences at 120 hr, TFR1 or TFR vs. RFP shRNA, are marked (* for p<0.05, ** for p<0.01, *** for p˂0.001, **** for p˂0.0001, and ***** for p˂0.00001).
Figure 2—figure supplement 2
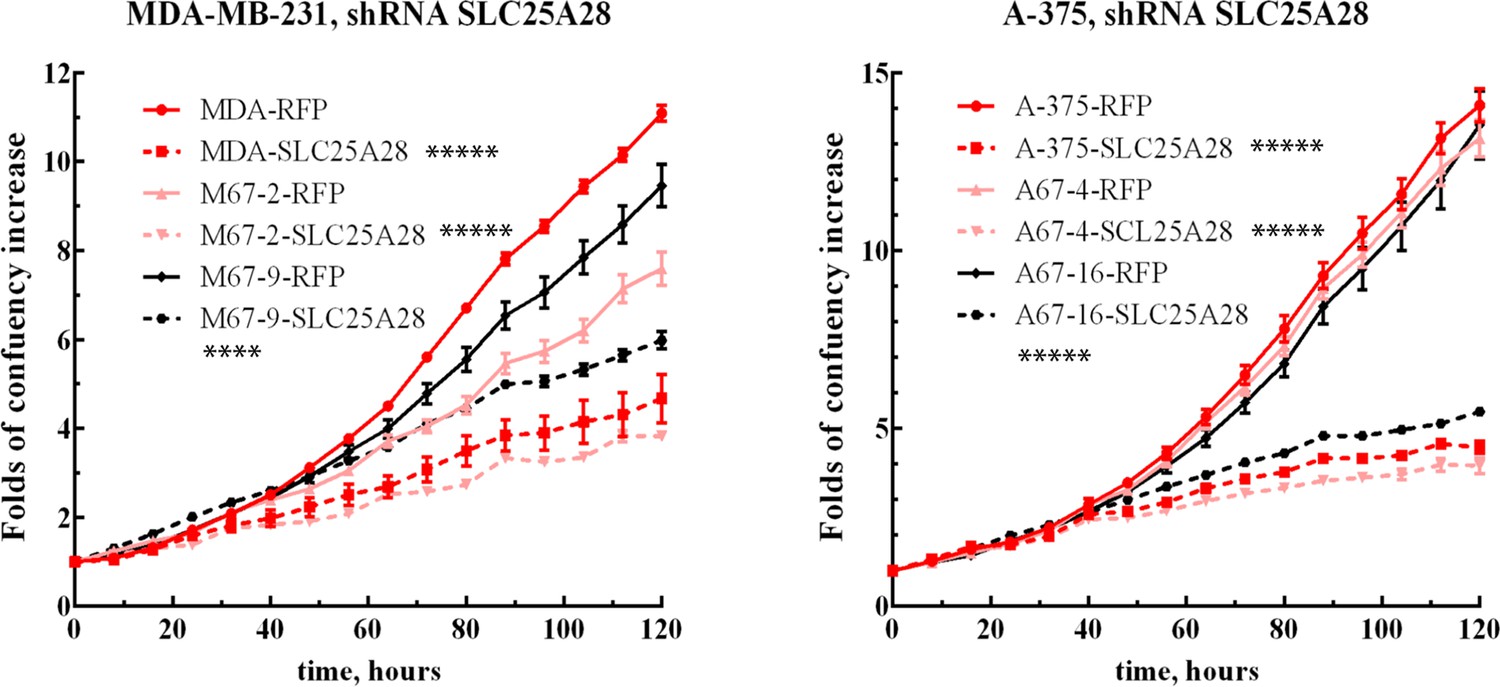
Proliferation of SLC25A28 knockdown cell lines.
Growth curves of MDA-MB-231 and A-375 with high expression of MEMO1 (MDA-RFP and A-375-RFP, red solid lines), low expression of MEMO1 (M67-2-RFP and A67-4-RFP, pink solid lines), and no MEMO1 expression (M67-9-RFP and A67-16-RFP black solid lines), in comparison with these cell lines transduced with SLC25A28 shRNA. Statistically significant differences at 120 hr, SLC25A28 vs. RFP shRNA, are marked (**** for p˂0.0001 and ***** for p˂0.00001).
Figure 2—figure supplement 3
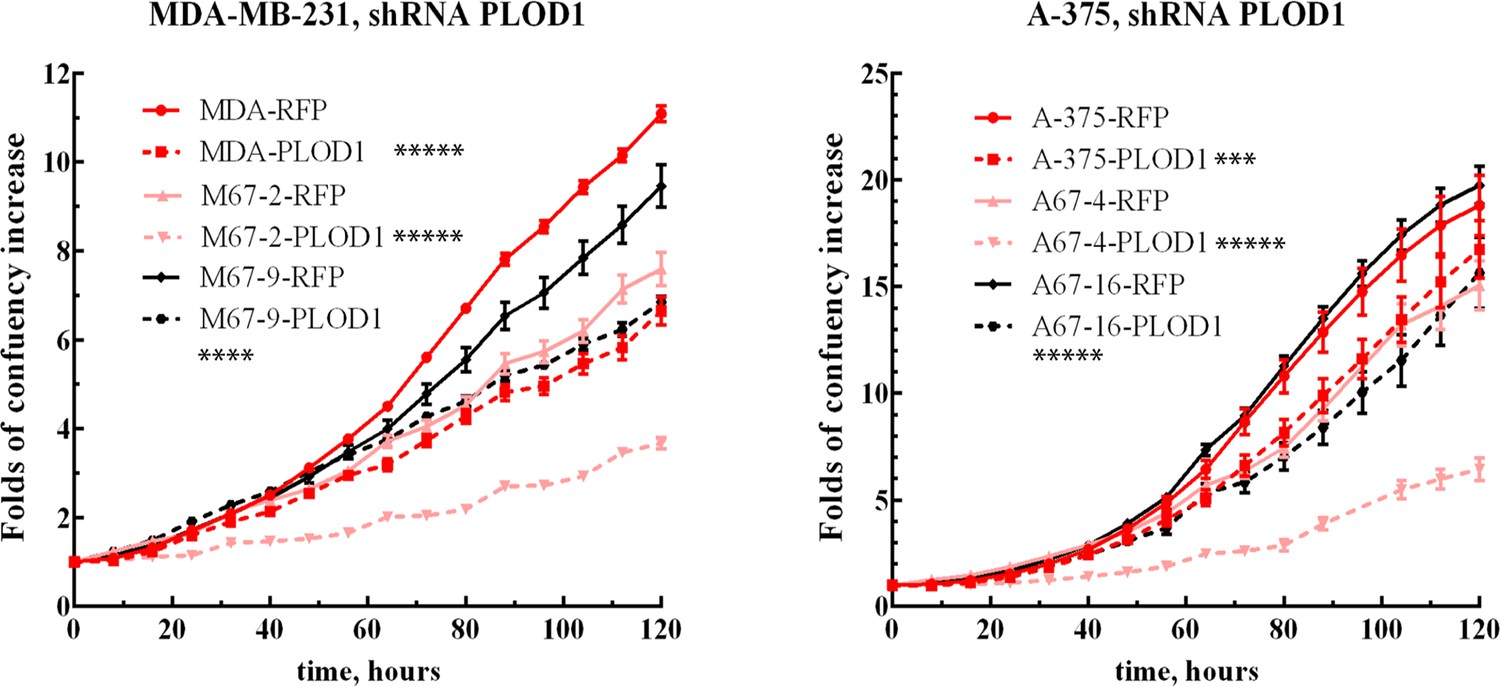
Proliferation of PLOD1 knockdown cell lines.
Growth curves of MDA-MB-231 and A-375 with high expression of MEMO1 (MDA-RFP and A-375-RFP, red solid lines), low expression of MEMO1 (M67-2-RFP and A67-4-RFP, pink solid lines), and no MEMO1 expression (M67-9-RFP and A67-16-RFP black solid lines), in comparison with these cell lines transduced with PLOD1 shRNA (corresponding dashed lines). Statistically significant differences at 120 hr, PLOD1 vs. RFP shRNA, are marked (*** for p˂0.001, **** for p˂0.0001, and ***** for p˂0.00001 ).
Figure 2—figure supplement 4

Proliferation of HSPA9 knockdown cell lines.
Growth curves of MDA-MB-231 (A) and A-375 (B) with high expression of MEMO1 (MDA-RFP and A-375-RFP, red solid lines), low expression of MEMO1 (M67-2-RFP and A67-4-RFP, pink solid lines), and no MEMO1 expression (M67-9-RFP and A67-16-RFP black solid lines), in comparison with these cell lines transduced with HSPA9 shRNA (corresponding dashed lines). Statistically significant differences at 120 hr, HSPA9 vs. RFP shRNA, are marked (**** for p˂0.0001 and ***** for p˂0.00001).
Figure 2—figure supplement 5
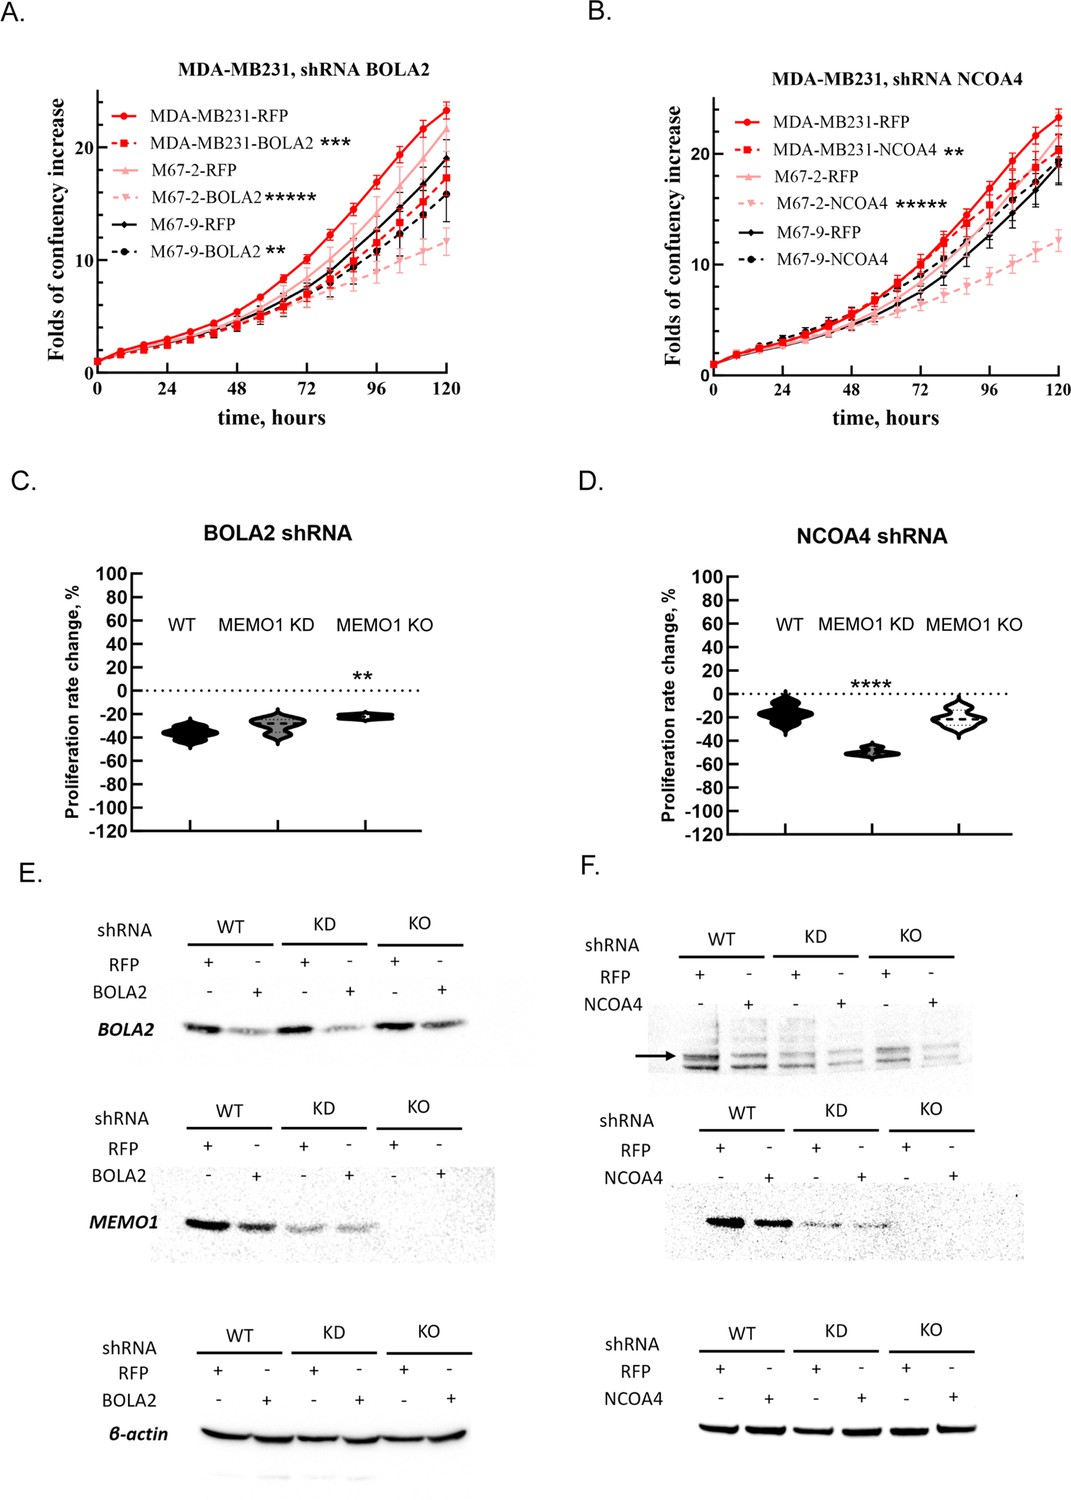
Proliferation of BOLA2 and NCOA4 knockdown cell lines.
Growth curves of MDA-MB-231 with high expression of MEMO1 (MDA-MB-231, red solid lines), low expression of MEMO1 (M67-2 pink solid lines), and no MEMO1 expression (M67-9, black solid lines), in comparison with these cell lines transduced with either BOLA2 shRNA (A) or NCOA4 shRNA (B) (corresponding dashed lines). Statistically significant differences at 120 hr, BOLA2 or NCOA4 shRNA vs. RFP shRNA, are marked (** for p<0.01, *** for p<0.01, **** for p˂0.0001, and ***** for p˂0.00001). The relative shRNA effect on cell proliferation (C, D) is expressed as the difference between the proliferation rates with the shRNA targeting the gene of interest and the control shRNA (against the red fluorescent protein) divided by the proliferation rate with the control shRNA. Statistically significant differences vs. WT are marked (** for p<0.01 and **** for p˂0.0001). Protein levels (E, F) were detected by western blot. The arrow indicates the NCOA4 band.
Figure 3 with 1 supplement
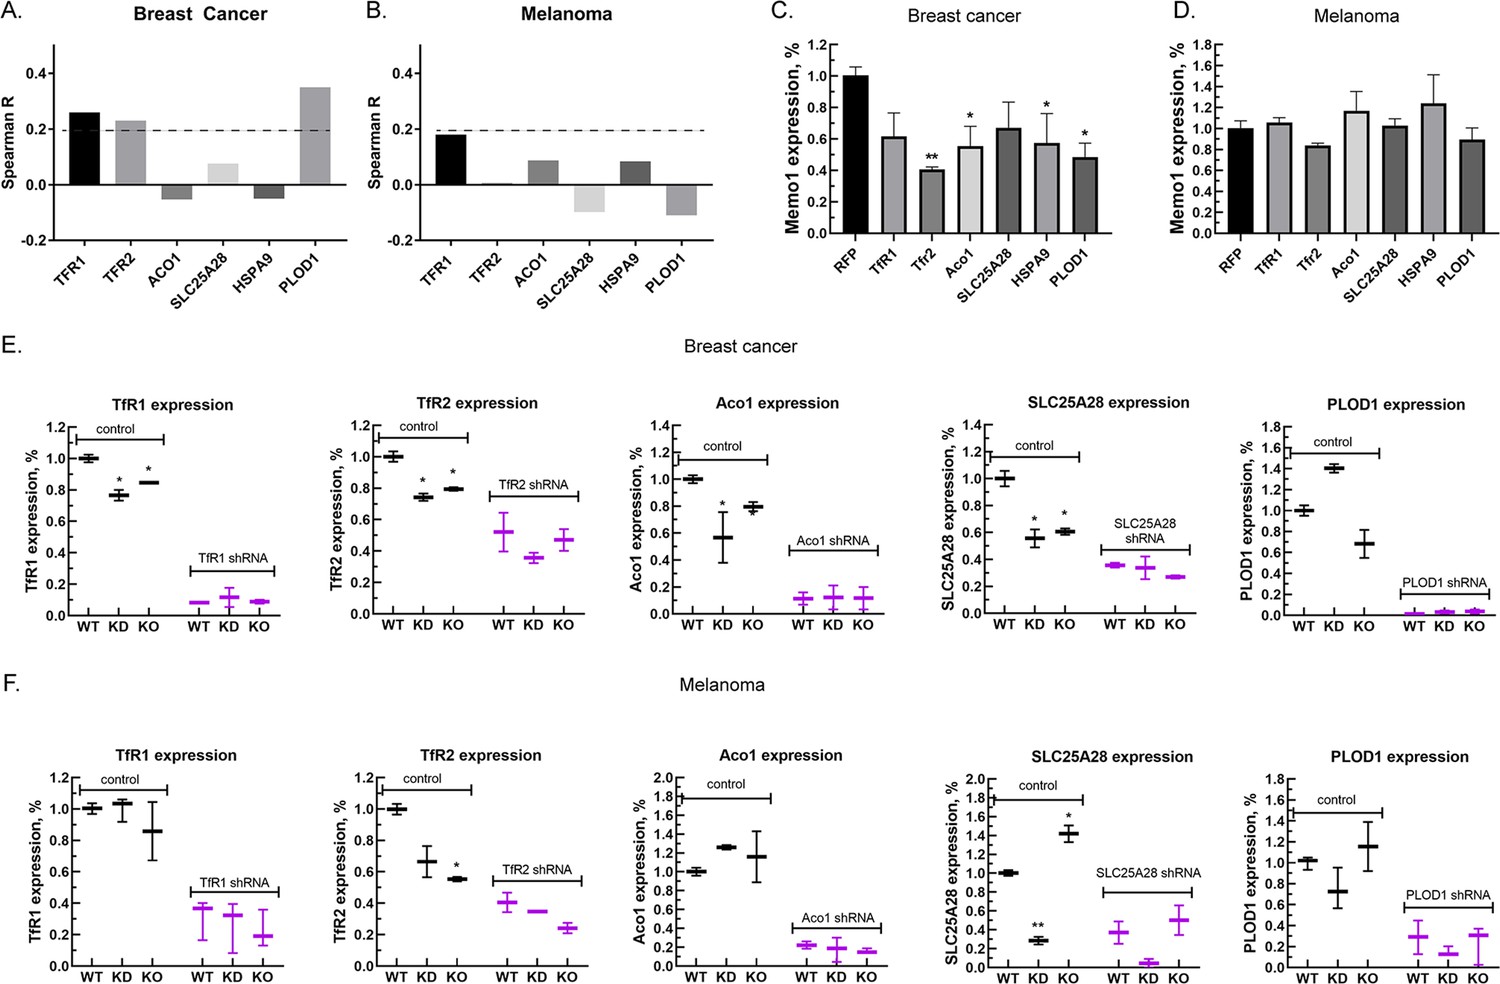
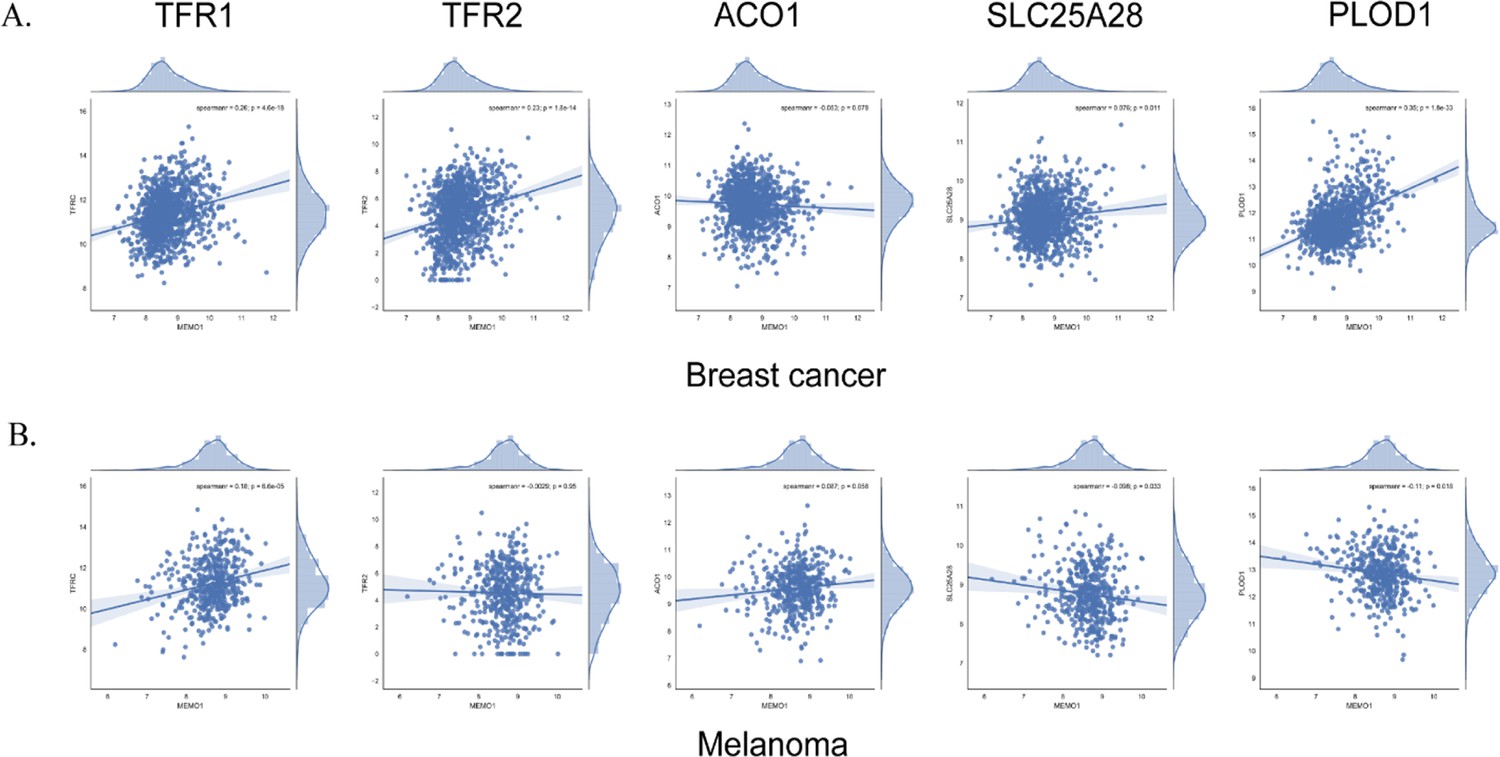
Relationship between the expression levels of MEMO1 and iron-related proteins in breast cancer and melanoma.
(A, B) Correlations between the expression levels of MEMO1 and selected iron-related proteins in multiple breast cancer (A) and melanoma (B) cell lines ( Figure 3—figure supplement 1) as measured by Spearman’s rank-order correlation coefficient. The dashed line indicates R=0.2 (C, D). Effect of the selected iron-related shRNA gene knockdowns on MEMO1 levels in breast cancer (C) and melanoma (D) cell lines detected by western blot analysis (Figure 2B–F). (E, F) Levels of the selected iron-related proteins at various MEMO1 expression levels in breast cancer (E) and melanoma (F) detected by western blot analysis in control (shRNA against the red fluorescent protein) and with the shRNA targeting the gene of interest. The data in panels C–F includes the representative blots shown in Figure 2B–F. Statistically significant differences vs. WT are marked (* for p<0.05 and ** for p˂0.01).
Figure 3—figure supplement 1
Correlation between the expression levels of MEMO1 and other iron-related proteins in breast cancer (A) and melanoma (B) cell lines.
Figure 4 with 2 supplements
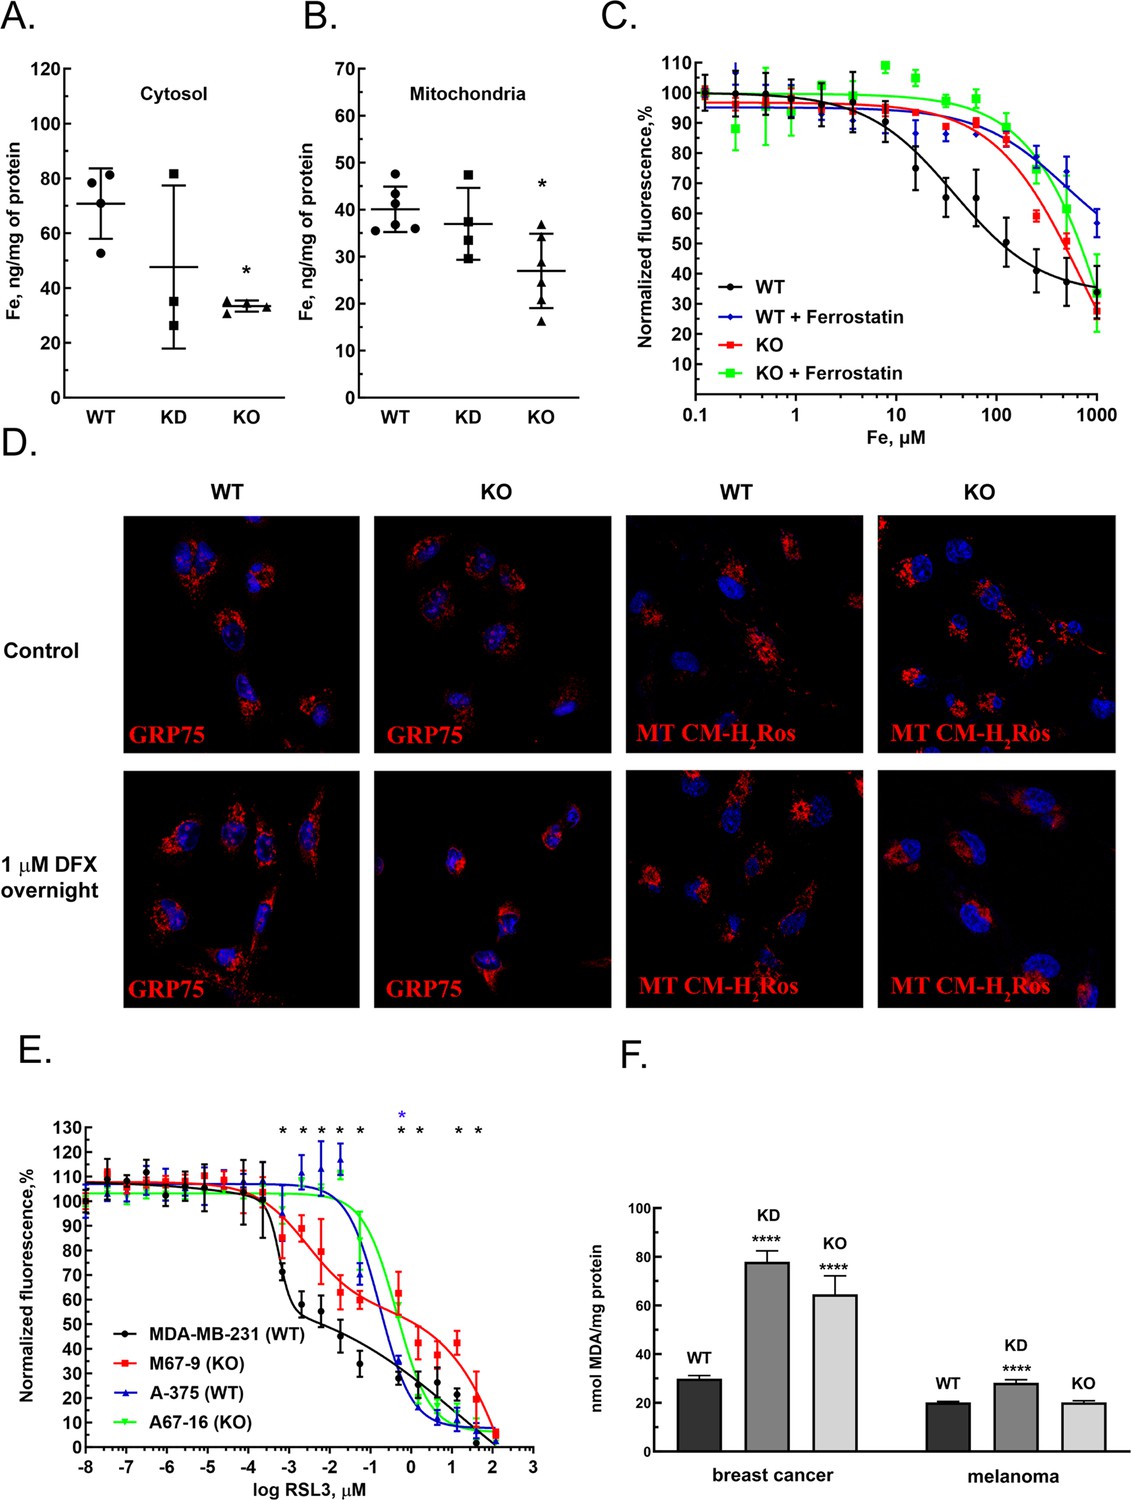
MEMO1 expression affects iron levels, mitochondrial morphology, and ferroptosis sensitivity of the cells.
(A, B) Iron levels in the cytosolic (A) and mitochondrial (B) fractions from breast cancer cells with high (parental, WT), low (knockdown, KD), and no (knockout, KO) MEMO1 expression. Statistically significant differences vs. WT are marked (* for p<0.05). (C) Cell viability, measured by resazurin fluorescence as a function of iron concentration, added as ferric citrate, with and without 10 μM ferrostatin-1. (D) MEMO1 knockout in breast cancer cells M67-9 results in perinuclear mitochondrial clustering in the presence of iron chelator deferoxamine (DFX). Mitochondrial marker Grp75 (HSPA9) and MitoTracker CM-H2Ros are red, DAPI-stained nuclei are blue. (E) MEMO1 knockout in breast cancer (M67-9) increases resistance to the ferroptosis inducer RSL3, compared to the parental cell line MDA-MB-231. RSL3 concentrations showing statistically significant difference (p<0.05) are marked with a black (breast cancer) or blue (melanoma) asterisk. (F) Malondialdehyde assay shows lower rates of lipid oxidation in the breast cancer cells with high-MEMO1 expression (WT) compared to cells with MEMO1 knockout (KO) and knockdown (KD) cells. The difference is smaller in melanoma cells. Statistically significant differences vs. WT (p˂0.0001) are marked (****).
Figure 4—figure supplement 1
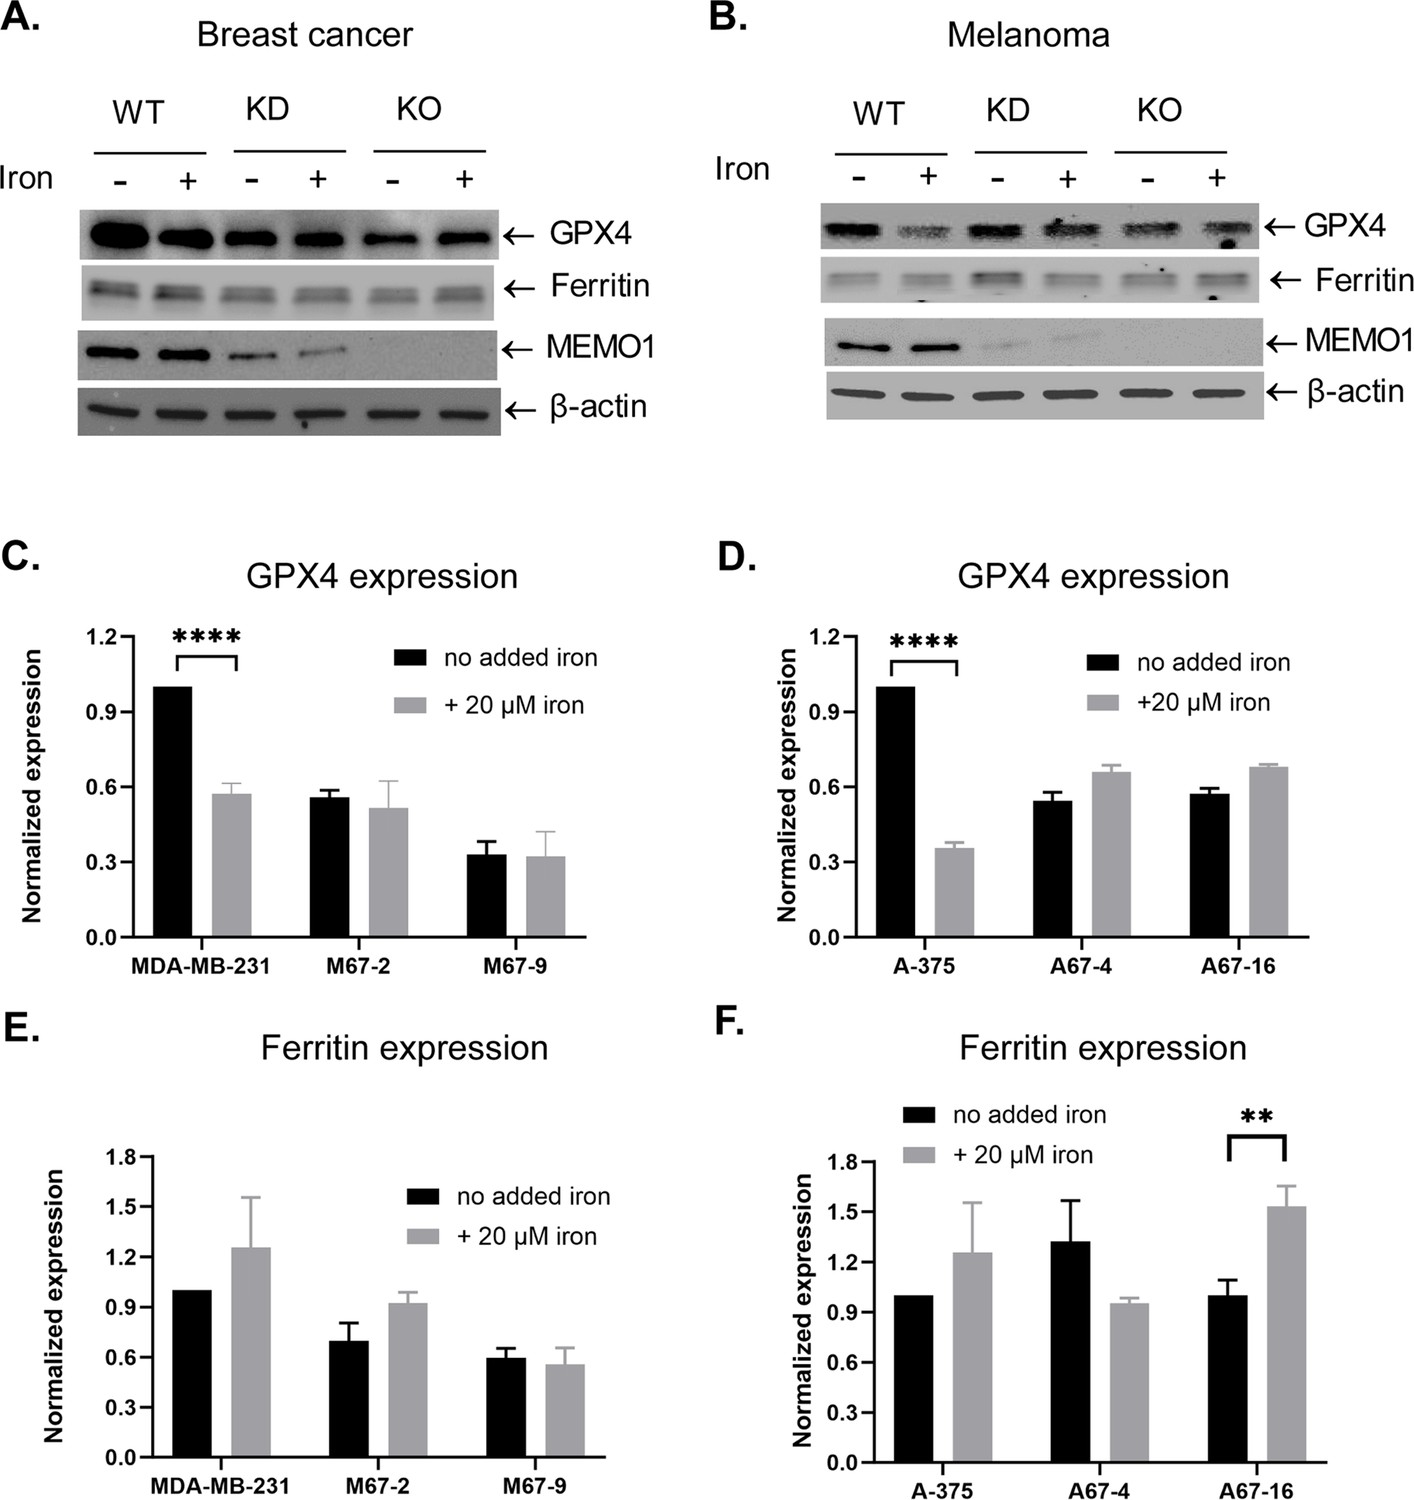
Expression levels of glutathione peroxidase 4 (GPX4) (A–D) and ferritin (A, B, E, F) in the breast cancer cells (A,C,E) and in melanoma cells (B, D, F).
MDA-MB-231 and A-375 are the parental cell lines, M67-2 and A67-4 are knockdowns (KD), and M67-9 and A67-16 are the knockouts (KO). Iron was added to the cell medium as ferric citrate, the cells were incubated for 72 hr and then harvested for western blotting. Statistically significant differences between cells with and without added iron are marked (** for p<0.01 and **** for p<0.0001).
Figure 4—figure supplement 2
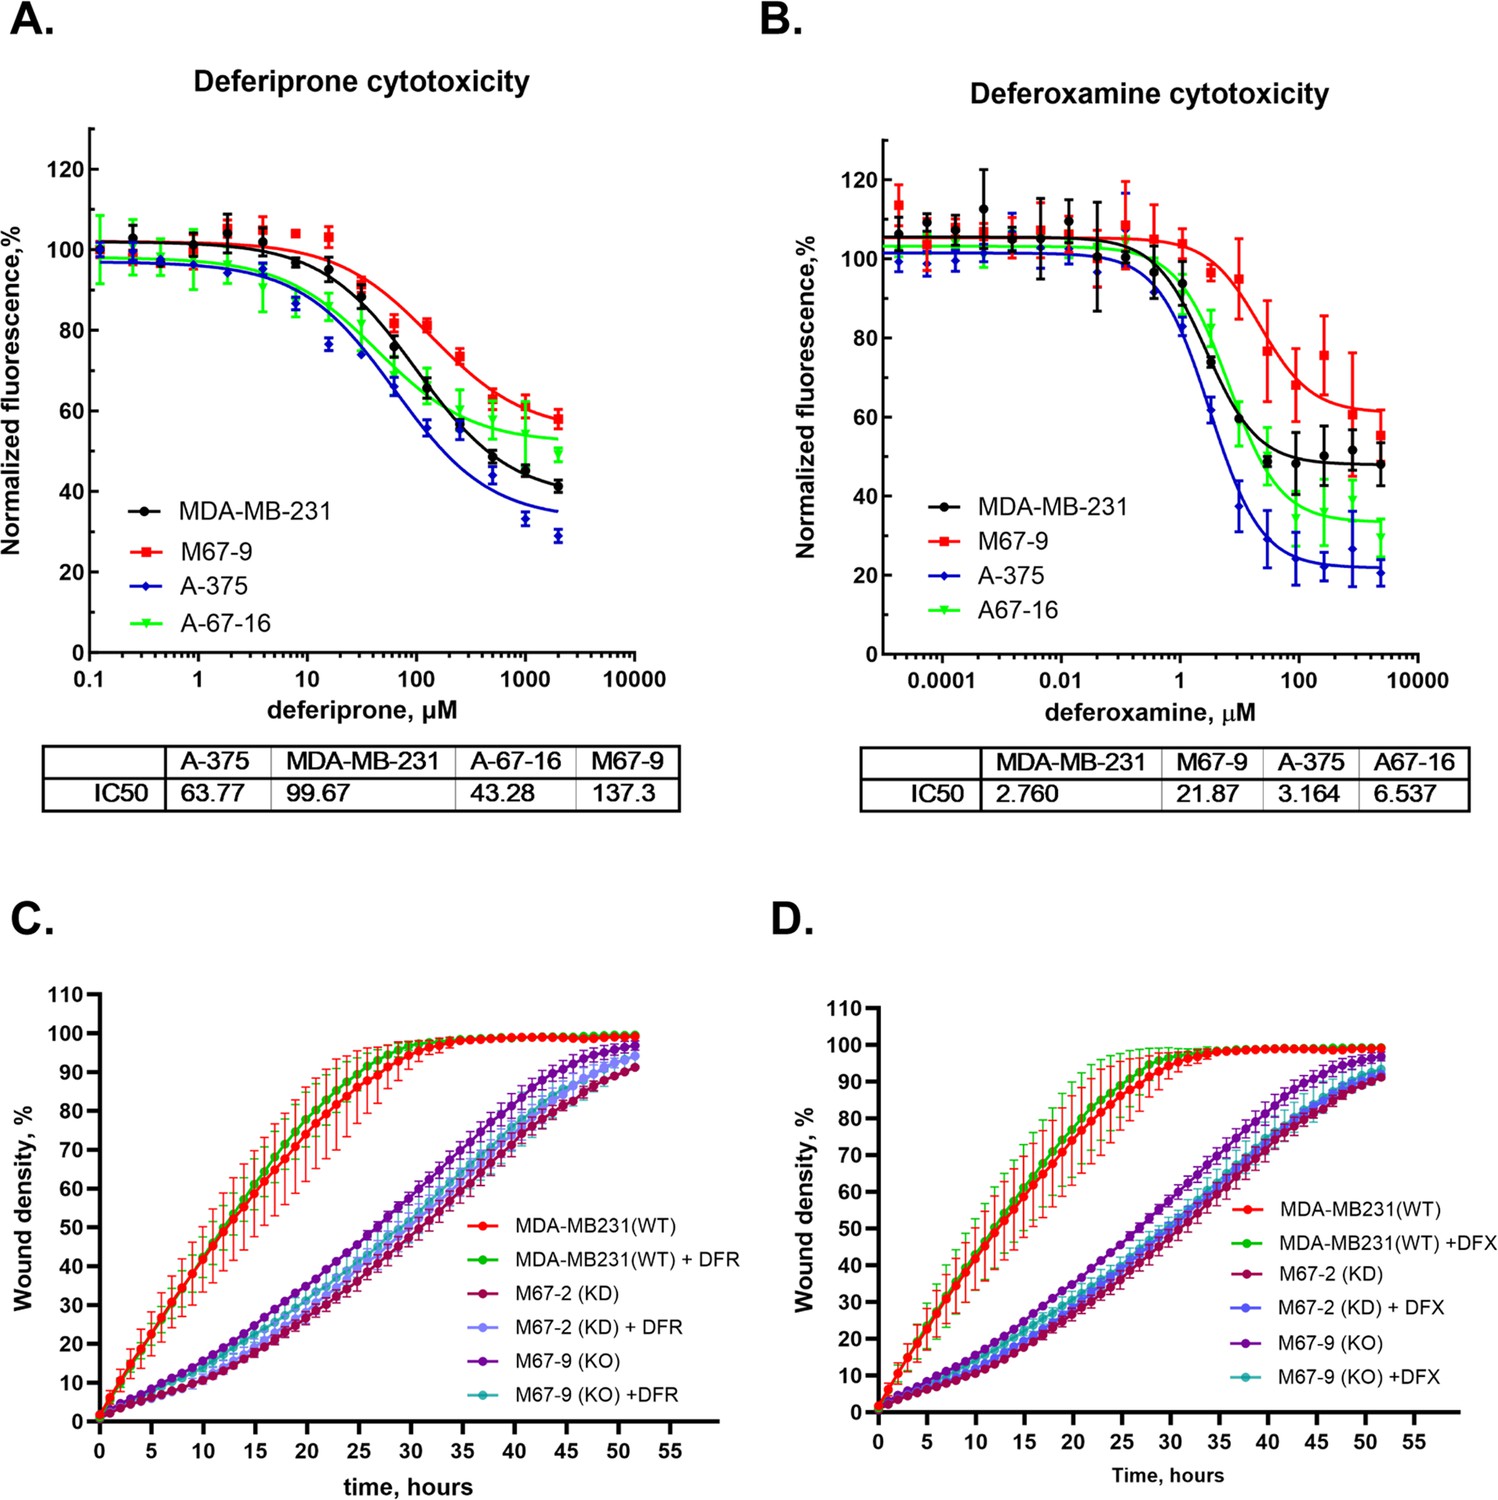
The effect of iron chelators deferoxamine (DFX) and deferiprone (DFR) on cell viability and motility.
Cell viability (A, B) was measured by resazurin fluorescence. Cell motility (C, D) was measured by scratch test using Incucyte automated imaging system with 1 μM DFX or 30 µM deferiprone added.
Figure 5 with 3 supplements
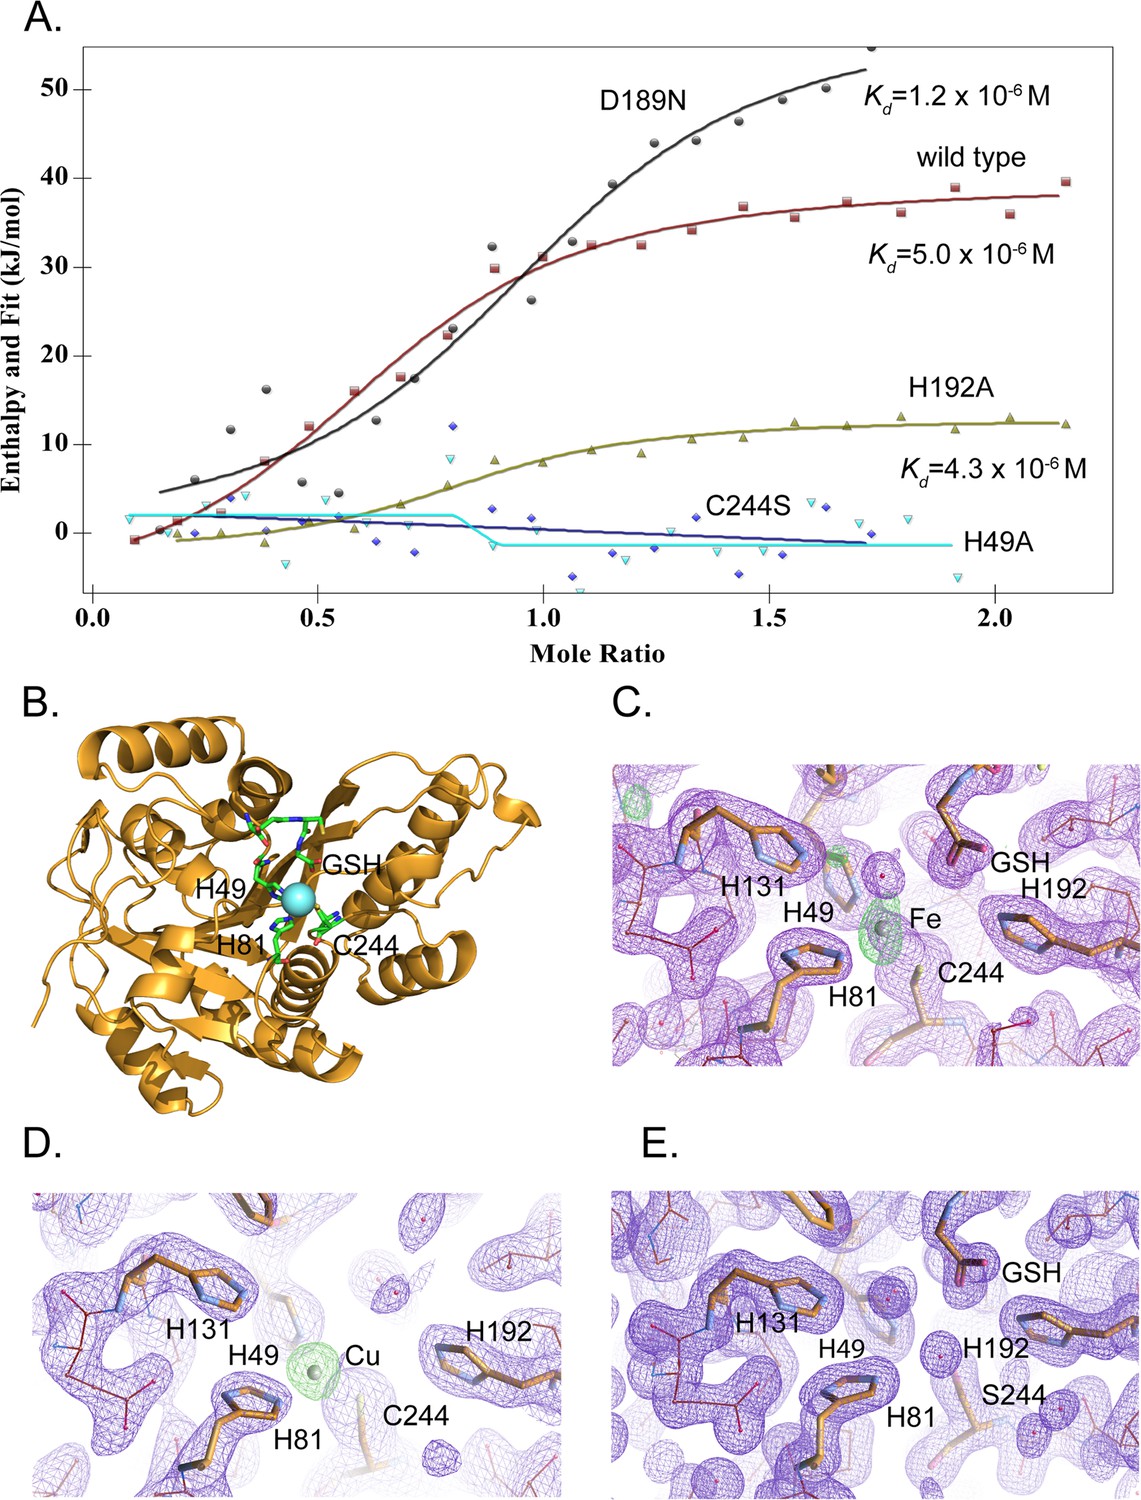
MEMO1 binds iron or copper in the site formed by H49, H81, and C244.
(A) Iron binding to the wild type MEMO1 and metal-binding site mutants analyzed by isothermal titration calorimetry. Dissociation constant (Kd) values are shown under the fitted binding curves for the wild type (squares), D189N (circles), and H192A (triangles) MEMO1 variants. The C244S (diamonds) and H49A (inverted triangles) variants did not bind iron. (B) Structure of the wild type MEMO1 with iron (PDB ID 7KQ8). (C, D) Anomalous difference electron density maps showing iron (7KQ8) (C) and copper (7L5C) (D) coordinated by H49, H81, and C244. The H131 and H192 residues, albeit close to the metal-binding site, do not participate in metal coordination. GSH is glutathione. (E) Region of the electron density map of the C244S-MEMO1 (7M8H) corresponding to the metal-binding site in the wild type (cf. panels C and D).
Figure 5—figure supplement 1
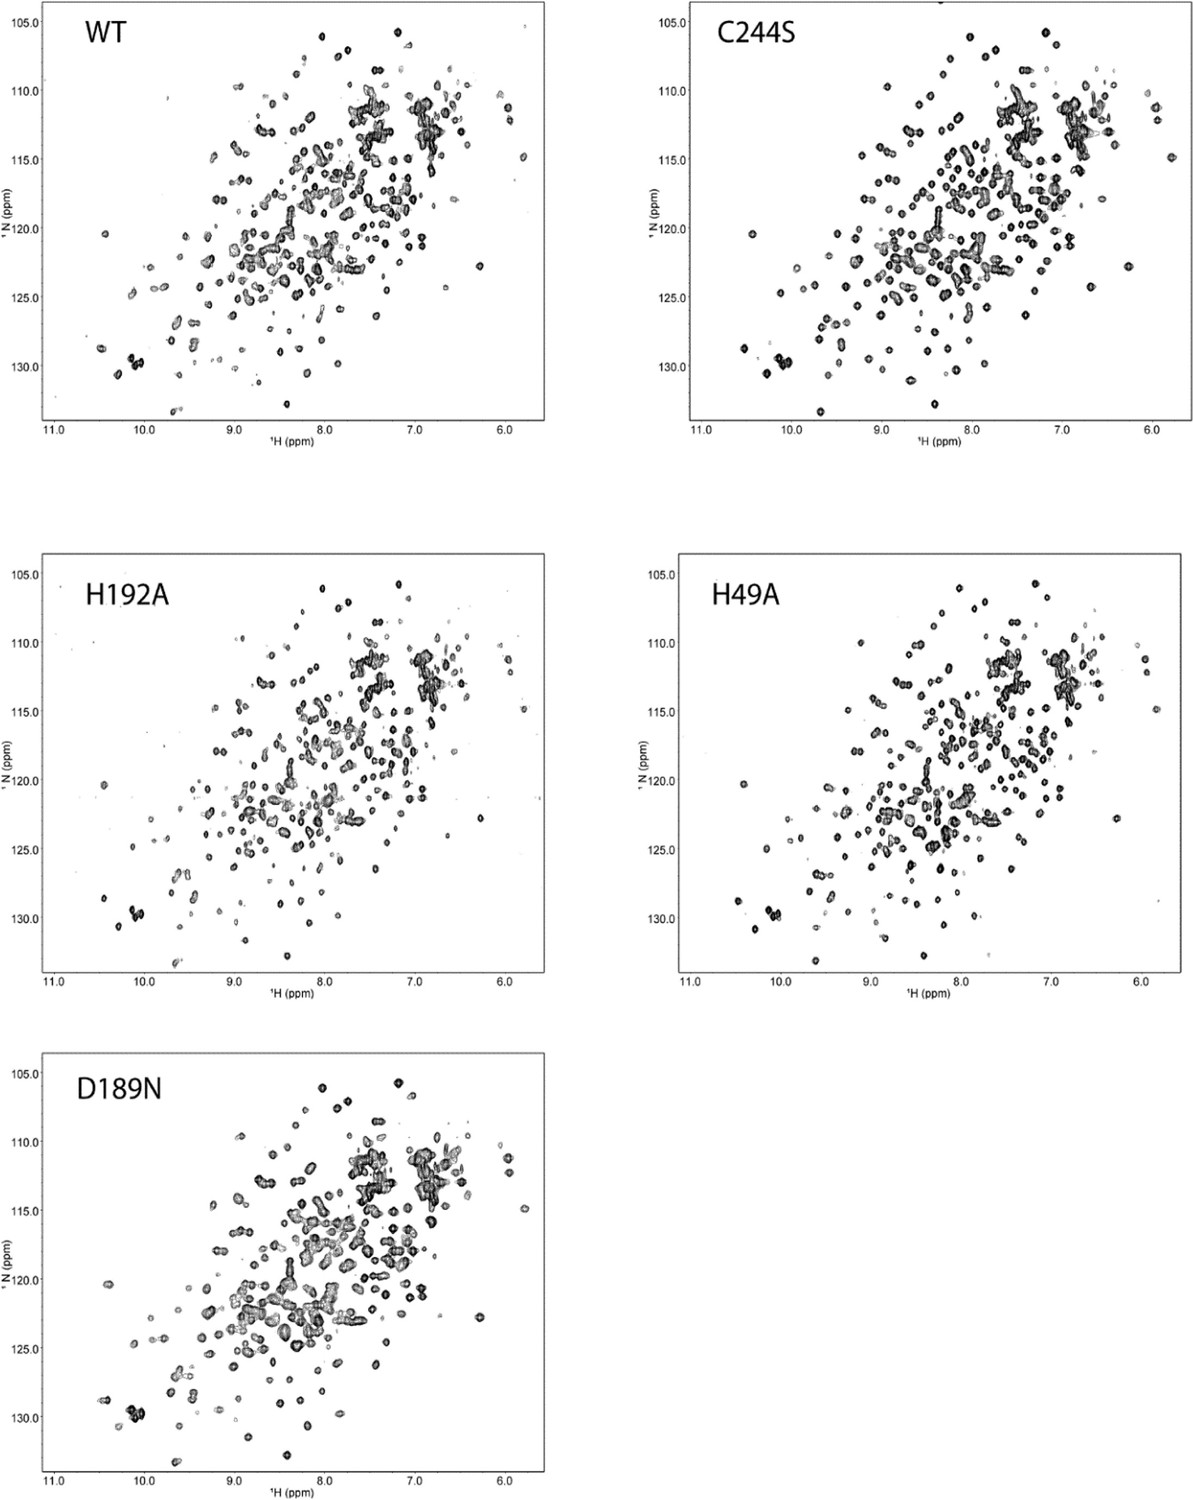
Fingerprint 1H,15N-TROSY spectra of the wild type MEMO1 and several metal-binding site mutants recorded at 900 MHz.
Proteins were isotopically labeled with 15N by substituting 15NH4Cl for the natural abundance NH4Cl in the M9 medium used for protein expression. NMR samples contained 0.1 mM protein in 50 mM HEPES-Na, pH 7.4, 150 mM NaCl, 5 mM TCEP, 5% vol/vol D2O, and 0.25 mM 2,2-dimethyl-2-silapentane-5-sulfonate. The 2D 1H,15N-TROSY spectra were collected on a 900 MHz Bruker Avance III spectrometer equipped with a cryogenic triple-resonance probe at a sample temperature of 298 K.
Figure 5—figure supplement 2

Iron binding to the wild type MEMO1 analyzed by microscale thermophoresis.
Two independent experiments with calculated Kd values are shown.
Figure 5—figure supplement 3
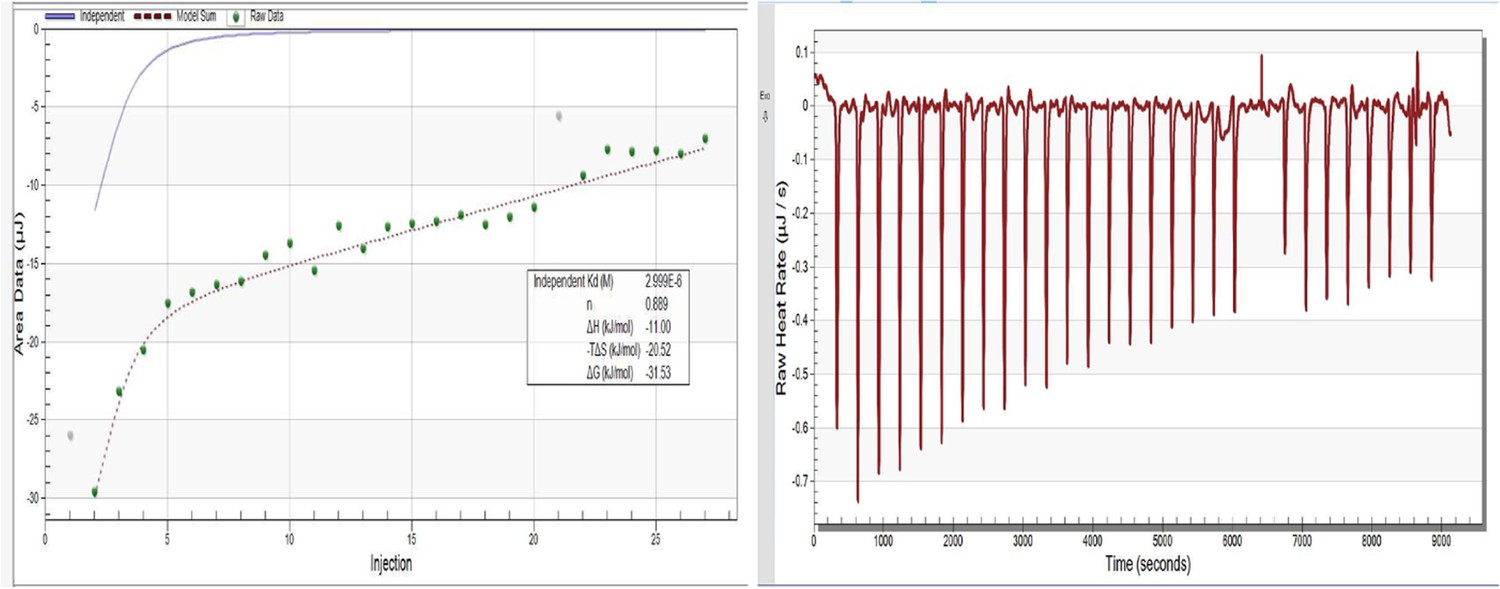
Copper binding to the wild type MEMO1 analyzed by isothermal titration calorimetry.
Figure 6
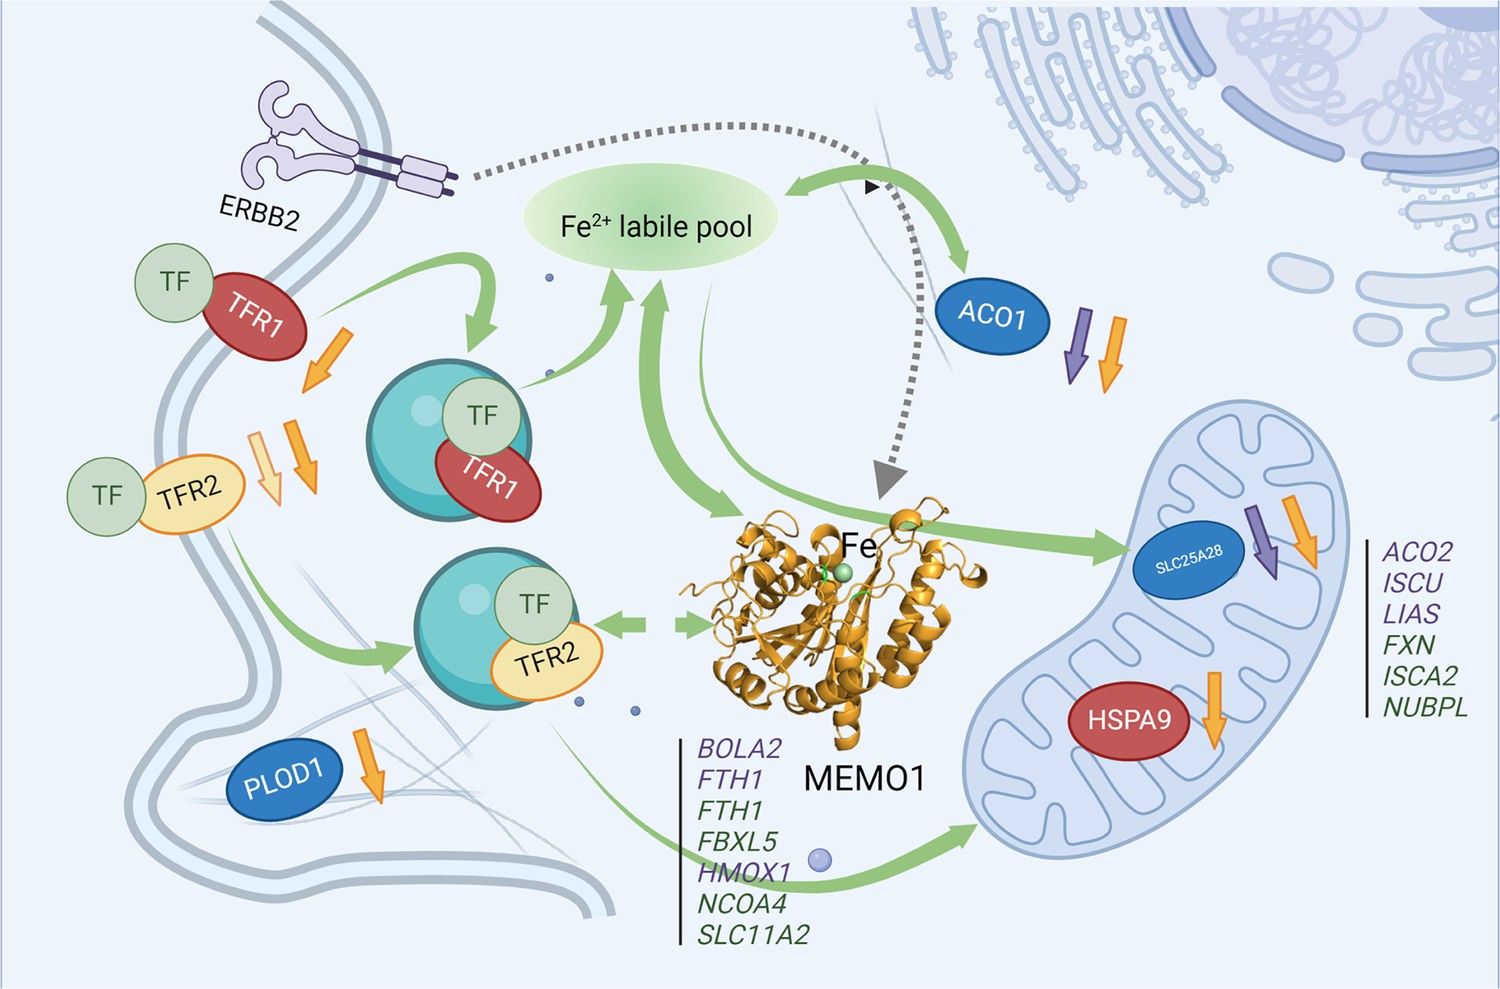
MEMO1 interactions with the other iron-related proteins in breast cancer cells.
Proteins involved in the experimentally validated genetic interactions with MEMO1 in the present work are shown as ovals. Other iron-related genes showing interactions with MEMO1 by database screening are listed in columns, separately for cytosolic or nuclear and mitochondrial proteins. Proteins or genes shown in blue display SDL interactions with MEMO1; those shown in green display SL interactions with MEMO1. In red are essential proteins; their knockdown severely inhibits cell proliferation regardless of MEMO1 expression status. TFR2 (yellow) knockdown uniquely stimulates proliferation of high-MEMO1 cells. Curved green unidirectional arrows show iron transport pathways. Curved green bidirectional arrows show iron-dependent regulation. Dashed gray arrow indicates MEMO1 interaction with ERBB2 receptor. Short up or down arrows indicate reciprocal effects of the MEMO1 and the interacting genes knockouts and knockdowns: protein expression change in low/no MEMO1 cells is indicated by the same color as the protein, MEMO1 expression change with the protein knockdown is indicated by the orange arrow. TF transferrin.
© 2024, BioRender Inc. Figure 6 was created using BioRender, and is published under a CC BY-NC-ND license. Further reproductions must adhere to the terms of this license.
Additional files
-
Supplementary file 1
Genetic interactions of MEMO1 with iron related genes.
(A) Iron-related genes exhibiting gene-of-function (GOF) interactions with MEMO1. (B) Iron-related genes exhibiting loss-of-function (LOF) interactions with MEMO1. (C) Genes involved in ferroptosis and exhibiting GOF or LOF interactions (highlighted in light blue) with MEMO1. (D) Structure determination statistics for MEMO1-metal complexes and the C244S mutant.
- https://cdn.elifesciences.org/articles/86354/elife-86354-supp1-v2.docx
-
MDAR checklist
- https://cdn.elifesciences.org/articles/86354/elife-86354-mdarchecklist1-v2.pdf
Download links
A two-part list of links to download the article, or parts of the article, in various formats.
Downloads (link to download the article as PDF)
Open citations (links to open the citations from this article in various online reference manager services)
Cite this article (links to download the citations from this article in formats compatible with various reference manager tools)
MEMO1 binds iron and modulates iron homeostasis in cancer cells
eLife 13:e86354.
https://doi.org/10.7554/eLife.86354


