Maresin 1 repletion improves muscle regeneration after volumetric muscle loss
- Department of Biomedical Engineering, University of Michigan, United States
- Biointerfaces Institute, University of Michigan, United States
- Department of Molecular & Integrative Physiology, University of Michigan, United States
- Department of Pathology, Lipidomics Core Facility, Wayne State University, United States
- Department of Animal Sciences, Purdue University, United States
- Program in Cellular and Molecular Biology, University of Michigan, United States
Figures
Figure 1 with 1 supplement
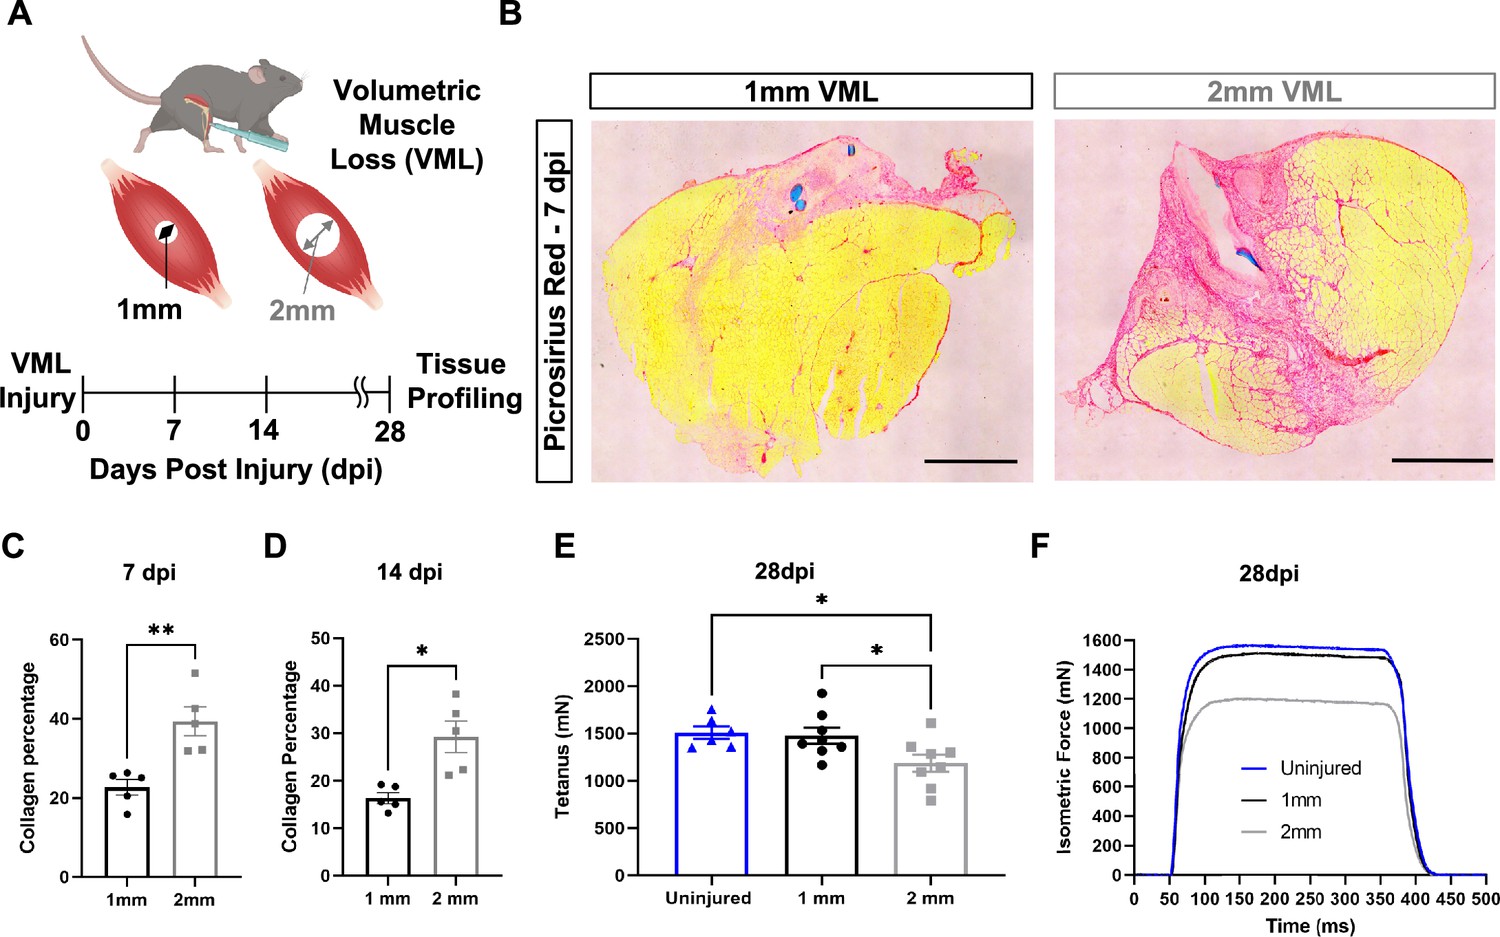
In vivo comparison of degenerative and regenerative volumetric muscle loss (VML) injuries.
(A) Schematic of experiment, whereby young (3 mo) mice were administered 1-mm (administered to left leg) or 2-mm (administered to right leg) biopsy punches to their tibialis anterior muscle to create a VML injury. (B) Representative cross-sections stained with Picrosirius red isolated from healing (1-mm defect) and non-healing (2-mm defect) 7 d post injury (dpi) (n = 4–5 tissues from five mice per group). Scale = 200 μm. (C, D) Quantitation of images from (B) shows reductions in Picrosirius red for 1-mm defects compared to 2-mm defects at 7 dpi (C) and 14 dpi (D). Graphs show mean ± SEM. (E) Average tetanic force from uninjured (blue) tibialis anterior muscle at 28 dpi following 1-mm (black) or 2-mm (gray) VML injuries. Bars show mean ± SEM and *p<0.05 between injury types by two-way ANOVA and post hoc. n = 6–8 tissues 6–8 mice per group. (F) Representative force curves of uninjured tibialis anterior muscle (blue) at 28 dpi following 1-mm (black) or 2-mm (gray) injuries. For (C) and (D), unpaired t-test with Welch’s correction. *p<0.05 and **p<0.01.
Figure 1—figure supplement 1
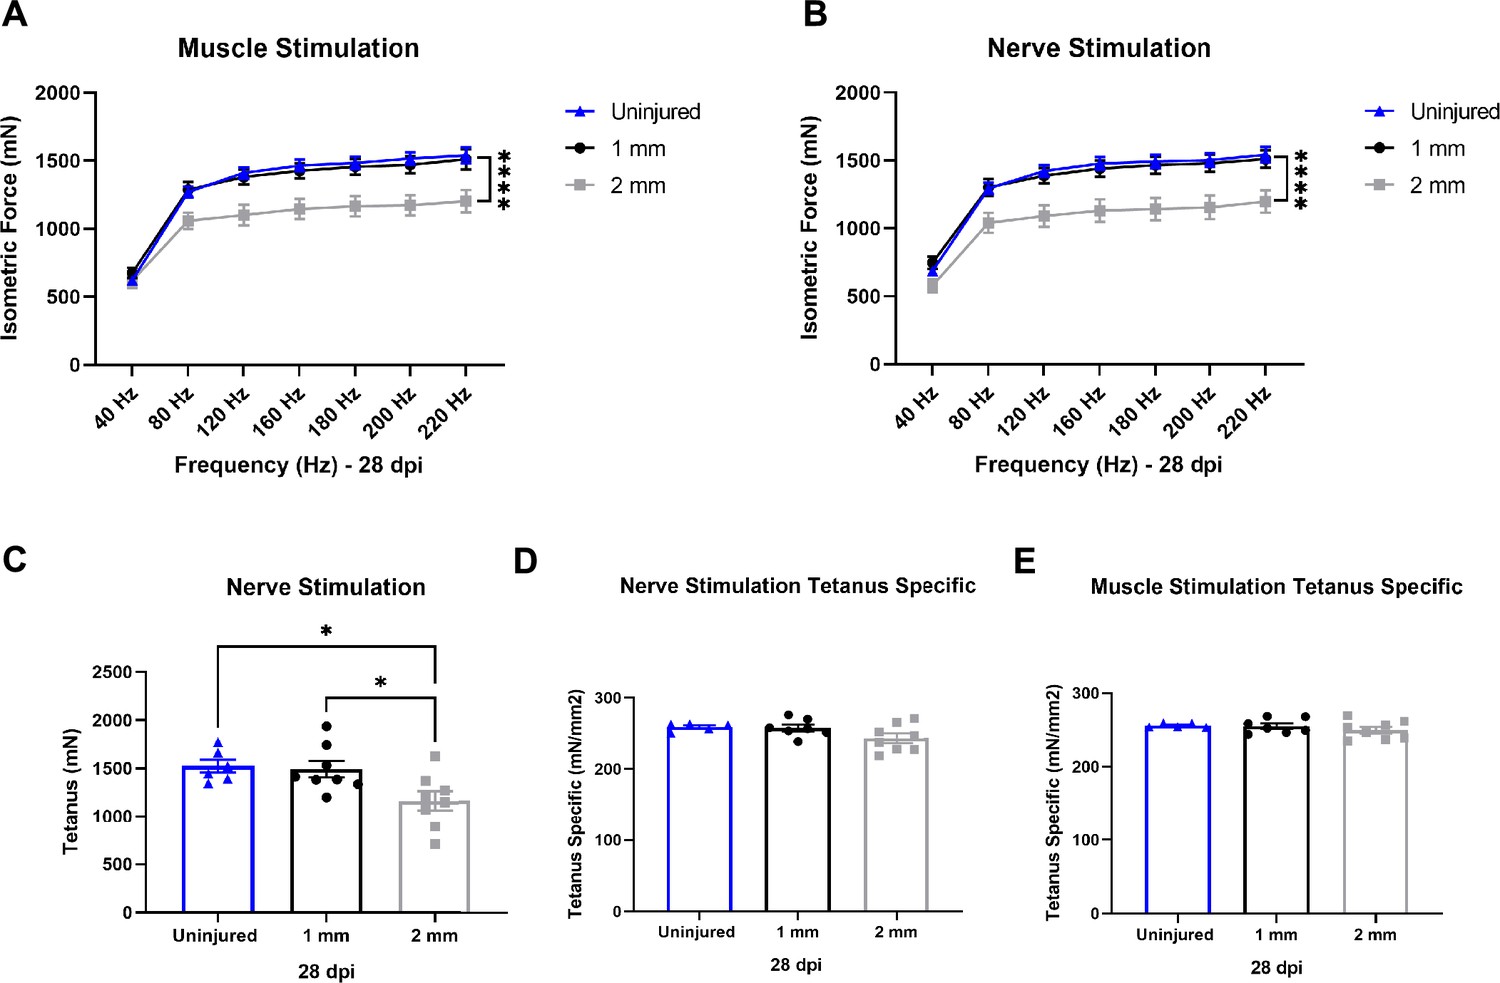
Functional assessment of response to healing or degenerative volumetric muscle loss injuries.
(A, B) Force frequency of muscle (A) and nerve stimulation (B) of uninjured, 1-mm and 2-mm groups uninjured (blue) tibialis anterior muscle at 28 d post injury (dpi) (1 mm [black] or 2 mm [gray]). Points show mean ± SEM and ****p<0.0001 between uninjured and 2-mm injury groups by two-way ANOVA and post hoc. n = 6–8 tissues from 6 to 8 mice per group. (C) Average tetanic force from nerve stimulation of uninjured tibialis anterior muscle at 28 dpi. Bars show mean ± SEM and *p<0.05 between injury types by two-way ANOVA and post hoc. n = 6–8 tissues from 6 to 8 mice per group. (D, E) Tetanic force normalized to total muscle cross-sectional area (CSA) (mm2) from nerve (D) and muscle (E) stimulation of uninjured tibialis anterior muscle at 28 dpi. Bars show mean ± SEM. n = 6–8 tissues from 6 to 8 mice per group.
Figure 2 with 1 supplement
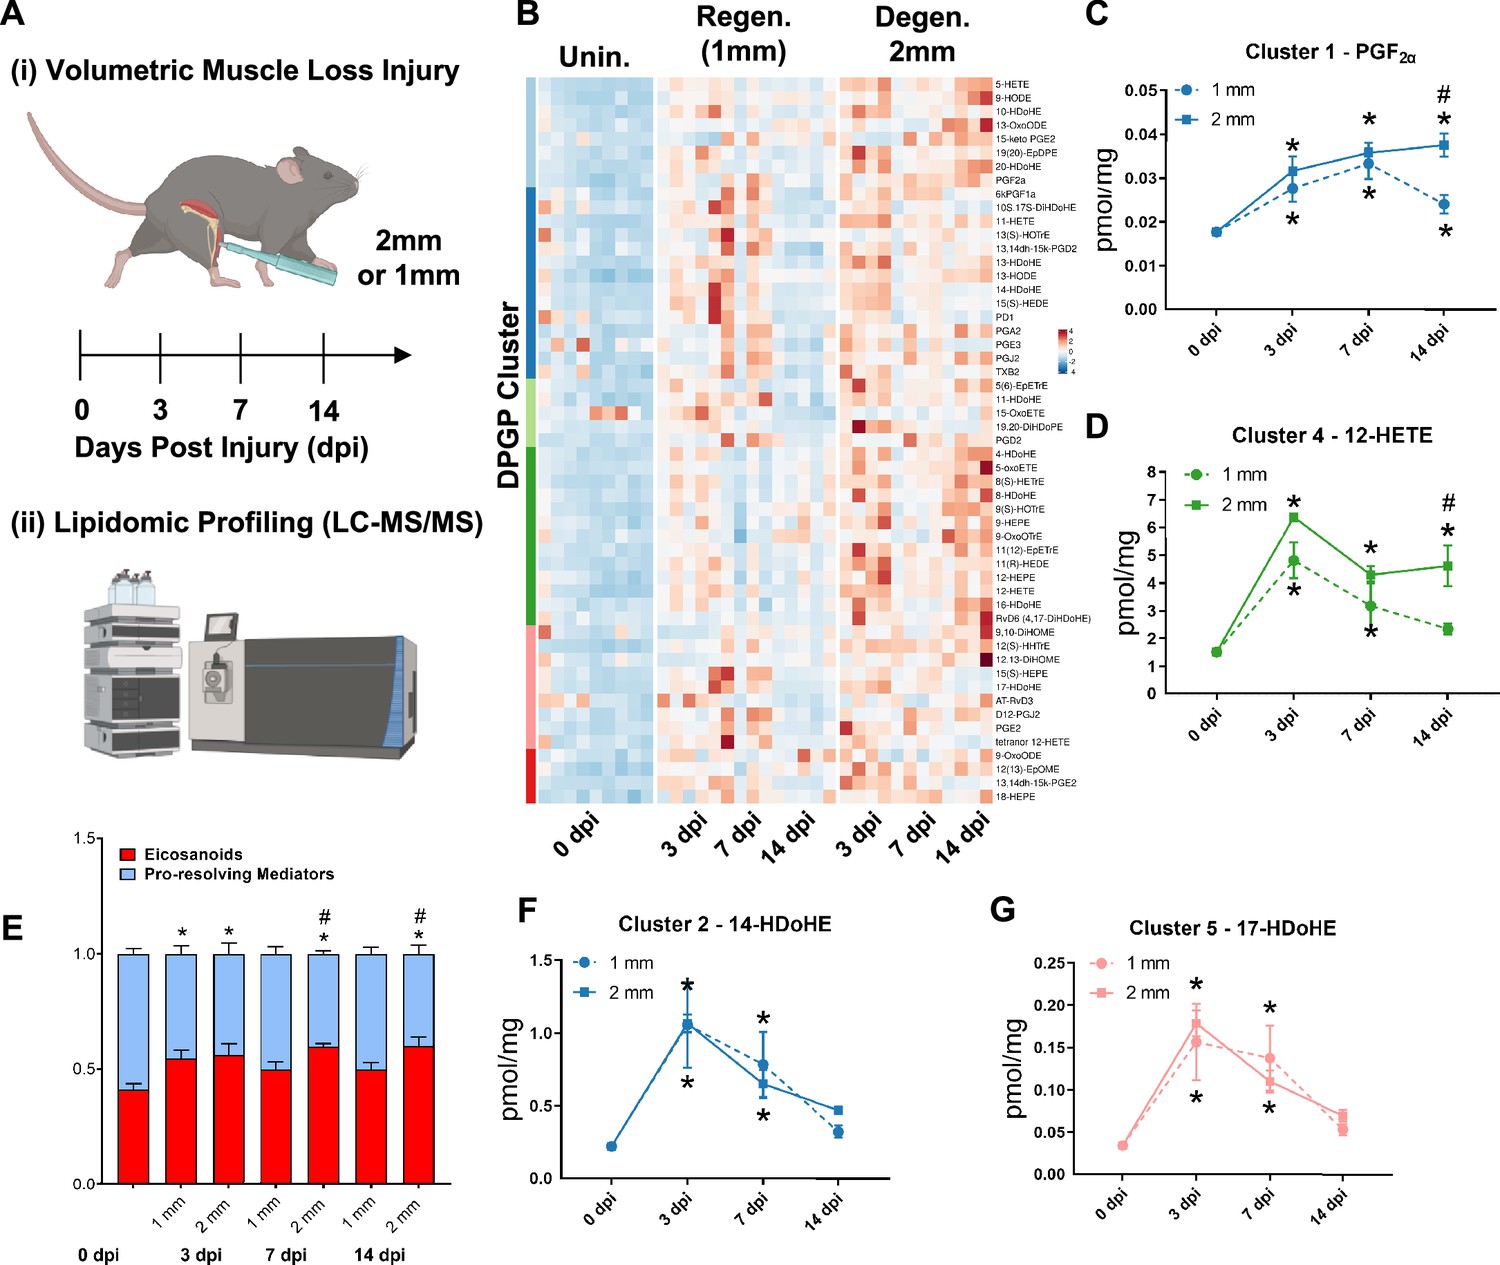
Lipidomic profiling after volumetric muscle loss (VML) injuries reveals stronger and sustained lipid mediator response in degenerative injuries.
(A) Mice were administered a bilateral defect to tibialis anteriors (TAs) (left leg received a 1-mm defect and right leg received a 2-mm defect). Tissues were harvested at 0, 3, 7, and 14 d post injury (dpi) and subjected to liquid chromatography coupled to tandem mass spectrometry (LC-MS/MS) analysis. n = 5 tissues from five mice per injury type and timepoint. Statistical analyses were paired. (B) Row-scaled heatmap of 53 differentially expressed analytes across injuries and timepoints. Analytes are grouped by Dirichlet Process Gaussian Process (DPGP) clusters. (C–D, F–G) Changes of specific lipid metabolites in different clusters per injury type and timepoint expressed in pmol/mg. Two-way paired ANOVA was used to estimate statistical differences between injury and timepoints. Graphs show mean ± SEM, *<0.05 between timepoints of matched injury timepoint, **<0.01 between different injury types, and #<0.05 between different injury types at a certain timepoint. (C, D) Prostaglandin F2 alpha and 12-HETE are both eicosanoids related to pro-inflammatory effects. (E) Eicosanoids (TXB2, PGD2, PGE2, PGF2α, 6kPGF1α, and 5-, 12-, 15-HETEs) vs pro-resolving mediators pathway markers (5-HEPE, 4-HDoHE, 7-HDoHE, 12-HEPE, 14-HDoHE, RvD6, PD1, 10S,17S-DiHDoHE, Maresin 1, Mar1-n3DPA, LXA4) graphed for 2-mm and 1-mm VML defects at 0, 3, 7, and 14 dpi. Both analyte groups were normalized to ratios adding up to 1. Two-way paired ANOVA statistical tests were used to compare values between injury and timepoints. *p<0.05 between timepoints of matched injury timepoint, and #p<0.05 between different injury types at a certain timepoint. (F) 14-HDoHE represents a pathway marker for maresins. (G) 17-HDoHE is a pathway marker for D-resolvins/protectins. Both maresins and resolvins are related to anti-inflammatory effects.
Figure 2—figure supplement 1
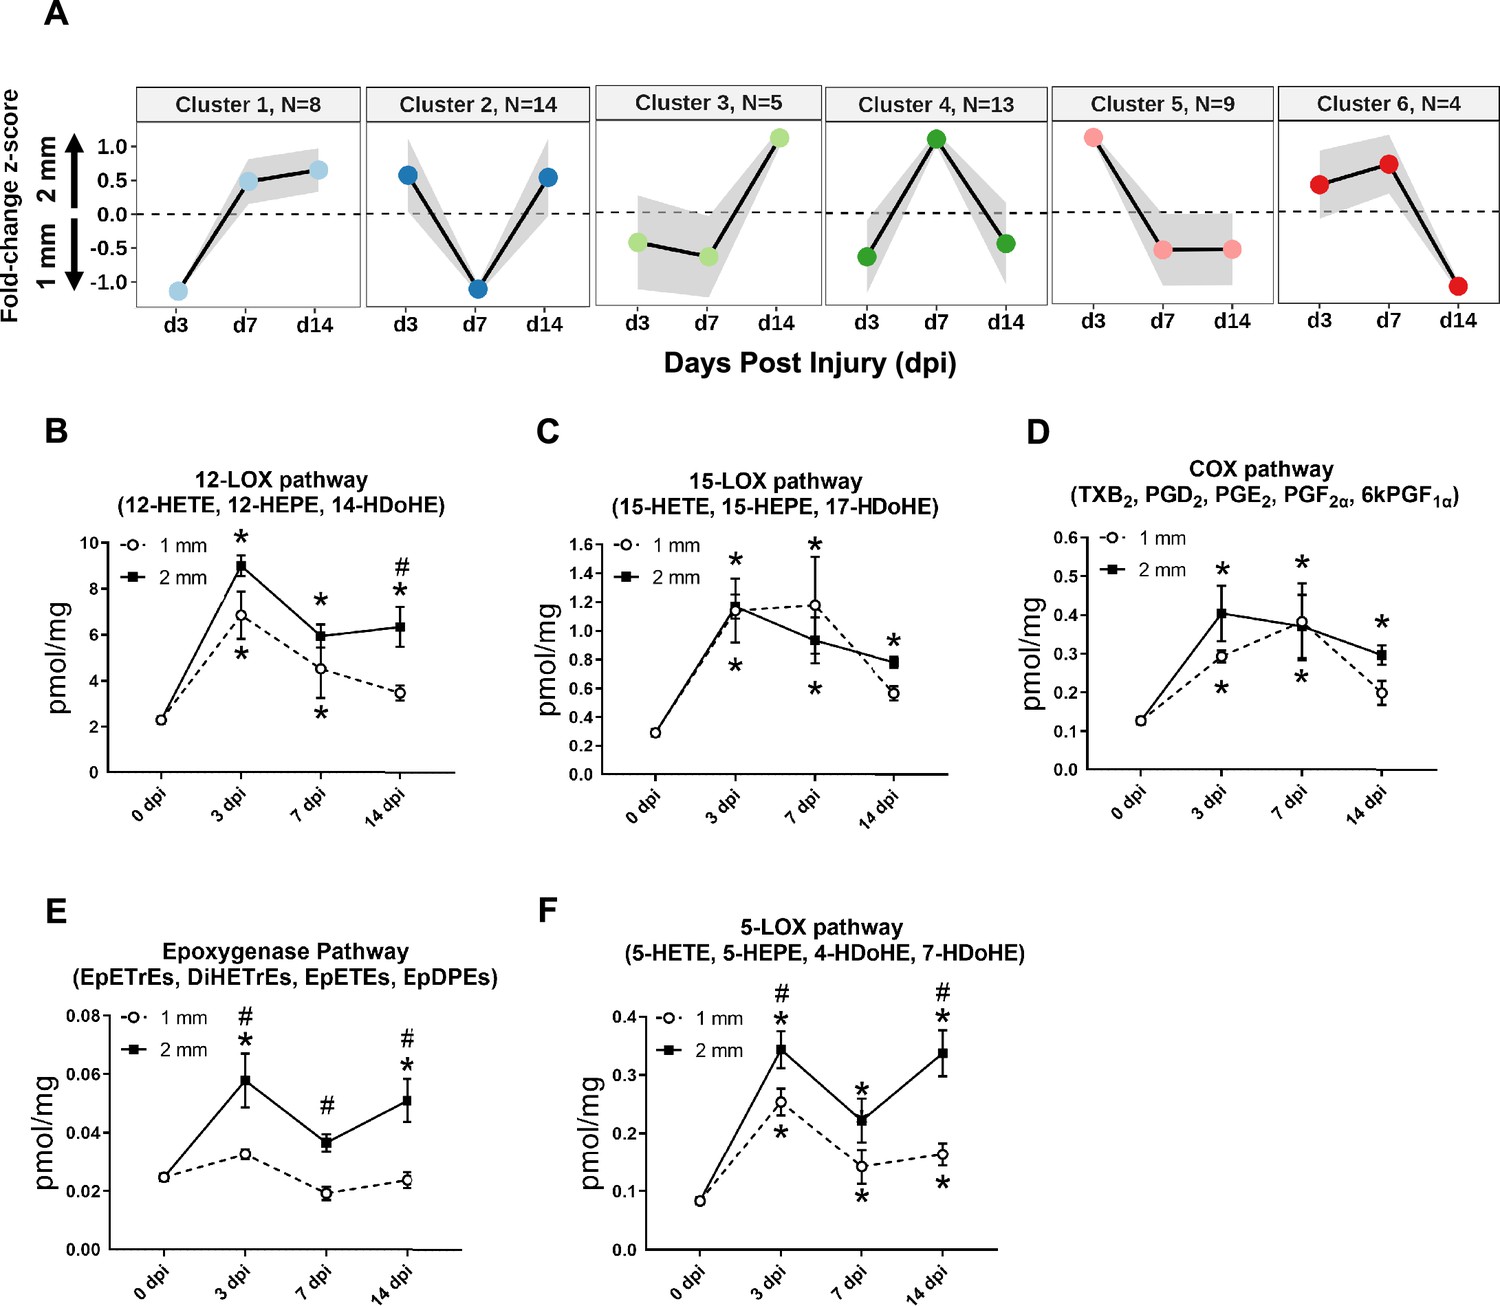
Dynamics of lipid mediators after volumetric muscle loss injury.
(A) Dirichlet Process Gaussian Process (DPGP) mixture model-based clustering of mean analyte abundance fold change z-scores across injury timepoints. Black lines are cluster means, and the gray bars show 2 SDs around the mean. Color scheme for each cluster corresponds to Figure 2 DPGP heatmap (B–F) Changes of pooled lipid mediators metabolites per injury type and timepoint expressed in pmol/mg. Two-way paired ANOVA was used to estimate statistical differences between injury and timepoints. Graphs show mean ± SEM, *p<0.05 between timepoints of matched injury timepoint and #p<0.05 between different injury types at a certain timepoint. (B) Sum of 12-HETE, 12-HEPE, and 14-HDoHE. 12-HETE is commonly related to pro-inflammatory effects while 14-HDoHE is a known pathway marker for Maresin 1. (C) Sum of 15-HETE, 15-HEPE, and 17-HDoHE. 15-HETE is commonly related to pro-inflammatory effects while 17-HDoHE is a known pathway marker for resolvings. (D) Sum of PGI2 (6kPGF1α), PGF2α, PGE2, PGD2, and TXB2. Prostaglandins and thromboxanes have been commonly related to pro-inflammatory effects. (E) Sum of EpETrEs, DiHETrEs, EpETEs, and EpDPEs. Cytochrome P450 epoxygenase pathway has been related to anti-inflammatory effects that remains as an understudied pathway. (F) Sum of 5-HETE, 5-HEPE, 4-HDoHE, and 7-HDoHE. 5-HETE is commonly related to pro-inflammatory effects.
Figure 3 with 3 supplements
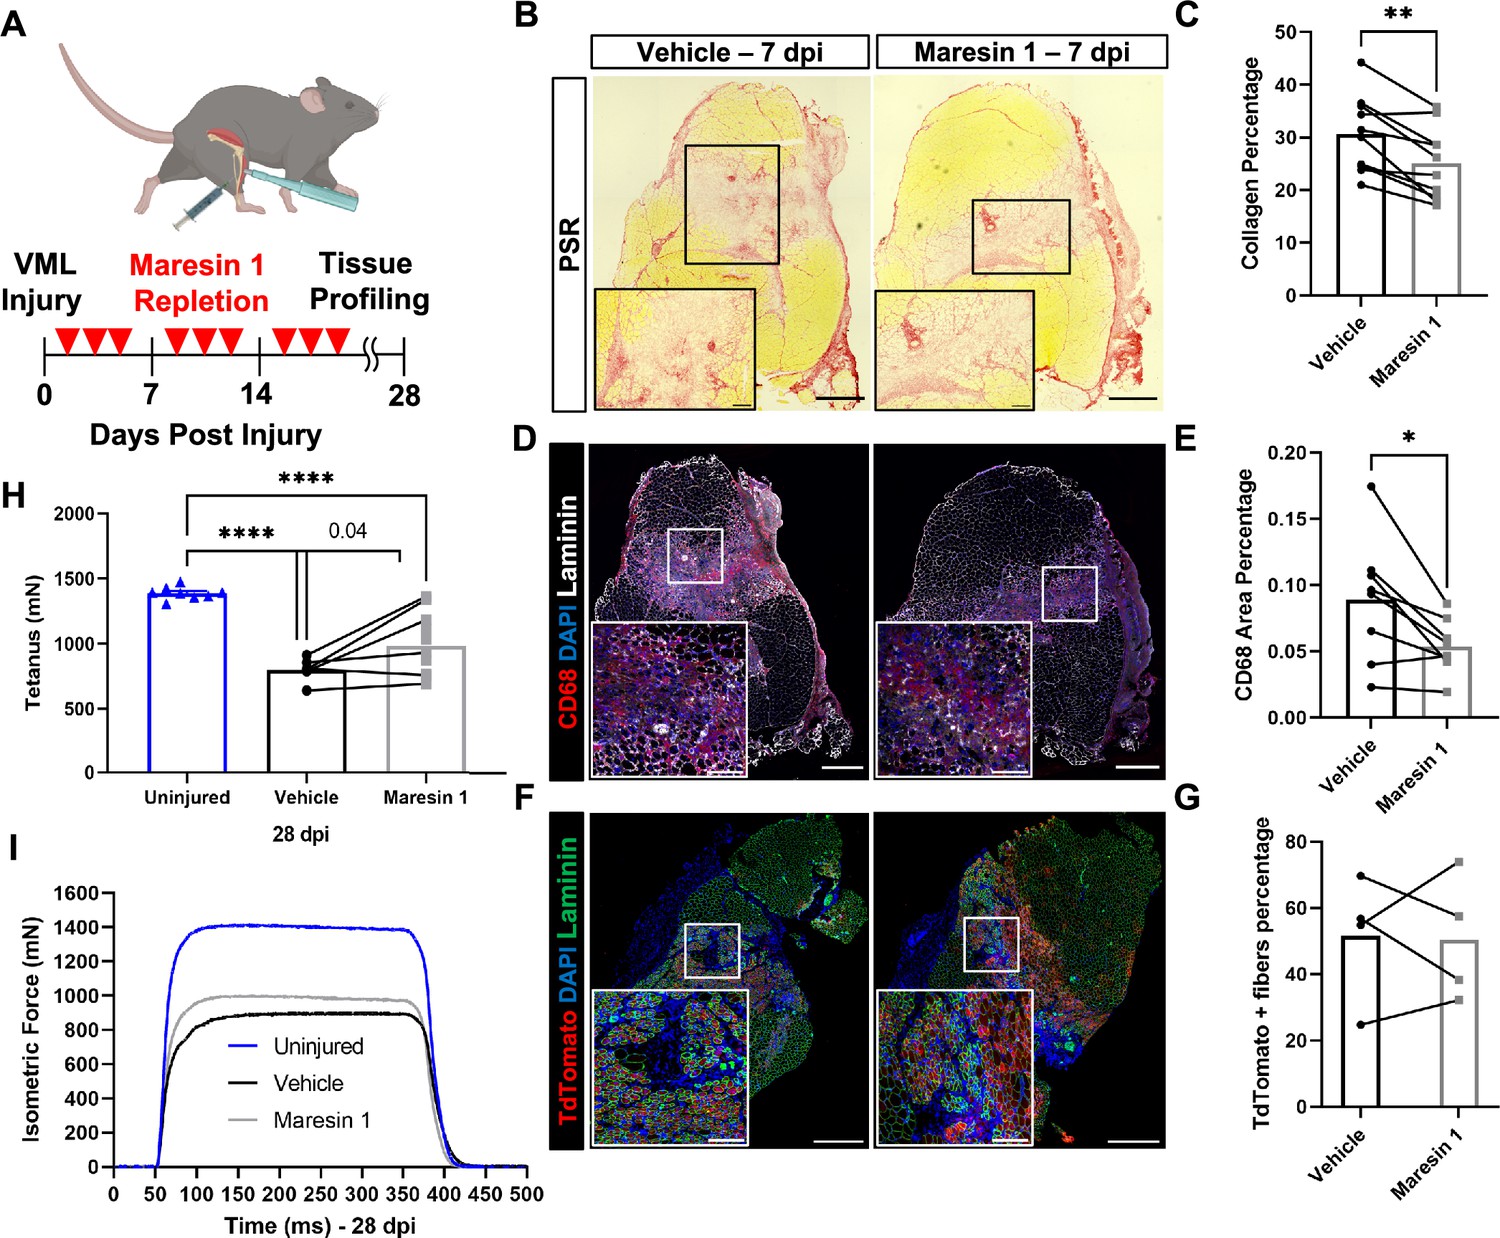
Repletion of Maresin 1 after degenerative volumetric muscle loss (VML) injury results in reductions in inflammation and fibrosis.
(A) Mice were administered bilateral 2-mm VML defects to their tibialis anterior (TA) muscles. One limb received an intramuscular injection of Maresin 1 and the other limb received vehicle (saline + 0.01% EtOH) treatment every 2 d. (B) Representative cross-sections stained with Picrosirius red isolated 7 d post injury (dpi) following treatment with vehicle or Maresin 1 treatment. n = 7 tissues from seven mice per group, scale bar = 500 μm. Inset scale bar = 150 um. *p<0.05 by paired t-test.(C) Quantitation of Picrosirius red at 7 dpi from (B) shows a reduction of collagen deposition for Maresin 1 treatment. Graphs show mean ± standard error of mean (SEM), **p<0.01 by paired t-test. (D) Representative cross-sections from muscles isolated 7 dpi treated with vehicle or Maresin 1 treatment. Sections are immunostained for CD68 (red), DAPI (blue), and laminin (white). n = 7 tissues from seven mice per group, scale bar = 500 μm. Inset scale bar = 150 um. (E) Quantitation of number of macrophages (CD68+) at 7 dpi from (D) shows a decrease in the number of macrophages for Maresin 1 treatment. Graphs show mean ± SEM, *p<0.05 by paired t-test. (F) Representative cross-sections from muscles isolated 7 dpi treated with vehicle or Maresin 1 treatment. Sections are immunostained for TdTomato (red), DAPI (blue), and laminin (green). Scale bar = 500 μm. Inset scale bar = 150 um. (G) Quantitation of average cross-sectional area of fibers positive for TdTomato. n = 4 tissues from four mice per group. (H) Average tetanic force from muscle stimulation of uninjured (blue) TA muscle at 28 dpi and treatment with saline (black) and Maresin 1 (gray). Bars show mean ± SEM and ****p<0.0001 between uninjured and VML + Maresin 1 treatment, and between uninjured and VML + saline treatment, and p=0.0477 between VML + Maresin 1 and VML + saline treatment by one-way ANOVA and post hoc. n = 11 tissues from 11 mice per group. (I) Representative force curves of uninjured TA muscle (blue) at 28 dpi following saline (black) and Maresin 1 treatment (gray).
Figure 3—figure supplement 1
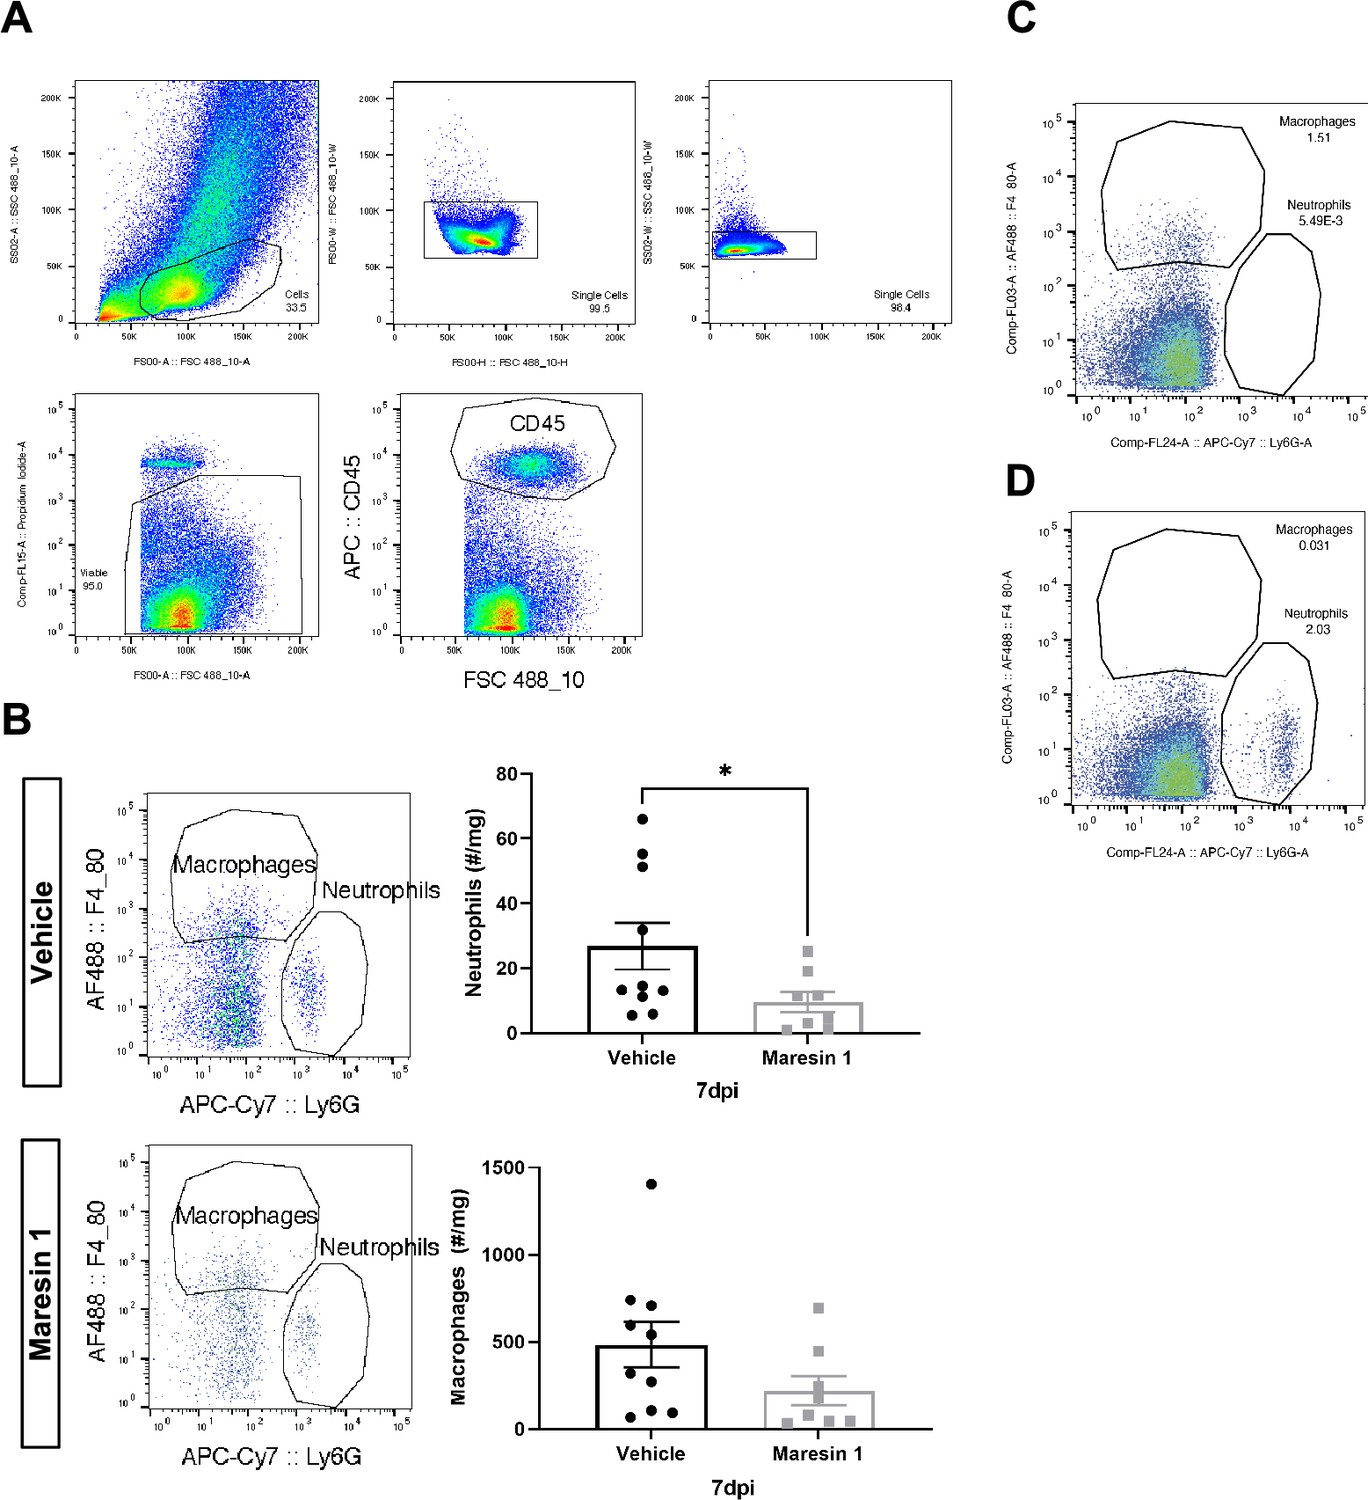
Immune profiling of response to volumetric muscle loss (VML) injury after treatment with Maresin 1.
(A) Complete gating strategy for neutrophils and macrophages. Values indicate percentage of parent. (B) Maresin 1 treatment significantly reduced neutrophil abundance and reduced F4/80+ macrophage abundance by flow cytometry at 7 d post injury (dpi). Graphs show mean ± standard error of mean (SEM), *p<0.05 by two-sided, two-sample t-test. n = 8–10 tissues from 4 to 5 mice. (C) FMO control for Ly6G-APC-Cy7. Values indicate percentage of CD45+ cells. (D) FMO control for F4/80-AF488. Values indicate percentage of CD45+ cells.
Figure 3—figure supplement 2
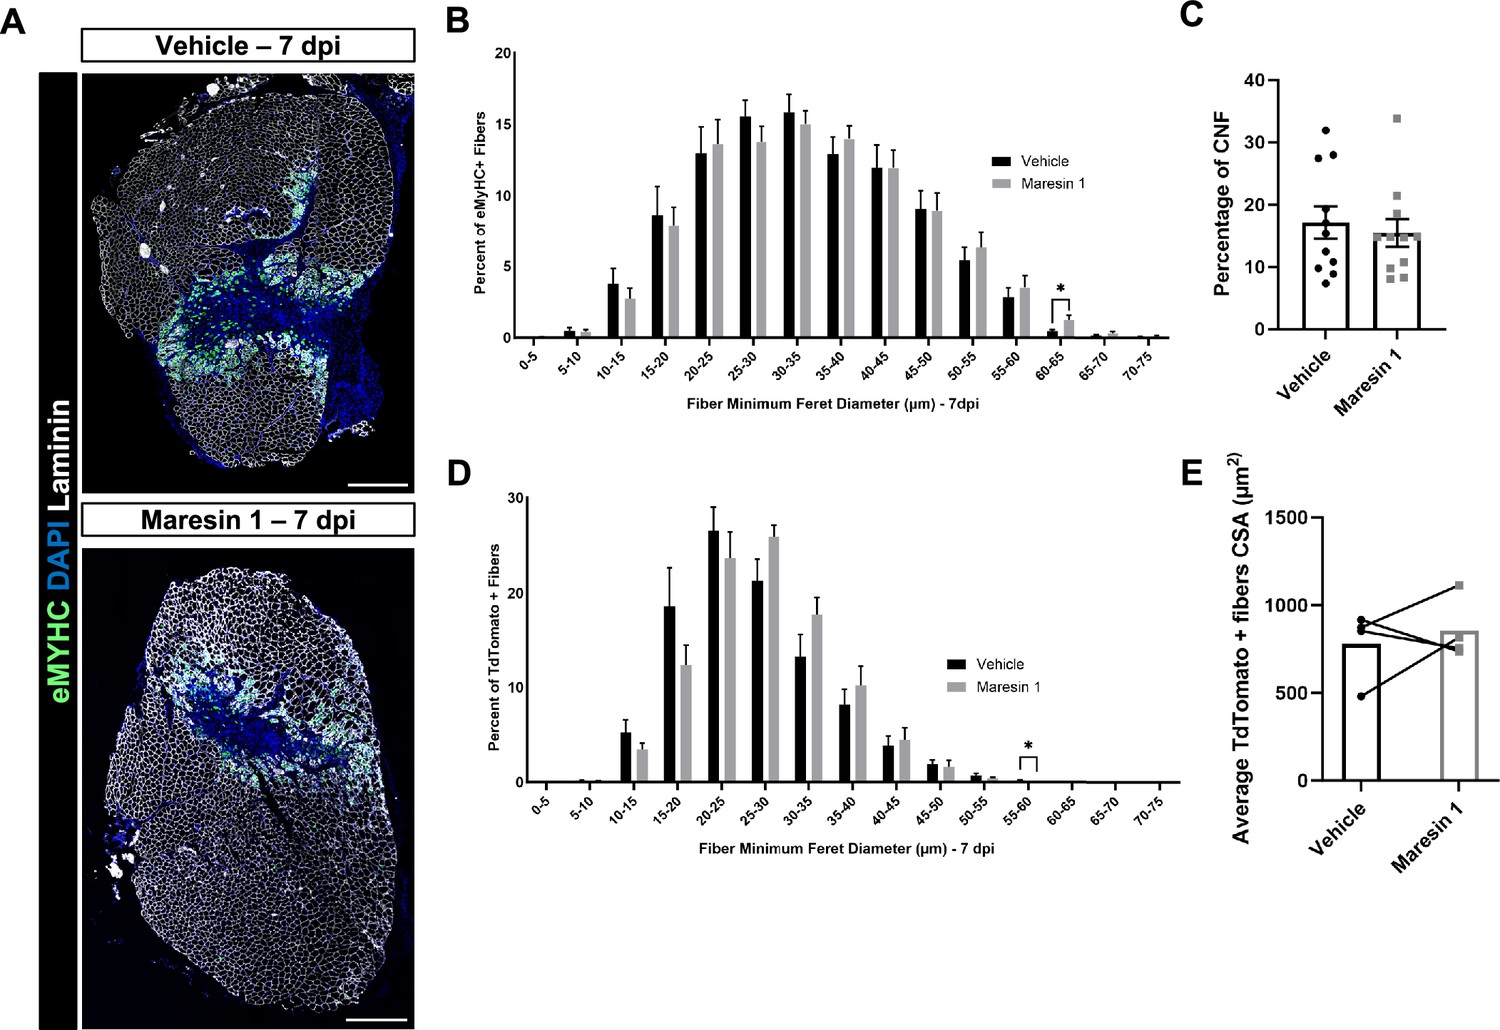
Regenerative response to volumetric muscle loss (VML) injury after treatment with Maresin 1.
(A) Representative cross-sections from muscles isolated 7 d post injury (dpi) with vehicle (top) or Maresin 1 (bottom) treatment. Sections are immunostained for embryonic myosin heavy chain (eMyHC) (green), DAPI (blue), and laminin (white). Scale bar = 500 μm. (B) Distributions of Feret diameter for eMyHC+ myofibers show increased number of larger regenerating myofibers for Maresin 1 treatment when compared to vehicle treatment at 7 dpi. Graphs show mean ± SEM, n = 11 tissues from 11 mice per group. * p< 0.05 by unpaired t-test."(C) Percentage of centrally nucleated fibers at 7 dpi. Bars show mean ± SEM, n = 11 tissues from 11 mice per group. (D) Distributions of Feret diameter for TdTomato+ myofibers show increased number of larger regenerating myofibers for Maresin 1 treatment when compared to vehicle treatment at 7 dpi. Graphs show mean ± SEM, n = 4 tissues from four mice per group. p< 0.05 by unpaired t-test.(E) Percentage of TdTomato+ positive fibers (n = 4 tissues from four mice per group).
Figure 3—figure supplement 3
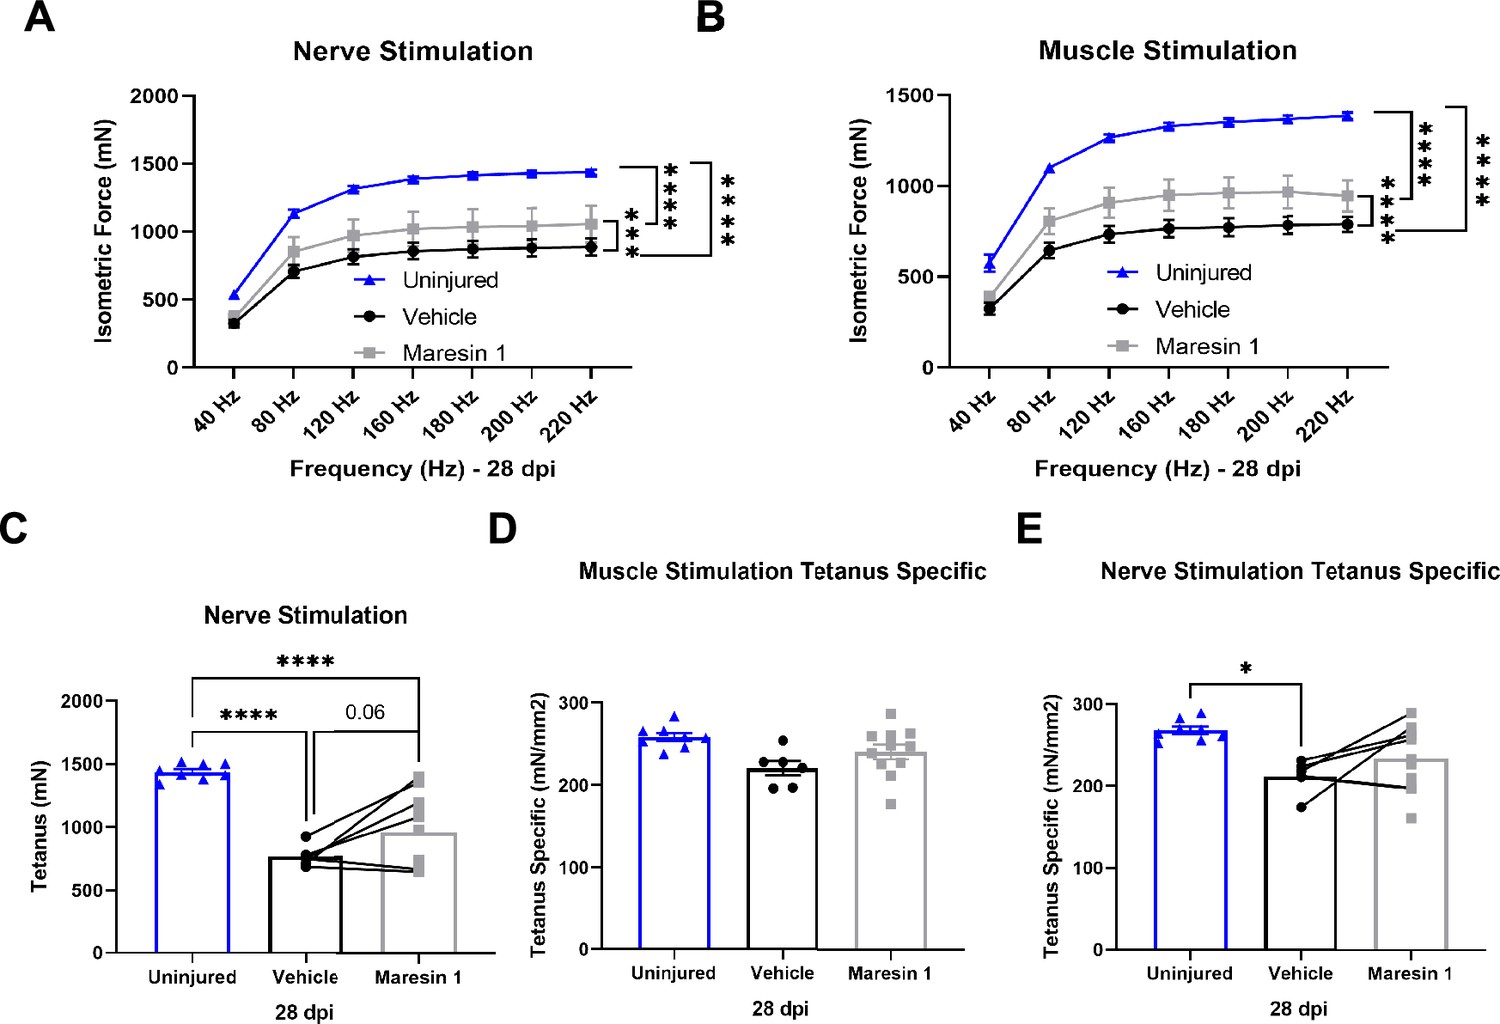
Changes in muscle force after volumetric muscle loss (VML) injury are enacted with treatment with Maresin 1.
(A, B) Force frequency of nerve (A) and muscle stimulation (B) of uninjured (blue) tibialis anterior muscle at 28 d post injury (dpi) following treatment with saline (black) or Maresin 1 (gray). Points show mean ± SEM and ****p<0.0001 between uninjured and vehicle, uninjured and Maresin 1 treatment, and ***p<0.001 between vehicle and Maresin 1 treatments (A) ****p<0.001 between vehicle and Maresin 1 treatments (B) by two-way ANOVA and post hoc analysis. n = 6–9 tissues from 6 to 9 mice per group. (C) Average tetanic force from nerve stimulation of uninjured tibialis anterior muscle at 28 dpi following 2-mm VML injuries treated with saline and Maresin 1. Bars show mean ± SEM and ****p<0.0001 between uninjured and VML + saline treatment and between uninjured and VML + Maresin 1 treatment, and p=0.0690 between VML + Maresin 1 and VML + saline treatment by one-way ANOVA and post hoc. n = 6–9 tissues from 6 to 9 mice per group. (D, E) Tetanic force normalized to total muscle cross-sectional area (CSA) (mm2) from muscle (D) and nerve (E) stimulation of uninjured tibialis anterior muscle at 28 dpi following 2-mm VML injuries treated with saline and Maresin 1. Bars show mean ± SEM and *p<0.05 between uninjured and VML + saline treatment by one-way ANOVA and post hoc analysis. n = 6–9 tissues from 6 to 9 mice per group.
Figure 4 with 1 supplement
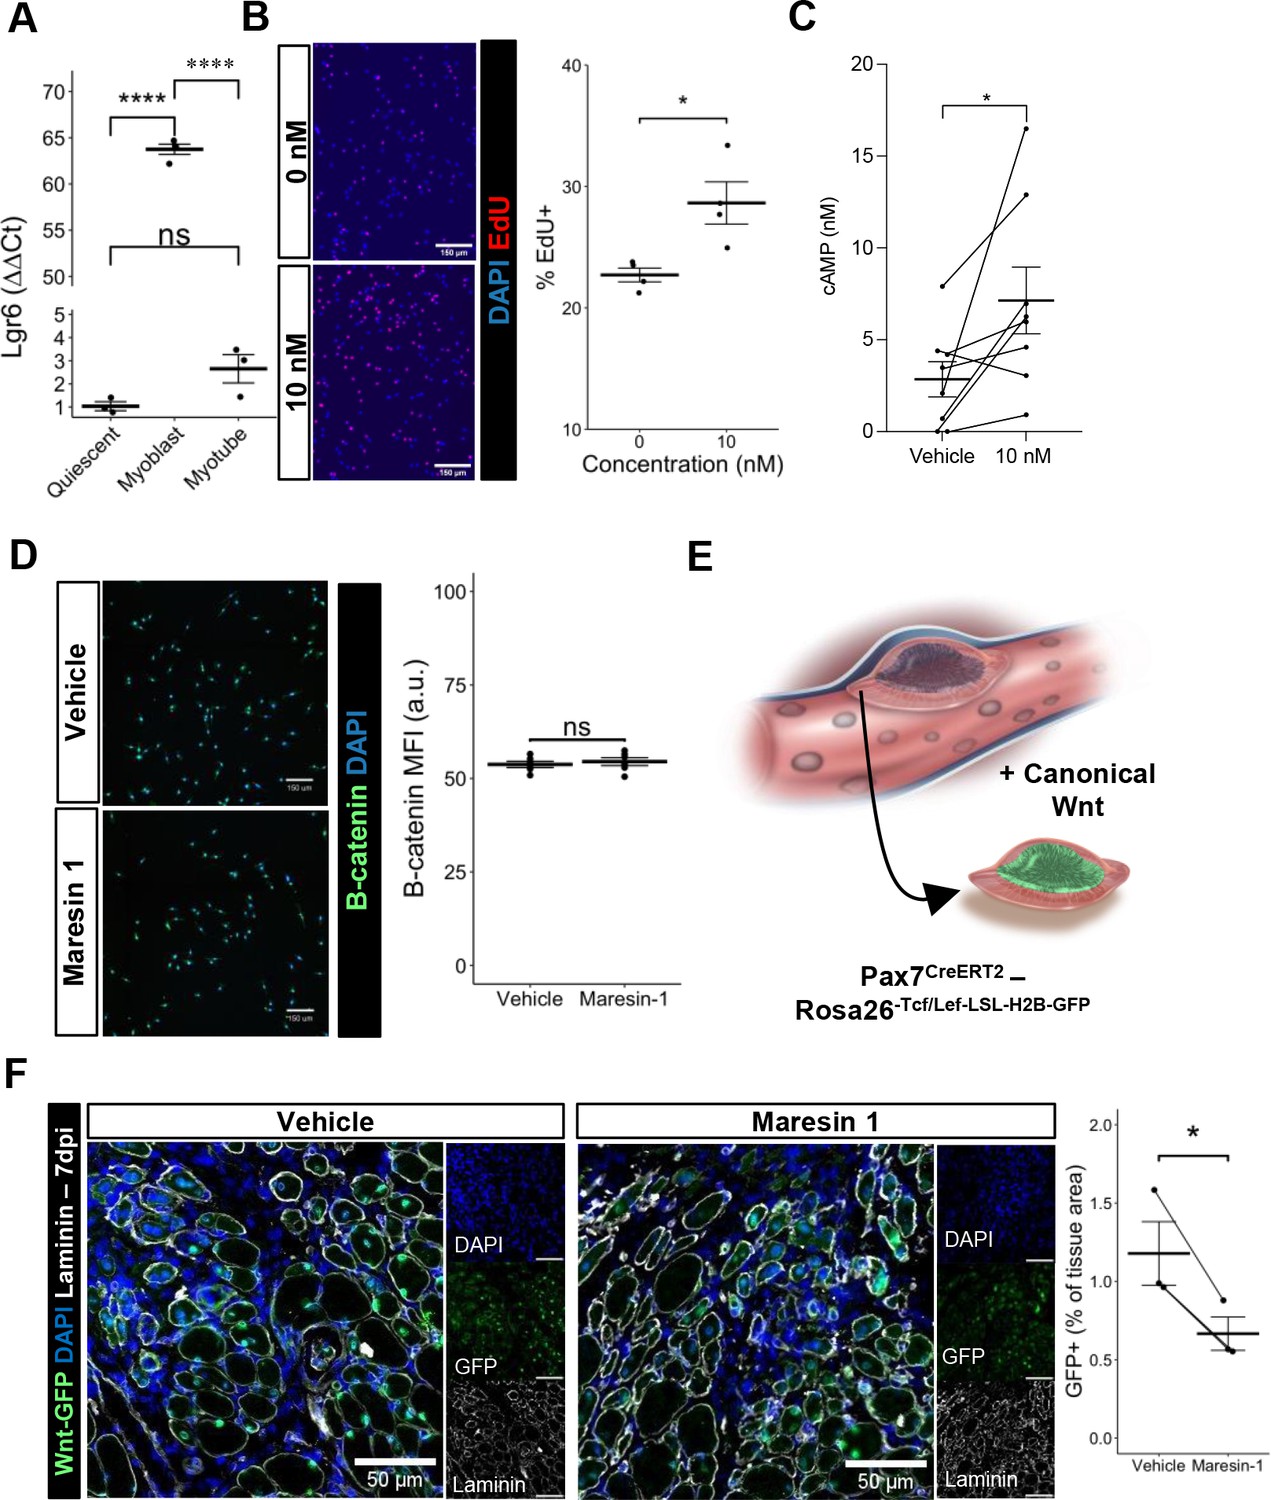
Maresin 1 impacts muscle stem cell (MuSC) proliferation through Lgr6.
(A) Lgr6 is highly upregulated in proliferating myoblasts by RT-qPCR. Graph shows mean ± SEM, ****p<0.0001 by one-way ANOVA and Benjamini–Hochberg (BH) post hoc analysis. n = 3–4 wells per condition. (B) Treatment of myoblasts with a low concentration of Maresin 1 in vitro increases proliferation based on EdU incorporation over 24 hr. Graph shows mean ± SEM, *p<0.05 by one-way ANOVA with BH post hoc analysis. n = 4 wells per condition, where each well was quantified using four separate 10× images. Scale bars indicate 150 um. (C) Measurement of cyclic AMP in primary myoblasts treated with 10 nM Maresin 1 or vehicle for 24 hr. n = 8 biological replicates, each value was calculated by averaging three wells per condition for each mouse. Data presented as mean ± SEM. *p<0.05 by two-sided paired t-test. (D) β-Catenin levels are unchanged following Maresin 1 treatment of wildtype MuSCs in vitro. ns denotes p>0.05 by two-sided, two-sample t-test. n = 6 wells per condition. (E) Schematic of MuSC lineage reporter for canonical Wnt signaling. In response to canonical Wnt, cells express green fluorescent protein in their nuclei. (F) In vivo treatment of volumetric muscle loss (VML) injuries with Maresin 1 reduces activation of canonical Wnt signaling in Pax7+ MuSCs using the P7Wnt-GFP mouse model at 7 d post injury (dpi). Graph shows mean ± SEM, *p<0.05 by two-sided, two-sample t-test. n = 3 mice per condition. Scale bars indicate 100 um.
Figure 4—figure supplement 1
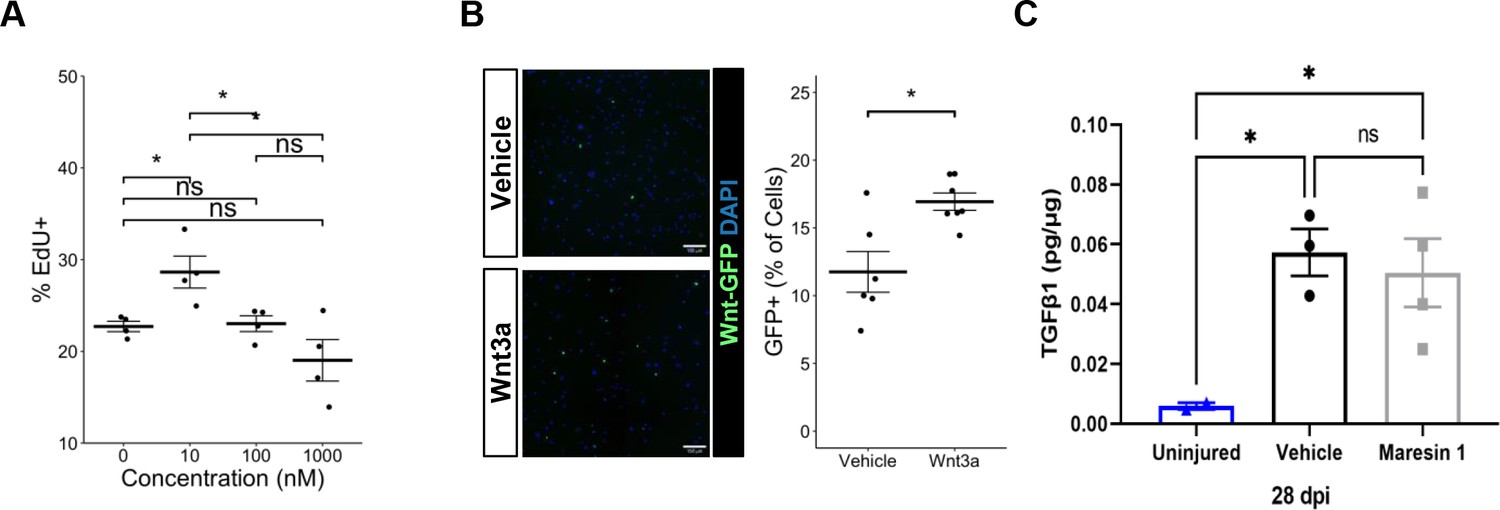
Experimental evaluation of parameters for Maresin 1 treatment of muscle stem cells (MuSCs) and their progeny in vitro.
(A) Maresin 1 dose–response curve showed the most impact on proliferation with treatment using 10 nM. There was no statistically significant effect with higher doses. *p<0.05 by one-way ANOVA with post hoc analysis. n = 4 wells per condition, each reflecting the combined analysis of 10 images. (B) MuSCs isolated from P7Wnt mice demonstrate increased percentage of GFP+ cells in response to treatment with recombinant Wnt3a protein. *p<0.05 by two-sided, two-sample t-test. n = 8 wells per condition. (C) ELISA assay targeting TGFβ1 in volumetric muscle loss (VML) injured tibialis anterior (TA) muscles. Maresin 1 and vehicle treatments were administered every 2 d throughout 7 d post injury (dpi). Points show mean ± SEM and *p<0.05 between uninjured and vehicle, uninjured and Maresin 1 treatments by one-way ANOVA and post hoc. n = 3–4 tissues from two mice per group.
Figure 5 with 1 supplement
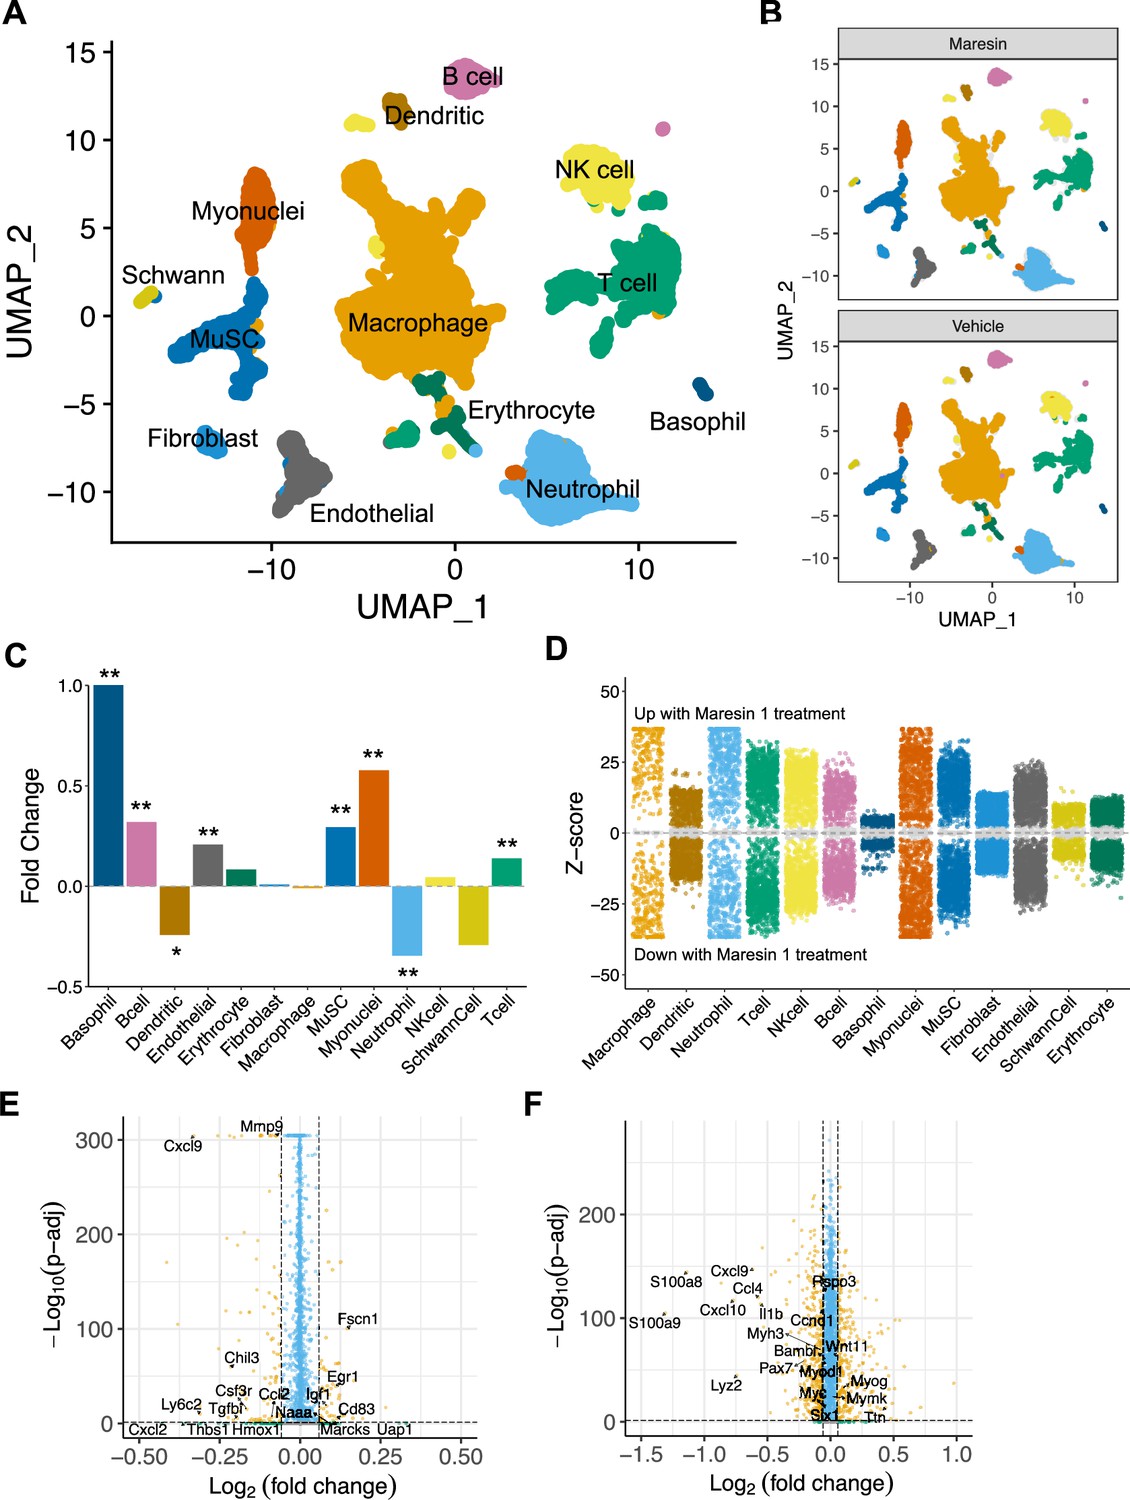
Cellular and molecular response to Maresin 1 repletion after degenerative volumetric muscle loss supports enhanced myogenic response and reduction of fibrotic macrophages at 7 d post injury (dpi).
(A) Uniform Manifold Approximation and Projection (UMAP) plots colored by clusters at a resolution of 0.2 and annotated into cell types. (B) UMAP plots split by treatment and colored by cell type. (C) Fold changes in cell-type abundance across conditions. Positive fold changes indicate increased abundance in Maresin 1-treated samples. *p<0.05, **p<0.01 by two-sided z test for proportions. N = 21,679 cells (10,462 cells for Maresin treatment and 11,217 cells for vehicle treatment). (D) Differential gene expression among each cell type across treatments normalized to the vehicle control. Gray region indicates adjusted p-value<0.05. z-scores and p-values were calculated for each gene using MAST. (E) Volcano plot showing differentially expressed genes among macrophages from vehicle vs Maresin 1-treated tissues. Fold changes and adjusted p-values were calculated using Wilcoxon sum-rank test. Fold change values > 2 (Log2 FC> 0.0585) and p-adjusted values < 0.05 were considered significant. (F) Volcano plot showing differentially expressed genes among MuSCs from vehicle vs Maresin 1treated tissues. Fold changes and adjusted p-values were calculated using Wilcoxon sum-rank test. Fold change values > 2 (Log2 FC > 0.0585) and p-adjusted values < 0.05 were considered significant and are plotted in yellow.
Figure 5—figure supplement 1
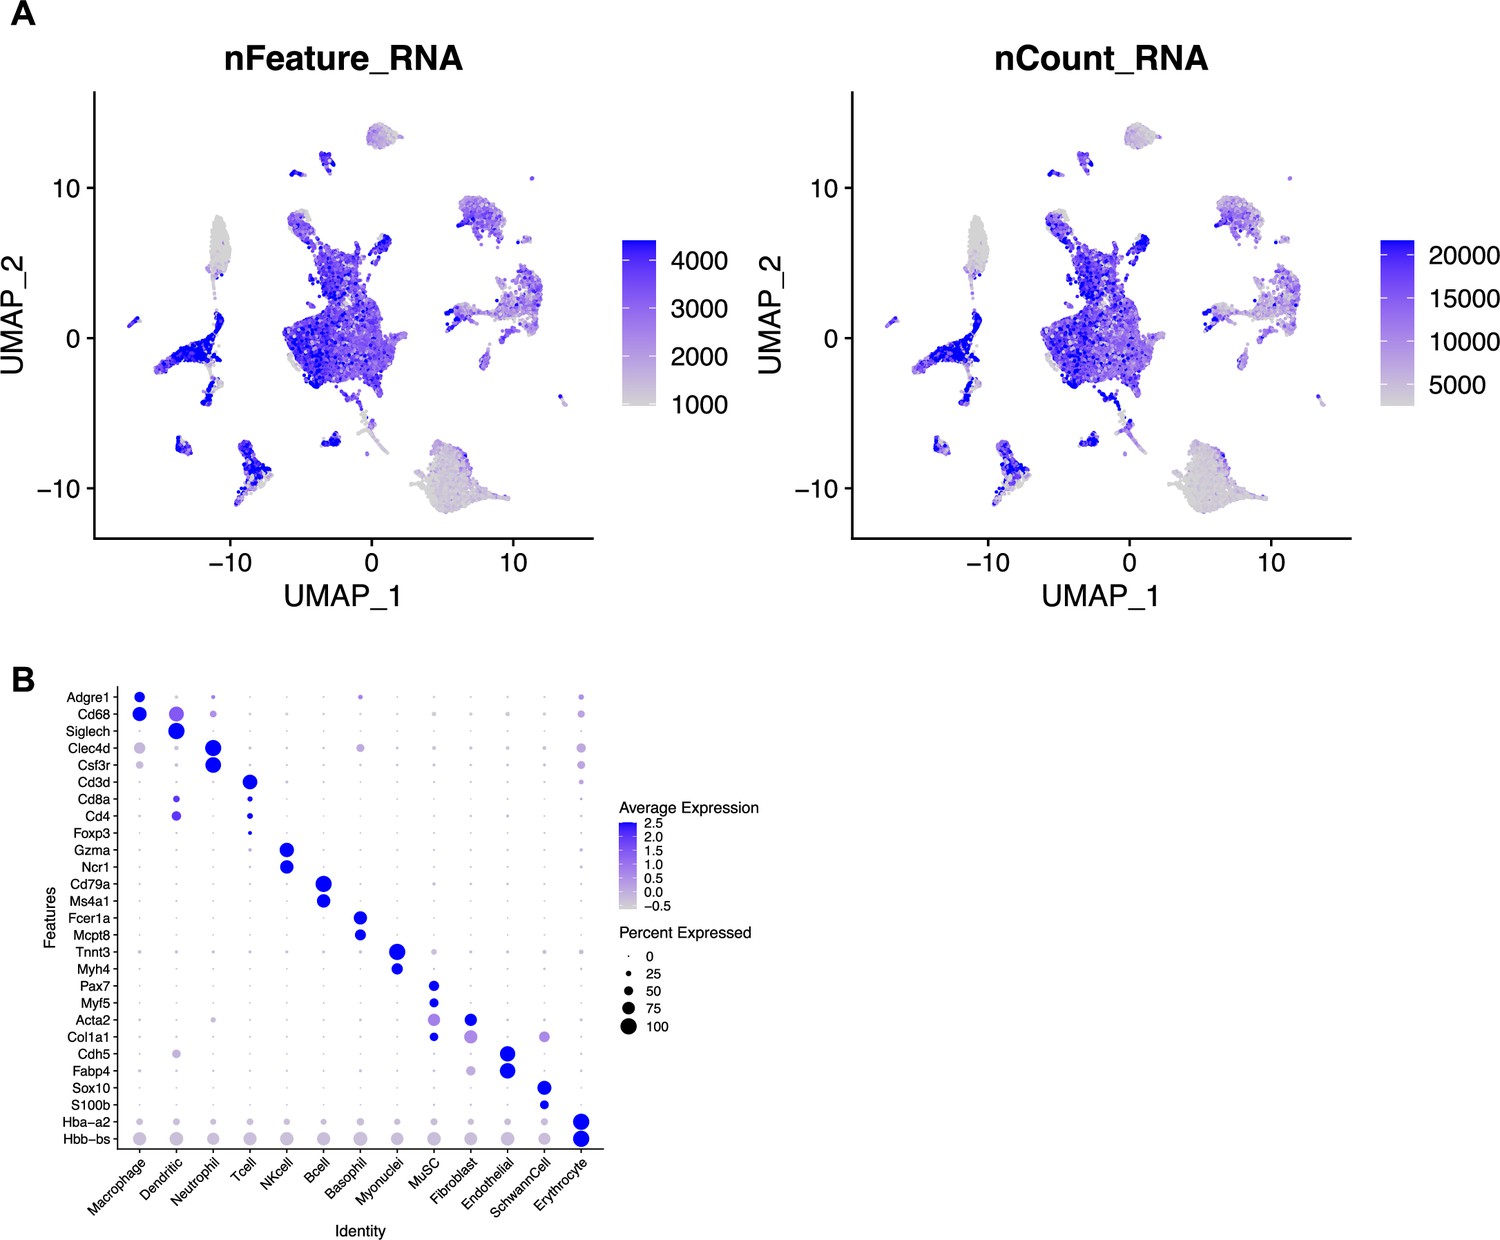
Quality control metrics for single-cell sequencing after volumetric muscle loss (VML) injury and treatment with Maresin 1.
(A) Uniform Manifold Approximation and Projection (UMAP) plots colored by the number of genes per cell (left) and the number of unique molecular identifiers per cell (right). (B) Dot plot of known marker gene expression for each cell type.
Tables
Appendix 1—key resources table
| Reagent type (species) or resource | Designation | Source or reference | Identifiers | Additional information |
|---|---|---|---|---|
| Biological sample (Mus musculus) | C57BL/6J wild-type mice | Jackson Labs | Jackson Stock 000664 | Female (2–3 mo) |
| Biological sample (M. musculus) | Pax7CreERT2/+;Rosa26Tcf/Lef-LSL-H2B-GFP mice | University of Michigan | Jackson stock 017763 crossed with Jackson stock 032577 | Female (2–3 mo) |
| Biological sample (M. musculus) | Pax7CreERT2 – Rosa26-TdTomato | University of Michigan | Jackson stock 017763 crossed with Jackson stock 007914 | Female (2–3 mo) |
| Antibody | AF488 anti-mouse monoclonal F4/80, clone: BM8, isotype: Rat IgG2a, κ | BioLegend | 123119; RRID:AB_893491 | FC (1:200) |
| Antibody | APC-Cy7 anti-mouse monoclonal Ly-6G, clone: 1A8, isotype: Rat IgG2a, κ | BioLegend | 127624; RRID:AB_10640819 | FC (1:400) |
| Antibody | APC anti-mouse monoclonal Ly-6A/E (Sca-1), clone: D7, isotype: Rat IgG2a, κ | BioLegend | 108112; RRID:AB_313349 | FC (1:400) |
| Antibody | APC anti-mouse monoclonal CD45, clone: 30-F11, isotype: Rat IgG2b, κ | BioLegend | 103112; RRID:AB_312977 | FC (1:400) |
| Antibody | APC anti-mouse monoclonal TER-119, clone: TER-119, isotype: Rat IgG2b, κ | BioLegend | 116212; RRID:AB_313713 | FC (1:400) |
| Antibody | APC anti-mouse monoclonal CD31, clone: 390, Isotype: Rat IgG2a, κ | BioLegend | 102410; RRID:AB_312905 | FC (1:400) |
| Antibody | APC anti-mouse/human monoclonal CD11b, clone: M1/70. Isotype: Rat IgG2b, κ | BioLegend | 101212; RRID:AB_312795 | FC (1:400) |
| Antibody | PE anti-mouse/rat monoclonal CD29 (B1 int), clone: HMβ1-1, isotype: Armenian Hamster IgG | BioLegend | 102208; RRID:AB_312885 | FC (1:200) |
| Antibody | Biotin Rat AntiMouse monoclonal CD184, clone: 2B11/CXCR4 (RUO), isotype: Rat IgG2b, κ | BD Biosciences | 551968; RRID:AB_394307 | FC (1:200) |
| Antibody | Anti-mouse monoclonal CD68, clone: FA-11, isotype: IgG2a | Bio-Rad | MCA1957 | IF (1:50) |
| Antibody | Mouse monoclonal Anti-human MYH3 | DHSB | F1.652 | IF (1:20) |
| Antibody | Chicken polyclonal Anti-mouse GFP | Abcam | ab13970; RRID:AB300798 | IF (1:1000) |
| Antibody | Rabbit anti-mouse laminin 1+2, Isotype: Polyclonal IgG | Abcam | ab7463; RRID:AB_305933 | IF (1:500) |
| Antibody | Rabbit polyclonal Anti-RFP | Rockland | 600-401-379; RRID:AB_2209751 | IF (1:50) |
| Antibody | Rabbit polyclonal Anti-Beta catenin polyclonal (CAT-15) | Thermo Fisher | 71-2700; RRID:AB_2533982 | IF (1:100) |
| Antibody | Goat polyclonal Anti-rabbit IgG (H+L), Alexa Fluor 647 conjugate | Thermo Fisher | A27040; RRID:AB_2536101 | IF (1:500) |
| Antibody | Goat polyclonal Anti-rat (H+L), Alexa Fluor 647 conjugate | Thermo Fisher | A21247; RRID:AB_141778 | IF (1:500) |
| Antibody | Goat polyclonal Anti-mouse (H+L), Alexa Fluor 488 conjugate | Thermo Fisher | A28175; RRID:AB_2536161 | IF (1:500) |
| Antibody | Goat polyclonal Anti-chicken IgY (H+L), Alexa Fluor 488 conjugate | Thermo Fisher | A32931TR; RRID:AB_2866499 | IF (1:500) |
| Antibody | Goat polyclonal Anti-rabbit (H+L), Alexa Fluor 555 conjugate | Thermo Fisher | A21247; RRID:AB_141778 | IF (1:500) |
| Sequence-based reagent | PrimeTime Mouse GAPDH Primer | Integrated DNA Technologies | Mm.PT.39a1 | |
| Sequence-based reagent | PrimeTime Mouse Lgr6 Primer | Integrated DNA Technologies | Mm.PT.58.9348010 | |
| Sequence-based reagent | Mouse Lgr6 DsiRNA #1 | Integrated DNA Technologies | mm.Ri.Lgr6.13.2 | |
| Sequence-based reagent | Mouse Lgr6 DsiRNA #2 | Integrated DNA Technologies | mm.Ri.Lgr6.13.1 | |
| Sequence-based reagent | Cell Multiplexing Oligos | 10x Genomics | 1000261 | |
| Peptide, recombinant protein | Bovine serum albumin | Fisher Scientific | BP9703-100 | |
| Peptide, recombinant protein | Fibroblast growth factor basic | Gibco-Invitrogen | PHG0263 | |
| Peptide, recombinant protein | 0.25% Trypsin EDTA | Gibco-Invitrogen | 25200072 | |
| Peptide, recombinant protein | HALT Protease Inhibitor Cocktail | Thermo Fisher | 87786 | |
| Chemical compound, drug | Dispase II (activity ≥ 0.5 units/mg solid) | Sigma | D4693-1G | Digestion of tissue to extract MuSCs |
| Chemical compound, drug | Collagenase type II (654 U/mg, non-specific proteolytic activity 487 U/mg) | Life Technologies | 17101015 | Digestion of tissue to extract MuSCs |
| Chemical compound, drug | DMEM, high glucose, pyruvate | Life Technologies | 11995065 | |
| Chemical compound, drug | Ham’s F-10 Nutrient Mix | Life Technologies | 11550043 | |
| Chemical compound, drug | Tissue Plus O.C.T Compound | Fisher Scientific | 23-730-571 | |
| Chemical compound, drug | Magnesium sulfate heptahydrate | Sigma-Aldrich | 63138-250G | |
| Chemical compound, drug | Sodium bicarbonate | Sigma-Aldrich | S5761 | |
| Chemical compound, drug | SafeClear II | Fisher Scientific | 23-044192 | |
| Chemical compound, drug | Picric acid | Sigma-Aldrich | P6744-1GA | |
| Chemical compound, drug | Glacial acetic acid | Sigma-Aldrich | BP2401-500 | |
| Chemical compound, drug | Xylenes | Sigma-Aldrich | 534056-4L | |
| Chemical compound, drug | Permount | Fisher Scientific | SP15-100 | |
| Chemical compound, drug | 0.5 M EDTA | Invitrogen | 15575-038 | |
| Chemical compound, drug | Sodium azide | Sigma-Aldrich | 71289 | |
| Chemical compound, drug | 4% paraformaldehyde in PBS | Thermo Fisher | J19943-K2 | |
| Chemical compound, drug | Penicillin streptomycin | Gibco-Invitrogen | 15640055 | |
| Chemical compound, drug | Maresin 1 | Cayman Chemicals | 10878 | |
| Chemical compound, drug | Tween-20 | Sigma-Aldrich | P1379 | |
| Chemical compound, drug | TritonX-100 | Sigma-Aldrich | T8787 | |
| Chemical compound, drug | Tamoxifen | Sigma-Aldrich | T2859-1G | |
| Chemical compound, drug | Corn Oil | Sigma-Aldrich | C8267-2.5L | |
| Commercial assay or kit | Satellite Cell Isolation Kit, mouse | Miltenyi | 130-104-268 | |
| Commercial assay or kit | TGF beta 1 DuoSet ELISA Kit | R&D Systems | DY1679 | |
| Commercial assay or kit | Pierce BCA Assay Kit | Thermo Fisher | 23227 | |
| Commercial assay or kit | EdU ClickIt Reaction Kit | Thermo Fisher | C10340 | |
| Commercial assay or kit | SuperScript III First-Strand Synthesis Kit | Thermo Fisher | 18080051 | |
| Commercial assay or kit | QIAGEN RNeasy Mini Kit | QIAGEN | 74104 | |
| Commercial assay or kit | Qubit RNA HS Assay | Thermo Fisher | Q32852 | |
| Commercial assay or kit | Single cell 3’ Library & Gel Bead Kit | 10x Genomics | 120267 | |
| Commercial assay or kit | cAMP-Glo Assay | Promega | V1501 | |
| Software, algorithm | CellRanger v7.0.0 | 10x Genomics | https://support.10xgenomics.com/single-cell-gene-expression/software/downloads | |
| Software, algorithm | R v4.2.1 | The R Foundation for Statistical Computing | https://www.r-project.org/; RRID:SCR_001905 | |
| Software, algorithm | Python | https://www.python.org/ | ||
| Software, algorithm | MetaboDiff v0.9.5 | Mock et al., 2018; Mock, 2020 | https://github.com/andreasmock/MetaboDiff | |
| Software, algorithm | DPGP v0.1 | McDowell et al., 2018a; McDowell et al., 2018b | https://github.com/PrincetonUniversity/DP_GP_cluster | |
| Software, algorithm | MATLAB_R2020a | MathWorks | https://www.mathworks.com/products/matlab.html | |
| Software, algorithm | Seurat v4.2.1 | Stuart et al., 2019 | https://satijalab.org/seurat/; RRID:SCR_007322 | |
| Software, algorithm | ggplot2 v3.2.1 | Wickham et al., 2016 | https://ggplot2.tidyverse.org; RRID:SCR_014601 | |
| Software, algorithm | FlowJo v10 | https://www.flowjo.com; RRID:SCR_008520 | ||
| Software, algorithm | ImageJ v2.1.0 | https://imagej.net/ImageJ; RRID:SCR_002285 | ||
| Software, algorithm | Cellpose | Stringer et al., 2021 | RRID:SCR_021716 | |
| Software, algorithm | LabelsToROIs | Waisman et al., 2021 | https://labelstorois.github.io/ | |
| Software, algorithm | Bioinformatics analysis code | This paper | https://github.com/AguilarLab/Maresin1 (copy archived at Castor-Macias et al., 2023) | Algorithm used to generate Figure 5, Figure 5—figure supplement 1. Refer to data processing and analysis under single-cell RNA sequencing |
| Other | Streptavidin PE-Cyanine7 | Thermo Fisher | 25-4317-82; RRID:AB_10116480 | FC (1:100) |
| Other | scRNA-seq datasets | This paper | GSE215808 | Refer to data processing and analysis under single-cell RNA sequencing. |
| Other | LS Columns | Miltenyi | 130-042-401 | MACS isolation |
| Other | UltraComp eBeads | Fisher Scientific | 01-2222-42 | Single color controls for Flow Cytometry |
| Other | RIPA Buffer | Thermo Fisher | 89900 | Tissue homogenization reagent in ELISA assays |
| Other | Lipofectamine RNAiMAX | Invitrogen | 13-778-030 | Transfection reagent |
| Other | Hoechst 33342 | Thermo Fisher | H3570 | IF (1:1000) nuclear stain |
| Other | SYBR Green PCR MasterMix | Thermo Fisher | 4309155 | PCR reagent |
| Other | Matrigel | BD Biosciences | 356234 | Cell culture coating reagent |
| Other | Horse Serum | Gibco-Invitrogen | 26050088 | Cell culture |
| Other | Prolong Diamond | Thermo Fisher | P36965 | Mounting media |
| Other | Direct Red 80 | Fisher Scientific | AAB2169306 | Picrosirius red stain |
| Other | Hematoxylin | Ricca Chemical Company | 3530-16 | H&E stain |
| Other | Eosin | EMD-Millipore | 588X-75 | H&E stain |
| Other | Fetal bovine serum | Life Technologies | 10437028 | Tissue digestion reagent |
| Other | Normal goat serum | Abcam | Ab7481; RRID:AB_2716553 | IHC stain |
| Other | Propidium iodide – 1.0 mg/mL solution in Water | Life Technologies | P3566 | FC (1:400) |
| Other | 7-AAD | BioLegend | 420403 | FC (1:200) |
| Other | Mouse on Mouse blocking reagent | Vector Labs | MKB-2213 | IHC stain |
Additional files
-
MDAR checklist
- https://cdn.elifesciences.org/articles/86437/elife-86437-mdarchecklist1-v2.docx
-
Supplementary file 1
Metabolite concentration (pmol/g) for different pathways in uninjured, 1 mm VML, and 2 mm (TA) tissue homogenates.
- https://cdn.elifesciences.org/articles/86437/elife-86437-supp1-v2.xlsx
Download links
A two-part list of links to download the article, or parts of the article, in various formats.
Downloads (link to download the article as PDF)
Open citations (links to open the citations from this article in various online reference manager services)
Cite this article (links to download the citations from this article in formats compatible with various reference manager tools)
Maresin 1 repletion improves muscle regeneration after volumetric muscle loss
eLife 12:e86437.
https://doi.org/10.7554/eLife.86437


