Exploratory mass cytometry analysis reveals immunophenotypes of cancer treatment-related pneumonitis
- Department of Respiratory Medicine, Graduate School of Medical Sciences, Kyushu University, Japan
- Department of Respiratory Medicine, NHO Fukuoka National Hospital, Japan
- Division of Immunogenetics, Department of Immunobiology and Neuroscience, Medical Institute of Bioregulation, Kyushu University, Japan
- Division of Immunology and Genome Biology, Department of Molecular Genetics, Medical Institute of Bioregulation, Kyushu University, Japan
Figures
Figure 1
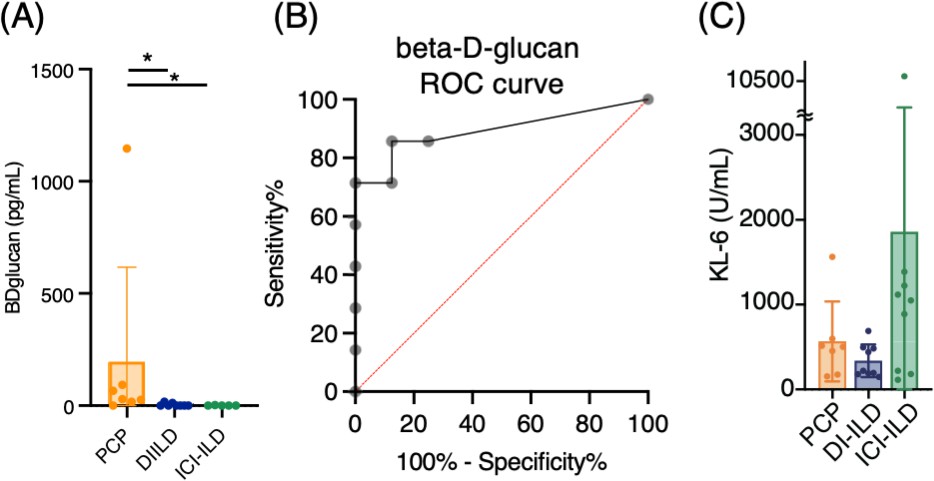
Serum levels of β-d-glucan and KL-6 from patients with Pneumocystis jirovecii pneumonia (PCP), cytotoxic drug-related interstitial lung disease (DI-ILD), and immune-checkpoint inhibitor-related ILD (ICI-ILD).
(A) Serum levels of β-d-glucan from patients with PCP, DI-ILD, and ICI-ILD. (B) A receiver operating characteristic (ROC) curve was constructed to evaluate the diagnostic utility of β-d-glucan for PCP, with values from the DI-ILD group used as a reference. The area under the curve was determined to be 0.8929. (C) Serum levels of KL-6.
Figure 2 with 2 supplements
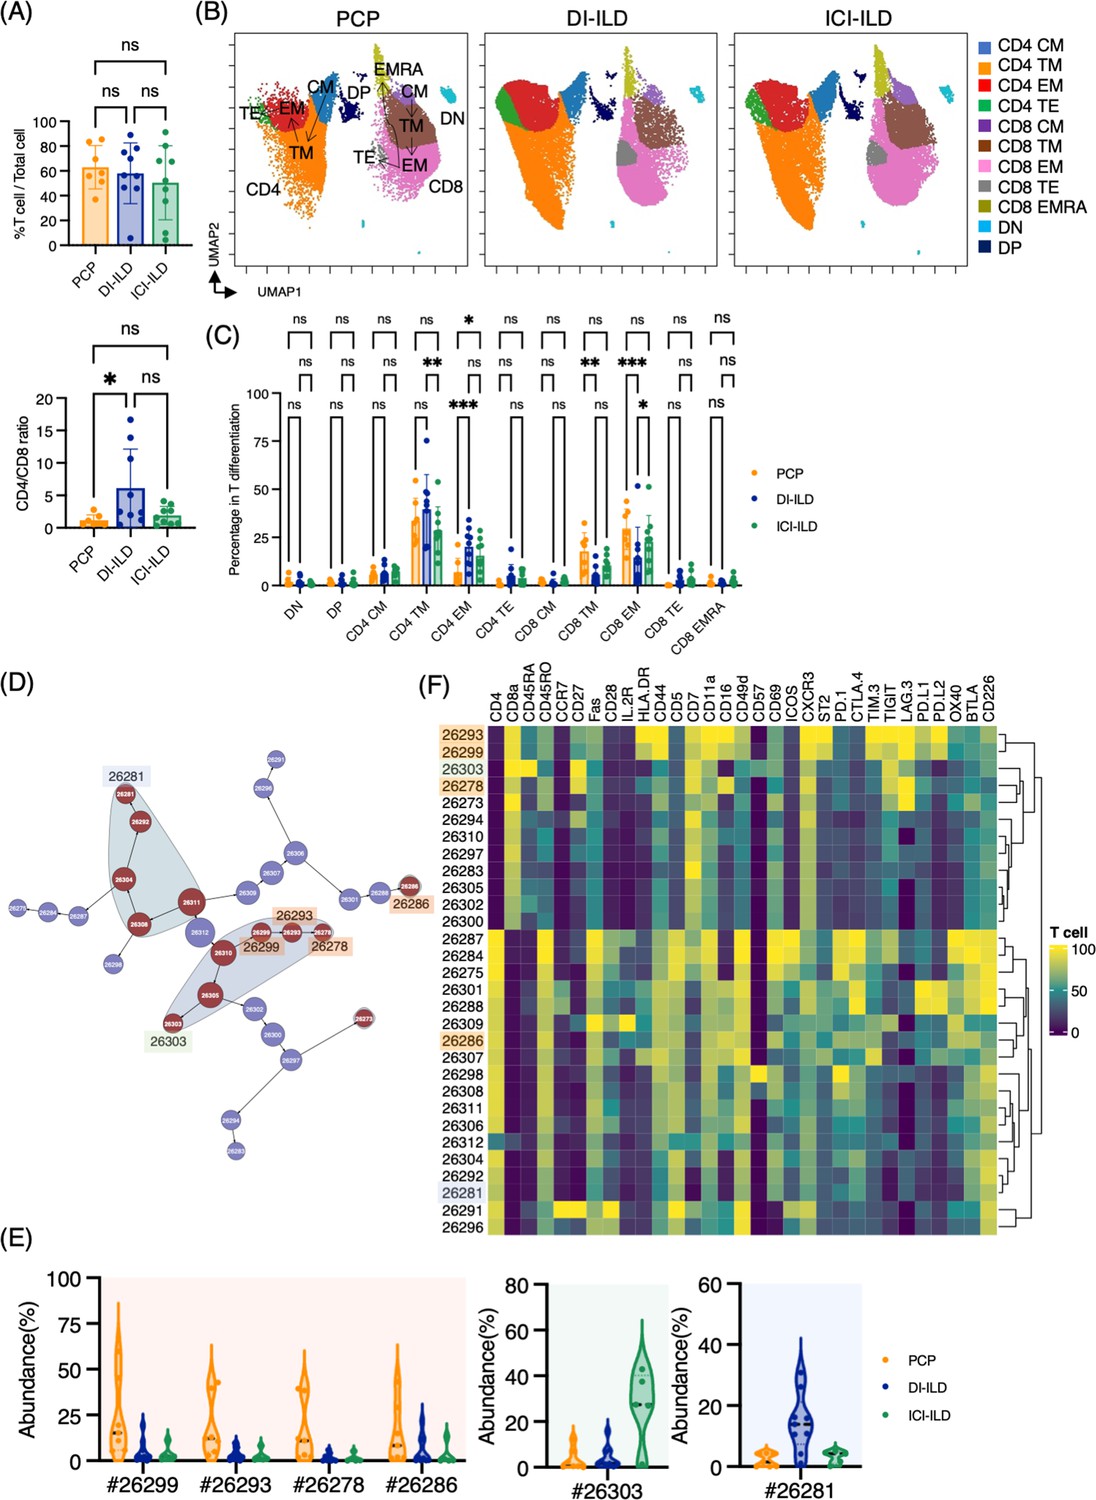
Characterization of T cell subsets in bronchoalveolar lavage fluid (BALF) from patients with Pneumocystis jirovecii pneumonia (PCP), cytotoxic drug-related interstitial lung disease (DI-ILD), and immune-checkpoint inhibitor-related ILD (ICI-ILD).
(A) Percentage of T cells (defined as CD2+CD3+) in CD45+ BALF cells and CD4/CD8 ratio in T cells from patients with PCP, DI-ILD, and ICI-ILD. (B) Uniform Manifold Approximation and Projection (UMAP) of concatenated samples visualizing the distribution of T cell subpopulations. Central memory (CM) T cells were defined by CCR7+ CD45RO+ CD28+ Fas+, transitional memory (TM) by CCR7– CD45RO+ CD28+ Fas+, effector memory (EM) by CCR7– CD45RO+ CD28– Fas+, terminal effector (TE) by CCR7– CD45RO+/– Fas–, and effector memory RA (EMRA) by CCR7– CD45RO– CD45RA+ Fas+/–. Arrows indicate the trajectory of T cell differentiation. DN: CD4– CD8– double negative; DP: CD4+ CD8+ double positive. (C) Percentage of T cell subpopulations. (D) Citrus network tree visualizing the hierarchical relationship of each marker between identified T cell populations gated by CD45+CD2+ CD3+ from PCP (n = 7), DI-ILD (n = 9), and ICI-ILD (n = 5). Clusters with significant differences are represented in red, and those without significant differences in blue. Circle size reflects the number of cells within a given cluster. (E) Citrus-generated violin plots for six representative and differentially regulated populations. Each cluster number (#) corresponds to the number shown in panel (D). (F) Heatmap demonstrates the expression of various markers in different clusters of T cells, as identified through the Citrus analysis. All differences in abundance were significant at a false discovery rate < 0.01.
Figure 2—figure supplement 1

A T cell gate (CD2+CD3+) and Citrus analysis of T cell populations in bronchoalveolar lavage fluid (BALF) cells from Pneumocystis jirovecii pneumonia (PCP), cytotoxic drug-related interstitial lung disease (DI-ILD), and immune-checkpoint inhibitor-related ILD (ICI-ILD).
(A) Representative dot plots demonstrating the gating strategy for identification of T cell populations within BALF samples from patients with Pneumocystis jirovecii pneumonia (PCP), drug-induced interstitial lung disease (DI-ILD), and immune checkpoint inhibitor-induced lung disease (ICI-ILD). (B) Density plots comparing the expression of programmed death-ligand 1 (PD-1) on T cells from patients treated with Nivolumab versus other ICIs. (C) Citrus analysis of T cell populations with each surface marker. (D) Box plots depicting the abundance of distinct T cell clusters identified across different patient groups.
Figure 2—figure supplement 2
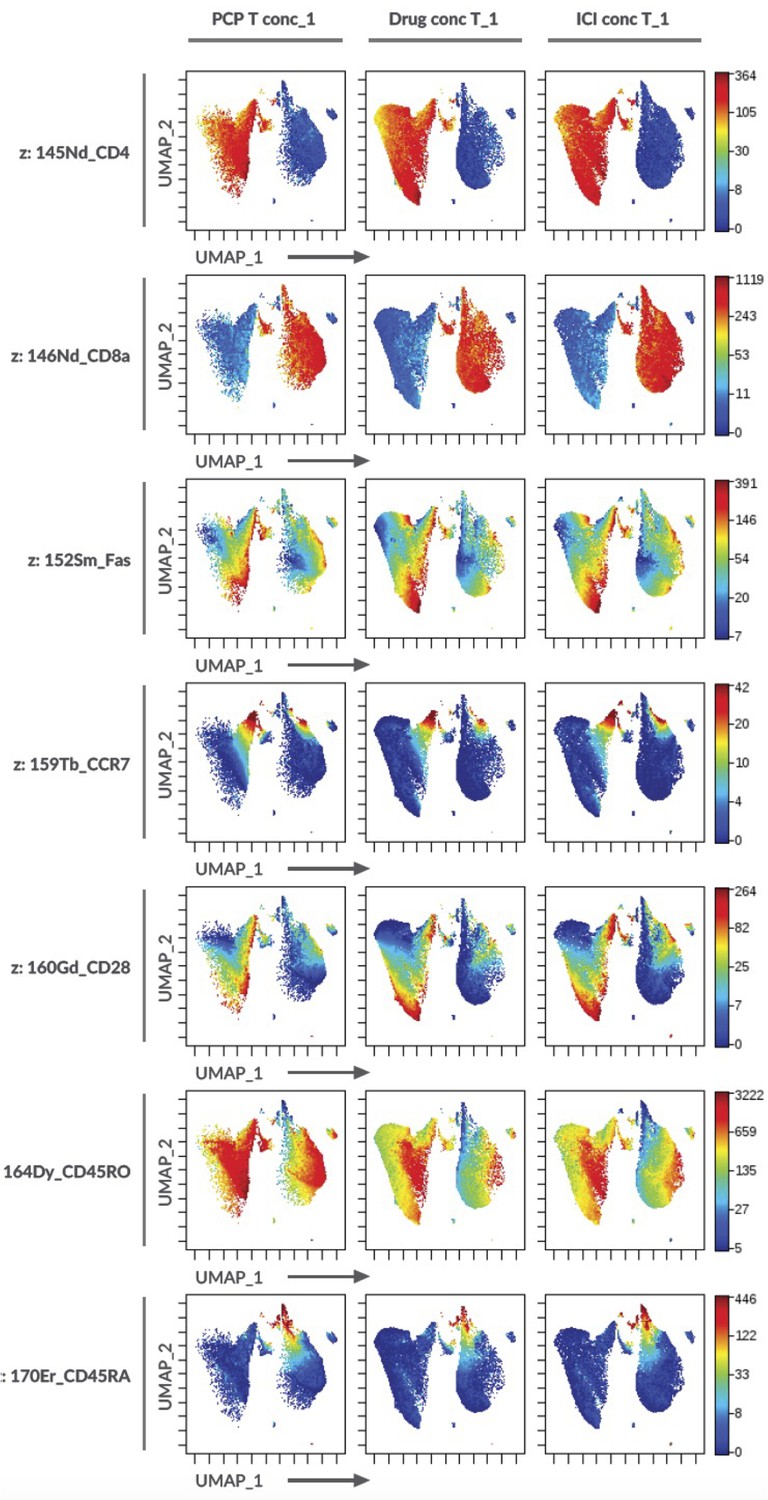
T cell marker expression on the Uniform Manifold Approximation and Projection (UMAP) in Figure 2B.
Figure 3 with 2 supplements
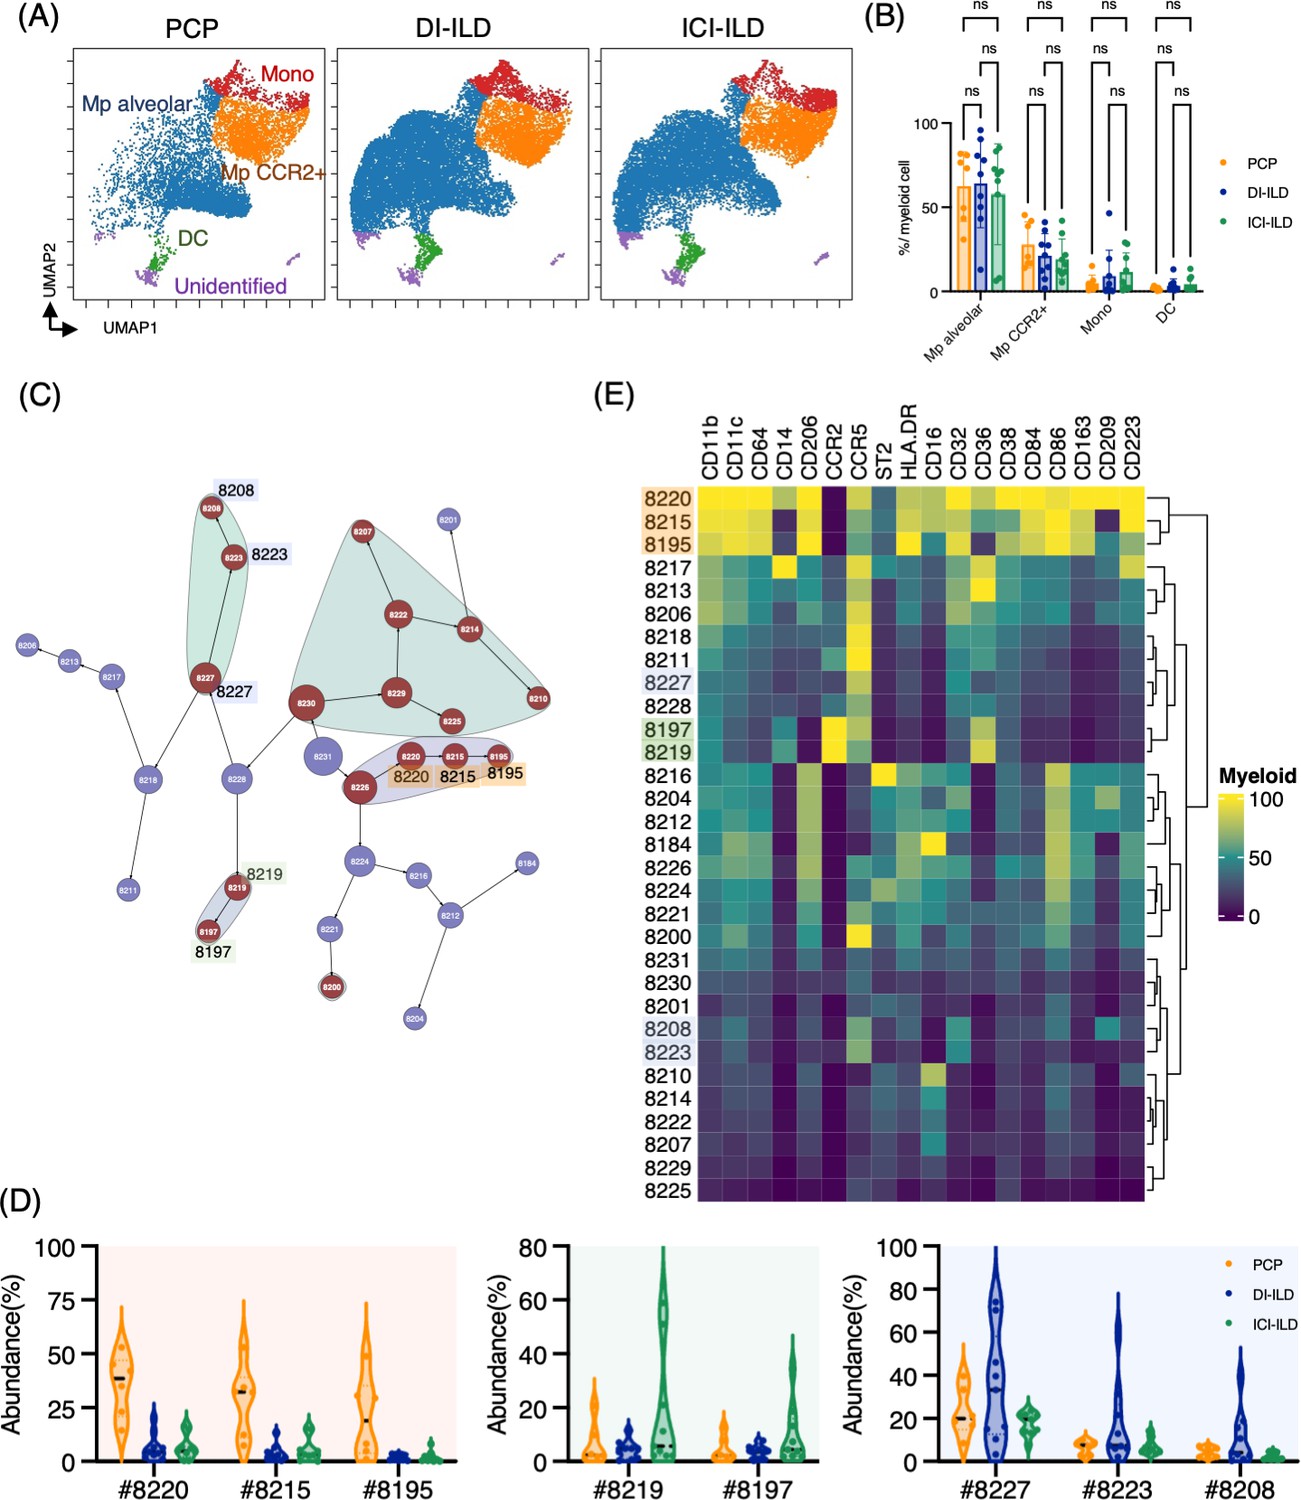
Characterization of myeloid cell subsets in bronchoalveolar lavage fluid (BALF) from patients with Pneumocystis jirovecii pneumonia (PCP), cytotoxic drug-related interstitial lung disease (DI-ILD), and immune-checkpoint inhibitor-related ILD (ICI-ILD).
(A) Uniform Manifold Approximation and Projection (UMAP) of concatenated samples visualizing the distribution of myeloid cell subpopulations in CD3– CD11b+ CD11c+ gated myeloid cells in BALF from patients with PCP, DI-ILD, and ICI-ILD. Monocytes were defined by CD64+ CD14+, CCR2+ macrophages (Mp) by CD64+ CD14– CCR2+, alveolar Mp by CD64+ CD14–CCR2– CD206+, dendritic cells (DC) by CD64–CD14–CD206–CD11c+ HLA-DR+, and unidentified subsets by CD64– CD11b+/– CD11c+/– CD14– CD206–. (B) Percentage of myeloid cell subpopulations in PCP (n = 7), DI-ILD (n = 9), and ICI-ILD (n = 9). Dot plots represent individual samples. (C) Citrus network tree visualizing the hierarchical relationship of each marker between identified myeloid cell populations gated by CD45+ CD3– CD11b+ CD11c+ from PCP (n = 6), DI-ILD (n = 9), and ICI-ILD (n = 9). Clusters with significant differences are represented in red, and those without significant differences in blue. Circle size reflects the number of cells within a given cluster. (D) Citrus-generated violin plots for six representative and differentially regulated populations. Each cluster number (#) corresponds to the number shown in panel (C). All differences in abundance were significant at a false discovery rate < 0.01. (E) Heatmap demonstrates the expression of various markers in different clusters of myeloid cells, as identified through the Citrus analysis.
Figure 3—figure supplement 1
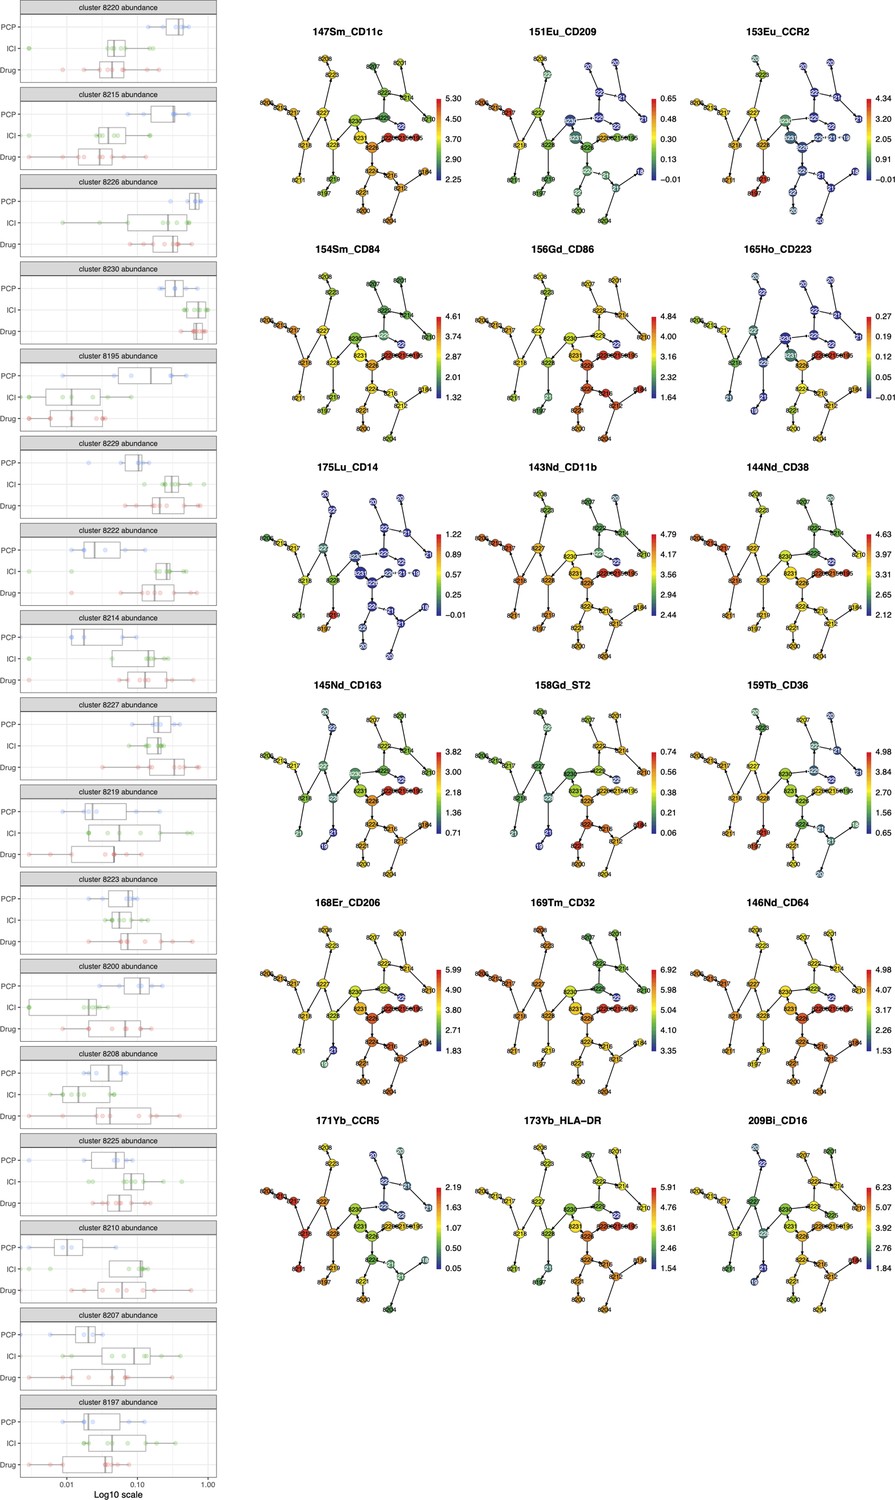
The Citrus analysis of myeloid cell populations in bronchoalveolar lavage fluid (BALF) cells from Pneumocystis jirovecii pneumonia (PCP), cytotoxic drug-related interstitial lung disease (DI-ILD), and immune-checkpoint inhibitor-related ILD (ICI-ILD).
Figure 3—figure supplement 2

Myeloid cell marker expression on the Uniform Manifold Approximation and Projection (UMAP) in Figure 3A.
Figure 4 with 1 supplement
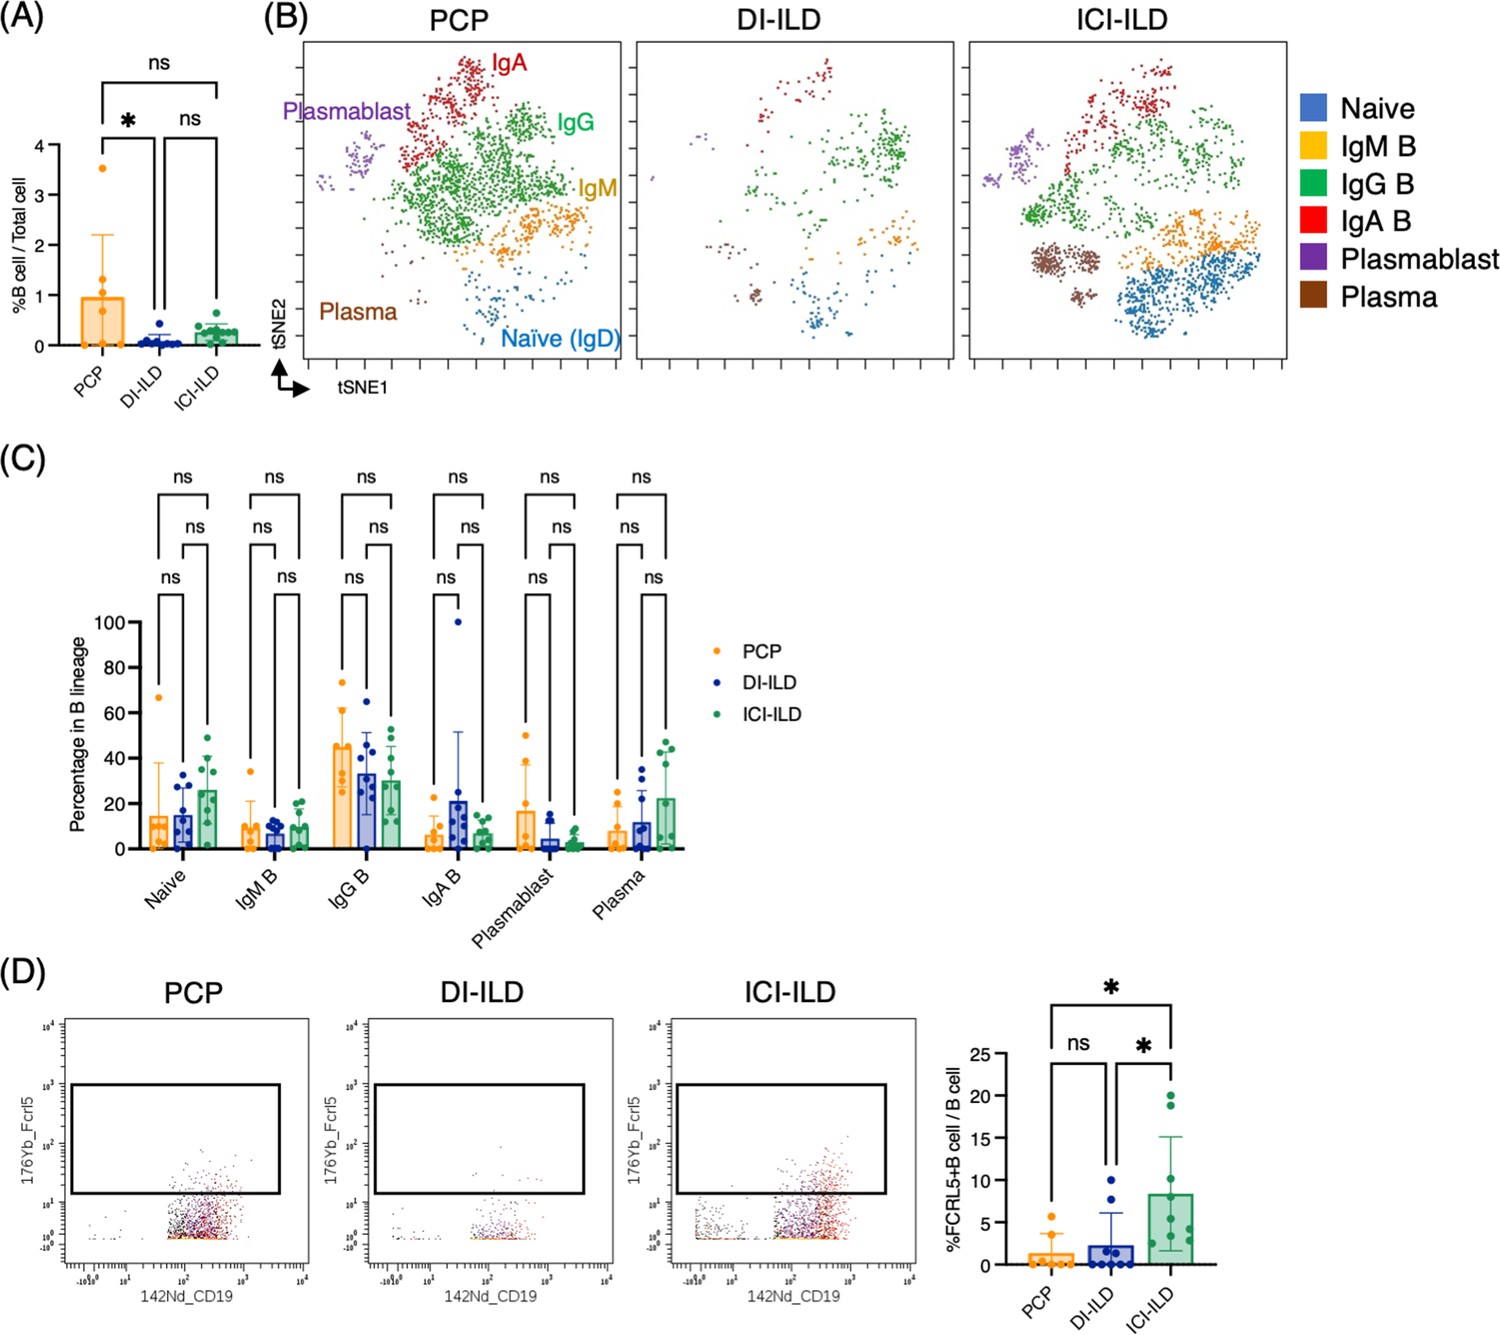
Characterization of B cell subsets in bronchoalveolar lavage fluid (BALF) from patients with Pneumocystis jirovecii pneumonia (PCP), cytotoxic drug-related interstitial lung disease (DI-ILD), and immune-checkpoint inhibitor-related ILD (ICI-ILD).
(A) Percentages of B cells and plasma cells in CD45+ BALF cells. (B) t-stochastic neighborhood embedding (t-SNE) plots of concatenated samples visualizing the distribution of B cell subpopulations in CD64–CD3– and CD19+ or CD138+ gated B cells in BALF from patients with PCP, DI-ILD, and ICI-ILD. Naive B cells are defined by CD19+IgD+, IgM B cells: CD19+ IgM+, IgG B cells: CD19+ IgG+, IgA B cells: CD19+ IgA+, plasmablasts: CD19+ CD27+ CD38+ CD138–, plasma cells: CD19– CD138+ and IgG+ or IgA+. (C) Percentages of B cell subpopulations in PCP (n = 7), DI-ILD (n = 9), and ICI-ILD (n = 9). Dot plots represent individual samples. (D) Two-dimensional dot plots depicting FCRL5-expressing B cells within a gated population of B cells defined as CD64–CD3– and CD19+ or CD138+. Percentages of FCRL5-expressing B cells within the total B cell population are also shown.
Figure 4—figure supplement 1
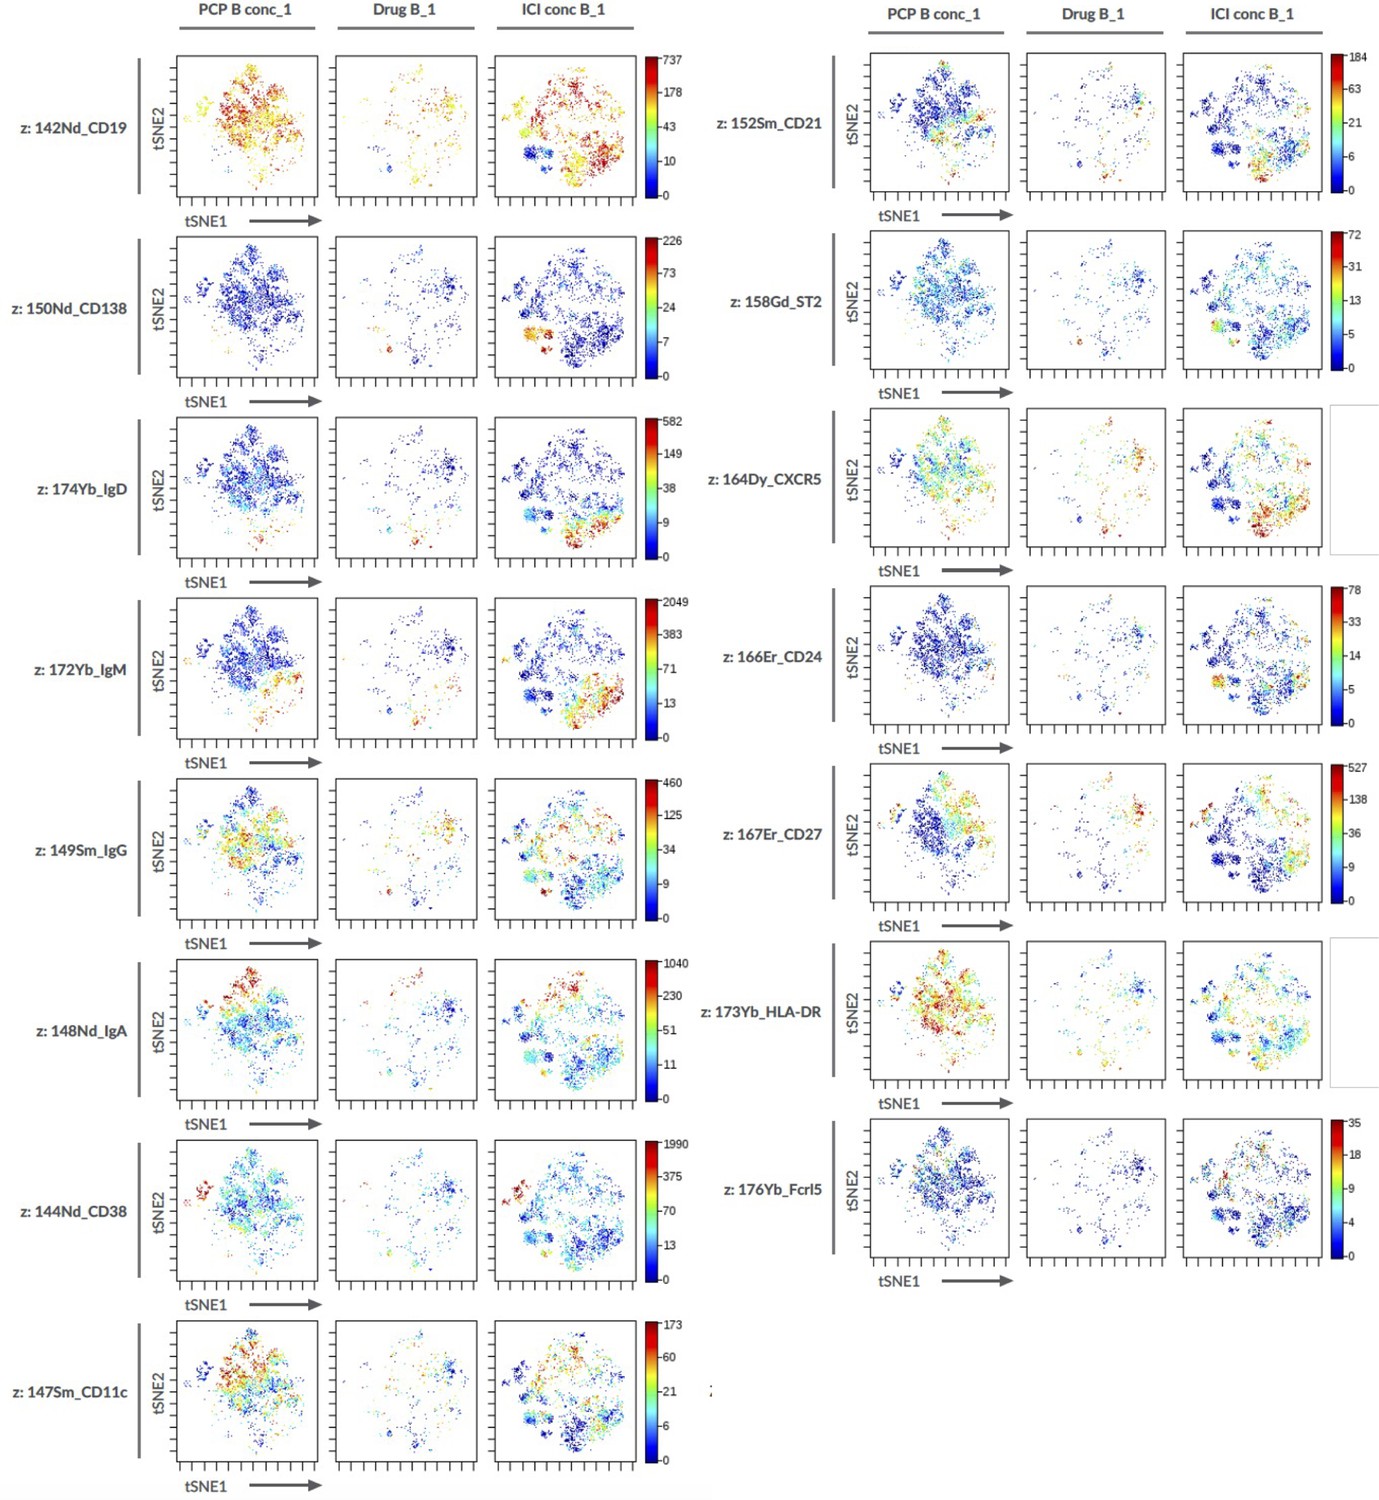
B cell marker expression on the t-stochastic neighborhood embedding (t-SNE) projection in Figure 4B.
Figure 5 with 1 supplement
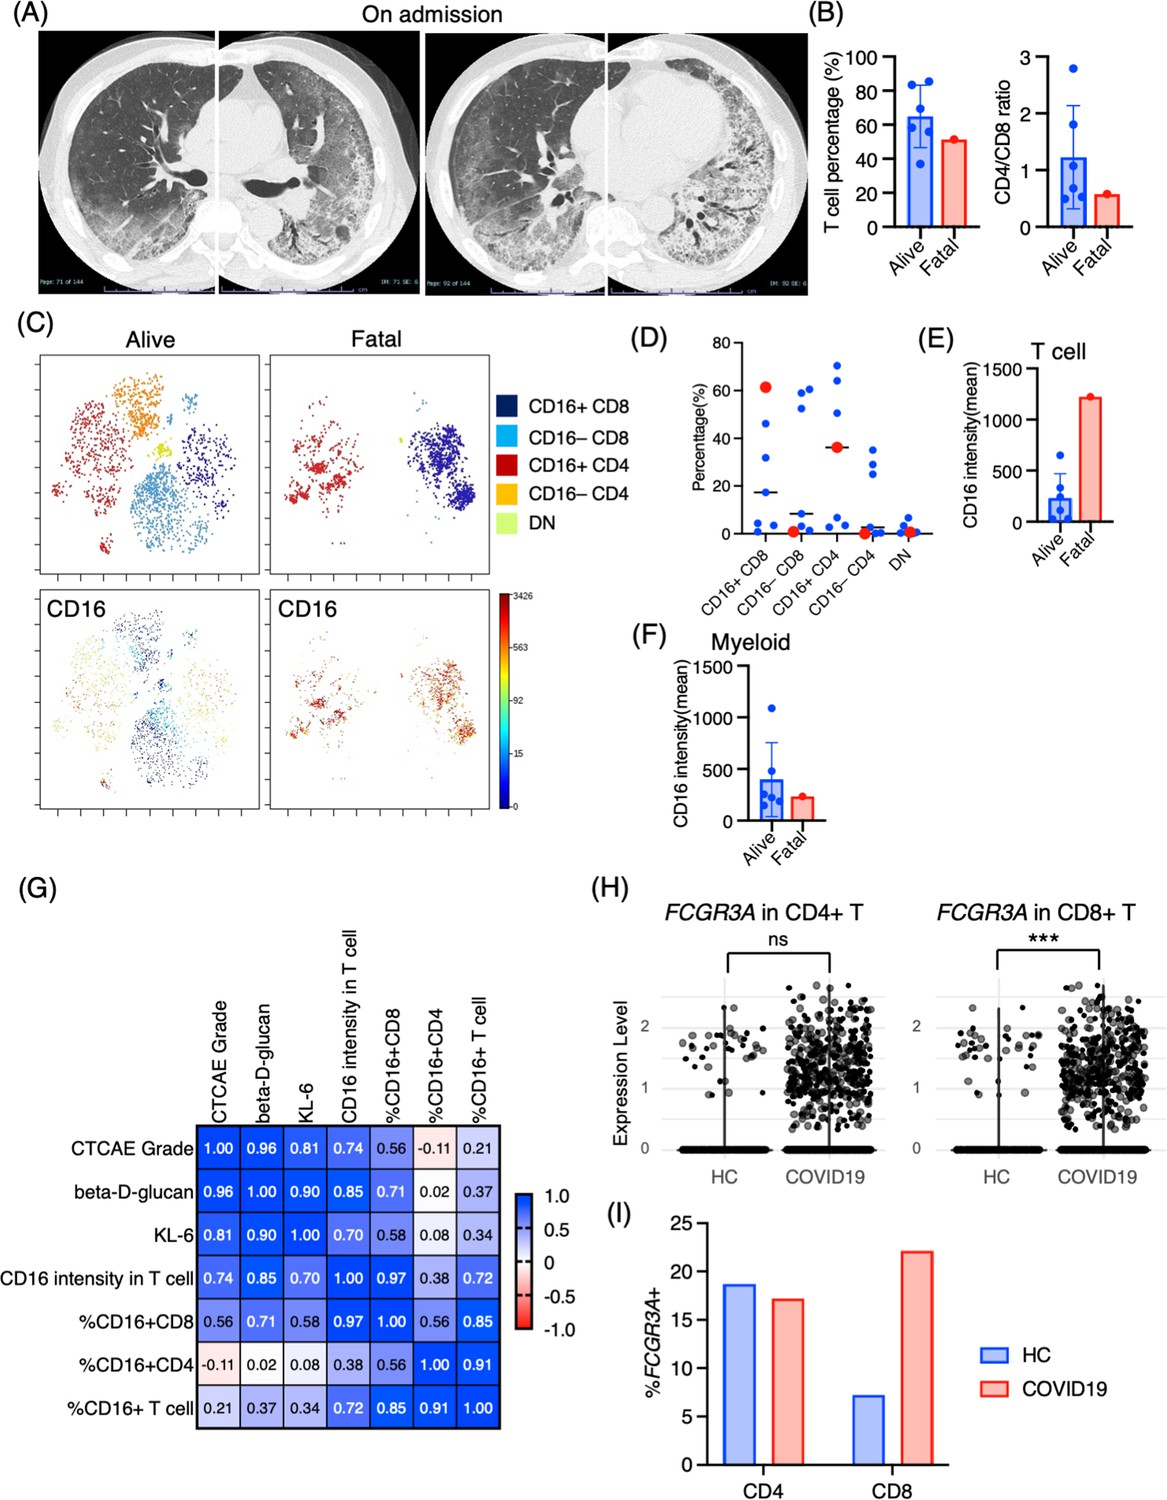
Immunological phenotypes in a fatal case of Pneumocystis jirovecii pneumonia (PCP).
(A) Chest computed tomography images of the patient upon admission reveal the emergence of bilateral diffuse ground glass opacities and infiltration in both lungs. (B) Comparison of T cell percentage and CD4/CD8 ratio between a fatal case and surviving cases of PCP. (C) t-stochastic neighborhood embedding (t-SNE) plots illustrating the distribution of T cell subpopulations in bronchoalveolar lavage fluid (BALF) T cells (gated as CD45+CD2+CD3+) from a fatal case and surviving cases of PCP. Double-negative (DN) T cells were defined as CD4–CD8– T cells. (D) Percentages of each T cell subpopulation. Red dots represent the value of the fatal case. (E) Mean CD16 intensity in the T cell population. (F) Mean CD16 intensity in the myeloid cell population. (G) The correlation matrix in PCP cases. Pearson r values are shown in each square. (H) Violin plots illustrate FCGR3A (CD16) expression intensity on CD4+ and CD8+ T cells, with each dot representing an individual cell in BALF from healthy controls (HCs) and COVID-19 patients, derived from single-cell RNA-seq dataset GSE145926. The significance of differences was assessed using the Wilcoxon test. ns: not significant, ***p<0.001. (I) The proportion of FCGR3A (CD16)-positive cells within the CD4+ and CD8+ T cell populations in BALF from HC and COVID-19 patients, with the FCGR3A expression threshold set at 0.5.
Figure 5—figure supplement 1
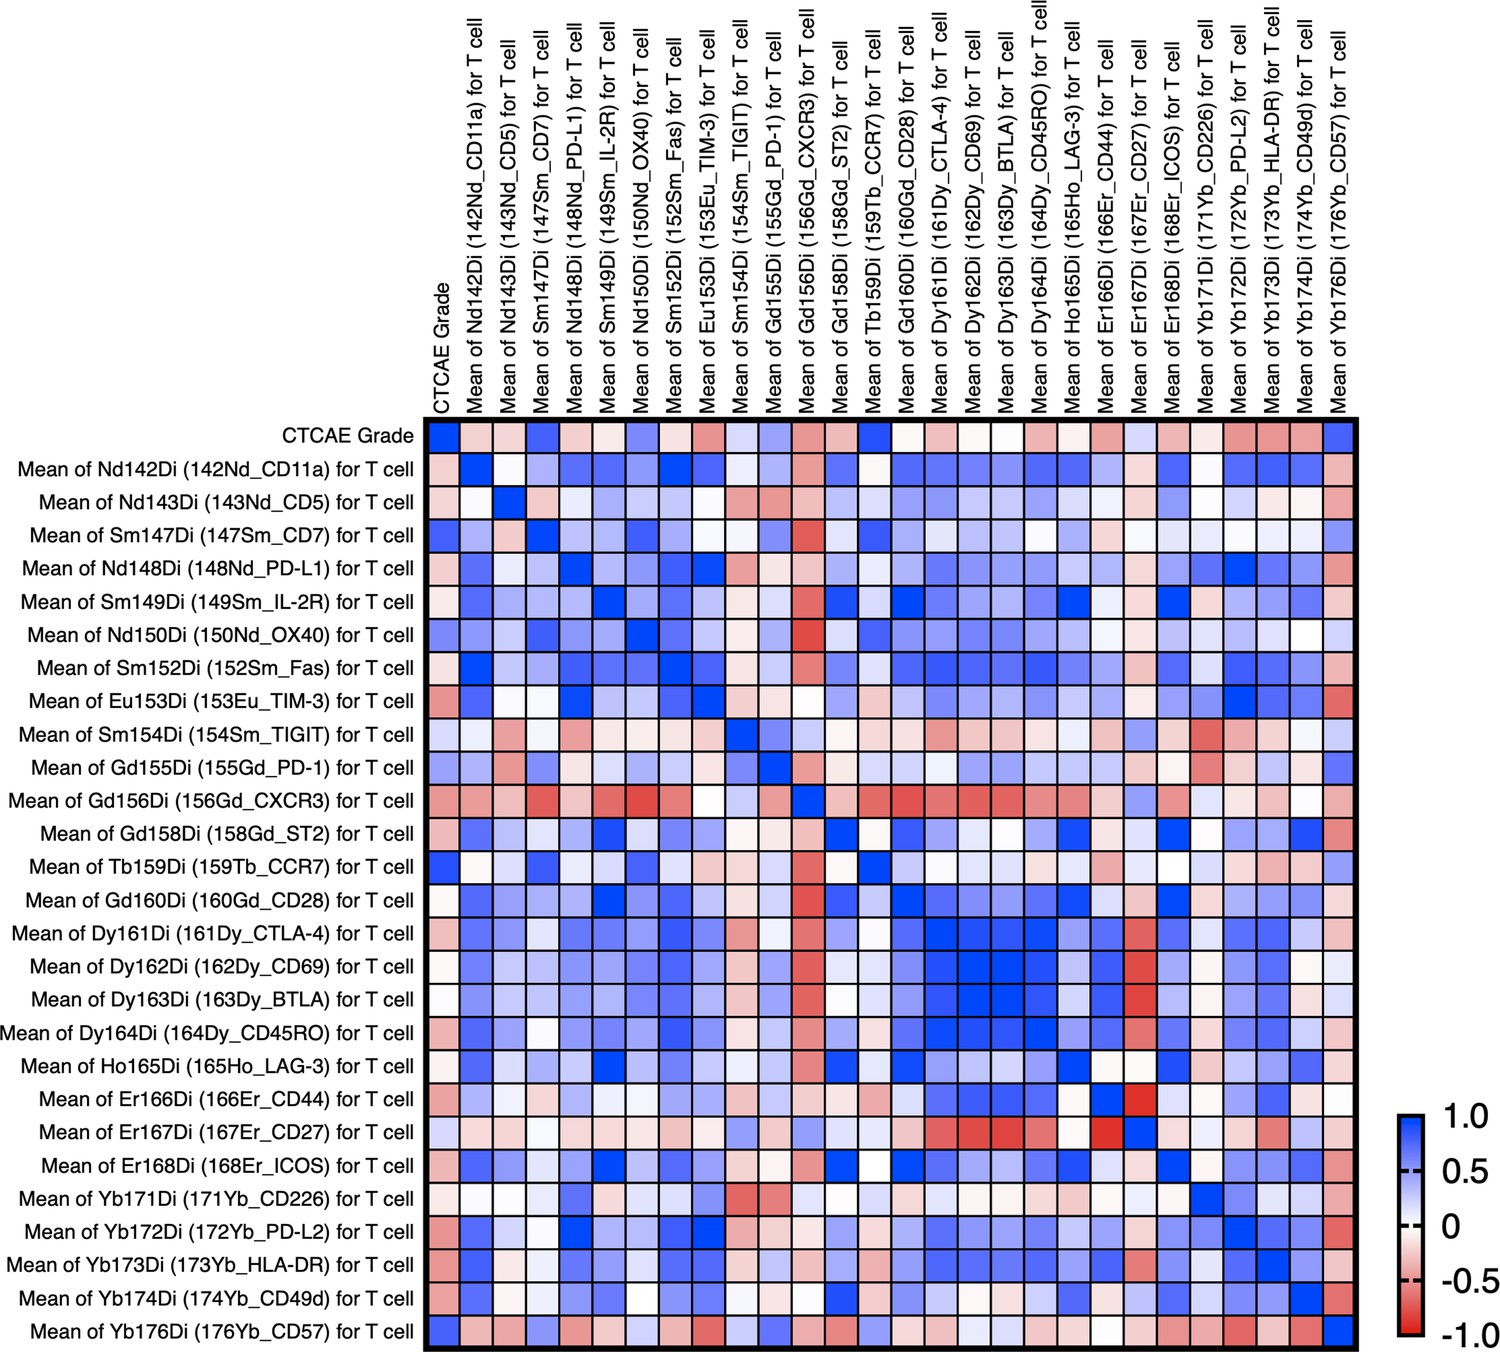
The correlation matrix with the CTCAE and intensity of each T cell markers in Pneumocystis jirovecii pneumonia (PCP) cases.
The correlation was calculated using the Pearson correlation coefficient. This involved correlating the CTCAE grade directly with the mean expression levels of each marker. The computations were conducted using GraphPad Prism version 9. CCR7, CD7, and CD57 are correlated with the severity (CTCAE) of PCP (p-values: 0.009, 0.035, and 0.039, respectively).
Figure 6
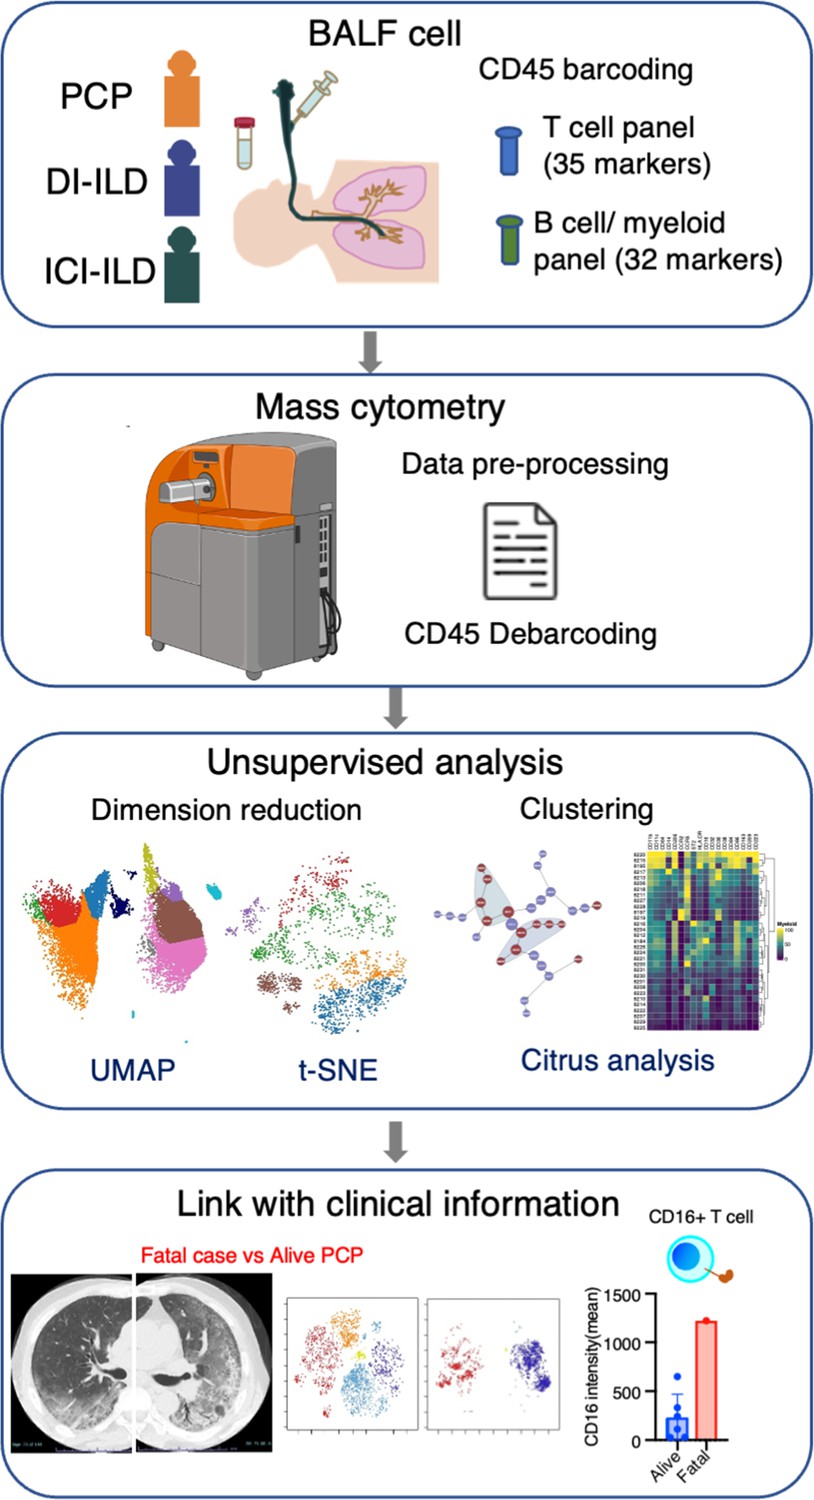
Graphical abstract of the study.
Bronchoalveolar lavage fluid (BALF) samples were collected from patients with Pneumocystis jirovecii pneumonia (PCP), cytotoxic drug-induced interstitial lung disease (DI-ILD), and immune-checkpoint inhibitor-related ILD (ICI-ILD). Subsequently, BALF cells were analyzed using mass cytometry with a T cell panel (35 markers) and B cell/myeloid cell panel (32 markers) following CD45 barcoding for sample identification. The study found that there was a significant increase in the expansion of CD16+ T cells in patients with PCP, with the highest CD16 expression observed in a fatal case of PCP.
Tables
Table 1
Characteristics of the study population.
| PCP | DI-ILD | ICI-ILD | |
|---|---|---|---|
| Number | 7 | 9 | 9 |
| Age | 66.9 ± 4.6 | 58.8 ± 19.3 | 71.9 ± 4.5 |
| Male % (n) | 42.8 (3) | 77.8 (7) | 100 (9) |
| Suspected drug/regimen | VAC (2), FOLFIRI (2), DTX (1), AC (1), GEM (1), TS-1 (1), BEP (1) | Nivolumab (3), pembrolizumab (3), durvalmab (2), atezolizumab (1) | |
| CTCAE grade | G2 (5), G3 (1), G5 (1) | G1 (2), G2 (7) | G2 (7), G3 (2) |
| BALF cell differentiation (%) | |||
| Macrophage | 25 ± 8.9 | 40.2 ± 23.5 | 44.4 ± 26.6 |
| Neutrophil | 13.6 ± 29.7 | 1.9 ± 1.3 | 14.4 ± 26.7 |
| Lymphocyte | 58.8 ± 30.5 | 56.2 ± 24.8 | 35.6 ± 23.7 |
| Eosinophil | 0.9 ± 1.1 | 1.7 ± 1.9 | 5.6 ± 8.5 |
-
Data for age and BALF analysis are presented as means ± SD.
-
PCP = Pneumocystis jirovecii pneumonia; DI-ILD = cytotoxic drug-related interstitial lung disease; ICI-ILD = immune-checkpoint inhibitor-related ILD; BALF = bronchoalveolar lavage fluid; VAC = vincristine, actinomycin D, and cyclophosphamide; FOLFIRI = folinic acid, fluorouracil, and irinotecan hydrochloride; DTX = docetaxel; AC = adriamycin and cyclophosphamide; GEM = gemcitabine; TS-1 = tegafur gimeracil oteracil potassium; BEP = bleomycin, etoposide, and platinum; CTCAE = Common Terminology Criteria evaluated the severity of the disease for Adverse Events grading; grade 1 = asymptomatic; grade 2 = symptomatic; grade 3 = severe symptoms, requiring oxygen therapy; grade 4 = life-threatening respiratory failure; grade 5 = death.
Additional files
-
MDAR checklist
- https://cdn.elifesciences.org/articles/87288/elife-87288-mdarchecklist1-v1.pdf
-
Supplementary file 1
Mass cytometry antibody panels.
- https://cdn.elifesciences.org/articles/87288/elife-87288-supp1-v1.zip
Download links
A two-part list of links to download the article, or parts of the article, in various formats.
Downloads (link to download the article as PDF)
Open citations (links to open the citations from this article in various online reference manager services)
Cite this article (links to download the citations from this article in formats compatible with various reference manager tools)
Exploratory mass cytometry analysis reveals immunophenotypes of cancer treatment-related pneumonitis
eLife 12:RP87288.
https://doi.org/10.7554/eLife.87288.4


