A versatile high-throughput assay based on 3D ring-shaped cardiac tissues generated from human induced pluripotent stem cell-derived cardiomyocytes
- Université de Paris Cité, PARCC, INSERM, France
- 4Dcell, France
Figures
Figure 1 with 3 supplements
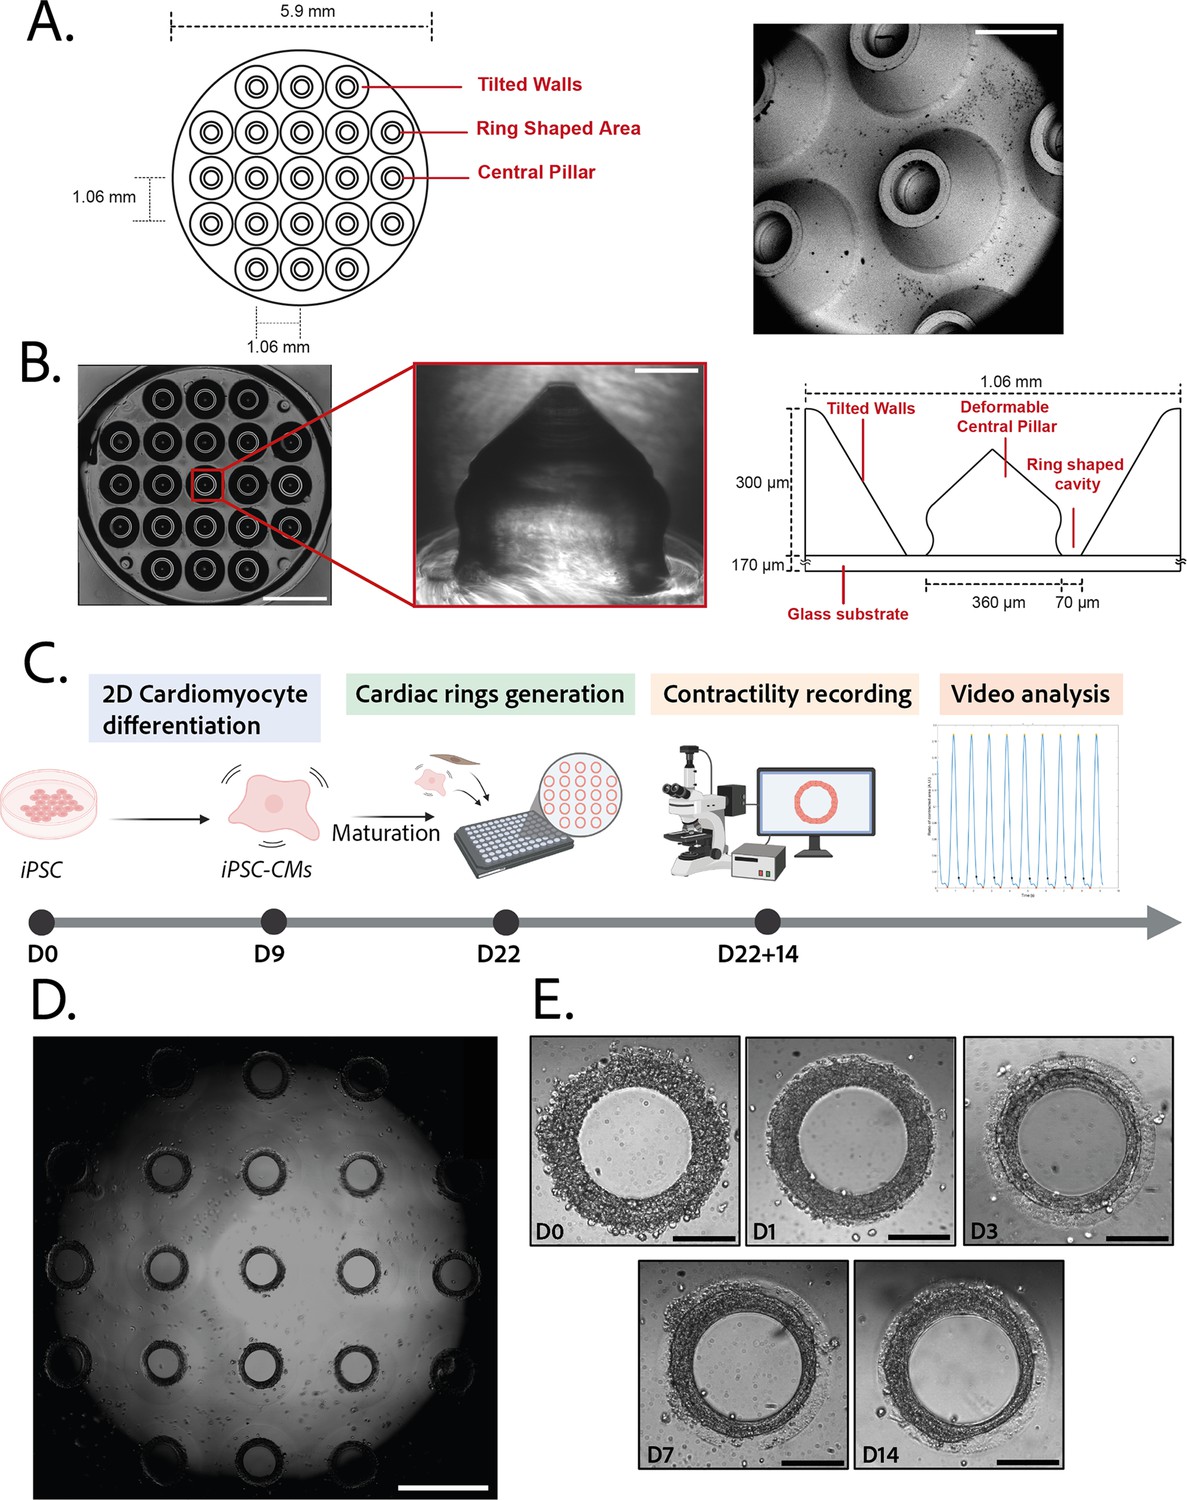
Description of the mold and seeding procedure.
(A) Micromachined stainless steel mold used to shape the gel. Design (left) and scanning electron microscopy image (right) of the mold. Scale bar: 500 µm. (B) Molded polyethylene glycol (PEG) gel (left – scale bar: 2 mm) and zoomed view of a pillar from its polydimethylsiloxane (PDMS) replica (middle – scale bar: 100 µm). Design and size of the pillar (right). (C) Timeline of the seeding procedure. (D) Cardiac rings in a well 1 day after seeding. Images stitched with ImageJ plugin. Scale bar: 1 mm. (E) Representative compaction of a ring with time after seeding (from day 0 to day 14), in brightfield. Scale bars: 200 µm.
© 2024, BioRender Inc. Figure 1C was created using BioRender, and is published under a CC BY-NC-ND 4.0. Further reproductions must adhere to the terms of this license.
Figure 1—figure supplement 1
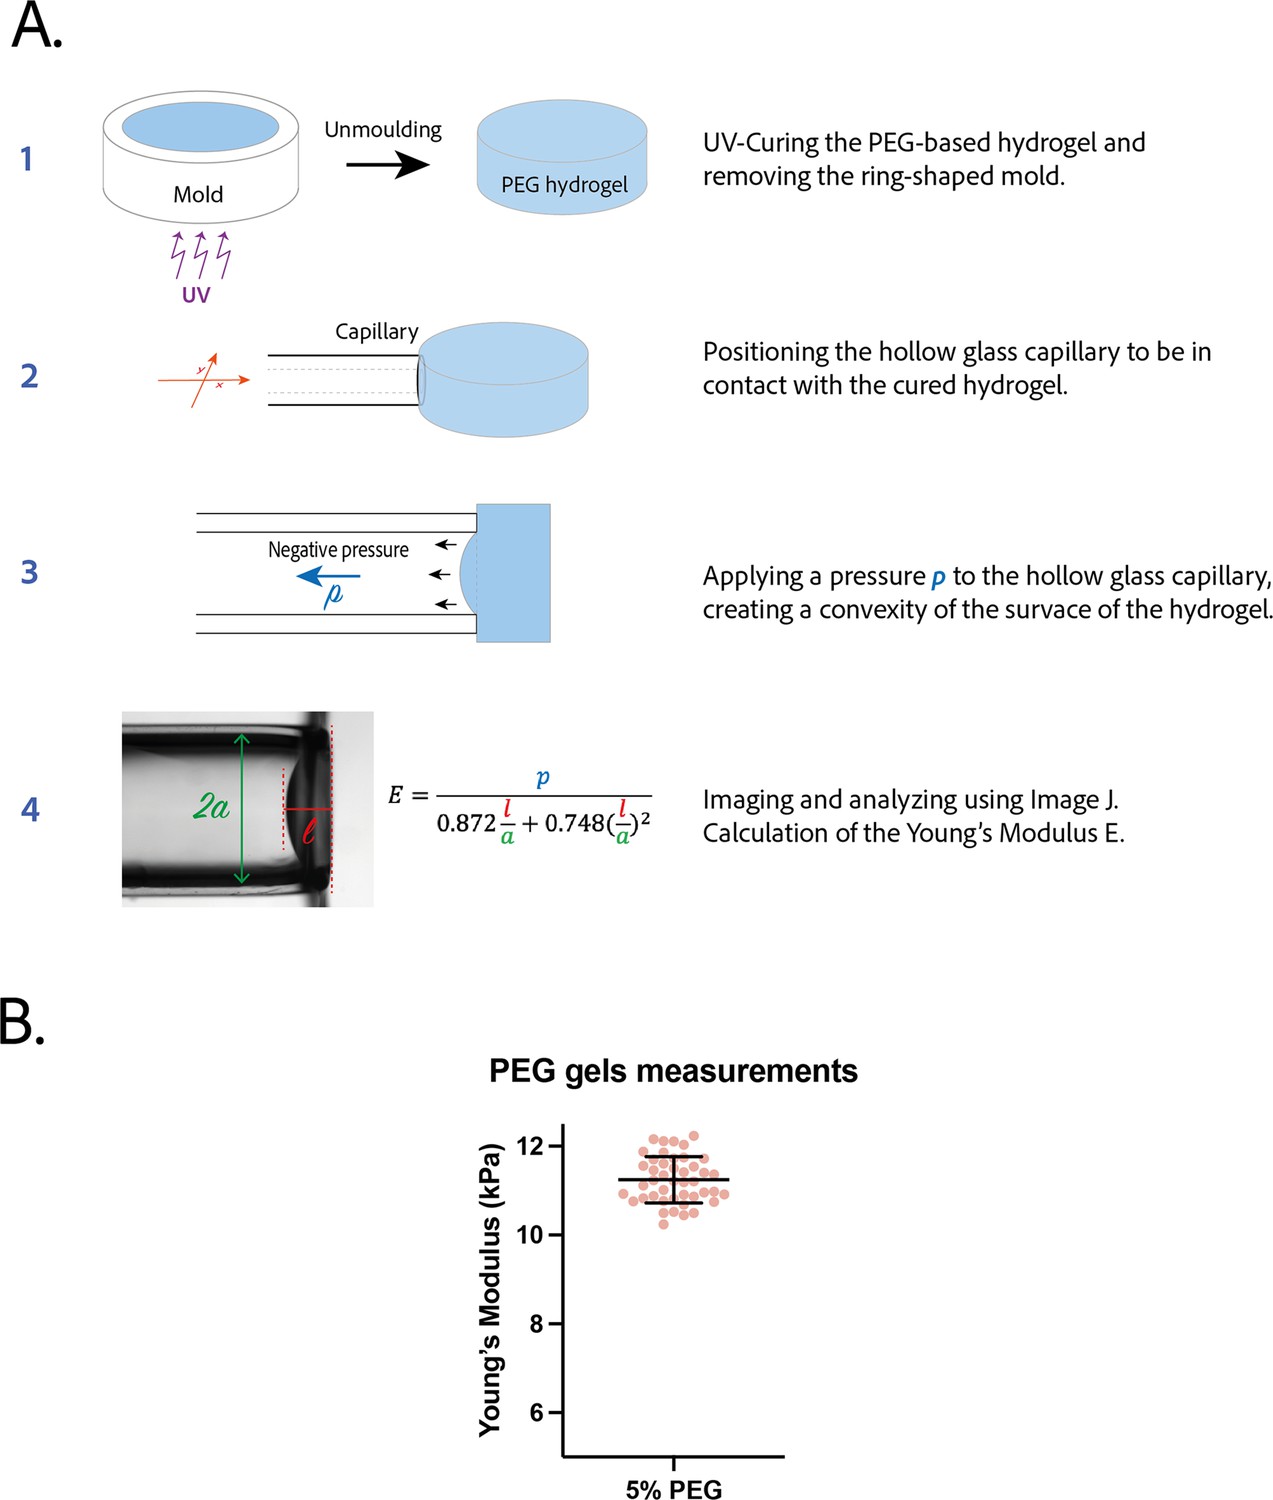
Measurement of the Young’s modulus of polyethylene glycol (PEG) gel.
(A) Procedure to measure the Young’s modulus of a PEG gel disk by pipette aspiration. (B) Young’s modulus of 5% PEG gels (n=44). Mean ± SD.
Figure 1—figure supplement 2
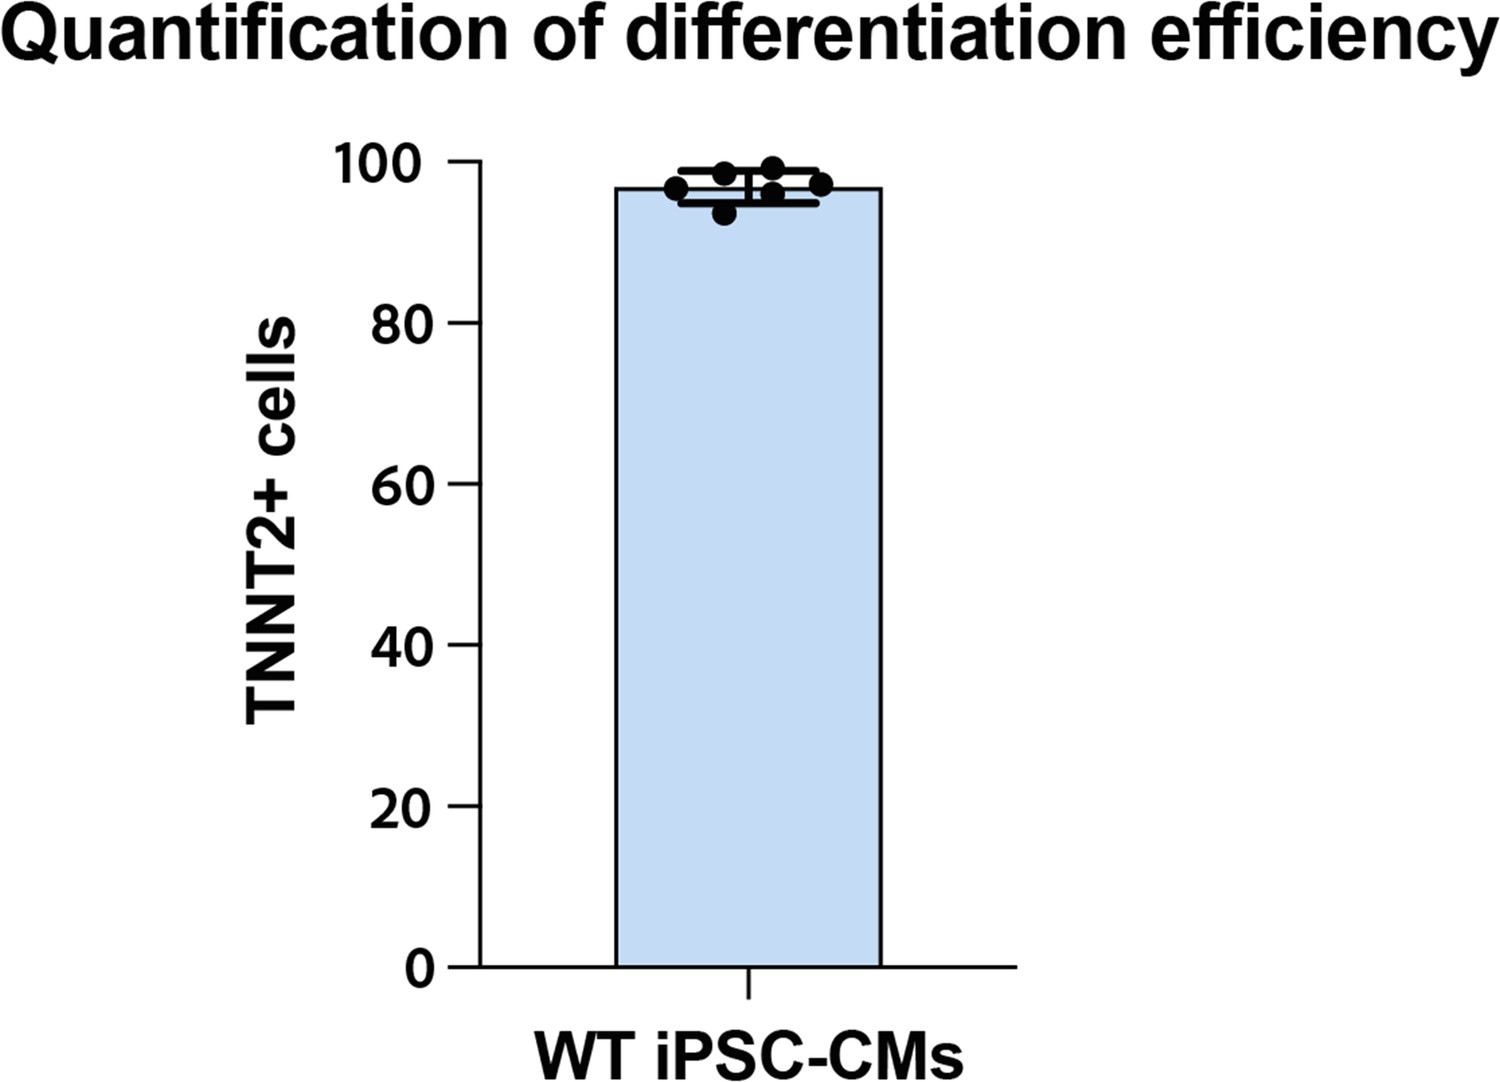
Measurement of the efficiency of differentiation the induced pluripotent stem cells (iPSCs) into cardiomyocytes.
Percentage of positive cells for troponin T2 (TNNT2) determined by flow cytometry in the six different differentiations of wild-type (WT) iPSCs, used for these experiments. Mean ± SD.
Figure 1—video 1
Multiple rings beating at D14 – brightfield imaging ×4 magnification.
Figure 2 with 4 supplements
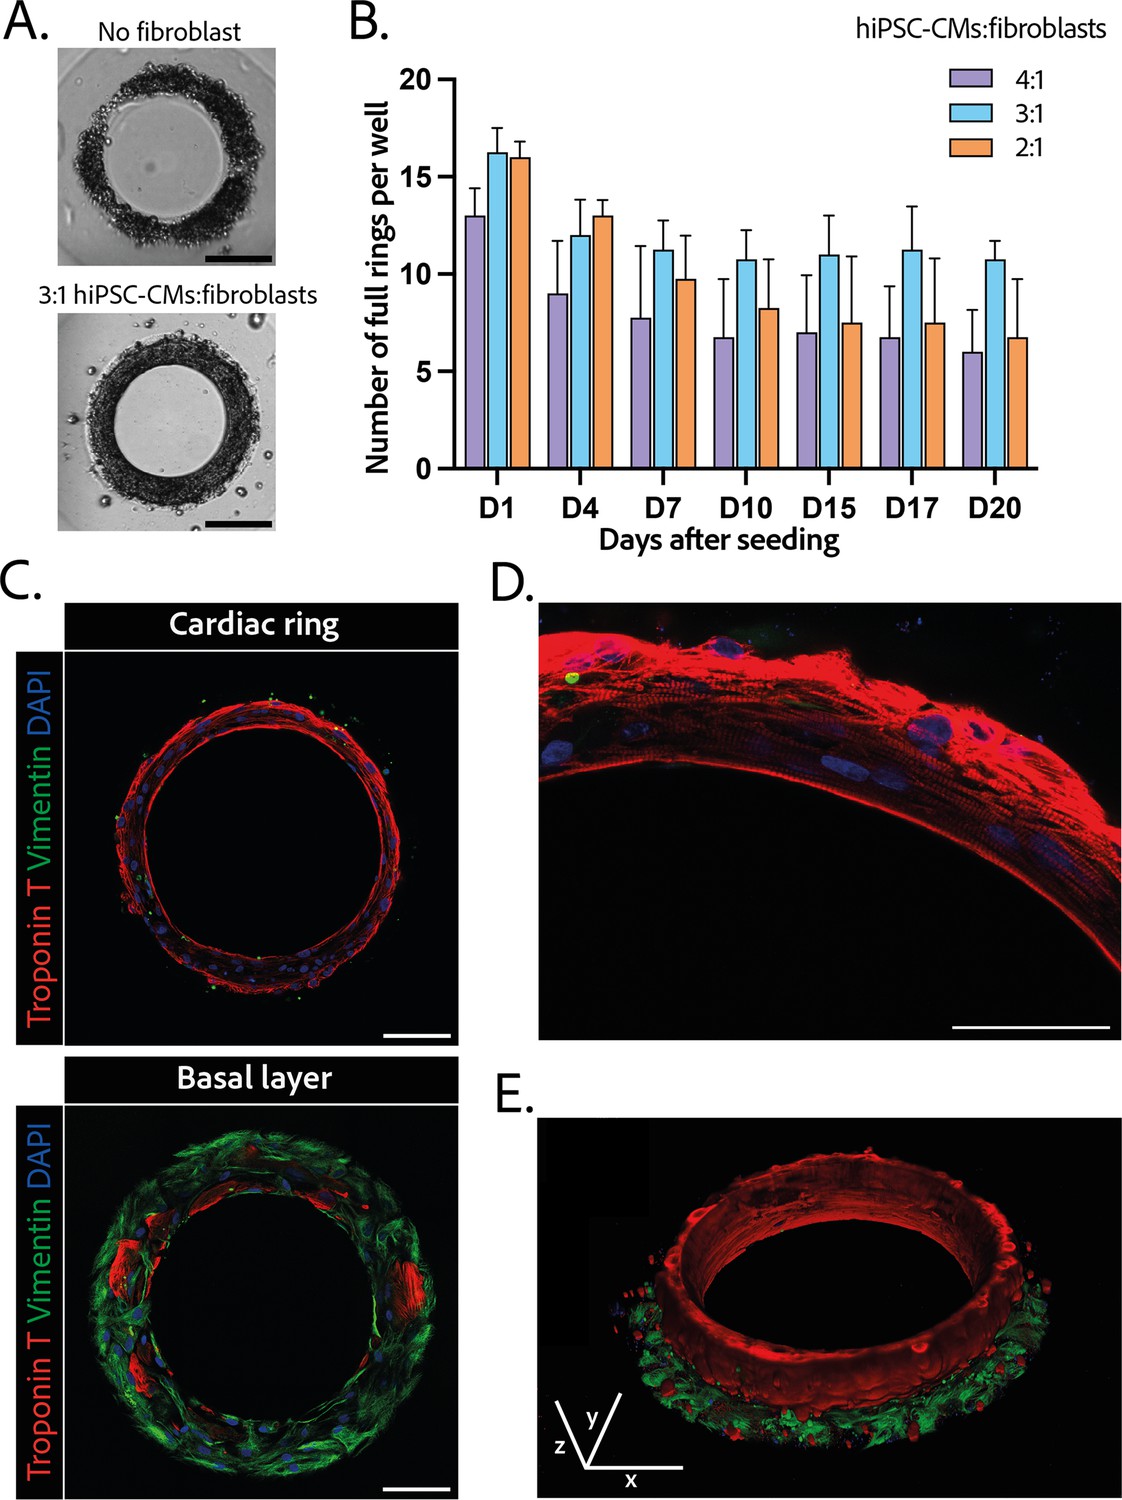
Composition and structure of the cardiac rings.
(A) Example brightfield images of cardiomyocytes seeded with or without fibroblasts 1 day after seeding. Scale bar: 200 µm. (B) Number of full cardiac rings per well in time according to the cardiomyocytes derived from human induced pluripotent stem cell (hiPSC-CMs):fibroblasts ratio they contain (4:1, 3:1, or 2:1). Mean ± SD, for n=4 differentiations. (C) Confocal imaging of immunostained tissues at different heights: cardiac ring (top panel), and basal layer (bottom panel) of a tissue at ×40 magnification. Vimentin, stained in green, corresponds to fibroblasts, troponin T, in red, is specific to cardiomyocytes, and DAPI is in blue. Scale bars: 100 µm. (D) Picture of the immunostained contractile fibers at ×63 magnification. Vimentin (green), troponin T (red), and DAPI (blue). Scale bar: 50 µm. (E) 3D reconstruction of a ring. x, y, and z scale bars: 100 µm.
Figure 2—figure supplement 1

Contractile parameters at D14 for the different fibroblasts ratios.
(A) Contraction frequency. (B) Contraction stress. (C) Maximum contraction speed. (D) Maximum relaxation speed. Mean ± SD, for n=23, 52 and 16 tissues respectively for the ratios 4:1, 3:1 and 2:1.
Figure 2—figure supplement 2
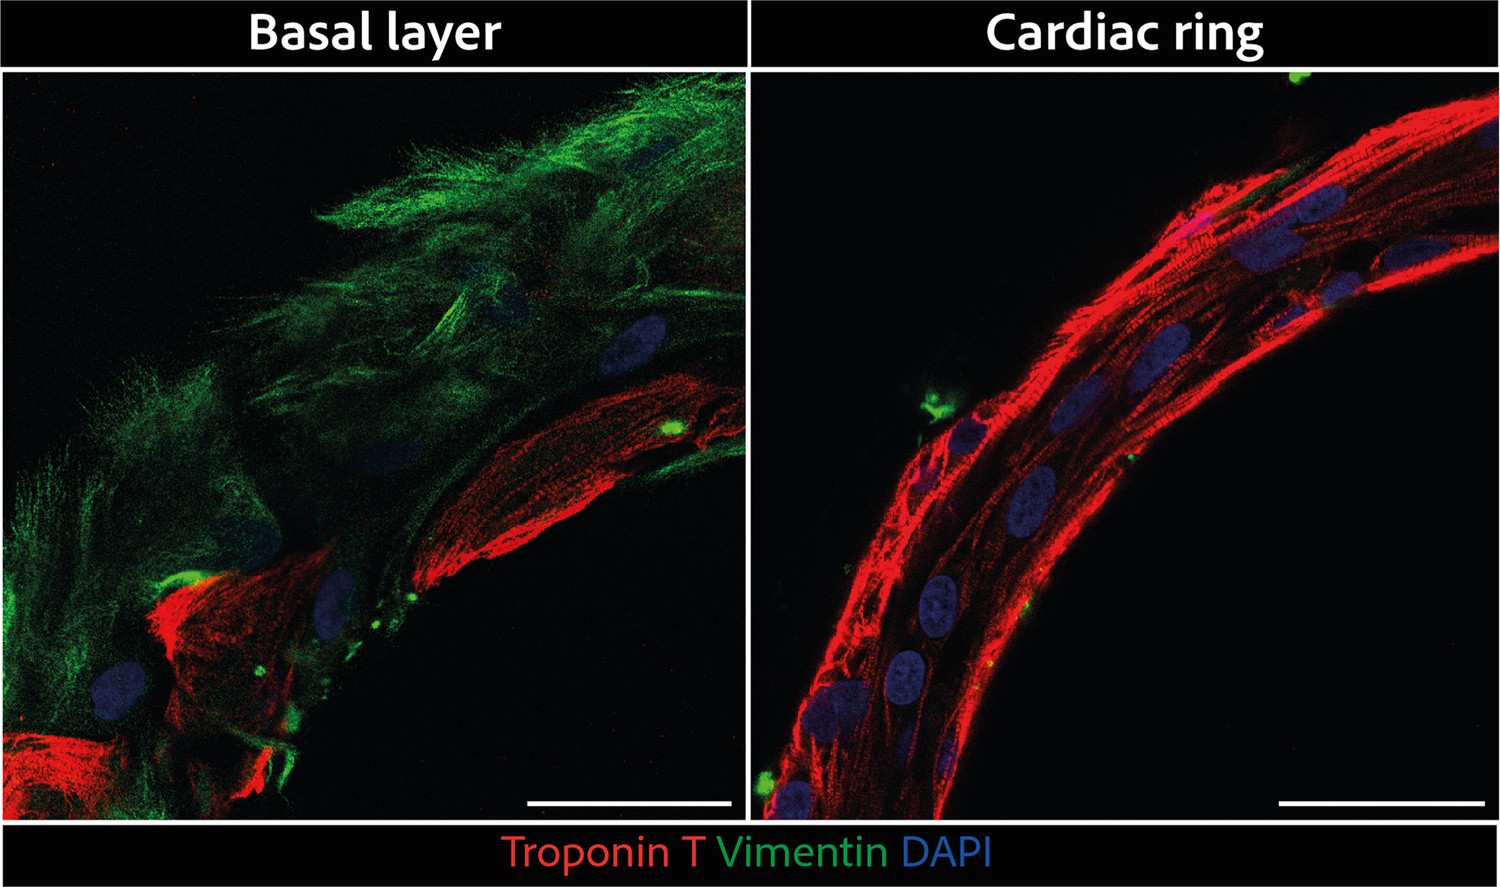
Magnified regions of rings displayed in Figure 2C.
Larger scale confocal pictures of immunostained tissues at different heights basal layer (left) and cardiac ring (right) at ×40 magnification: vimentin is stained in green, troponin in red, and DAPI in blue. Scale bars: 50 µm.
Figure 2—figure supplement 3
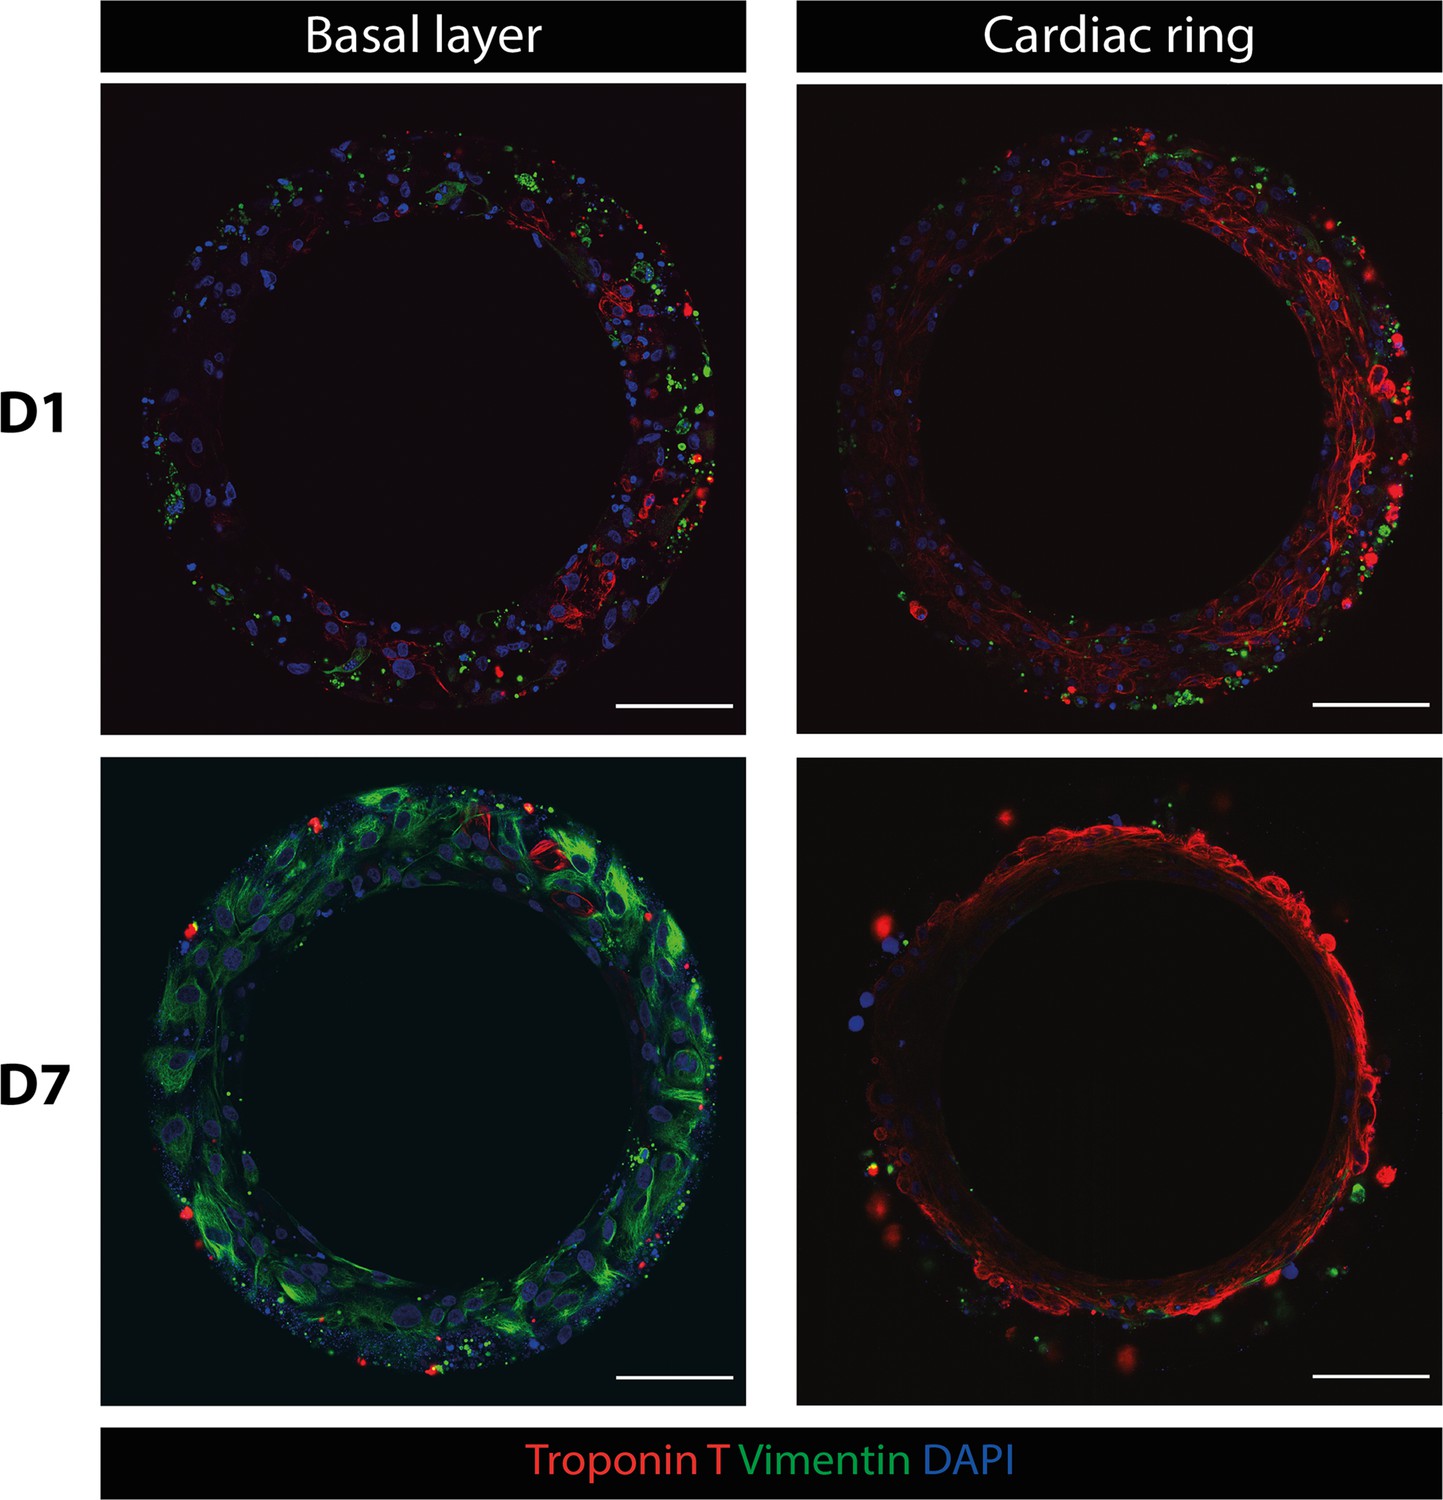
Immunostaining of rings at D1 and D7.
Top panels: troponin T (red), vimentin (green), and DAPI (blue) staining of a ring at D1, basal layer (left) and cardiac ring (right). Bottom panels: troponin T (red), vimentin (green), and DAPI (blue) staining of a ring at D7, basal layer (left), and cardiac ring (right). Scale bars: 100 µm.
Figure 2—video 1
3D reconstruction of a ring.
Figure 3 with 3 supplements
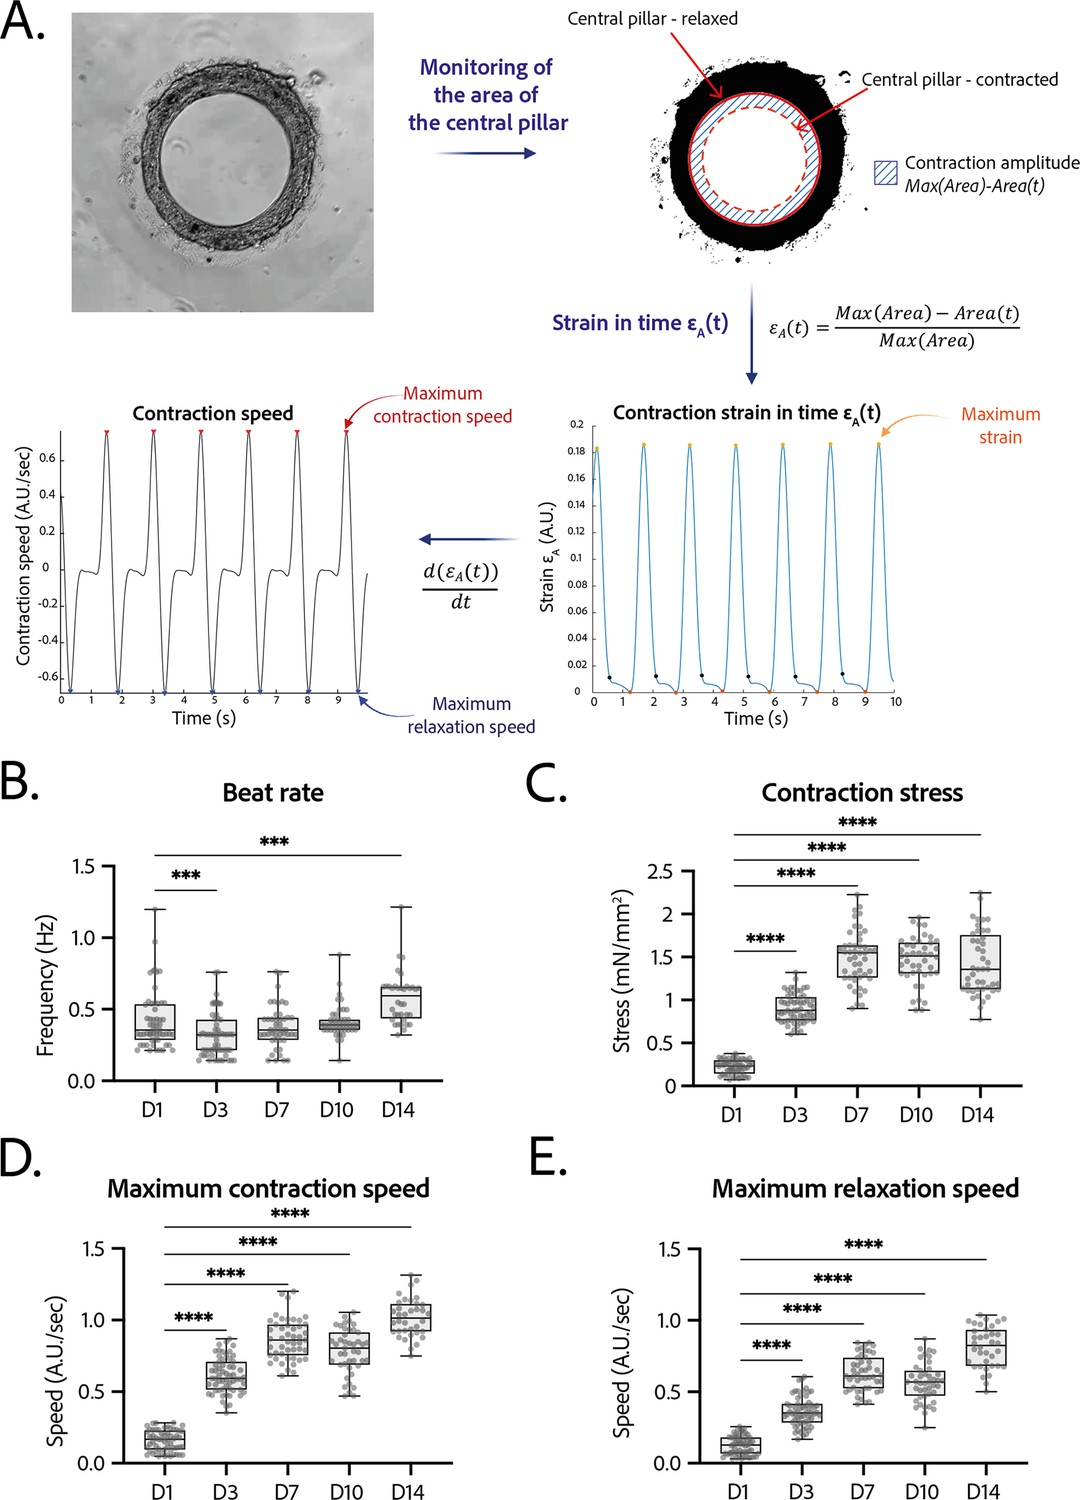
Contractility analysis of the tissues.
(A) Principle of the in-house Matlab code used for contractility analysis: detection of the central pillar and monitoring of the evolution of its area in time, calculation and plot of the strain in time (ratio between the contraction amplitude in time and the maximum area of the central pillar). Representative plots of the strain in time and its derivative in time, for a tissue at day 14. (B–E) Evolution of beating parameters through time after seeding at days 1, 3, 7, 10, and 14. The changes of all the parameters through time are significant (p<0.0001 – ANOVA for repeated measures – D1: n=57, D3: n=59 D7: n=47, D10: n=43, D14: n=36 tissues, from three differentiations). Beating parameters at each time point are compared to their value at day 1. (B) Evolution of beat rate through time after seeding (***: p<0.002). (C) Evolution of contraction stress through time after seeding (****: p<0.0001). (D) Evolution of maximum contraction speed through time after seeding (****: p<0.0001). (E) Evolution of maximum relaxation speed through time after seeding (****: p<0.0001).
Figure 3—figure supplement 1
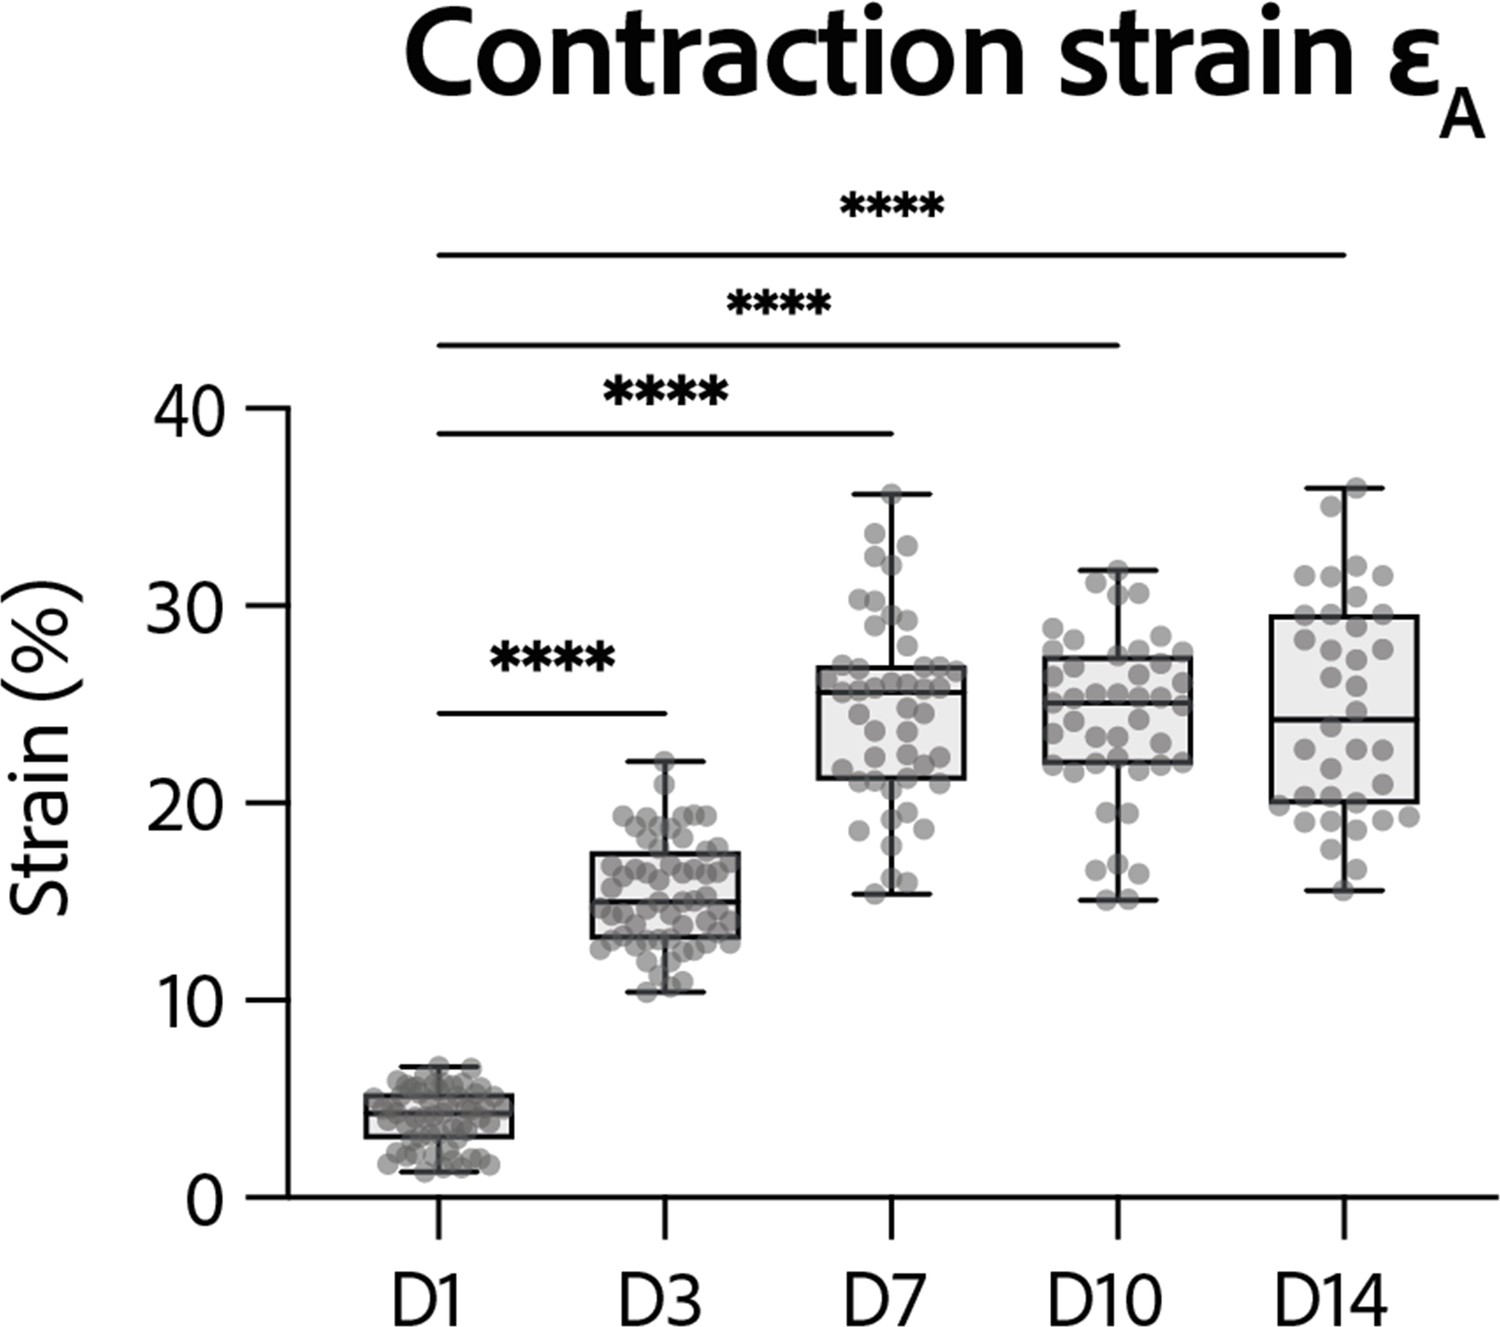
Strain developed by the rings at D14.
Evolution of contraction strain through time after seeding at days 1, 3, 7, 10, and 14. Contraction strain changes through time are significant (p<0.0001 – ANOVA for repeated measures – D1: n=57, D3: n=59 D7: n=47, D10: n=43, D14: n=36 tissues, from three differentiations). Contraction strain for each concentration is compared to contraction strain at day 1 (****: p<0.0001).
Figure 3—figure supplement 2
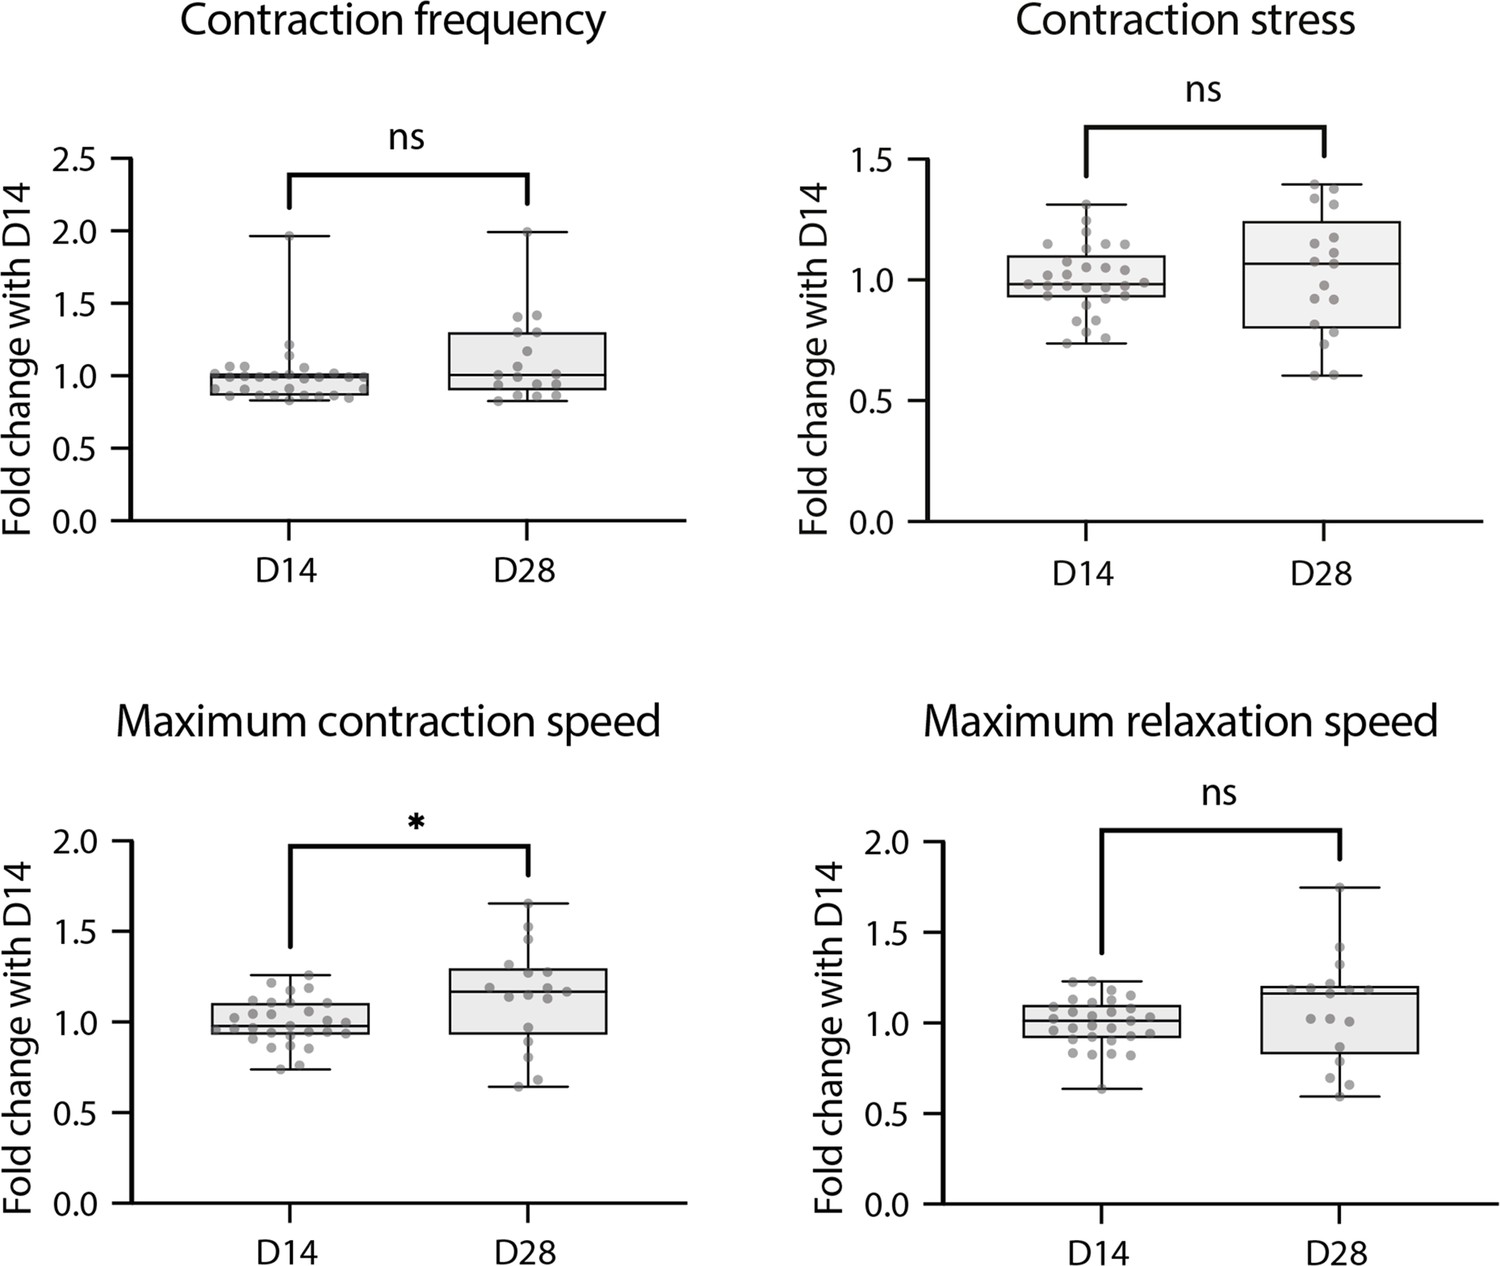
Contractile parameters of rings at D28.
Contractile parameters of rings at D28 expressed as a fold change to D14. Mann-Whitney test – D14: n=29 and D28: n=17, from two differentiations.
Figure 3—video 1
Contractility of a ring at day 14.
Figure 4 with 1 supplement
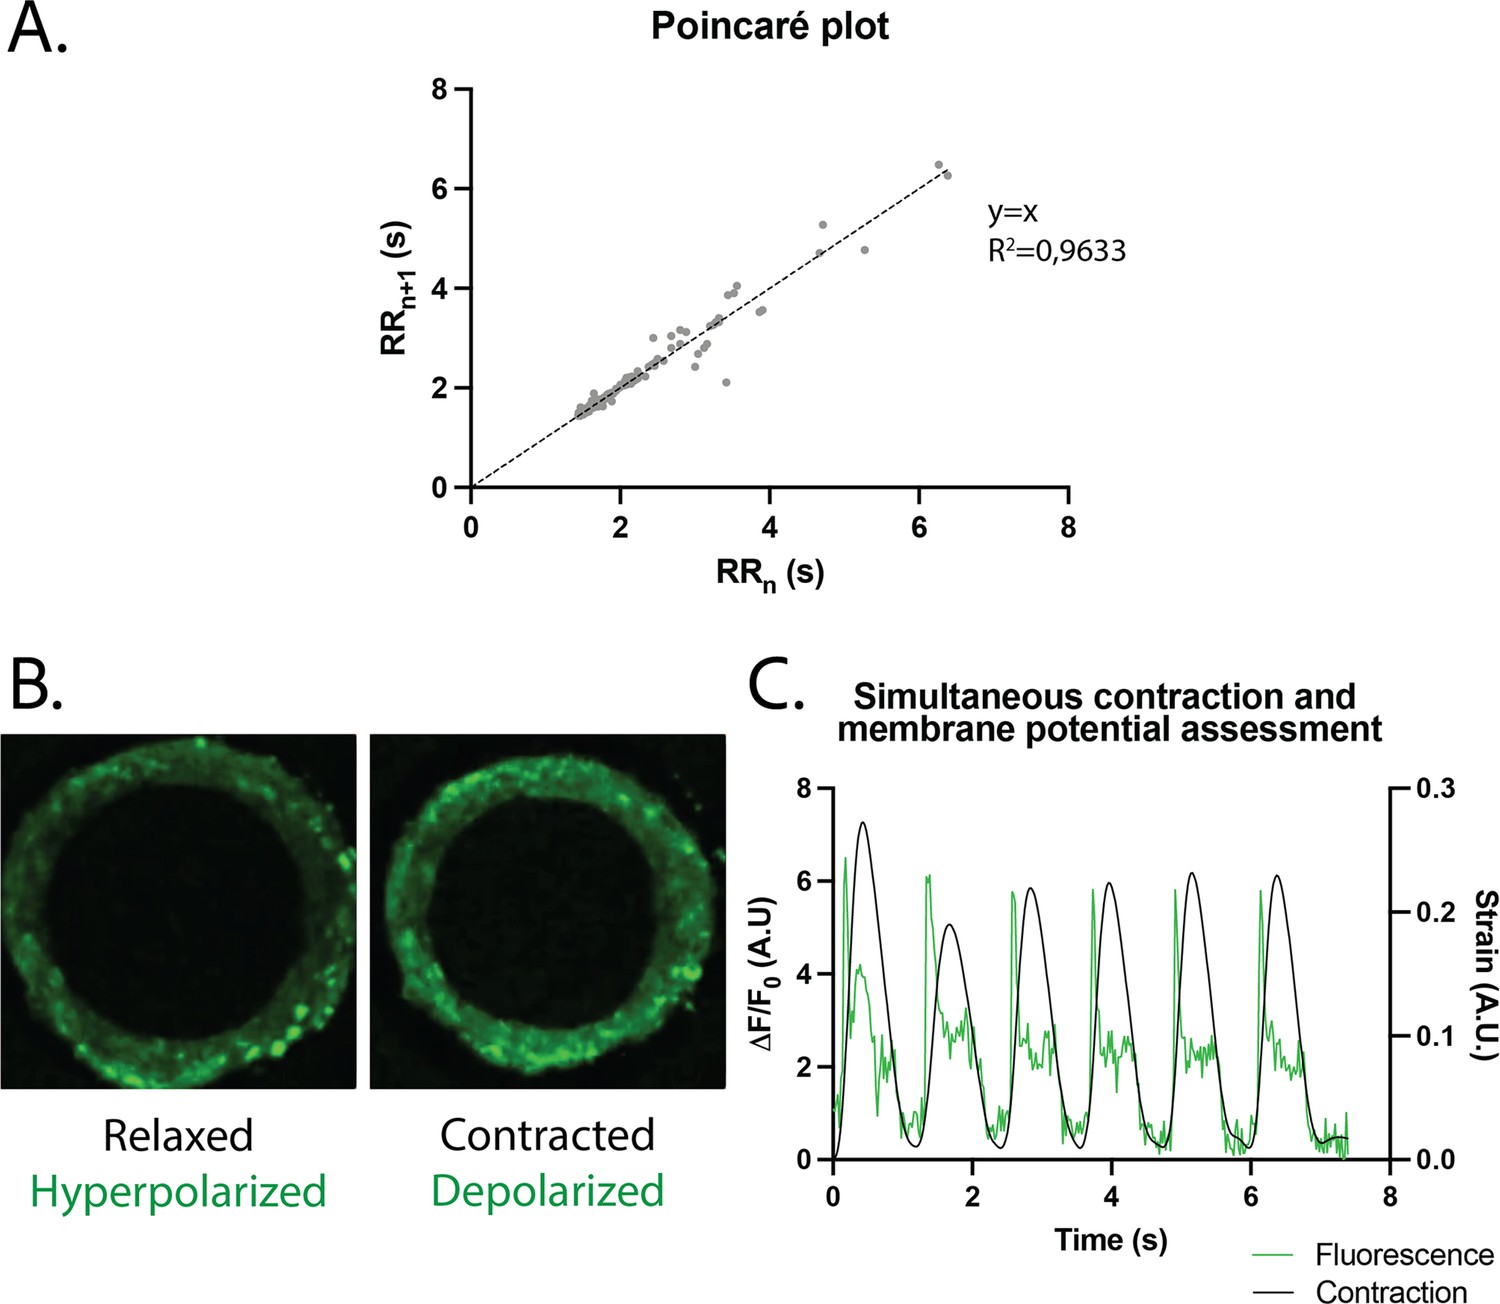
Study of arrhythmia in ring-shaped cardiac tissues.
(A) Poincaré plot for tissues at D14. n=24 tissues from three differentiations. (B) Tissue with FluoVolt dye in its relaxed/hyperpolarized state and contracted/depolarized state. (C) Representative plot of contraction strain (black) and fluorescence signal (green) of a tissue derived from video analysis of the FluoVolt dye.
Figure 4—video 1
FluoVolt live imaging of a ring at D15.
Figure 5
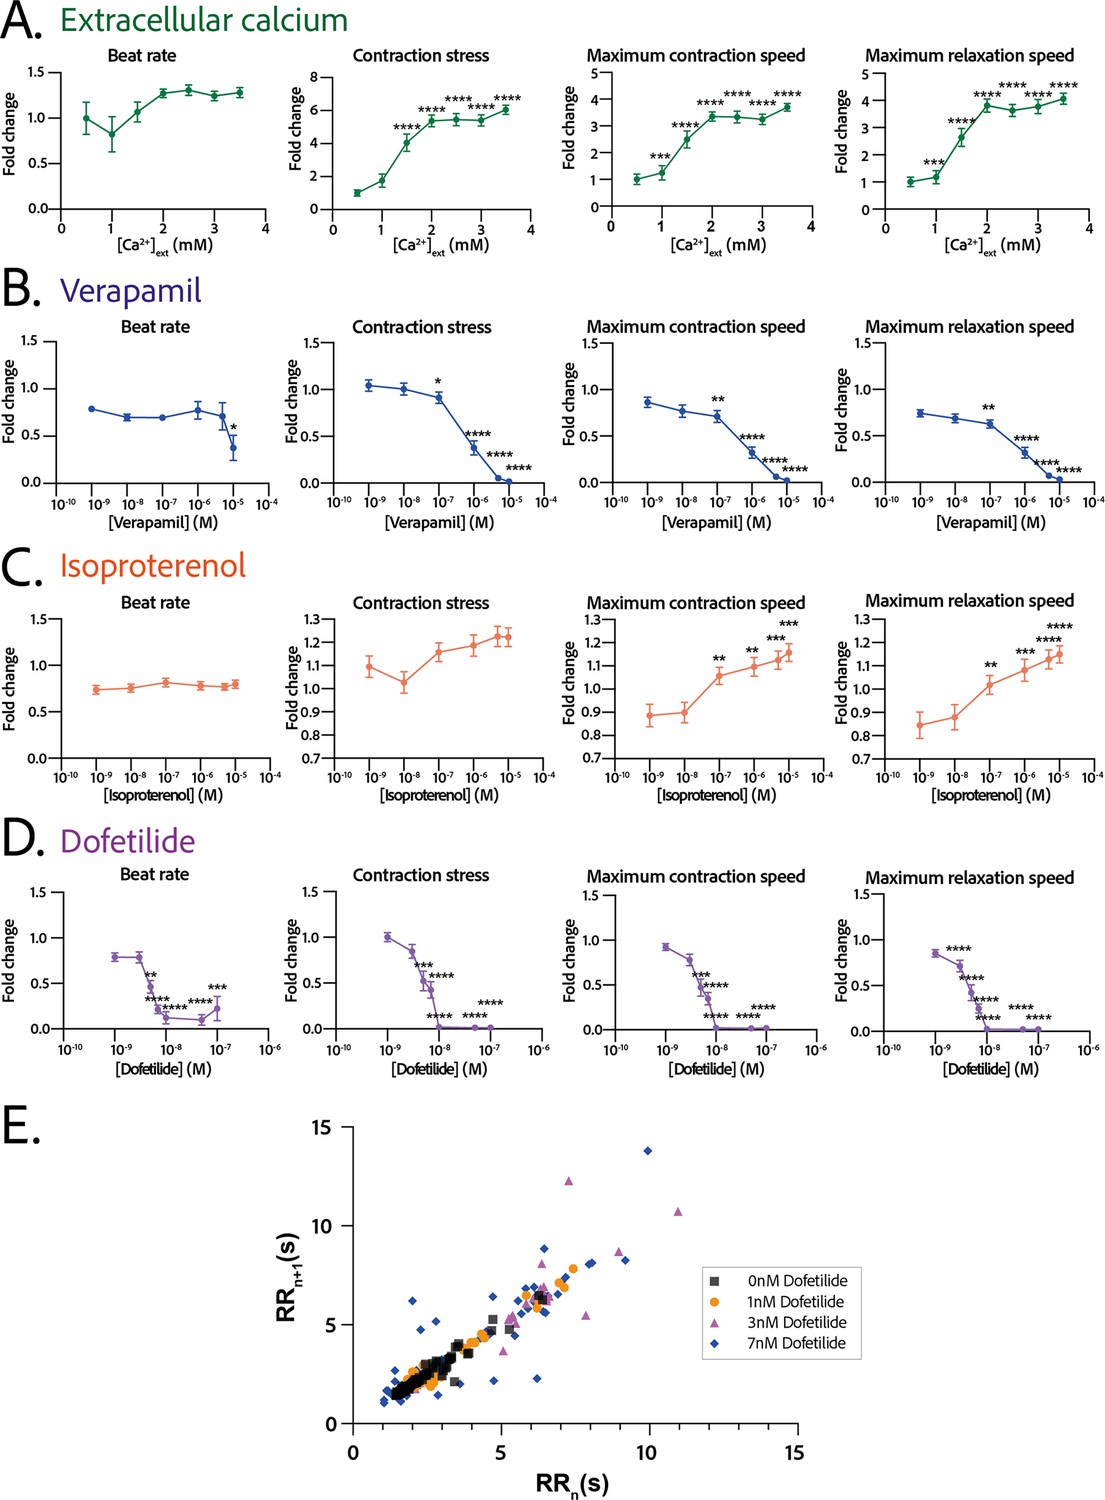
Physiological and drug testing on the cardiac tissues.
Effect of the concentration in extracellular calcium (A), verapamil (B), isoproterenol (C), or dofetilide (D) on tissues contractility: beat rate, contraction stress, and the maximum contraction and relaxation speeds. These parameters are expressed as a ratio between their value for each concentration and the value at basal state ([Ca2+]=0.5 mM for calcium test and [Drug]=0 M for drug testing). An ANOVA for repeated measures was carried out for each parameter. For each test, the value of each parameter at each concentration is compared to its value at the minimal concentration of the drug (respectively [Ca2+]=0.5 mM, [verapamil]=10−9 M, [isoproterenol]=10−9 M, and [dofetilide]=10−9 M). (E) Poincaré plot for 0 nM, 1 nM, 3 nM, and 7 nM of dofetilide. For each concentration of each drug, more than 20 tissues from three different concentrations could be analyzed. Data is presented as mean ± standard error mean (SEM). *: p<0.05; **: p<0.01; ***: p<0.001; ****: p<0.0001.
Additional files
Download links
A two-part list of links to download the article, or parts of the article, in various formats.
Downloads (link to download the article as PDF)
Open citations (links to open the citations from this article in various online reference manager services)
Cite this article (links to download the citations from this article in formats compatible with various reference manager tools)
A versatile high-throughput assay based on 3D ring-shaped cardiac tissues generated from human induced pluripotent stem cell-derived cardiomyocytes
eLife 12:RP87739.
https://doi.org/10.7554/eLife.87739.3


