Octopamine integrates the status of internal energy supply into the formation of food-related memories
- Department of Biology, Institute for Zoology, University Köln, Germany
Figures
Figure 1
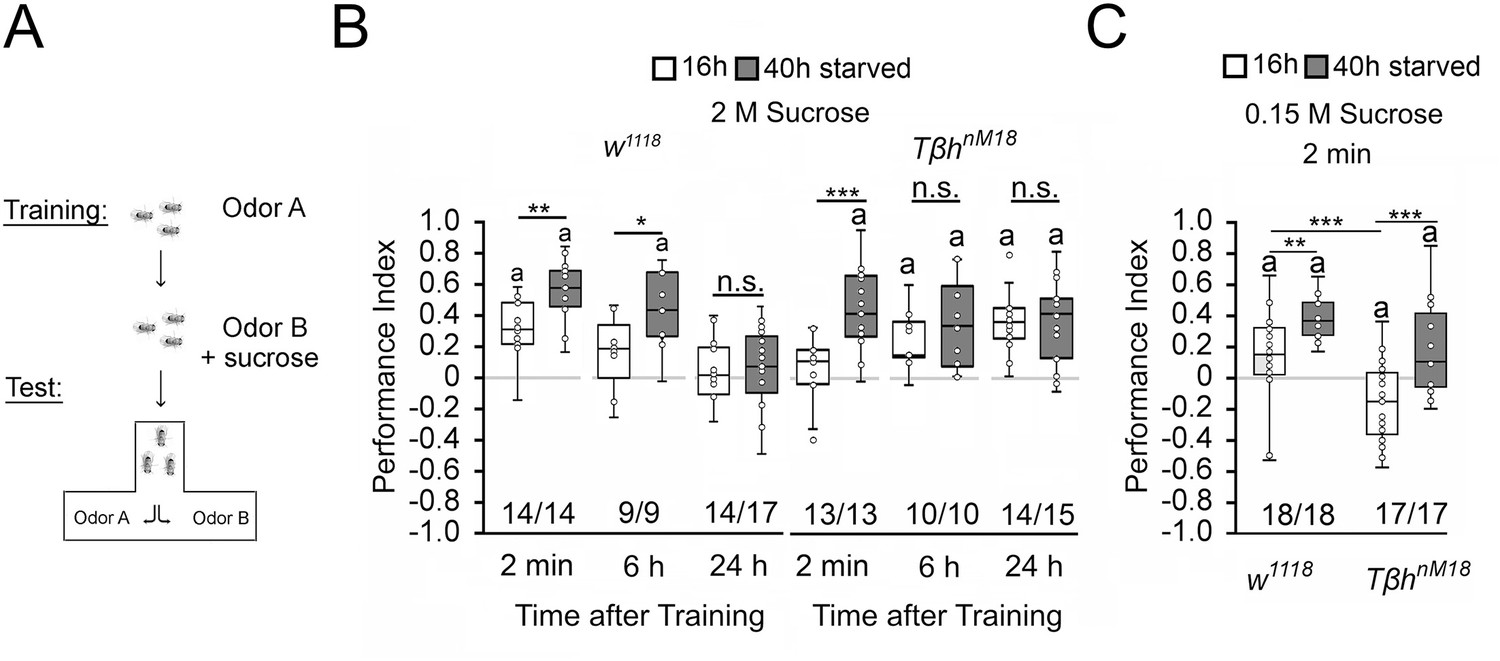
Starvation influences the strength of memory.
(A) Appetitive olfactory learning and memory paradigm. (B) Appetitive 2 min short-term memory (STM), 6 hr and 24 hr memory of w1118 or TβhnM18 that were starved either for 16 hr (white bars) or 40 hr (dark gray bars) before the training. 2 M sucrose was used as reward. (C) 0.15 M sucrose was used as reinforcer. Prolonged starvation increases memory performance. Prolonged starvation from 16 hr to 40 hr leads to the formation of STM in TβhnM18. Independent of the duration of starvation, 6 hr after training, memory appeared in the mutants. (C) TβhnM18 mutants starved for 16 hr developed an aversive STM to 0.15 M sucrose. After 40 hr of starvation, the mutants developed an appetitive STM. Numbers below box plots indicate pairs of reciprocally trained independent groups of male flies. The letter ‘a’ marks a significant difference from random choice as determined by a one-sample sign test (p<0.05). Student’s t-tests were used to determine differences between two groups. For differences between more than two groups, one-way ANOVA with Tukey’s post hoc Honest Significant Difference (HSD) test was used. (*p<0.05; **p<0.01; ***p<0.001).
-
Figure 1—source data 1
The raw data and sensory acuity data of Figure 1 and related supplement.
- https://cdn.elifesciences.org/articles/88247/elife-88247-fig1-data1-v1.xlsx
Figure 2 with 1 supplement
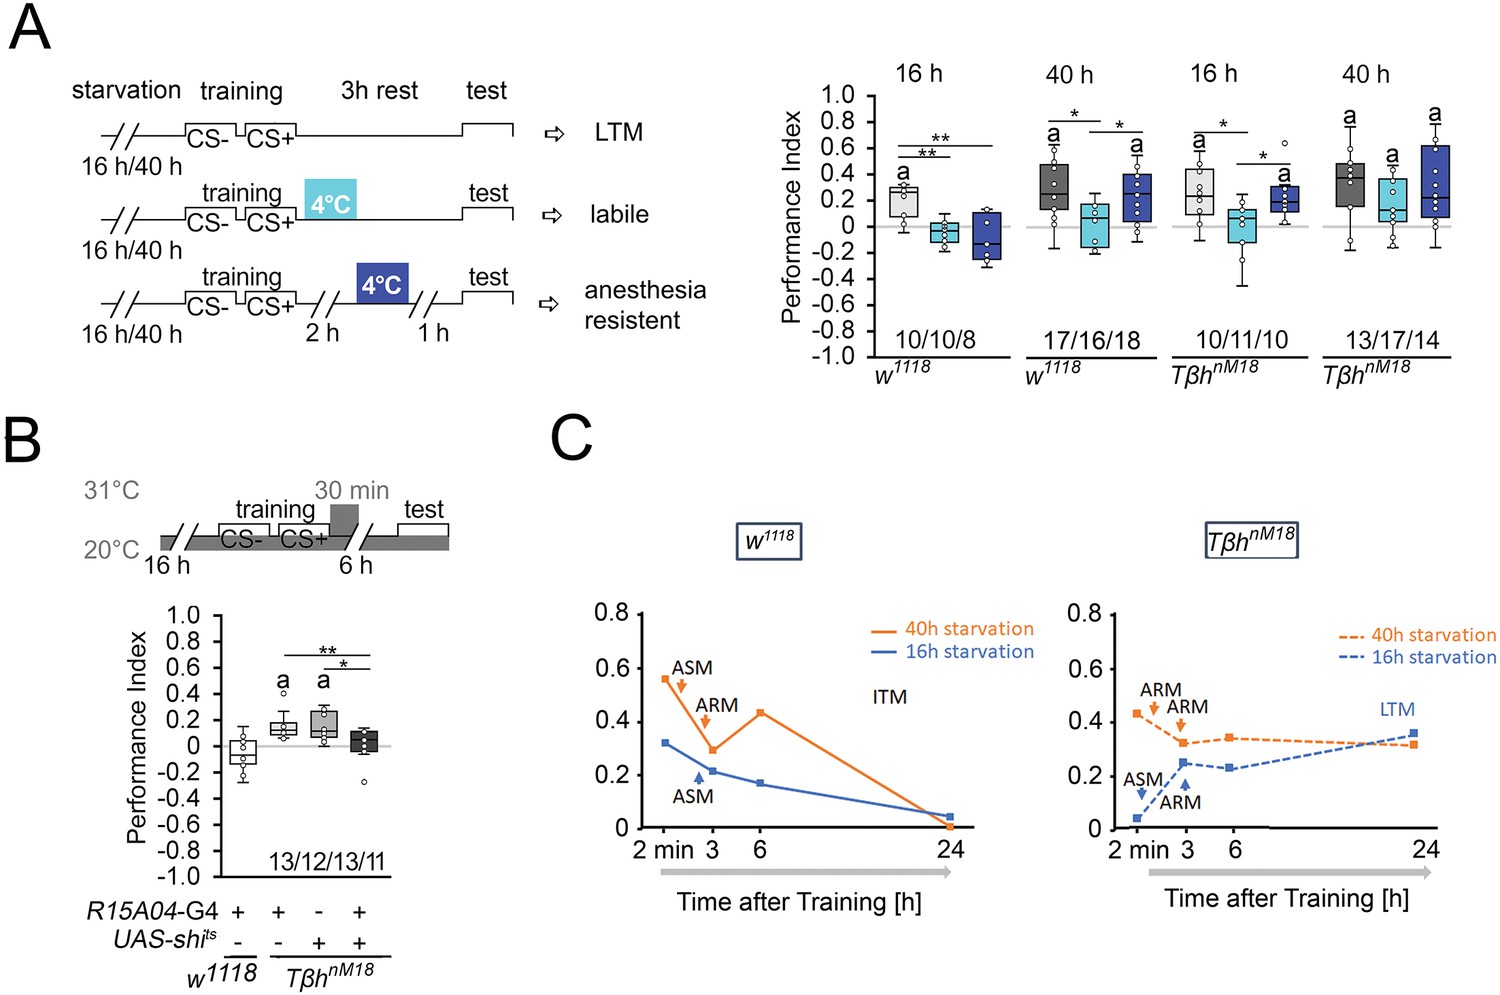
Starvation influences the type of memory.
(A) Appetitive short-term memory (STM) training with 2 M sucrose and cold shock directly or 2 hr after training. Mildly starved control flies exhibit an appetitive memory sensitive to cold shock 3 hr after training. Severely starved control flies develop a memory that is initially sensitive to cold shock, but becomes insensitive after 2 hr. This phenotype is shared with mildly starved TβhnM18 mutants. Prolonged starvation in the mutants shifts memory to cold-shock-insensitive memory. (B) To block neuronal activity and the formation of LTM, a 30 min heat shift was applied immediately after training to flies expressing a temperature-sensitive shibire transgene under the control of the R1504-Gal4 driver. The block results in TβhnM18 mutants losing LTM. Numbers below box plots indicate pairs of reciprocally trained independent groups of male flies. The letter ‘a’ marks a significant difference from random choice as determined by a one-sample sign test (p<0.05). One-way ANOVA with Tukey’s post hoc Honest Significant Difference (HSD) test or for data in (A) and Kruskal–Wallis followed by post hoc Dunn’s test and Bonferroni correction was used to determine differences in (B). *p<0.05; **p<0.01. (C) Model summarizing memory performance of control and mutant flies that were either starved for 16 hr (blue line) or 40 hr (orange line). The dots present the average of the data presented in Figures 1 and Figure 2. ASM: anesthesia-sensitive memory; ARM: anesthesia-resistant memory; ITM: intermediate memory; LTM: long-term memory. Source data see Figure 2—source data 1.
-
Figure 2—source data 1
The raw data and sensory acuity data of Figure 2 and related supplement.
- https://cdn.elifesciences.org/articles/88247/elife-88247-fig2-data1-v1.xlsx
Figure 2—figure supplement 1
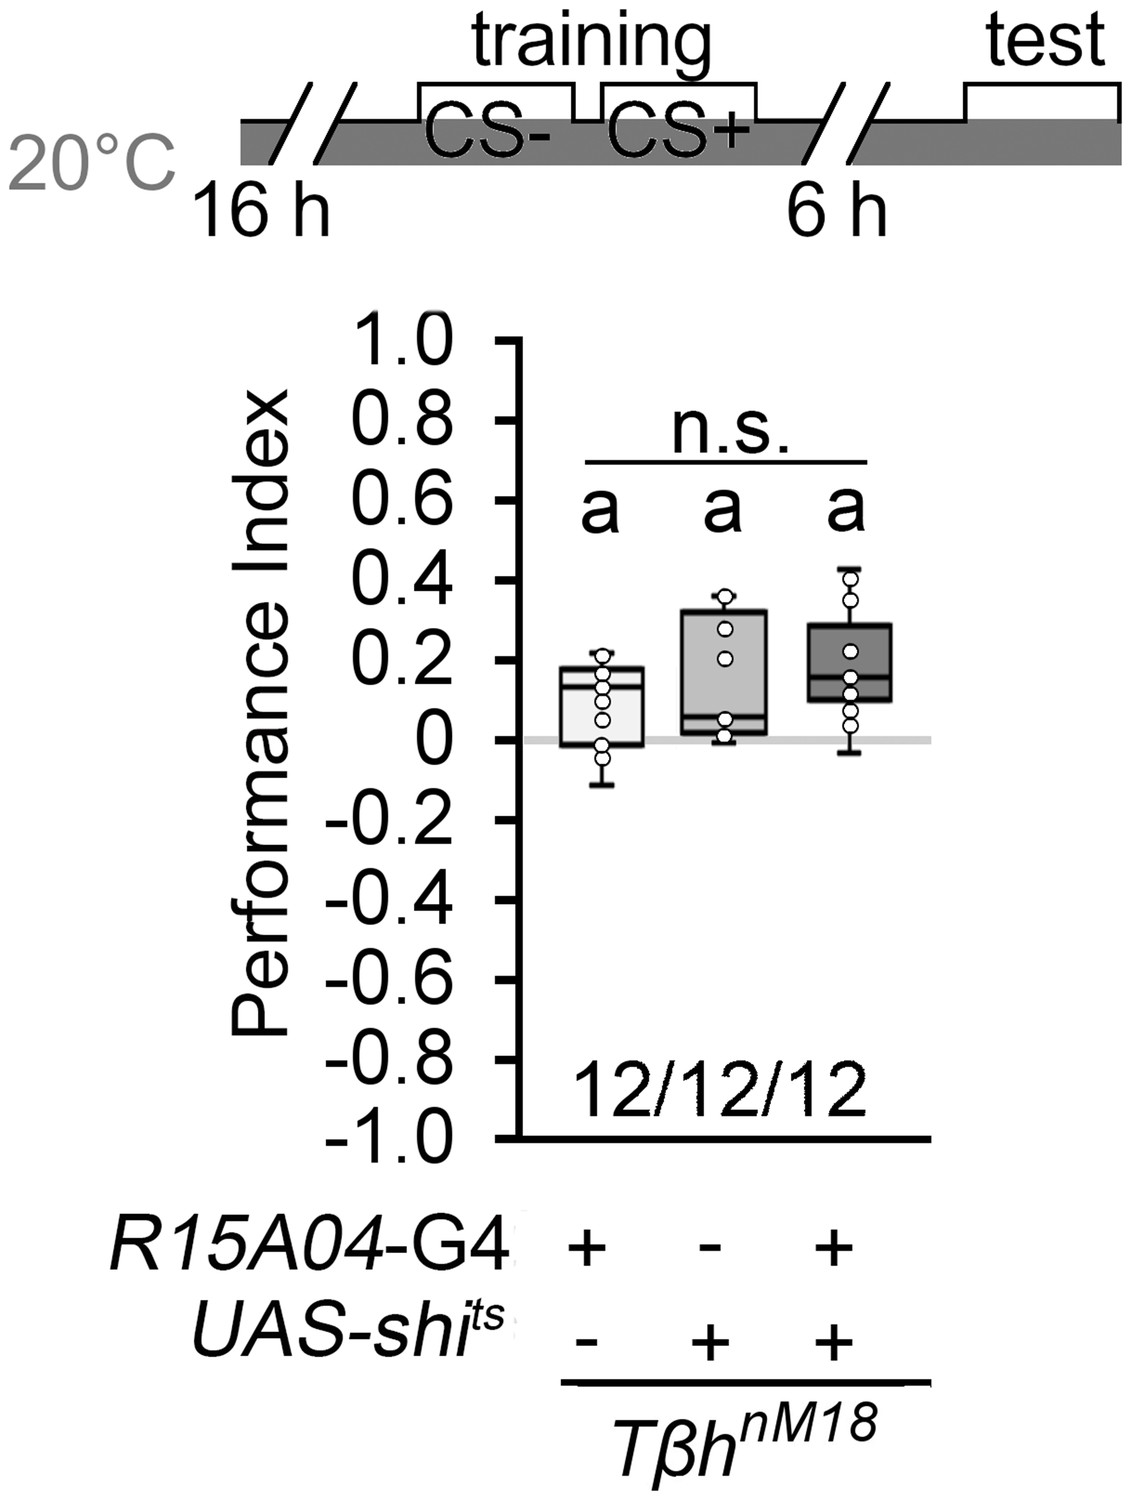
Controls for heat shift experiment in Figure 2B.
To control for memory performance without a heat shift, flies expressing a temperature-sensitive shibire transgene under the control of the R1504-Gal4 driver were trained and tested at the permissive temperature and compared to the respective controls. The tested groups showed memory 6 hr after the training and did not differ from each other. Flies were starved for 16 hr and 2 M sucrose was used as reinforcer. The behavior differed from random choice as determined using a one-sample sign test and marked with the letter ‘a’ (p<0.05). The one-way ANOVA with post hoc Tukey’s Honest Significant Difference (HSD) was used to analyze difference between groups. n.s = no significant differences.
Figure 3 with 1 supplement
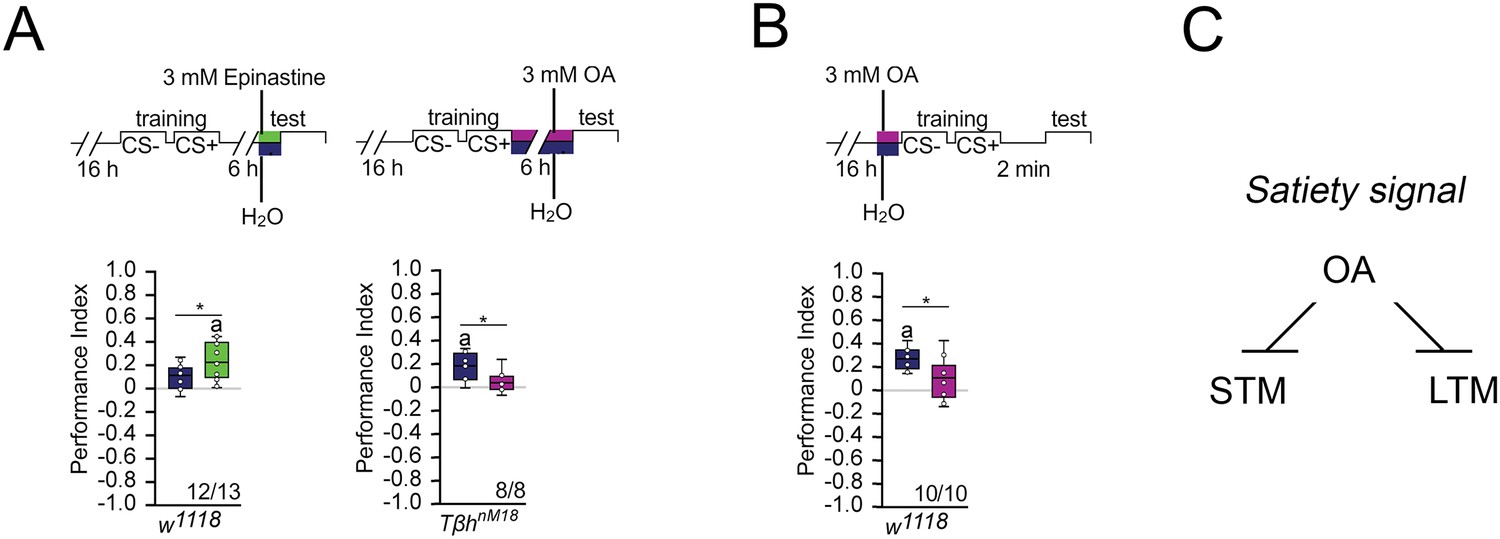
Octopamine suppresses memory.
(A) Feeding 3 mM of the octopamine receptor antagonist epinastine for 1 hr after training resulted in memory 6 hr later in w1118 flies. Feeding 3 mM octopamine for 6 hr after training suppresses long-term memory (LTM) in TβhnM18. (B) A 3 mM octopamine feeding pulse 30 min before training inhibits short-term memory (STM) in TβhnM18 mutants. Controls were water-fed. (A, B) Flies were starved for 16 hr and 2 M sucrose was used as reinforcer. The letter ‘a’ marks a significant difference from random choice as determined by a one-sample sign test (p<0.05). Student’s t-tests were used to determine differences between two groups (*p<0.05). Numbers below box plots indicate pairs of reciprocally trained independent groups of male flies. (C) Model for memory suppression.
-
Figure 3—source data 1
The raw data of Figure 3 and related supplement.
- https://cdn.elifesciences.org/articles/88247/elife-88247-fig3-data1-v1.xlsx
Figure 3—figure supplement 1
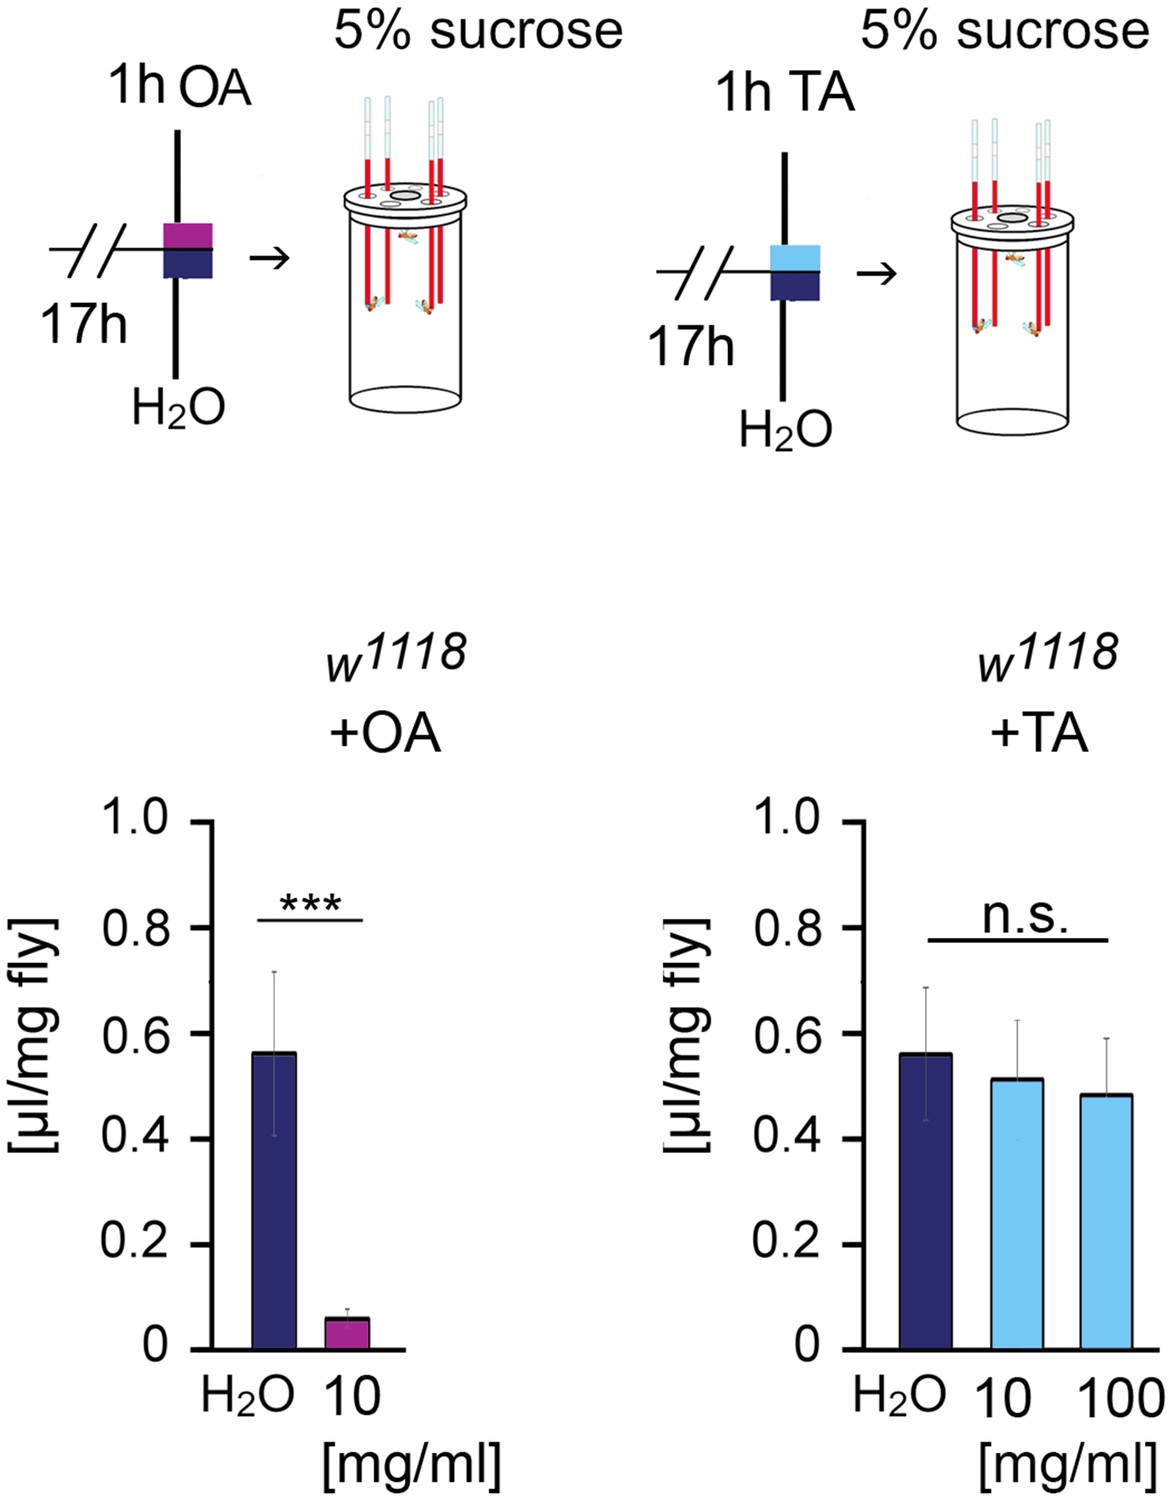
Octopamine but not tyramine suppresses food intake.
The w1118 flies were starved for 17 hr followed by feeding 1 hr octopamine (10 mg/ml), tyramine (10 or 100 mg/ml), or water. The intake of 5% sucrose after 3 hr was determined using the CAFÉ assay. Student’s t-tests were used to determine differences between two groups and one-way ANOVA with Tukey’s post hoc Honest Significant Difference (HSD) test between three groups. ***p<0.001; n.s. = non-significant. N = 13–20 groups of 20 male flies.
Figure 4
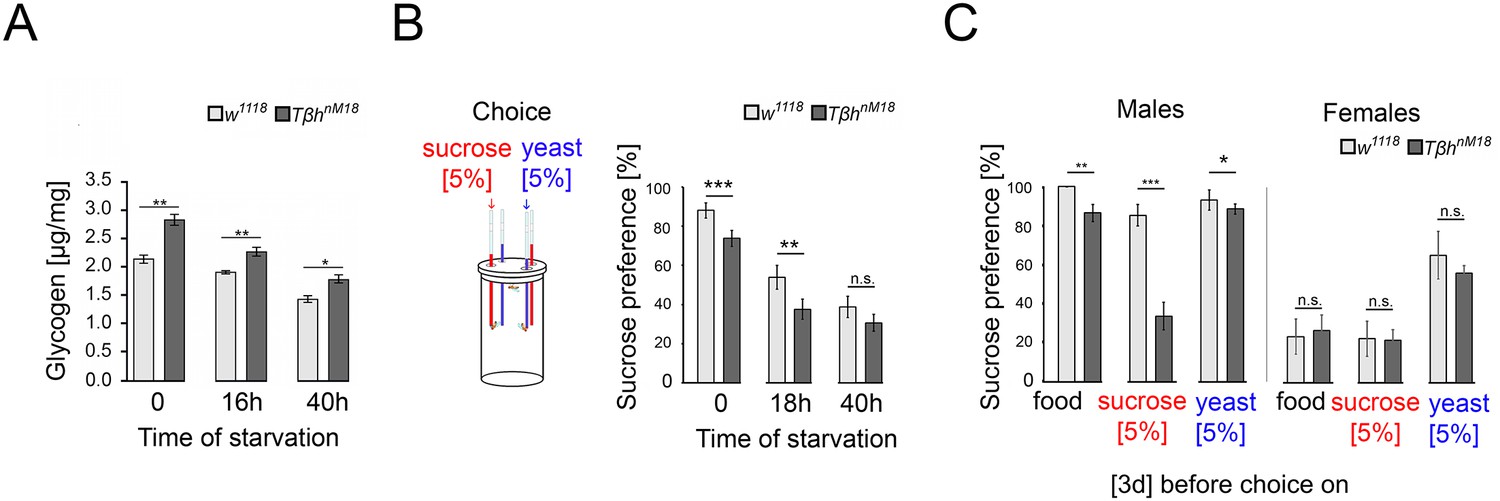
Elevated glycogen levels correlate with reduced sucrose preference.
(A) Analysis of whole-body glycogen levels in w1118 and Tβhnm18 flies. In TβhnM18 flies, glycogen content is significantly higher than those in w1118 flies under similar starvation conditions. N = 3 groups of five male flies. (B) Flies were starved 18 hr or 40 hr before food intake was measured for 24 hr. Flies chose between 5% sucrose and 5% yeast. The preference was determined. All flies showed a significant preference for sucrose consumption. Starvation reduced the preference. Tβhnm18 showed a significantly reduced preference for sucrose in comparison to control flies, but not after 40 hr starvation. N = 20–26 groups of eight flies. (C) Feeding male flies for 3 d on standard fly food (food), 5% sucrose, or 5% yeast resulted in control flies preferring to consume sucrose. Male Tβhnm18 mutants fed normal food, sucrose, and yeast showed a significant reduction in sucrose preference. Female flies of controls and mutants did not differ in their preferences. N = 14–28 groups of eight flies. To determine differences between two groups, the Mann–Whitney U test was used. *p<0.05; **p<0.01; ***p<0.001.
-
Figure 4—source data 1
Raw data related to Figure 4.
- https://cdn.elifesciences.org/articles/88247/elife-88247-fig4-data1-v1.xlsx
Figure 5 with 2 supplements
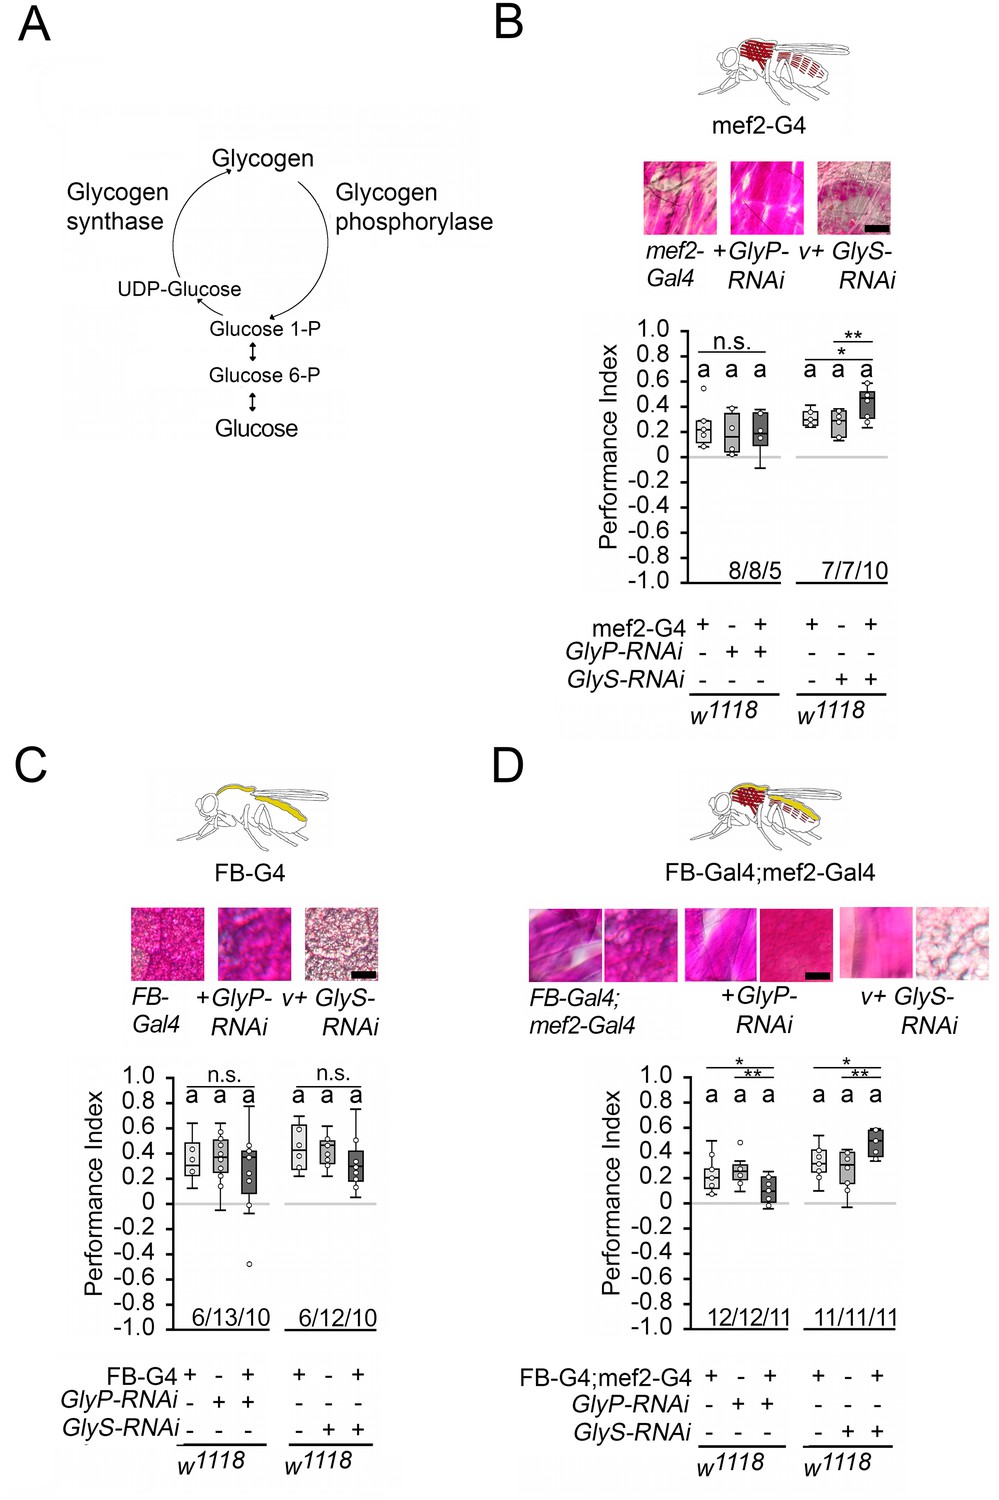
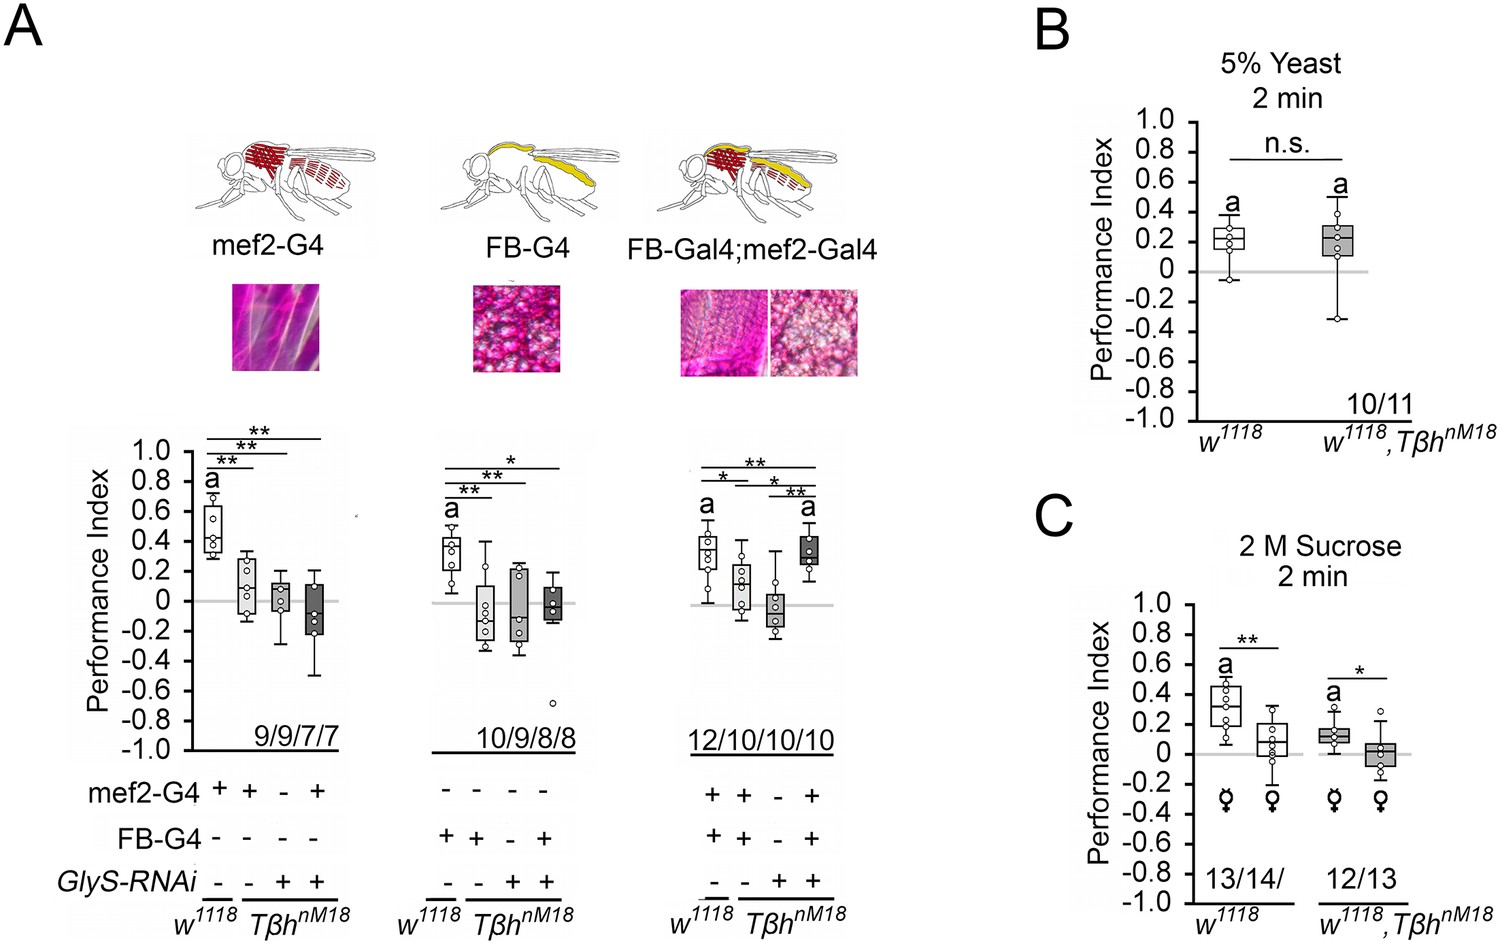
Carbohydrate storage influences appetitive short-term memory (STM).
(A) Schemata of glycogen synthesis. The expression of GlyP-RNAi reduced glycogen phosphorylase and increased glycogen levels, whereas GlyS-RNAi reduced glycogen synthase and decreased glycogen levels in target tissues (Figure 3). (B–D) PAS was used to visualize glycogen levels in larval muscle or fat bodies. (B) Increases in glycogen in the muscles have no effect on STM, whereas reduced muscle glycogen increases appetitive STM. (C) Increased or decreased glycogen levels in the fat bodies did not interfere with STM. (D) A combined increase in glycogen in muscles and fat bodies reduced STM, and a decrease in glycogen increased STM. Flies were starved for 16 hr and 2 M sucrose was used as reinforcer. Numbers below box plots indicate one pair of reciprocally trained independent fly groups. The letter ‘a’ marks a significant difference from random choice as determined by a one-sample sign test (p<0.05). The one-way ANOVA with post hoc Tukey’s Honest Significant Difference (HSD) was used to determine differences between three groups (*p<0.05; **p<0.01).
-
Figure 5—source data 1
The raw data and sensory acuity data of Figure 5 and related supplement.
- https://cdn.elifesciences.org/articles/88247/elife-88247-fig5-data1-v1.xlsx
Figure 5—figure supplement 1

Glycogen level in adult flies with reduced GlyP and GlyS.
The relative glycogen content in flies with altered GlyP and GlyS in muscles, fat bodies, or both. The expression of GlyP-RNAi and GlyS-RNAi under the control of mef2-Gal4 did not significantly change the relative glycogen level in whole animals, but in the thorax. The expression of GlyP-RNAi under the control of FB-Gal4 increased significantly glycogen levels in whole animals, and the expression of GlyS-RNAi decreased glycogen in the abdomen. When both drivers are combined, the expression of GlyP-RNAi increases glycogen in whole animals and the expression of GlyS-RNAi decreases the glycogen levels. Glycogen was measured in three groups of five male flies and normalized to the protein levels and to the glycogen levels of flies of the Gal4 driver. ANOVA with post hoc Tukey’s Honest Significant Difference (HSD) was used to determine the differences between three groups. *p<0.05; **p<0.01, ***p<0.001.
Figure 5—figure supplement 2
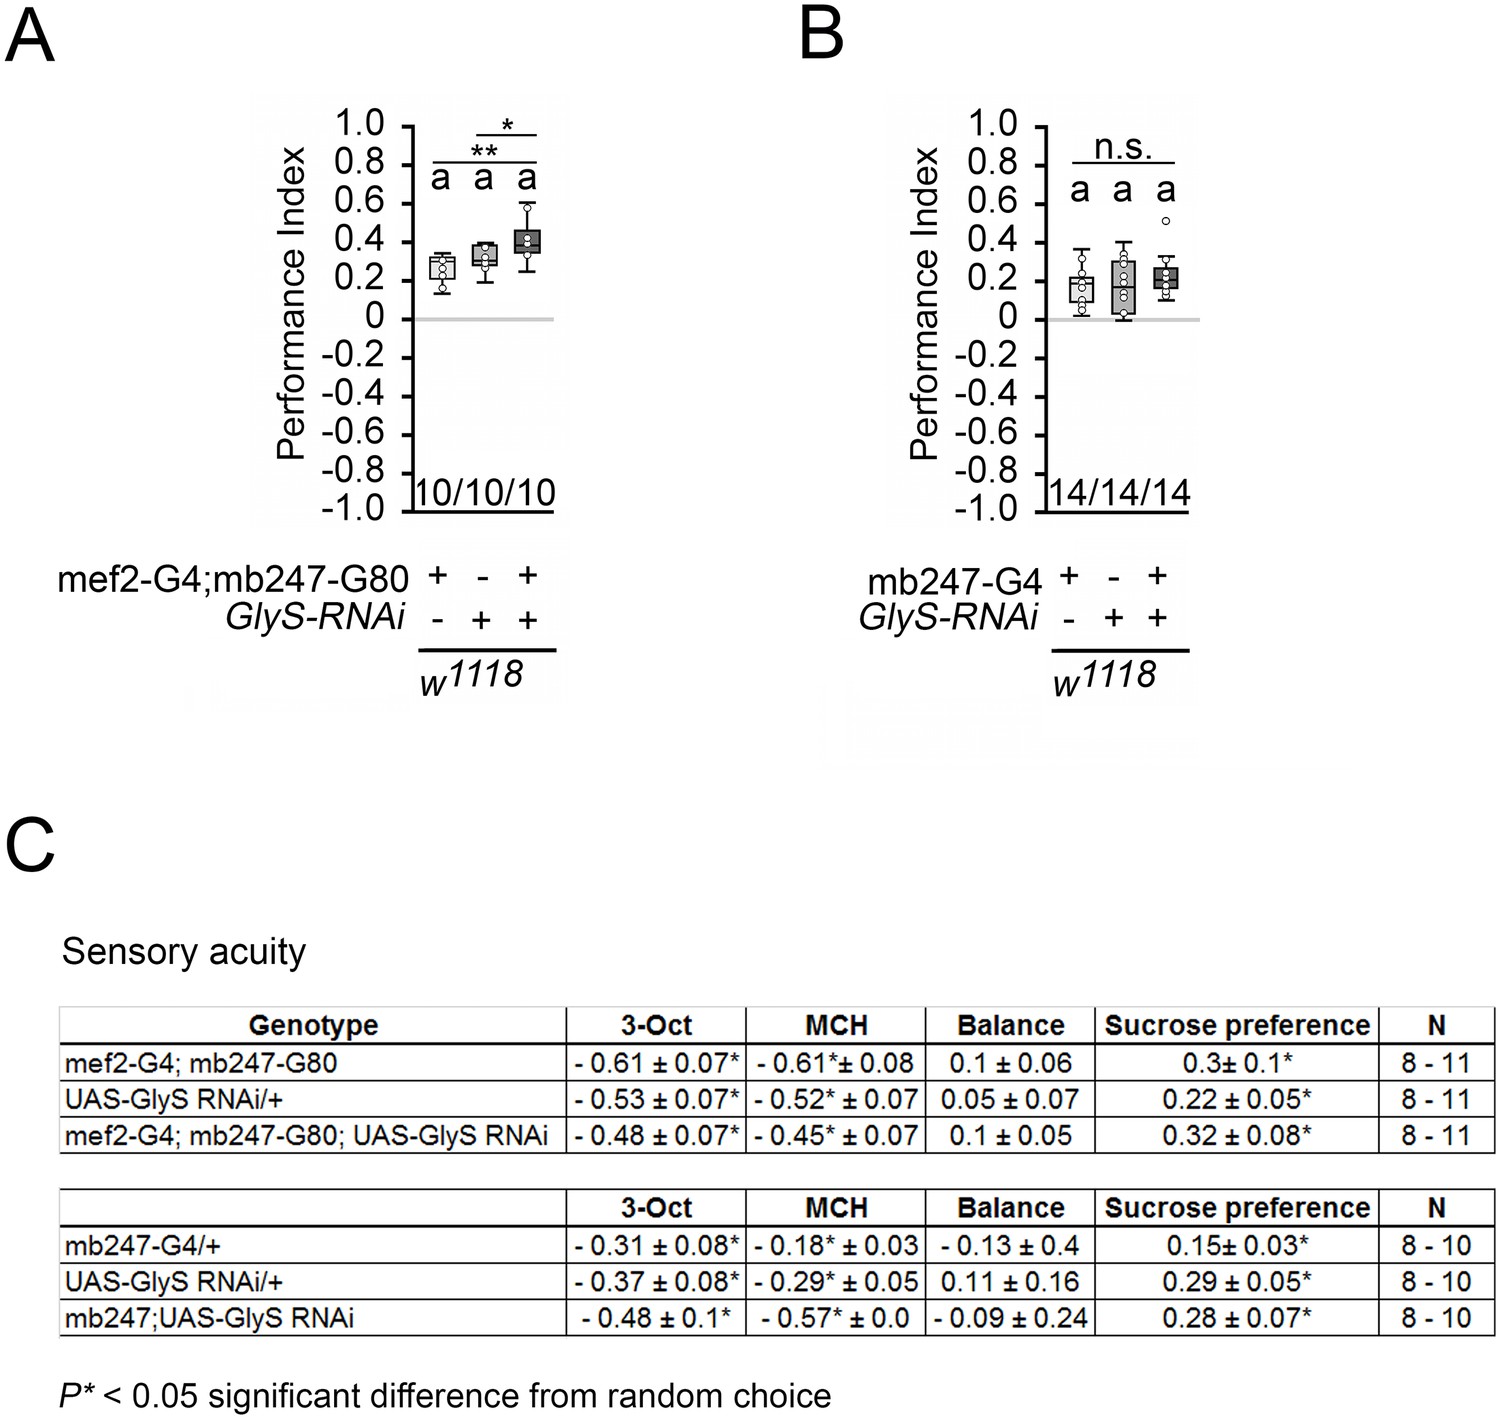
The glycogen level in the mushroom bodies does not influence appetitive short-term memory (STM).
(A) The expression of GlyS-RNAi under control of the mef2-Gal4; mb247-Gal4 drivers increased STM. (B) The expression of GlyS-RNAi under control of the mb247-Gal4 driver did not change STM. Flies were starved for 16 hr and 2 M sucrose was used as reinforcer. One-way ANOVA with Tukey’s Honest Significant Difference (HSD) post hoc test was used to determine differences between the groups. *p<0.05; **p<0.01; n.s. = non-significant. The letter ‘a’ marks a significant difference from random choice as determined by a one-sample sign test (p<0.05). Numbers below box plots indicate one pair of reciprocally trained independent fly groups. (C) Sensory acuity tests for the genotypes used.
Figure 6 with 1 supplement
Reducing glycogen in TβhnM18 improves appetitive short-term memory (STM).
(A) Decreasing glycogen concentration using UAS-GlySRNAi in the muscles or fat bodies in TβhnM18 mutants did not improve STM, but decreasing glycogen in both tissues improved STM to control levels. Flies were starved for 16 hr and 2 M sucrose was used as reinforcer. (B) 16 hr-starved w1118 and Tβhnm18 flies formed similar levels of appetitive STM when 5% yeast was used as a reinforcer. (C) 16 hr-starved virgin females of w1118 and Tβhnm18 displayed STM, whereas mated females of both genotypes did not. Differences from random choice were determined using a one-sample sign test and marked with the letter ‘a’ (p<0.05). Differences between two groups were determined using Student’s t-tests, and differences among four groups were determined with one-way ANOVA with Tukey’s Honest Significant Difference (HSD) post hoc test. *p<0.05; **p<0.01. Numbers below box plots indicate one pair of reciprocally trained independent fly groups.
-
Figure 6—source data 1
The raw data and sensory acuity data of Figure 6 and related supplement.
- https://cdn.elifesciences.org/articles/88247/elife-88247-fig6-data1-v1.xlsx
Figure 6—figure supplement 1

Starvation influences yeast consumption of Tβhnm18 flies.
Non-starved Tβhnm18 male flies consumed significantly more yeast within 24 hr. Starved Tβhnm18 mutants consumed similar amounts of yeast. N = 26 groups of eight flies. To determine differences between both groups, Student’s t-test was used. ***p<0.001; n.s. = non-significant difference.
Figure 7 with 1 supplement
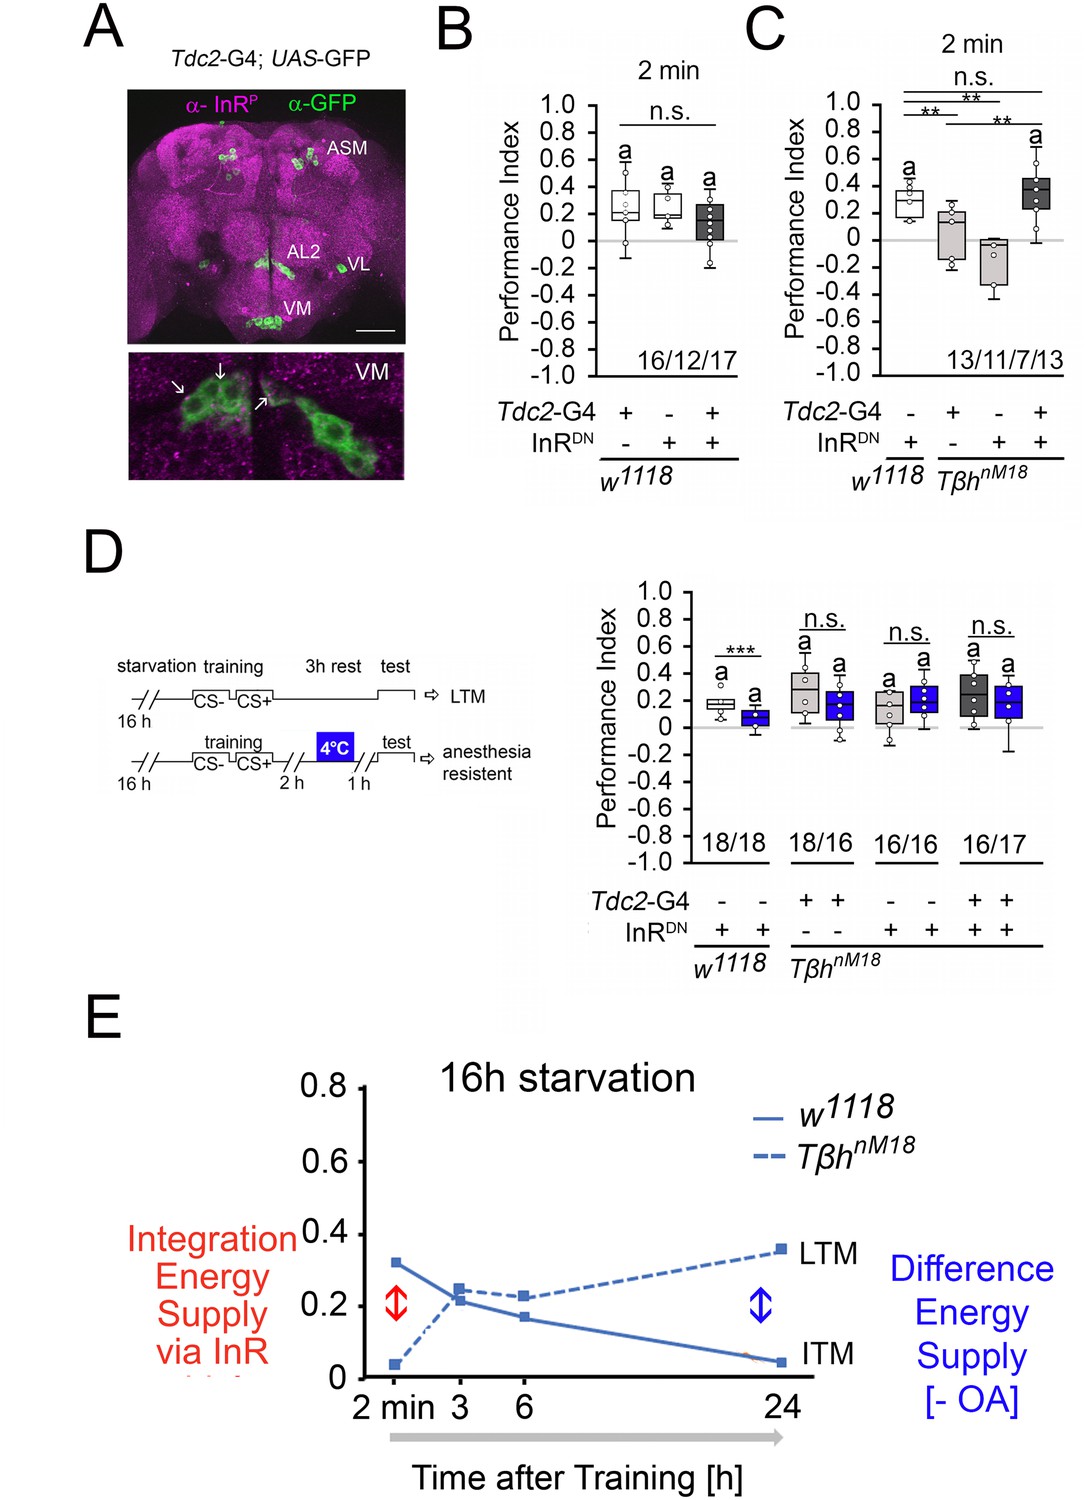
Insulin signaling in reward neurons regulates short-term memory (STM).
(A) The activated form of the InR is expressed in punctuate manner throughout the brain (in magenta) and is also detected in octopaminergic reward neurons visualized by using the UAS-mCD8::GFP transgene under the control of the Tdc2-Gal4 driver (in green). (B) Blocking InR signaling in Tdc2-Gal4-targeted octopaminergic neurons does not change appetitive STM in 16 hr-starved flies using 2 M as reinforcer. (C) Blocking InR signaling in Tdc2-Gal4-targeted octopaminergic neurons in TβhnM18 mutants restored STM to control levels. (D) A cold shock did not disrupt emerging memory in TβhnM18 mutants with blocked InR under the control of the Tdc2-Gal4 driver. Student’s t-test was used to determine differences between two groups, and one-way ANOVA with Tukey’s post hoc Honest Significant Difference (HSD) test to determine differences between three or more groups. n.s. = not significant; *p<0.05; **p<0.01, ***p<0.01. The letter ‘a’ marks a significant difference from random choice as determined by a one-sample sign test (p<0.05). (E) Model of memory regulation in TβhnM18 mutants. LTM: long-term memory ; ITM: intermediate-term memory.
-
Figure 7—source data 1
The raw data and sensory acuity data of Figure 7.
- https://cdn.elifesciences.org/articles/88247/elife-88247-fig7-data1-v1.xlsx
Figure 7—figure supplement 1

The antibody against phosphorylated InR recognizes activated InR.
(A, B) In the antennal lobes (AL) of the male adult brain, the immunoreactivity recognized by the anti-InRP antibody is shown in magenta, and GFP expression is shown in green. The Gal4 expression of the Tdc2-Gal4 driver targeting octopaminergic neurons is visualized using the UAS-mCD8::GFP transgene. (B) The expression of the constitutively active insulin receptor results in increased immunoreactivity detected by the anti-InRP antibody.
Figure 8
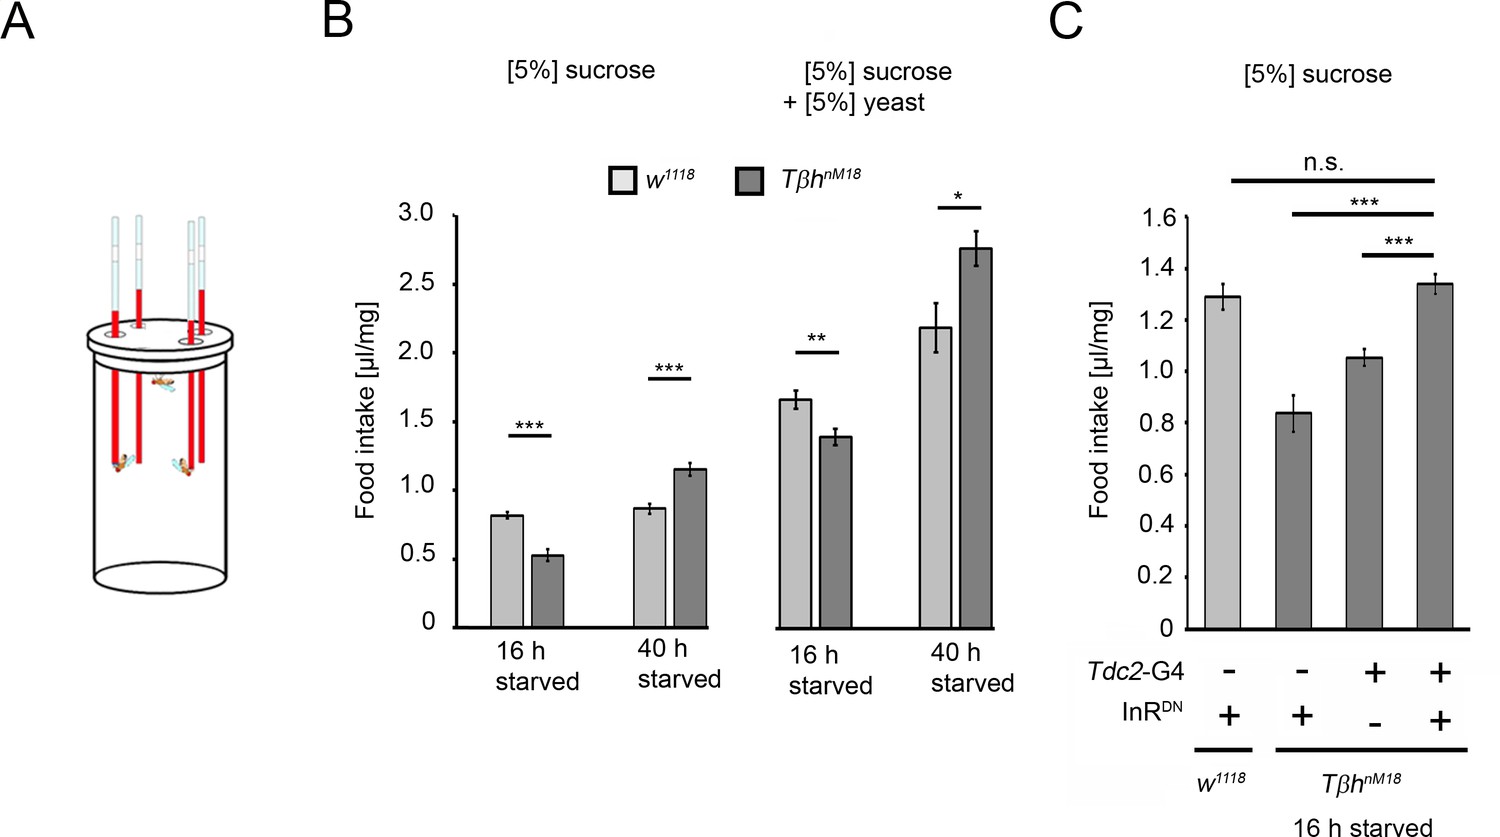
Prolonged starvation results in rebound sucrose intake in hyperglycemic TβhnM18 mutants.
(A) Capillary feeder assay used to determine food intake. (B) Flies were starved 16 hr or 40 hr before 24 hr food intake was measured. After 16 hr of starvation, TβhnM18 mutants significantly consumed less 5% sucrose or 5% sucrose with 5% yeast. After 40 hr of starvation, TβhnM18 mutants significantly consumed more sucrose and sucrose with yeast. N = 20–26 groups of eight flies. (C) Blocking InR signaling in Tdc2-Gal4-targeted octopaminergic neurons in TβhnM18 mutants significantly increased 5% sucrose consumption. N = 20–28 groups of eight flies. To determine differences between two groups, Student’s t-test was used, and to determine differences between three or more groups, one-way ANOVA with post hoc Tukey’s Honest Significant Difference (HSD) was used. n.s. = non-significant; *p<0.05; **p<0.01; ***p<0.001.
-
Figure 8—source data 1
The raw data related of Figure 8.
- https://cdn.elifesciences.org/articles/88247/elife-88247-fig8-data1-v1.xlsx
Tables
Key resources table
| Reagent type (species) or resource | Designation | Source or reference | Identifiers | Additional information |
|---|---|---|---|---|
| Strain, strain background (Drosophila melanogaster) | w1118TβhnM18 | Monastirioti et al., 1996 | ||
| Strain, strain background (D. melanogaster) | w1118 | Scholz lab | ||
| Strain, strain background (D. melanogaster) | UAS-GlySHMS01279-RNAi | BDSC | BDSC_34930 | |
| Strain, strain background (D. melanogaster) | UAS-GlyPHMS00032-RNAi | BDSC | BDSC_33634 | |
| Strain, strain background (D. melanogaster) | w1118; UAS-shits | Kitamoto, 2001 | ||
| Strain, strain background (D. melanogaster) | P{UAS-InR. K1409A} | BDSC | BDSC_8253 | |
| Strain, strain background (D. melanogaster) | w1118; FB-Gal4 | Partridge Lab | ||
| Strain, strain background (D. melanogaster) | mef2-Gal4 | Ranganayakulu et al., 1998 | ||
| Strain, strain background (D. melanogaster) | R15A04-Gal4 | BDSC | BDSC_48671 | |
| Strain, strain background (D. melanogaster) | dTdc2-Gal4 | Cole et al., 2005 | ||
| Chemical compound, drug | 3-Octanol | Sigma-Aldrich | 93856 | |
| Chemical compound, drug | 4-Methyl-cyclohexanol | Sigma-Aldrich | 153095 | |
| Chemical compound, drug | Paraffin oil | Sigma-Aldrich | 76235 | |
| Chemical compound, drug | Octopamin -hydrochlorid | Sigma-Aldrich | O0250-1G | |
| Chemical compound, drug | Epinastine-hydrochlorid | Sigma-Aldrich | E5156 | |
| Commercial assay or kit | Glucose (HK) assay kit | Sigma-Aldrich | GAHK20 | |
| Commercial assay or kit | Periodic Acid-Schiff (PAS) Kit | Sigma-Aldrich | 395B | |
| Antibody | Phospho-IGF-I Receptor β (Tyr1131) /Insulin Receptor β (Tyr1146) Antibody (polyclonal rabbit) | Cell Signaling Technology | 3021 | 1:50 |
Additional files
Download links
A two-part list of links to download the article, or parts of the article, in various formats.
Downloads (link to download the article as PDF)
Open citations (links to open the citations from this article in various online reference manager services)
Cite this article (links to download the citations from this article in formats compatible with various reference manager tools)
Octopamine integrates the status of internal energy supply into the formation of food-related memories
eLife 12:RP88247.
https://doi.org/10.7554/eLife.88247.3


