Deciphering the complex relationship between type 2 diabetes and fracture risk with both genetic and observational evidence
- The affiliated Hangzhou first people’s hospital, School of Medicine, Westlake University, China
- Diseases & Population (DaP) Geninfo Lab, School of Life Sciences, Westlake University, Hangzhou, China, China
- Westlake Laboratory of Life Sciences and Biomedicine, China
- Institute of Basic Medical Sciences, Westlake Institute for Advanced Study, China
- Health Management Center, The Second Xiangya Hospital of Central South University, China
- Department of Orthopedics, Yantai Affiliated Hospital of Binzhou Medical University, China
- Department of Geratology, The Third People's Hospital of Hangzhou, China
- Department of Endocrinology, Second Affiliated Hospital of Soochow University, China
- Department of Dermatology, Hangzhou Hospital of Traditional Chinese Medicine, China
- Central Health Center of Mashenqiao Town, China
- Azrieli Faculty of Medicine, Bar-Ilan University, Israel
Figures
Figure 1 with 1 supplement
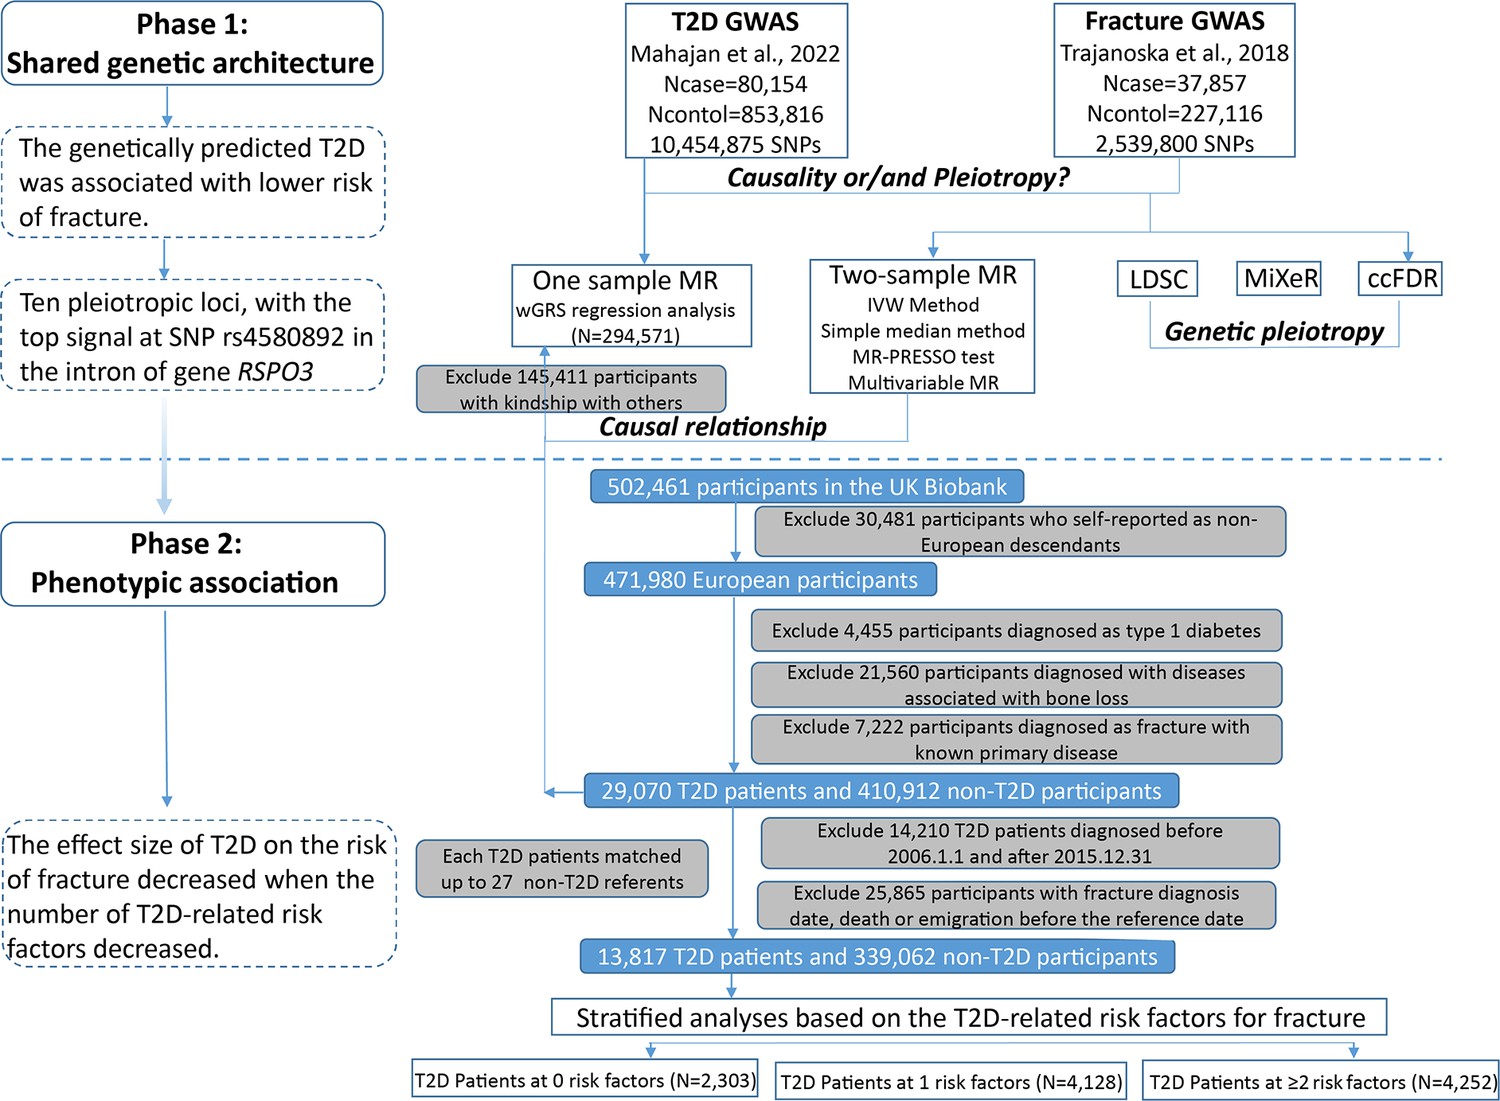
Flow chart of the overall study design.
Figure 1—figure supplement 1

The matching information of 14,860 patients with fractures.
Figure 2 with 1 supplement
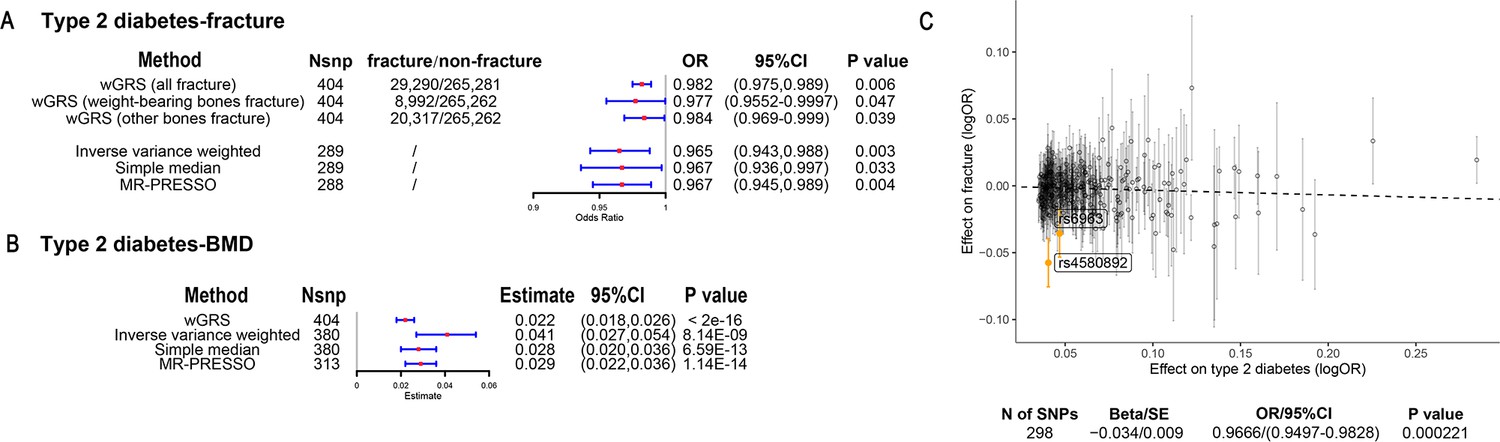
The association of genetically predicted type 2 diabetes with fracture and bone mineral density (BMD) by using different Mendelian randomization (MR methods).
(A) The genetically predicted type 2 diabetes and fracture. (B) The genetically predicted type 2 diabetes and BMD. (C) Visualized the association of lead SNPs for type 2 diabetes with the risk of fracture. Abbreviations: wGRS, weighted genetic risk score; MR-PRESSO, MR pleiotropy residual sum and outlier.
Figure 2—figure supplement 1
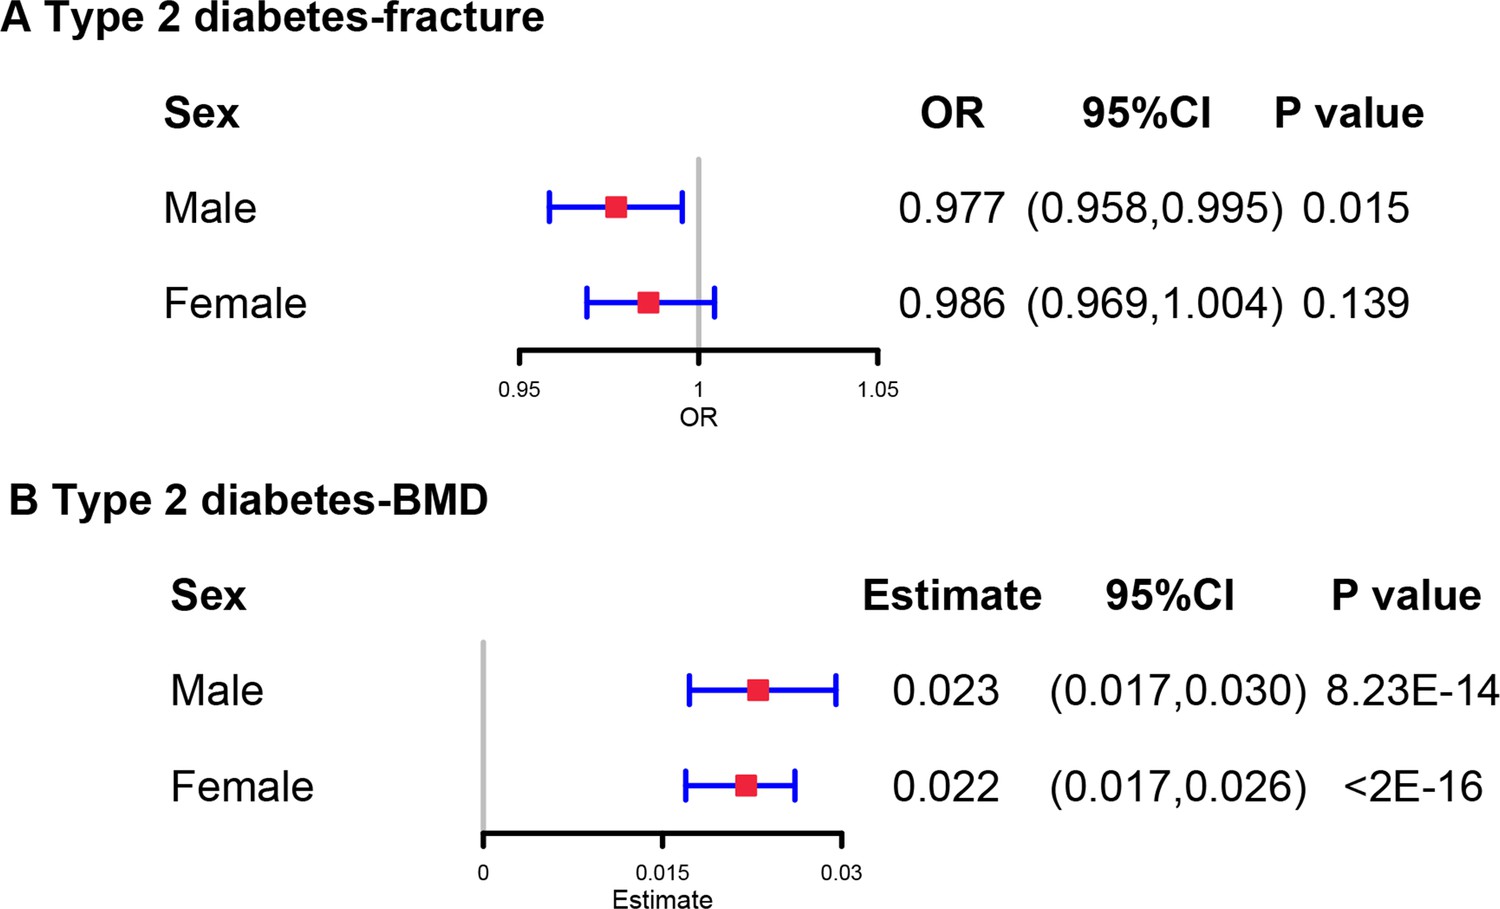
The regression between type 2 diabetes GRS and fracture risk/bone mineral density (BMD) in male and female.
Models were adjusted for reference age, sex, BMI, physical activity, fall history, HbA1c, and medication treatments.
Figure 3
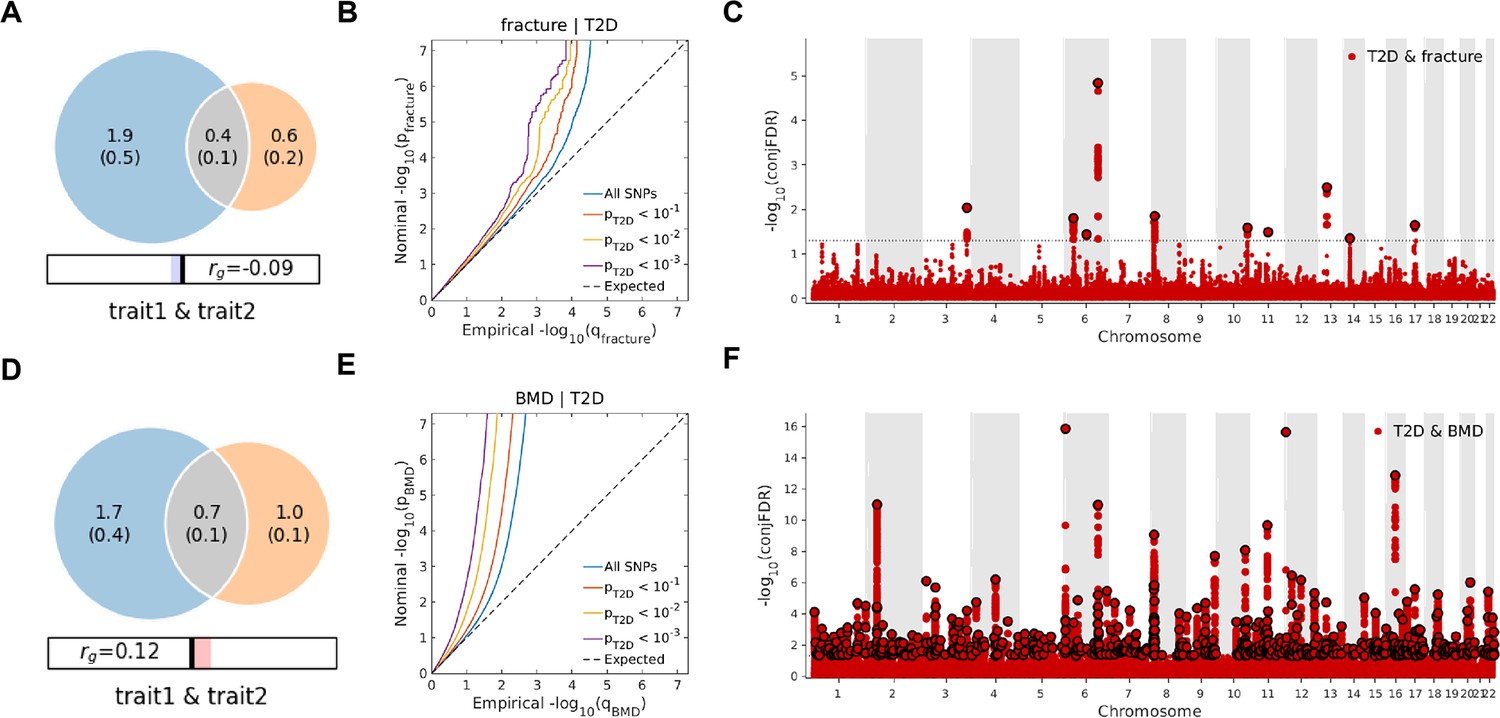
The Venn diagrams, conditional quantile-quantile (QQ) plots, and genetic variants jointly associated with type 2 diabetes and fracture/bone mineral density (BMD) at conjunctional false discovery rate (conjFDR) <0.05.
(A) The shared number of variants between type 2 diabetes and fracture. (B) The conditional QQ plot of fracture given the association with type 2 diabetes at the level of p≤0.1, p≤0.01, p≤0.001. (C) The shared genetic loci between type 2 diabetes and fracture. (D) The shared number of variants between type 2 diabetes and BMD. (E) The conditional QQ plot of BMD given the association with type 2 diabetes at the level of p≤0.1, p≤0.01, p≤0.001. (F) The shared genetic loci between type 2 diabetes and BMD.
Figure 4
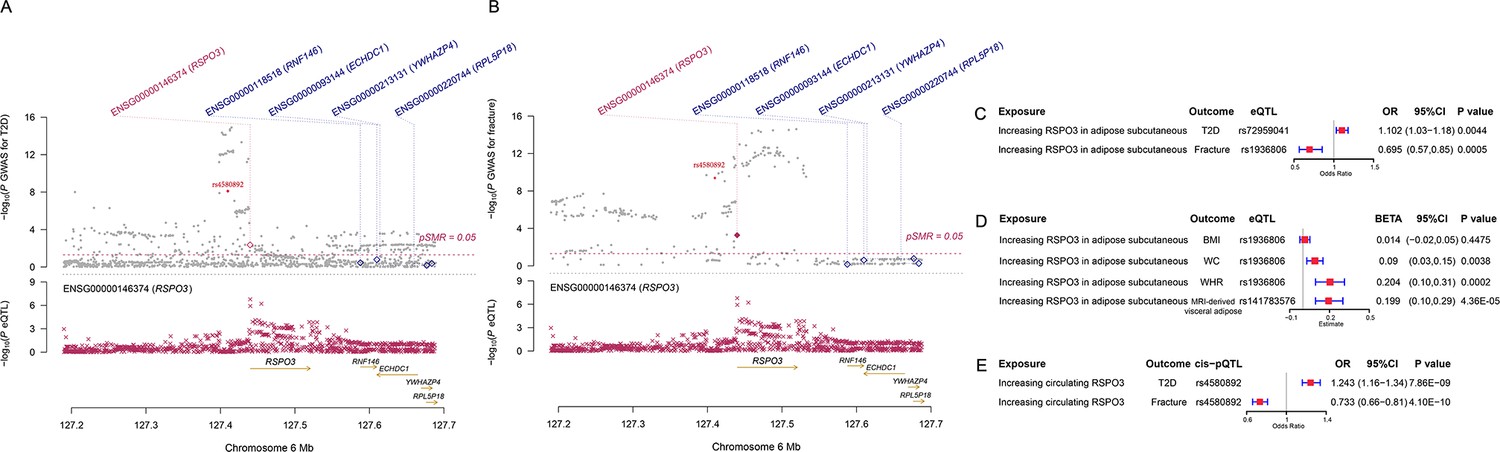
The distinct signal (RSPO3) shared by type 2 diabetes and fracture.
(A) The regional plot of the association of type 2 diabetes and RSPO3 gene expression (adipose subcutaneous) within hg19: chr6:127189749–127689749 (RSPO3 gene region ±250 kb window). (B) The regional plot of the association of fracture and RSPO3 gene expression (adipose subcutaneous) in the same region. (C) The association of genetically predicted RSPO3 gene expression with type 2 diabetes and fracture risk. (D) The association of genetically predicted RSPO3 gene expression with BMI, waist circumference, waist-hip ratio, and MRI-derived visceral adipose. (E) The association of genetically predicted circulating RSPO3 with type 2 diabetes and fracture risk.
Figure 5 with 2 supplements
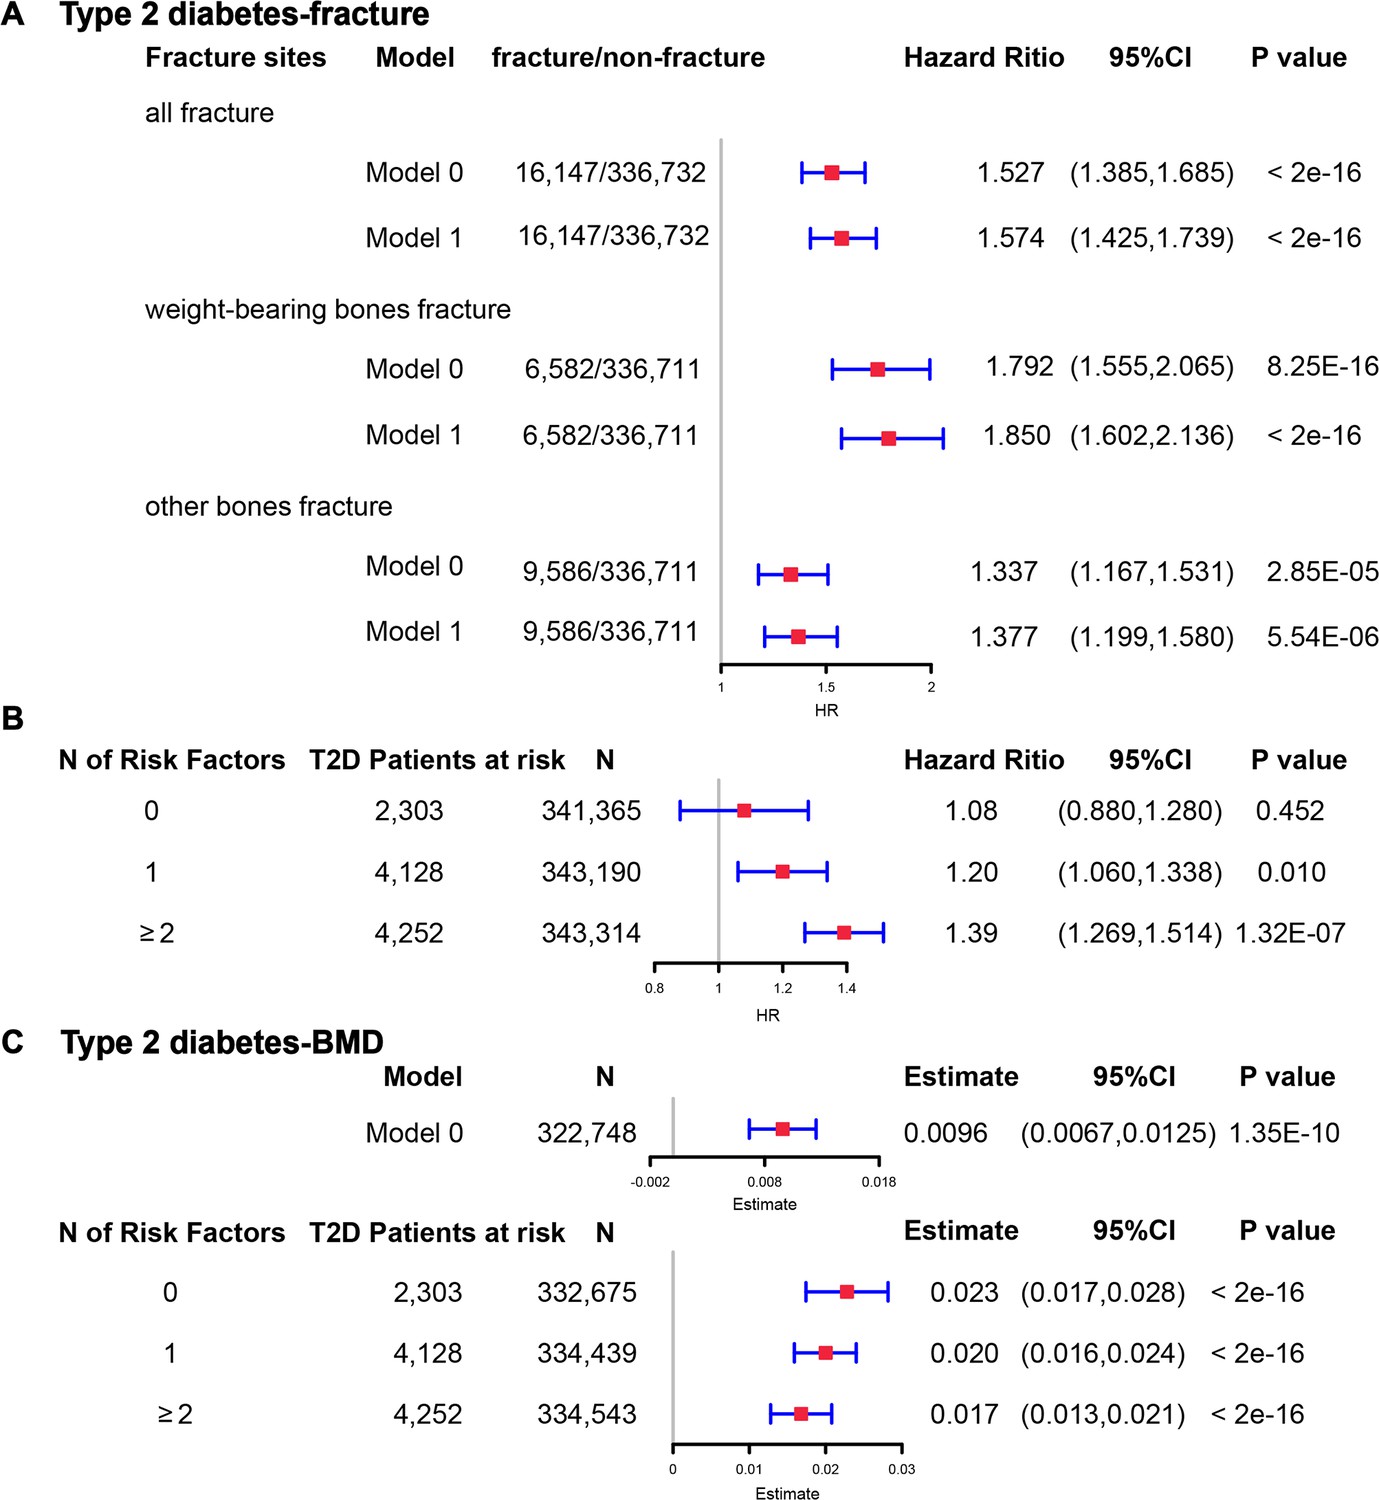
The regression between type 2 diabetes and fracture/bone mineral density (BMD) in the observational study.
(A) The relationship between type 2 diabetes and fracture in different sites including all fractures, weight-bearing bones, and other bones. Model 0 adjusted for reference age, sex, BMI, physical activity, fall history, HbA1c, and medication treatments; Model 1 adjusted for a+ BMD. (B) The stratified analyses between type 2 diabetes, and fracture based on the five T2D-related risk factors for fracture adjusted for the age and sex. (C) The relationship between type 2 diabetes and BMD and the stratified analyses based on the five T2D-related risk factors for fracture adjusted for the age and sex. The five risk factors were: (1) BMI ≤25 kg/m2; (2) no physical activity; (3) falls in the last year; (4) HbA1c≥47.5 mmol/mol; (5) antidiabetic medication treatments.
Figure 5—figure supplement 1
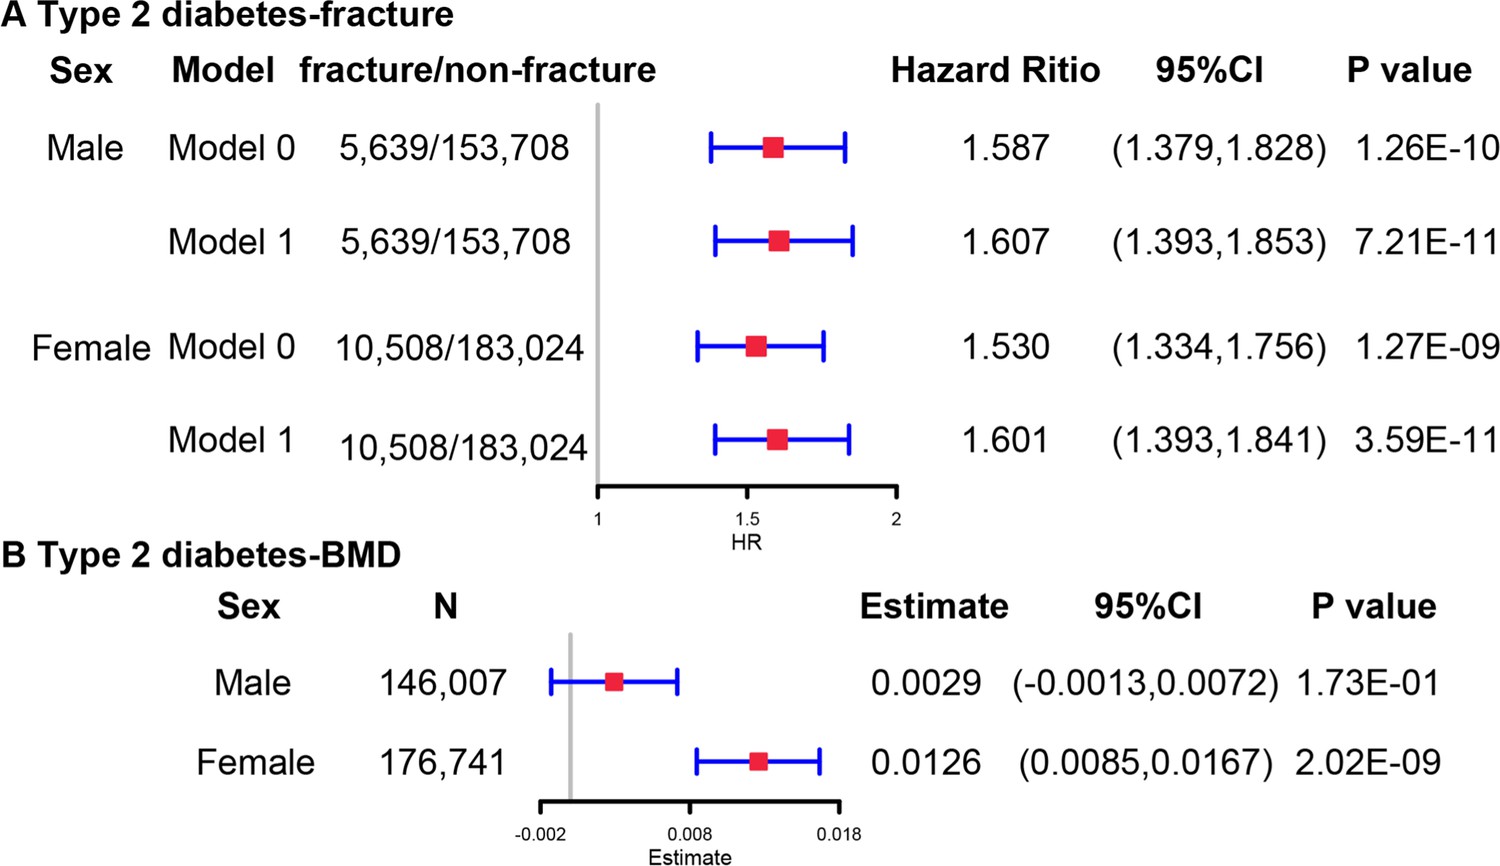
The regression between type 2 diabetes and fracture risk/bone mineral density (BMD) in male and female in the observational study.
Model 0 adjusted for reference age, sex, BMI, physical activity, fall history, HbA1c, and medication treatments; Model 1 adjusted for a+ BMD.
Figure 5—figure supplement 2
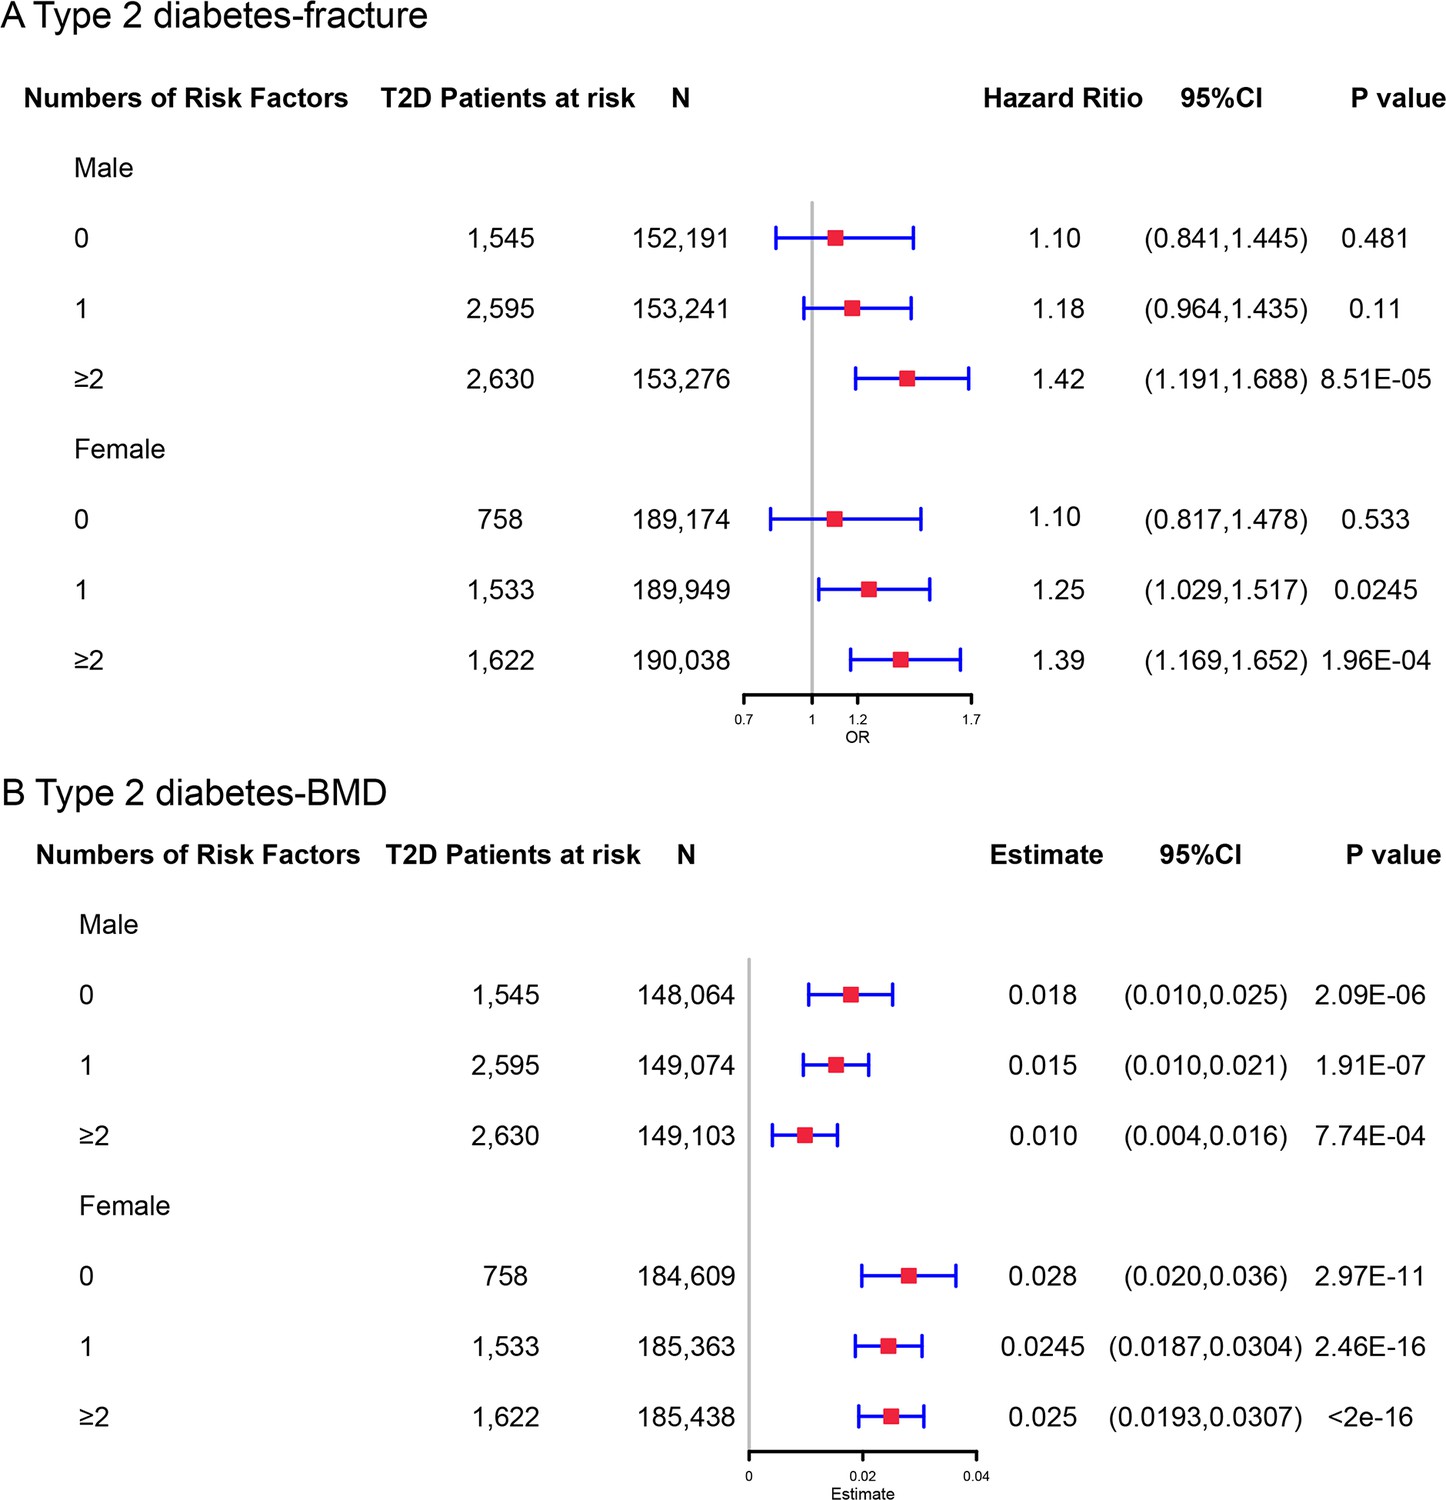
The stratified analyses between type 2 diabetes and fracture/bone mineral density (BMD) based on the five T2D-related risk factors for fracture (BMI ≤25 kg/m2, no physical activity, falls in the last year, HbA1c≥47.5 mmol/mol and antidiabetic medication treatments) in male and female.
Models were adjusted for the age and sex.
Additional files
-
MDAR checklist
- https://cdn.elifesciences.org/articles/89281/elife-89281-mdarchecklist1-v1.docx
-
Supplementary file 1
Supplementary tables.
(a) Characteristics of the 404 single nucleotide polymorphisms associated with type 2 diabetes. (b) The information of 298 lead SNPs for type 2 diabetes with the risk of fracture. (c) Multivariable MR analysis of the direct effect of BMI on fracture risk and BMD. (d) The information of 389 SNPs for type 2 diabetes with BMD. (e) Summary of pariwise genetic correlation using linkage disequilibrium score regeression(LDSC). Abbreviations: p1 = trait 1, p2 = trait 2, rg = genetic correlation, se = standard error of rg, p = p-value for rg, gcov_int, gcov_int_se = cross-trait LD Score regression intercept and standard error. (f) The results of cross-trait analysis with MiXeR model for type 2 diabetes, fracture and BMD. Abbreviations: nc1@p9, nc2@p9, and nc12@p9 = the number of causal variants for trait1, trait2 and both, respectively; nc@p9 = number of trait-influencing variants specific to type 2 diabetes; rho_beta = the correlation of effect sizes within the shared polygenic component; rg = genetic correlation; concordant_fraction = the proportion of shared variants with concordant direction of effect in both traits on all shared variants; pi1@p9, pi2@p9, and pi12@p9 = polygenicity of trait1, trait2 and both, respectively; The best_vs_min_AIC and the best_vs_max_AIC indicates whether MiXeR can accurately distinguish the reported overlap from the minimum and maximum possible overlap allowed, respectively. (g) Distinct genomic loci shared between type 2 diabetes and fracture at conjFDR<0.05. (h) The results of SMR analysis for the expression of RSPO3 (ENSG00000146374) with type 2 diabetes, fracture, BMI, WC, WHR and VAT in adipose subcutaneous. (i) Distinct genomic loci shared between type 2 diabetes and BMD at conjFDR<0.05. (j) The characteristics of participants and comparison between individuals with and without type 2 diabetes. (k) The regression between type 2 diabetes, fracture and BMD. (l) Assessment of the mediators (BMI) for the association between type 2 diabetes and fracture. (m) Baseline characteristics of participants with different Numbers of Risk Factors. (n) Detailed information on the field ID and codes for participants included in UK Biobank. Abbreviations: ICD-9, the International Classification of Diseases, 9th Revision; ICD-10, the International Classification of Diseases, 10th Revision. (o) The International Classification of Diseases (ICD) codes and self-reported codes for excluded diseases. (p) Detailed information on the field ID and codes for specific fracture sites included in UK Biobank. (q) Detailed information for instrumental variables of T2D and BMI on fracture and BMD.
- https://cdn.elifesciences.org/articles/89281/elife-89281-supp1-v1.docx
Download links
A two-part list of links to download the article, or parts of the article, in various formats.
Downloads (link to download the article as PDF)
Open citations (links to open the citations from this article in various online reference manager services)
Cite this article (links to download the citations from this article in formats compatible with various reference manager tools)
Deciphering the complex relationship between type 2 diabetes and fracture risk with both genetic and observational evidence
eLife 12:RP89281.
https://doi.org/10.7554/eLife.89281.3


