Deciphering molecular heterogeneity and dynamics of human hippocampal neural stem cells at different ages and injury states
- State Key Laboratory of Primate Biomedical Research, Institute of Primate Translational Medicine, Kunming University of Science and Technology, China
- Yunnan Key Laboratory of Primate Biomedical Research, China
- Department of Anatomy, National and Regional Engineering Laboratory of Tissue Engineering, State Key Laboratory of Trauma, Burn and Combined Injury, Key Lab for Biomechanics and Tissue Engineering of Chongqing, Third Military Medical University, China
- Zhong-Zhi- Yi-Gu Research Institute, China
Figures
Figure 1 with 1 supplement
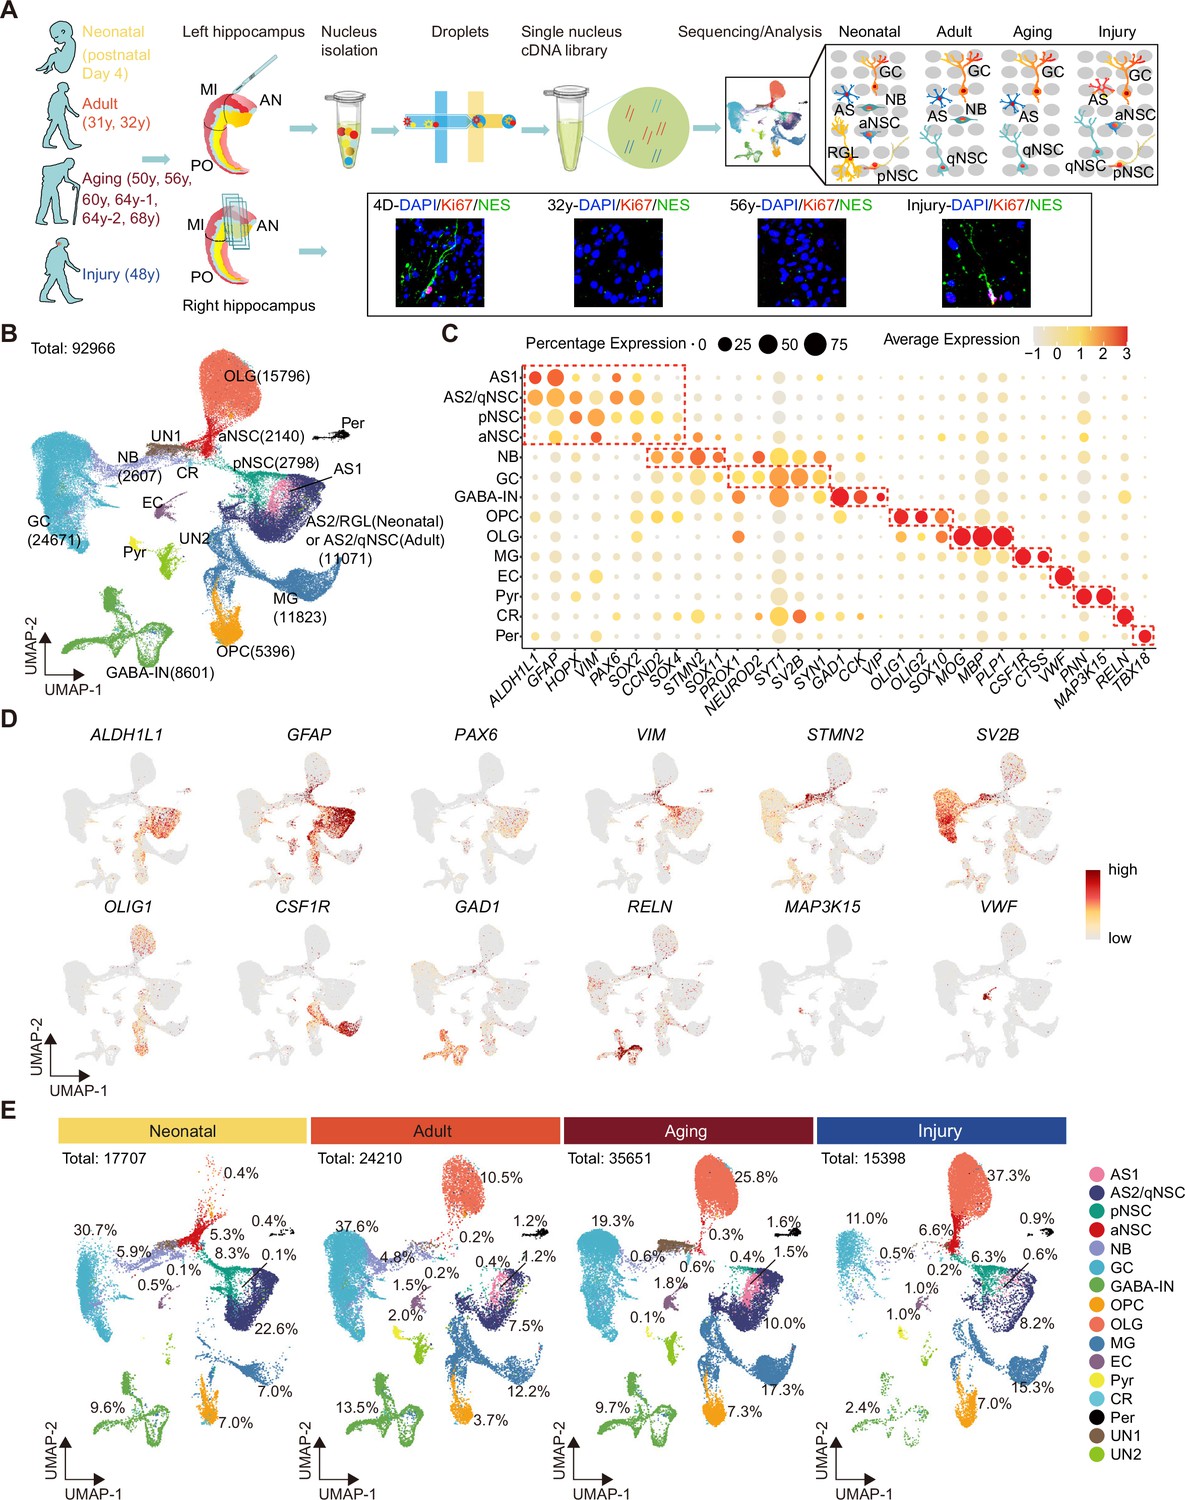
Single-nucleus transcriptomic atlas of the human hippocampus across different ages and after stroke injury.
(A) Summary of the experimental strategy. The pair of hippocampi from post-mortem human donors at different ages were collected. The anterior (AN) and middle (MI) parts containing dentate gyrus were used for single-nucleus RNA-seq (snRNA-seq) and immunostaining. (B) 92,966 hippocampal single nuclei were visualized by Uniform Manifold Approximation and Projection (UMAP) plot and categorized into 16 major populations: astrocyte1 (AS1, 1146 nuclei), astrocyte2/quiescent neural stem cell (AS2/qNSC, 11,071 nuclei), primed NSC (pNSC, 2798 nuclei), active NSC (aNSC, 2140 nuclei), neuroblast (NB, 2607 nuclei), granule cell (GC, 24,671 nuclei), interneuron (IN, 8601 nuclei), pyramidal neuron (PN, 676 nuclei), oligodendrocyte progenitor (OPC, 5396 nuclei), oligodendrocyte (OLG, 15,796 nuclei), microglia (MG, 11,823 nuclei), endothelial cell (EC, 1232 nuclei), pericyte (Per, 981 nuclei), Relin-expressing Cajal-Retzius cell (CR, 218 nuclei), and two unidentified populations (UN1 and UN2, 3810 nuclei). (C) Dot plots of representative genes specific for the indicated cell subtypes. The size of each dot represents the cell percentage of this population positive for the marker gene. The scale of the dot color represents the average expression level of the marker gene in this population. (D) UMAP feature plots showing expression distribution of cell type-specific genes in all cell populations. Astrocyte (ALDH1L1, GFAP), NSC (PAX6, VIM), neuroblast (STMN2), GC (SV2B), oligodendrocyte progenitor (OLIG1), microglia (CSF1R), interneuron (GAD1, RELN), Relin-expressing Cajal-Retzius cell (RELN), pyramidal neuron (MAP3K15), and endothelial cell (VWF) are shown. Dots, individual cells; gray, no expression; red, relative expression (log-normalized gene expression). (E) Quantification of each cell population in the hippocampus at three different age stages and after stroke-induced injury.
-
Figure 1—source data 1
Patient information and the expression of findmarker genes used to identify cell populations in Uniform Manifold Approximation and Projection (UMAP).Related to Figure 1.
- https://cdn.elifesciences.org/articles/89507/elife-89507-fig1-data1-v1.xlsx
Figure 1—figure supplement 1
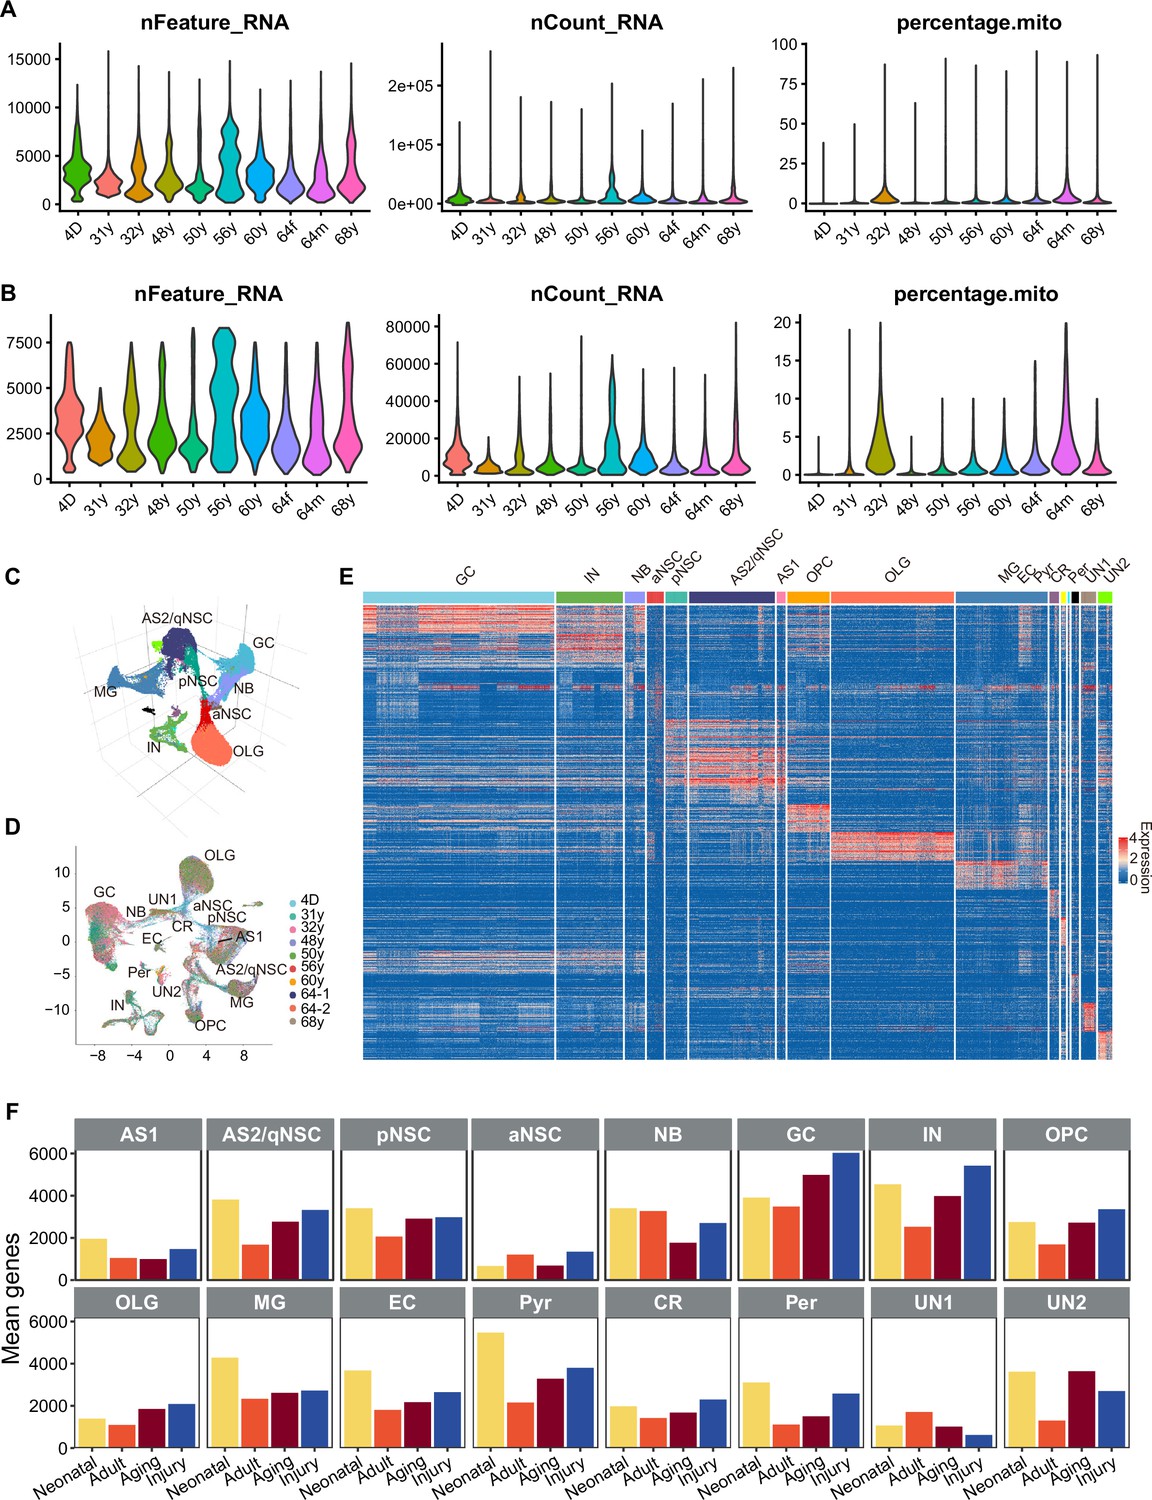
Cell atlas of human hippocampus across different ages and post stoke-induced injury.
(A) The raw sequencing data revealed that an average of more than 2000 genes per cell were detected, with mitochondrial genes comprising less than 5%.The detailed data for each sample can be found in Figure 1—source data 1.This indicates that the hippocampal tissue used for analysis exhibits good cellular viability and high RNA integrity. (B) Excluded cells with mRNA expression of less than 200 genes or more than 8600 genes (potential cell debris and doublets). Additionally, cells with over 20% of generated transcripts from mitochondrial genes were also removed. (C) Visualization of major cell types from human hippocampal single-nucleus RNA-seq (snRNA-seq) data by using 3D Uniform Manifold Approximation and Projection (UMAP). (D) Cell atlas of each human hippocampal sample. Different colors indicate different samples. (E) Heatmap of top 50 genes (p-value <0.05) specific for each major population after normalization. AS1, adult astrocyte; AS2/qNSC, astrocyte/quiescent neural stem cell; pNSC, primed neural stem cell; aNSC, active neural stem cell; NB, neuroblast; GC, granule cell; GABA-IN, GABAgeric-interneuron; Pyr, pyramidal neuron; OPC, oligodendrocyte progenitor cell; OLG, oligodendrocyte; MG, microglia; EC, endothelia cell; Per, pericyte; CR, Relin-expressing Cajal-Retzius cell; Unknown1 (UN1); Unknown2 (UN2). (F) The average number of genes detected in each cell type is similar across different groups.
Figure 2 with 1 supplement
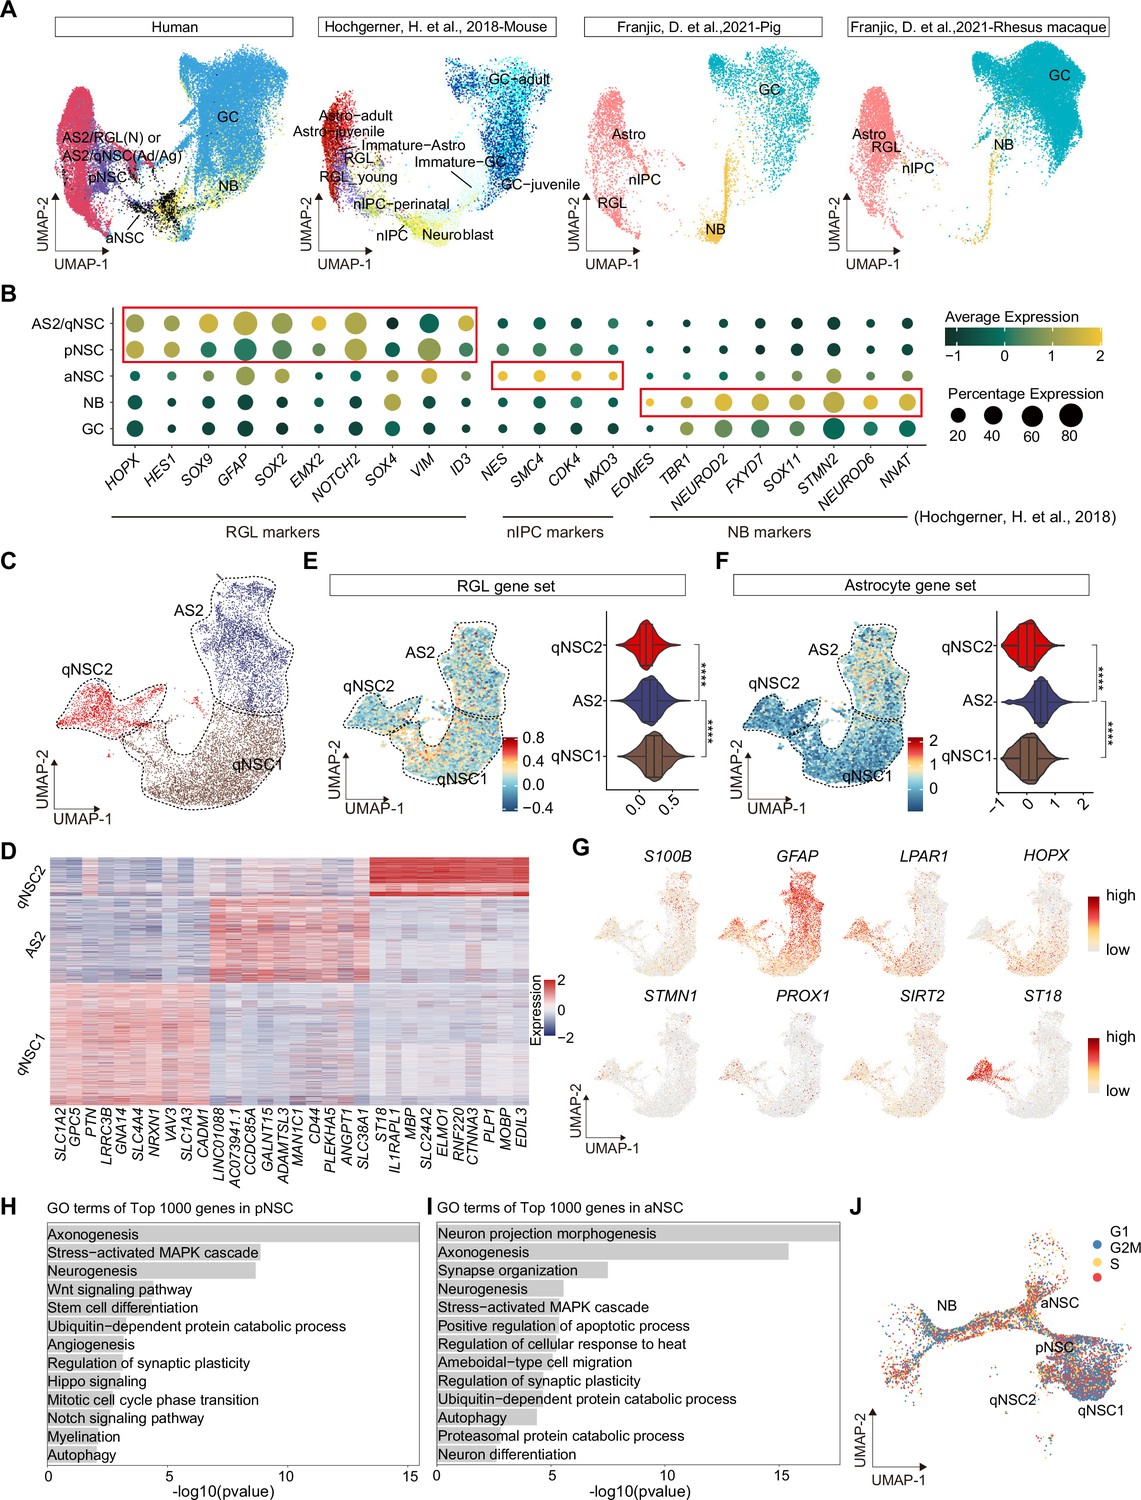
Confirmation of neurogenic lineage and dissecting of neural stem cell (NSC) molecular heterogeneity in the postnatal human hippocampus.
(A) Neurogenic lineage identification was confirmed by cross-species comparison of transcriptomic signatures. Our human data were integrated with published single-nucleus RNA-seq (snRNA-seq) data from mice, pigs, and rhesus macaque by Uniform Manifold Approximation and Projection (UMAP) (Hochgerner et al., 2018; Franjic et al., 2022). astrocyte2 (AS2), radial glia-like cell (RGL), neonatal (N), quiescent neural stem cell (qNSC), adult (Ad), aging (Ag), primed neural stem cell (pNSC), active neural stem cell (aNSC), neuroblast (NB), granule cell (GC), astrocytes (Astro), neuronal intermediate progenitor cell (nIPC). (B) Expressions of previously reported RGL, nIPC, NB, and immature GC markers in the corresponding populations from our human hippocampal single-nucleus RNA-seq (snRNA-seq) data. RGL, radial glia-like cell; nIPC, neural intermediate progenitor cell; NB, neuroblast; and immature GC, immature granule cell. (C) The AS2/qNSC population from neonatal sample was subclustered into three clusters, astrocyte2, qNSC1, and qNSC2. (D) Heatmap of top 10 genes (p-value <0.05) specific for astrocytes, qNSC1, and qNSC2 after normalization. (E and F) Using gene set scores (average, over genes in the set, of Seurat function AddModuleScore) based on previously defined gene sets (Zamanian et al., 2012; Liddelow et al., 2017; Clarke et al., 2018; Hochgerner et al., 2018; Zhong et al., 2020; Franjic et al., 2022) to characterize RGL (E) and astrocytes (F). Wilcoxon test, the asterisk indicates the p-value < 0.0001. (G) UMAP feature plots showing expression distribution of cell type-specific genes. Astrocyte markers (S100B and GFAP), RGL markers (HOPX and LPAR1), and neuron development markers (ST18, STMN1, PROX1, and SIRT2) are shown. (H and I) Representative gene ontology (GO) terms of the top 1000 genes specifically expressed in pNSCs (H) and aNSCs (I). (GO:BP, neural development related GO terms, p<0.05). (J) Cell cycle phases of qNSC1, qNSC2, pNSC, aNSC, and NB predicted by CellCycleScoring. Each dot represents an individual cell. Steel blue, red, and orange dots represent G1, S, and G2/M phase cells, respectively.
-
Figure 2—source data 1
The differential expression genes and related gene ontology (GO) terms of active neural stem cell (aNSC) compared with primed NSC (pNSC).
- https://cdn.elifesciences.org/articles/89507/elife-89507-fig2-data1-v1.xlsx
Figure 2—figure supplement 1

Distinguish quiescent neural stem cells (qNSCs) and astrocytes molecular heterogeneity in the postnatal human hippocampus.
(A) Using gene set scores (average, over genes in the set, of Seurat function AddModuleScore) based on previously defined gene sets (Zamanian et al., 2012; Liddelow et al., 2017; Clarke et al., 2018; Hochgerner et al., 2018; Zhong et al., 2020; Franjic et al., 2022) to distinguish qNSCs and astrocytes from astrocytes2 (AS2)/qNSC population in different groups concluding neonatal, adult, aging, and injury. Wilcoxon test, the asterisk indicates the p-value < 0.0001. (B) Quantification of the respective proportions of qNSCs and astrocytes by taking the sum of astroglia lineage (qNSC1, qNSC2, AS2, and AS1) across different groups. Neonatal (abbreviated as N, n=1), adult ( abbreviated as Ad, n=2), aging (abbreviated as Ag, n=6), injury (abbreviated as I, n=1). qNSC1, qNSC2, AS2, and AS1 (Adult-AS). (C) Transcriptional congruence observed between neurogenesis and gliogenesis populations is demonstrated by the matrix plot scores, which indicate the similarity between each pair of populations. (D) The differentially expressed genes of aNSC compared with pNSC. (E) The gene ontology (GO) analysis of differentially expressed genes of aNSC compared with pNSC (GO:BP, neural development related GO terms, p<0.05).
Figure 3 with 2 supplements
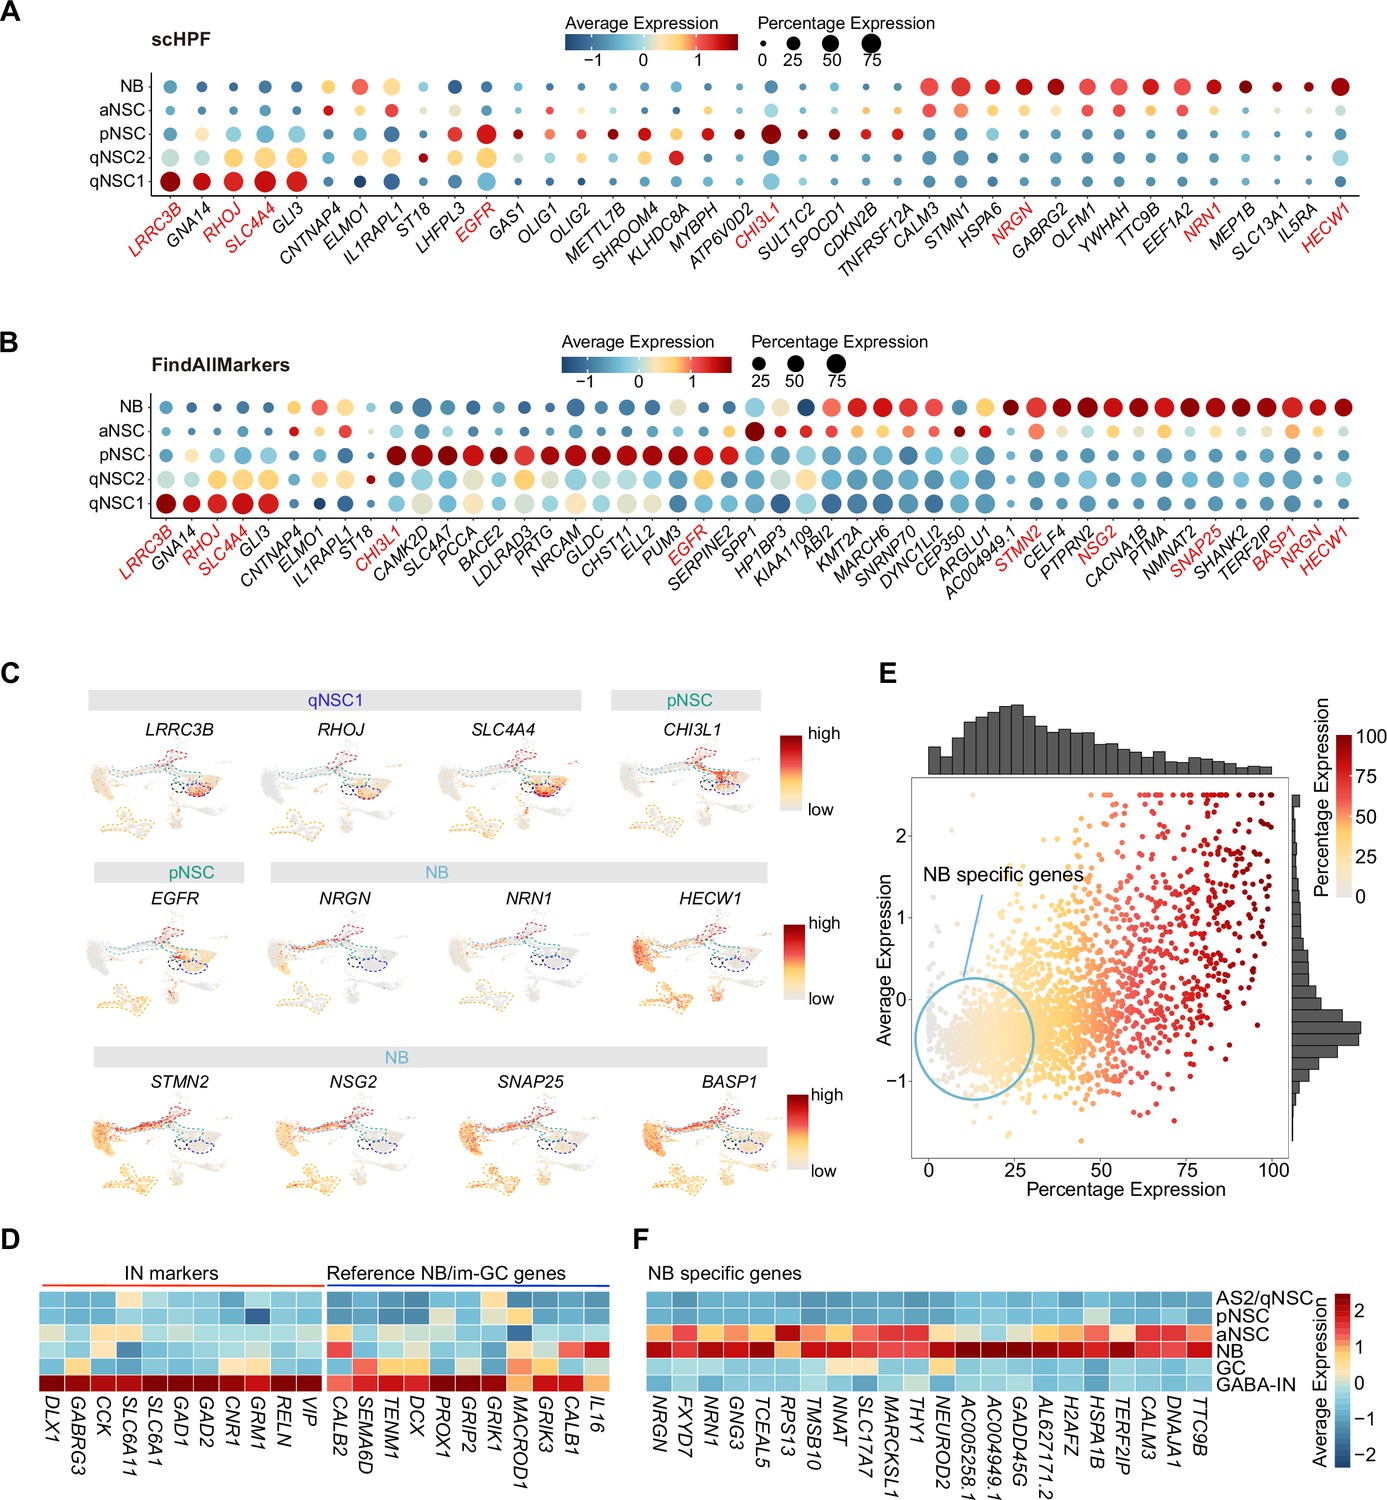
Discovery of novel markers distinguishing various types of neural stem cells (NSCs) and neuroblasts (NBs) in the human hippocampus.
(A and B) Representative top genes specific for qNSC1, qNSC2, pNSC, aNSC, and NB in the neonatal neurogenic lineage identified by single-cell hierarchical Poisson factorization (scHPF) (A) and FindAllMarkers function of Seurat (B). (C) Uniform Manifold Approximation and Projection (UMAP) visualization of several cell type-specific genes of the qNSCs, pNSC, and NB predicted by scHPF and FindAllMarkers. (D) Heatmap showing that neuroblast/immature GC highly expressed genes that are previously reported by other literature were widely expressed in human hippocampal interneurons. (E) Scatter plot showing that several NB genes predicted by scHPF and findmarker from our single-nucleus RNA-seq (snRNA-seq) data were also widely expressed in human hippocampal interneurons. The genes without/with low expression in the interneurons were selected as NB-specific markers (red circle scope). (F) NB-specific genes selected from our snRNA-seq data were not or very lowly expressed in astrocytes2 (AS2)/qNSCs, pNSC, GC, and interneurons.
-
Figure 3—source data 1
Potential marker genes identified by FindAllMarker and single-cell hierarchical Poisson factorization (scHPF).
- https://cdn.elifesciences.org/articles/89507/elife-89507-fig3-data1-v1.xlsx
Figure 3—figure supplement 1

Reported neuroblast genes were widely distributed in the adult human interneurons.
(A) Transcriptional congruence of granule cell lineage and interneuron population between our dataset and published mouse, macaque, and human transcriptome datasets. The matrix plot indicates the similarity scores of given human hippocampal cell populations from our dataset (rows) assigned to the corresponding literature-annotated cell types (columns). (B) Neuroblast genes reported by several literatures were widely distributed in the adult human interneurons from 10 individuals. (C) Our identified neuroblast-specific genes were absent in the adult human interneurons.
Figure 3—figure supplement 2
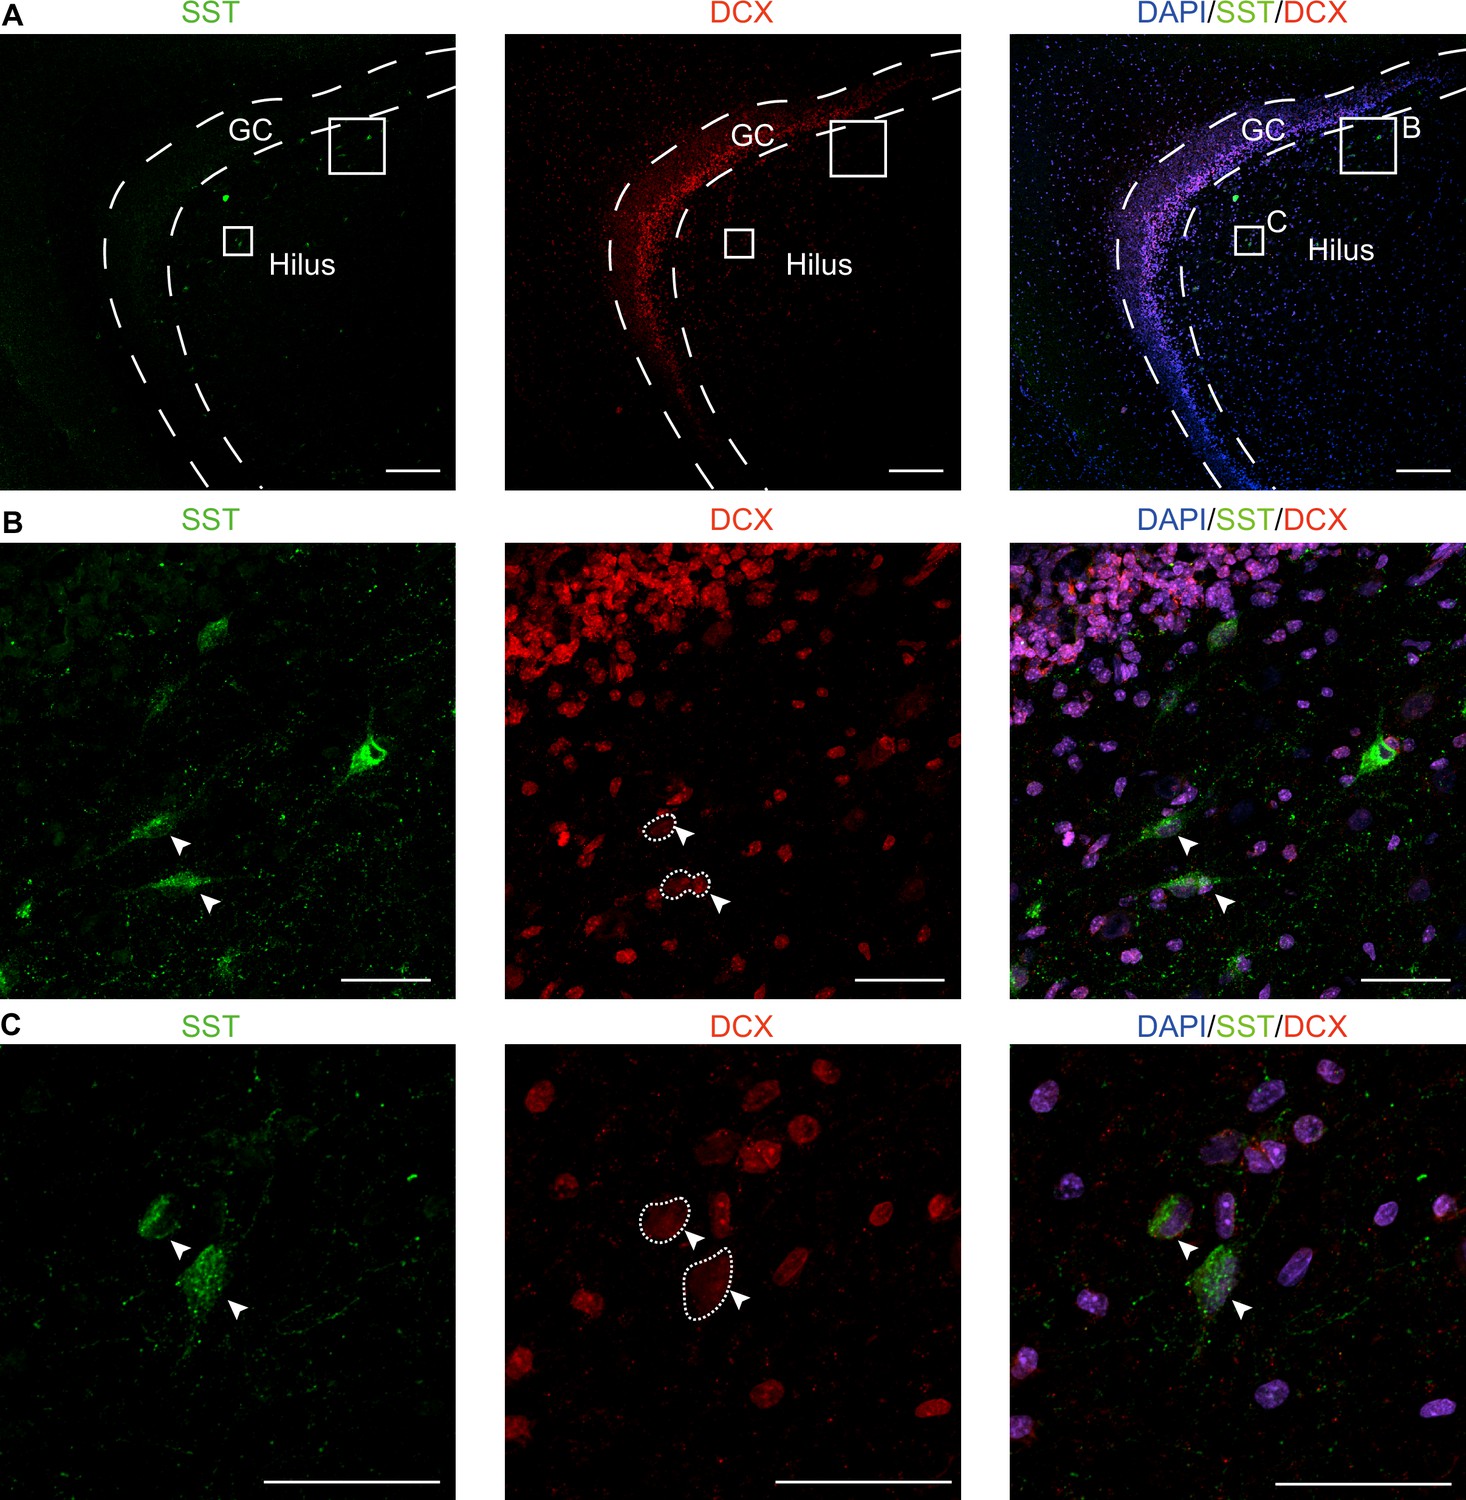
The neuroblast marker DCX was expressed in interneurons (SST+) in the hippocampus of 3-month-old macaques.
(A–C) Co-immunostainings of the neuroblast marker (DCX) and the interneuron marker (SST) on macaque hippocampal tissue were shown with different magnification views. Since we encountered a lack of DCX immunostaining signaling in our collected human hippocampal tissue, we opted to utilize the hippocampal tissue from 3-month-old macaques instead. In the images, some of the SST+ interneurons (green) with long apical processes were co-stained with DCX (red). Scale bars for panel A are 200 μm, while the magnified cell images in panels B and C are 50 μm. The arrowhead indicates the colocalization of DCX and SST.
Figure 4 with 2 supplements
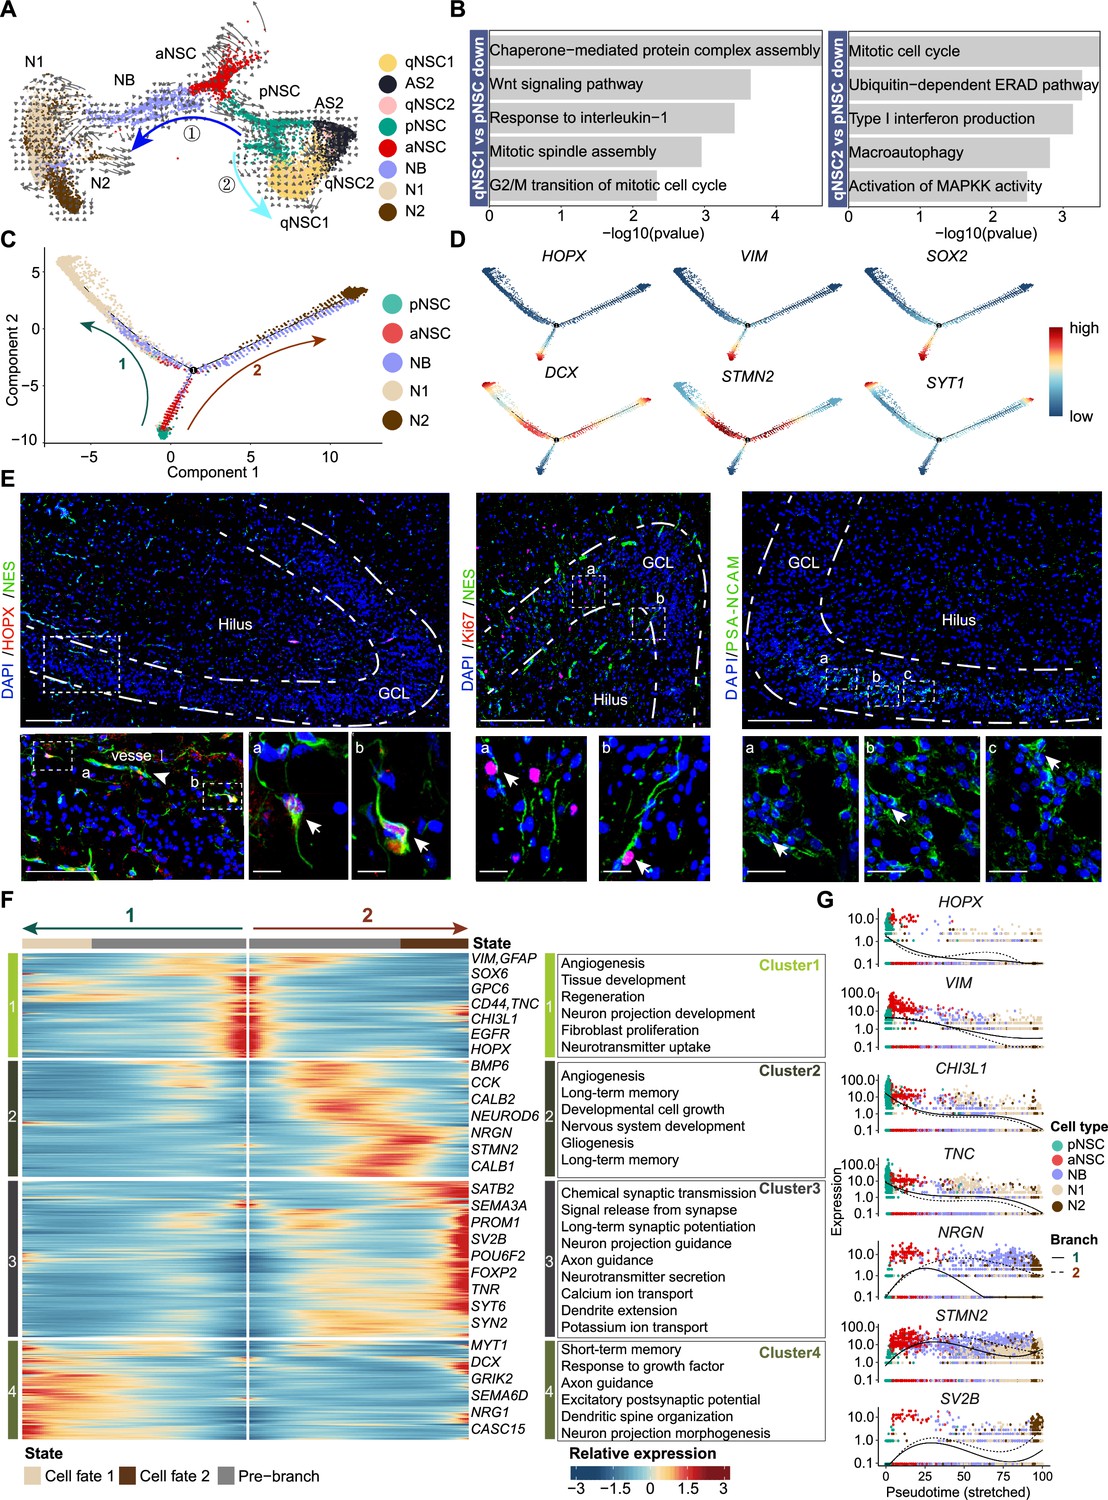
The transcriptional dynamics predicated by RNA velocity and pseudotime reconstruction revealed developmental potentials of neural stem cell (NSC) in the neonatal human hippocampus.
(A) RNA velocity analysis indicating the developmental trajectory of hippocampal neurogenic lineage at postnatal day 4. Cell types are labeled. (B) Representative gene ontology (GO) terms of the differentially expressed genes compare qNSC1, qNSC2 with primed NSC (pNSC). (C) Pseudotime reconstruction of the neurogenic lineages in the neonatal human hippocampus. Dots showing individual cells. Different color represents different cell types. The arrows indicate the directions of differentiation trajectories. pNSCs as the development root was successively followed by active NSCs (aNSCs) and neuroblasts, and then separated into two branches (1 and 2), generating two types of neuronal cells N1 and N2, respectively. (D) Expression dynamics of cell type-specific genes along with the pseudotime. Each dot represents an individual cell. NSC genes (HOPX, VIM, and SOX2), granule neuroblast genes (DCX and STMN2), and mature granule cell gene (SYT1) are shown. (E) Immunostainings of radial glia (NSC) markers (HOPX and NES), aNSC markers (NES and Ki67), and neuroblast marker (PSA-NCAM). The HOPX+NES+ RGLs and NES+Ki67+ active NSCs with long apical processes were detected in postnatal day 4 hippocampal dentate gyrus (arrows). The PSA-NCAM+ neuroblasts (green) were located across the granule cell layer (GCL). Scale bars of HOPX/NES immunostaining are 200 μm; the magnified and further magnified cell images are 100 μm and 10 μm, respectively; the arrowhead indicates the vessel. Scale bars of KI67/NES immunostaining are 100 μm and 10 μm, respectively. Scale bars of PSA-NCAM immunostaining are 100 μm and 10 μm, respectively; arrows indicate the neuroblasts. (F) Heatmap showing that differentially expressed genes along the pseudotime were divided into four clusters. Representative genes and enriched gene ontology (GO) terms of each cluster are shown (GO:BP, neural development related GO terms, p<0.05). (G) Representative NSC genes (HOPX, VIM, CHI3L1, and TNC) and neuronal genes (NRGN, STMN2, and SV2B) were ordered by Monocle analysis along with the pseudotime. Cell types along with the developmental trajectory were labeled by different colors.
-
Figure 4—source data 1
Genes and enriched gene ontology (GO) terms of Figure 4B and F.
- https://cdn.elifesciences.org/articles/89507/elife-89507-fig4-data1-v1.xlsx
Figure 4—figure supplement 1
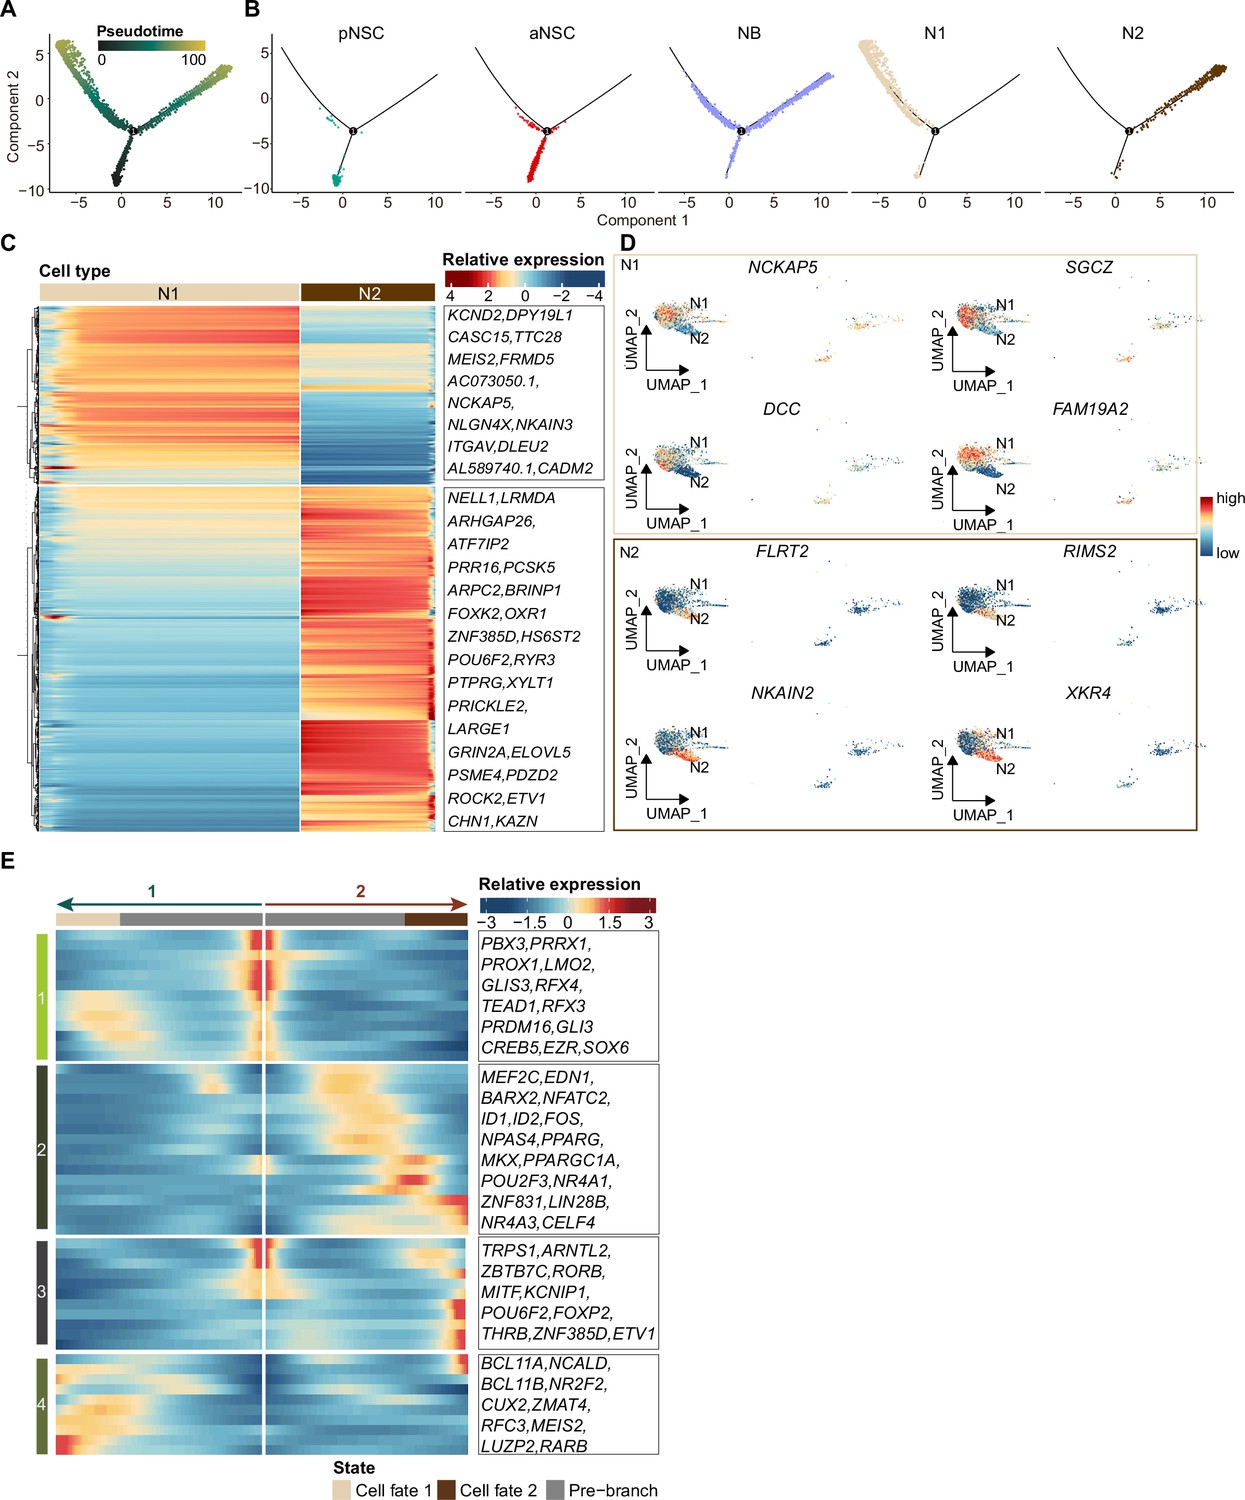
Pseudotime reconstruction of the neurogenic lineage development in the neonatal day 4 human hippocampus.
(A) Cells during neurogenic lineage development were ordered by Monocle analysis along pseudotime. (B) Cell types located at developmental trajectory were labeled by different colors. (C and D) Heatmap (C) and Uniform Manifold Approximation and Projection (UMAP) (D) visualization of distinct differentially expressed genes between N1 and N2. (E) Heatmap showing expression dynamics of transcription factors (TFs) along the neurogenesis trajectory. The representative TFs in each cluster were shown on the right.
Figure 4—figure supplement 2
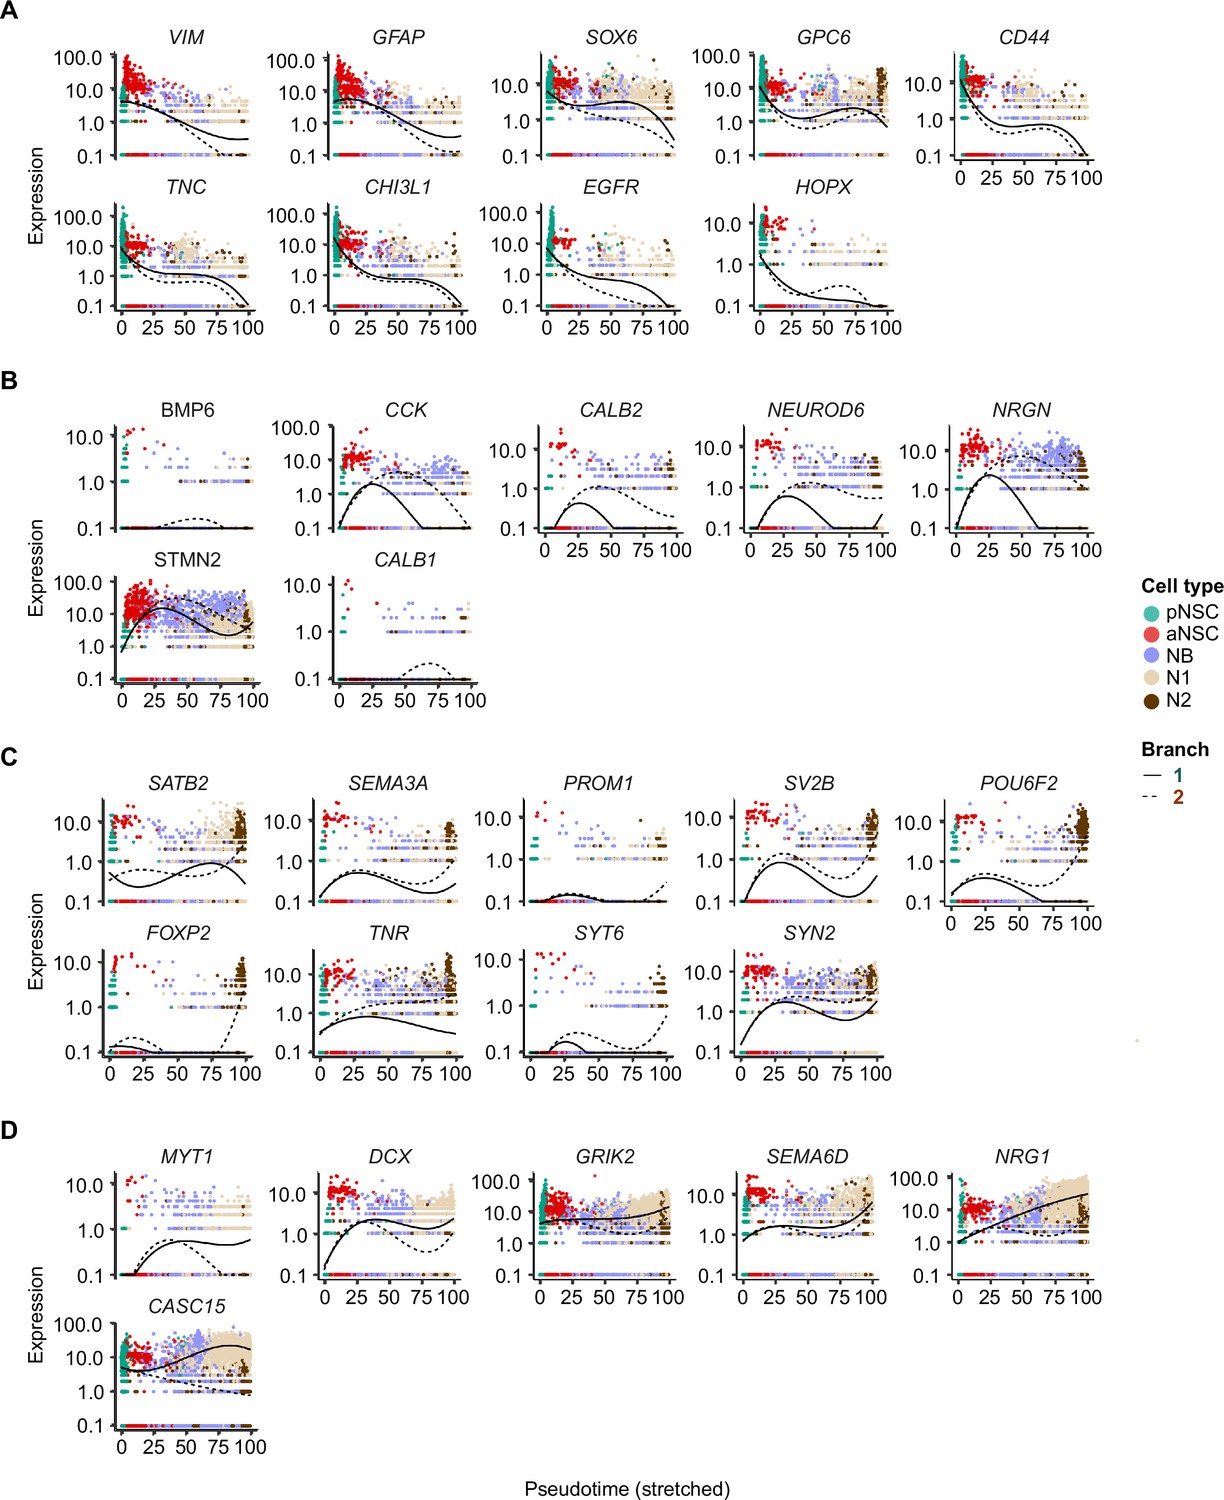
Differentially expressed genes along the pseudotime of neurogenic lineage in the neonatal human hippocampus.
Representative neural stem cell (NSC) genes and neuronal genes were ordered by Monocle analysis along with the pseudotime. Cell types along with the developmental trajectory were labeled by different colors. (A) Representative genes in cluster 1. (B) Representative genes in cluster 2. (C) Representative genes in cluster 3. (D) Representative genes in cluster 4. Related to Figure 4F.
Figure 5 with 2 supplements
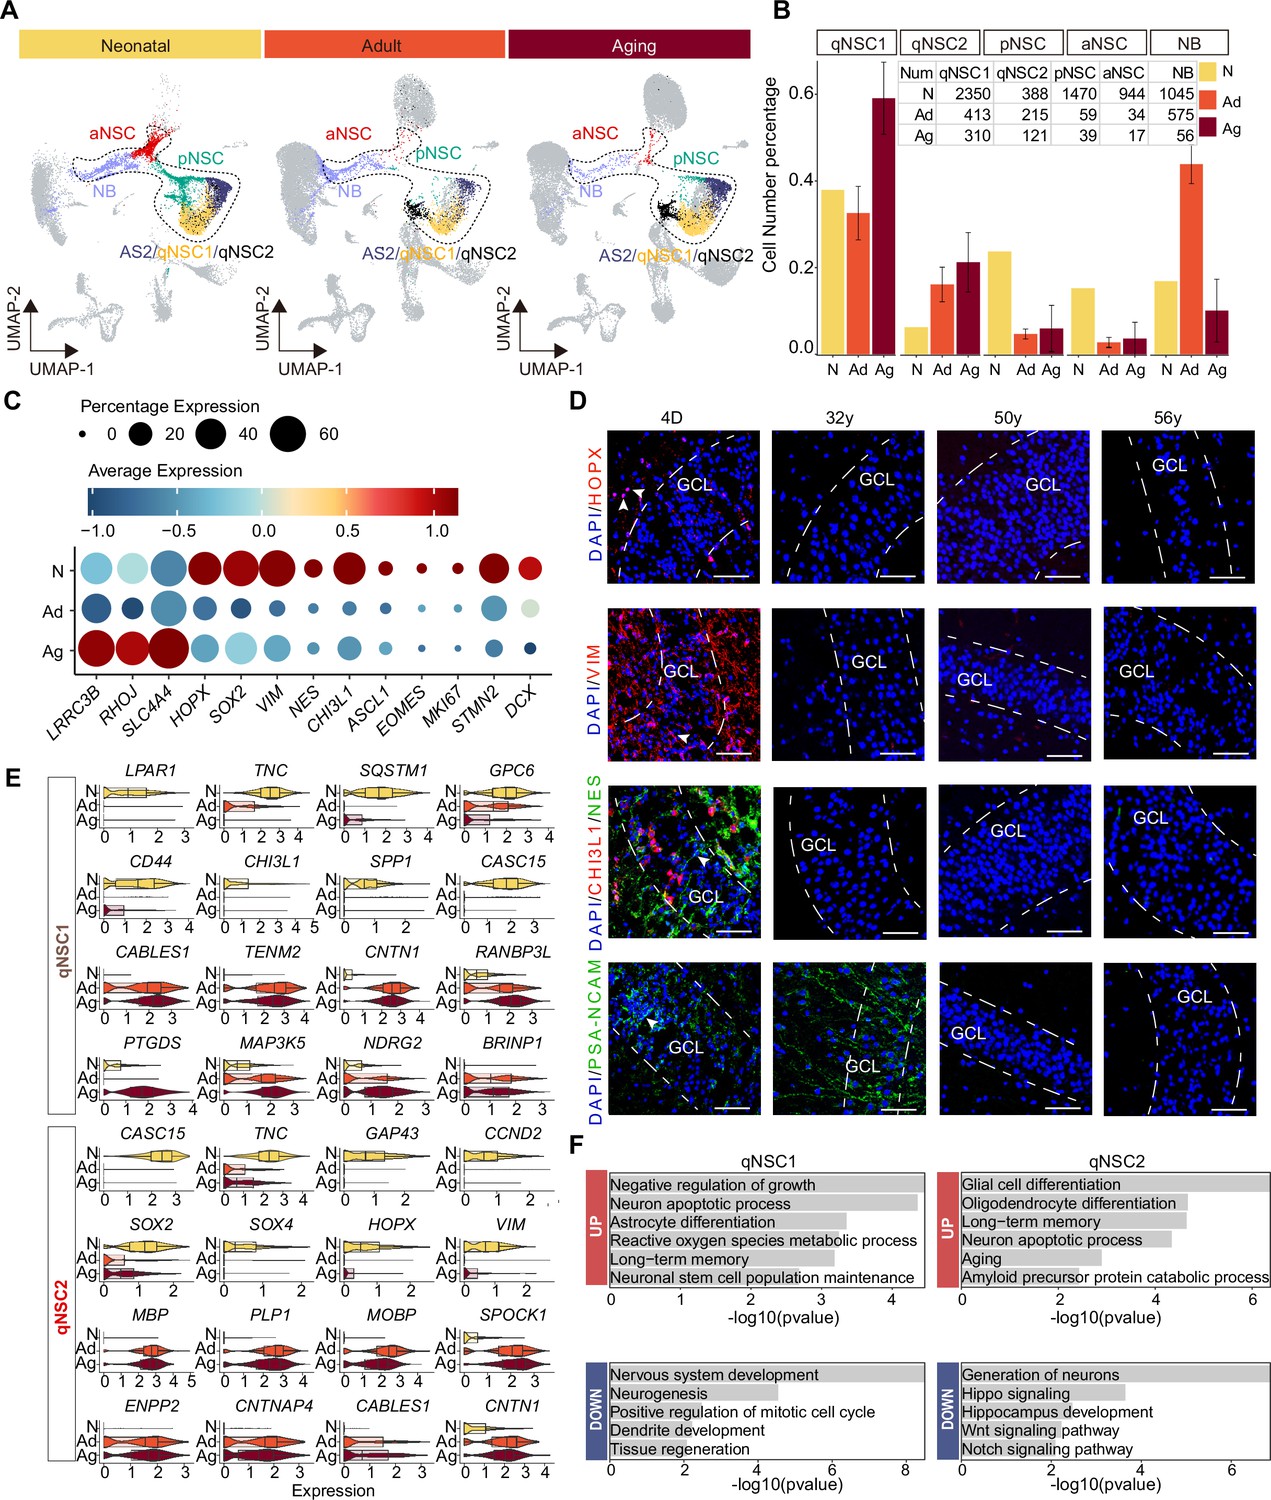
Age-dependent molecular alterations of the hippocampal neural stem cells (NSCs) and neuroblasts (NBs).
(A and B) Feature plots (A) and quantification (B) of the neurogenic populations during aging. Neonatal (abbreviated as N), adult ( abbreviated as Ad), aging ( abbreviated as Ag). The neurogenic populations include qNSC1, qNSC2, pNSC, aNSC, and neuroblast. (C) The dynamic expression of some representative genes, including newly identified qNSCs genes (LRRC3B, RHOJ, and SLC4A4), NSC genes (HOPX, SOX2, VIM, NES, and CHI3L1), neural progenitor or proliferation genes (ASCL1, EOMES, and MKI67), and immature granule cell genes (STMN2 and DCX), in human hippocampus across neonatal (postnatal day4), adult (31y, 32y), and aging (50y, 56y, 60y, 64y-1, 64y-2, 68y). (D) Immunostaining of classical NSC markers (HOPX, VIM, and NES) in human hippocampal dentate gyrus across different ages (postnatal day 4, 32y, 50y, 56y). Scale bars, 60 μm. The arrowheads indicate positive cells with typical morphology. (E) Violin plot showing differentially expressed genes of qNSC1 and qNSC2 in the aging group compared to the neonatal group. (F) Representative gene ontology (GO) terms of significantly (p-value <0.05) up- and down-regulated genes in qNSC1 and qNSC2 during aging.
-
Figure 5—source data 1
Genes and enriched gene ontology (GO) terms of qNSC1, qNSC2, primed neural stem cell (pNSC), active NSC (aNSC), and neuroblast (NB) populations during aging.
- https://cdn.elifesciences.org/articles/89507/elife-89507-fig5-data1-v1.xlsx
Figure 5—figure supplement 1
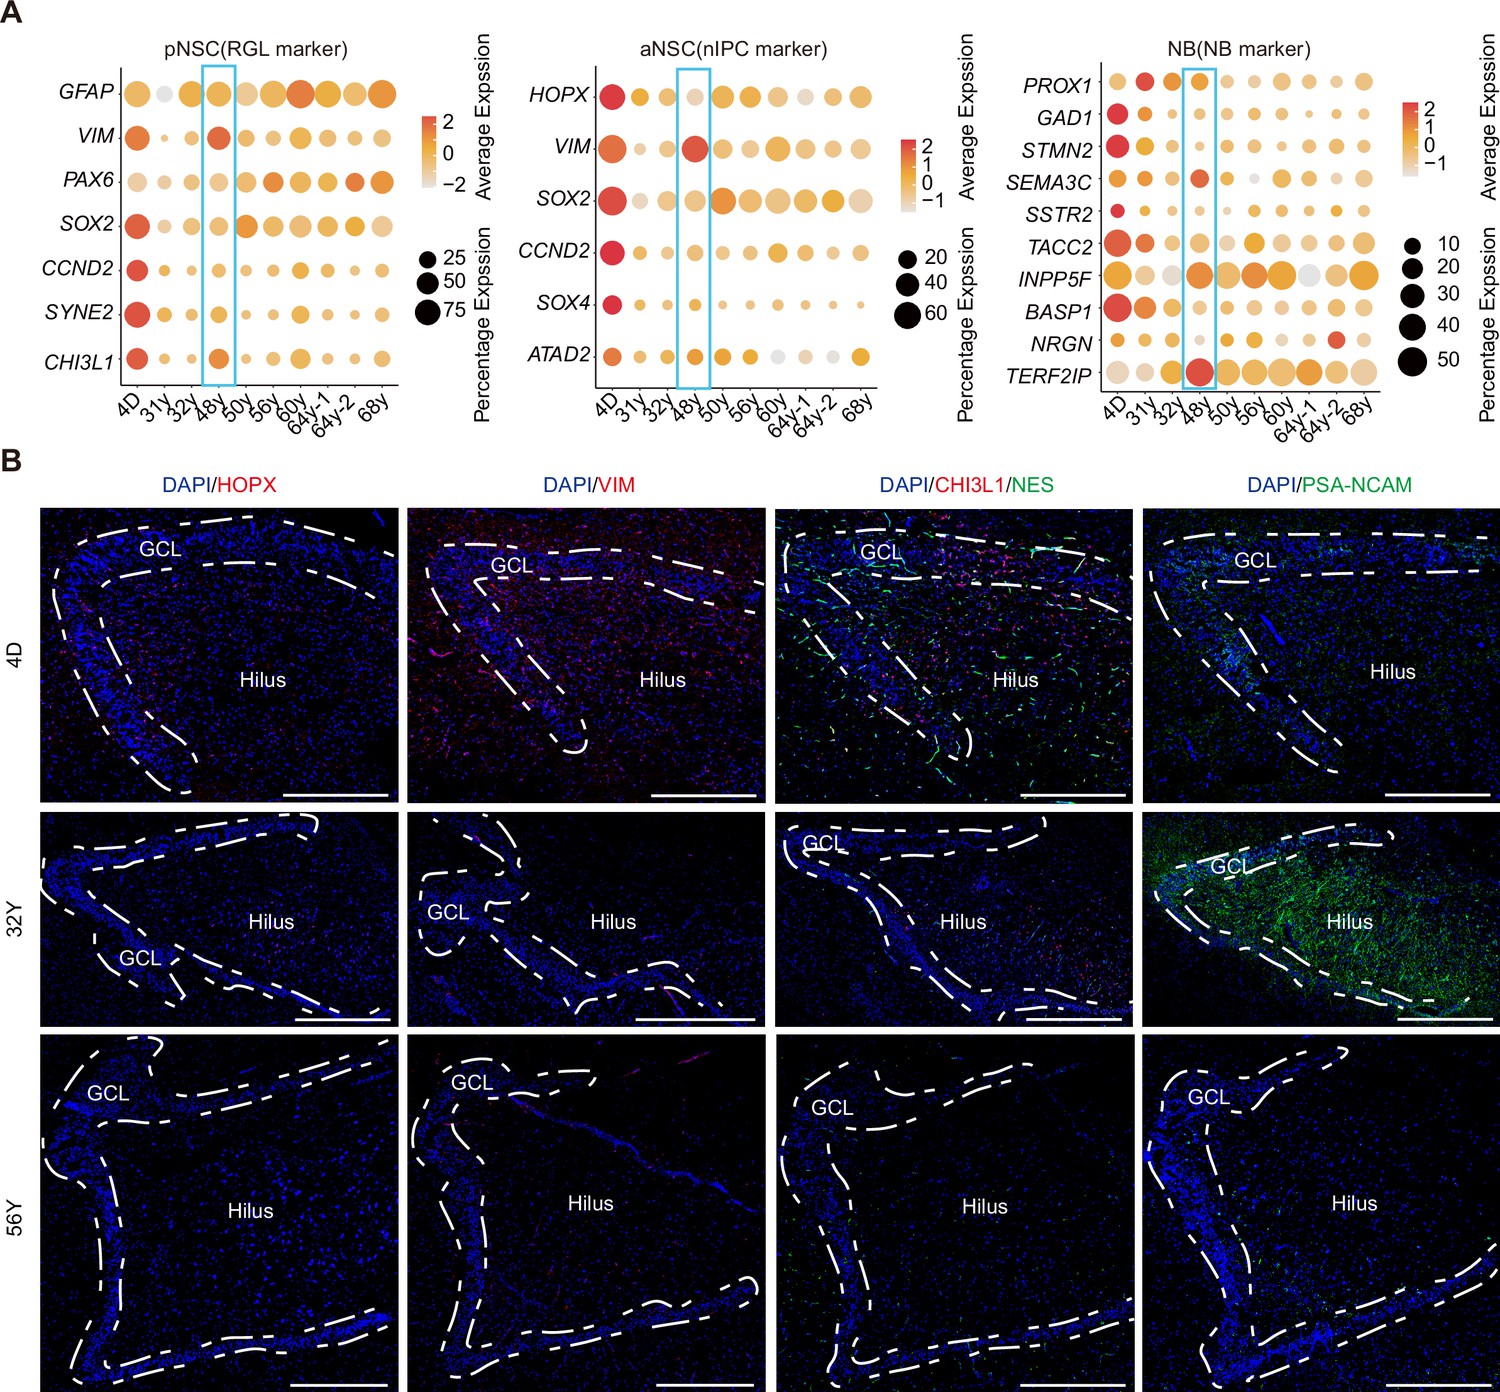
Alterations of the neurogenic lineage in human hippocampus during aging.
(A) Bubble plots showing our identified primed neural stem cells (pNSCs), active NSCs (aNSCs), and neuroblasts (NBs) from 10 individuals still express NSC and NB marker genes during aging despite their rare number. 48y donor was a stroke sample. (B) Immunostainings of classical NSC markers (HOPX, VIM, and NES), pNSC gene CHI3L1 identified by us, and neuroblast marker PSA-NCAM in human hippocampal dentate gyrus across different ages (postnatal day 4, 32y, and 56y). Scale bars: 4D – 500 μm, 32y – 800 μm, 56y – 600 μm.
Figure 5—figure supplement 2
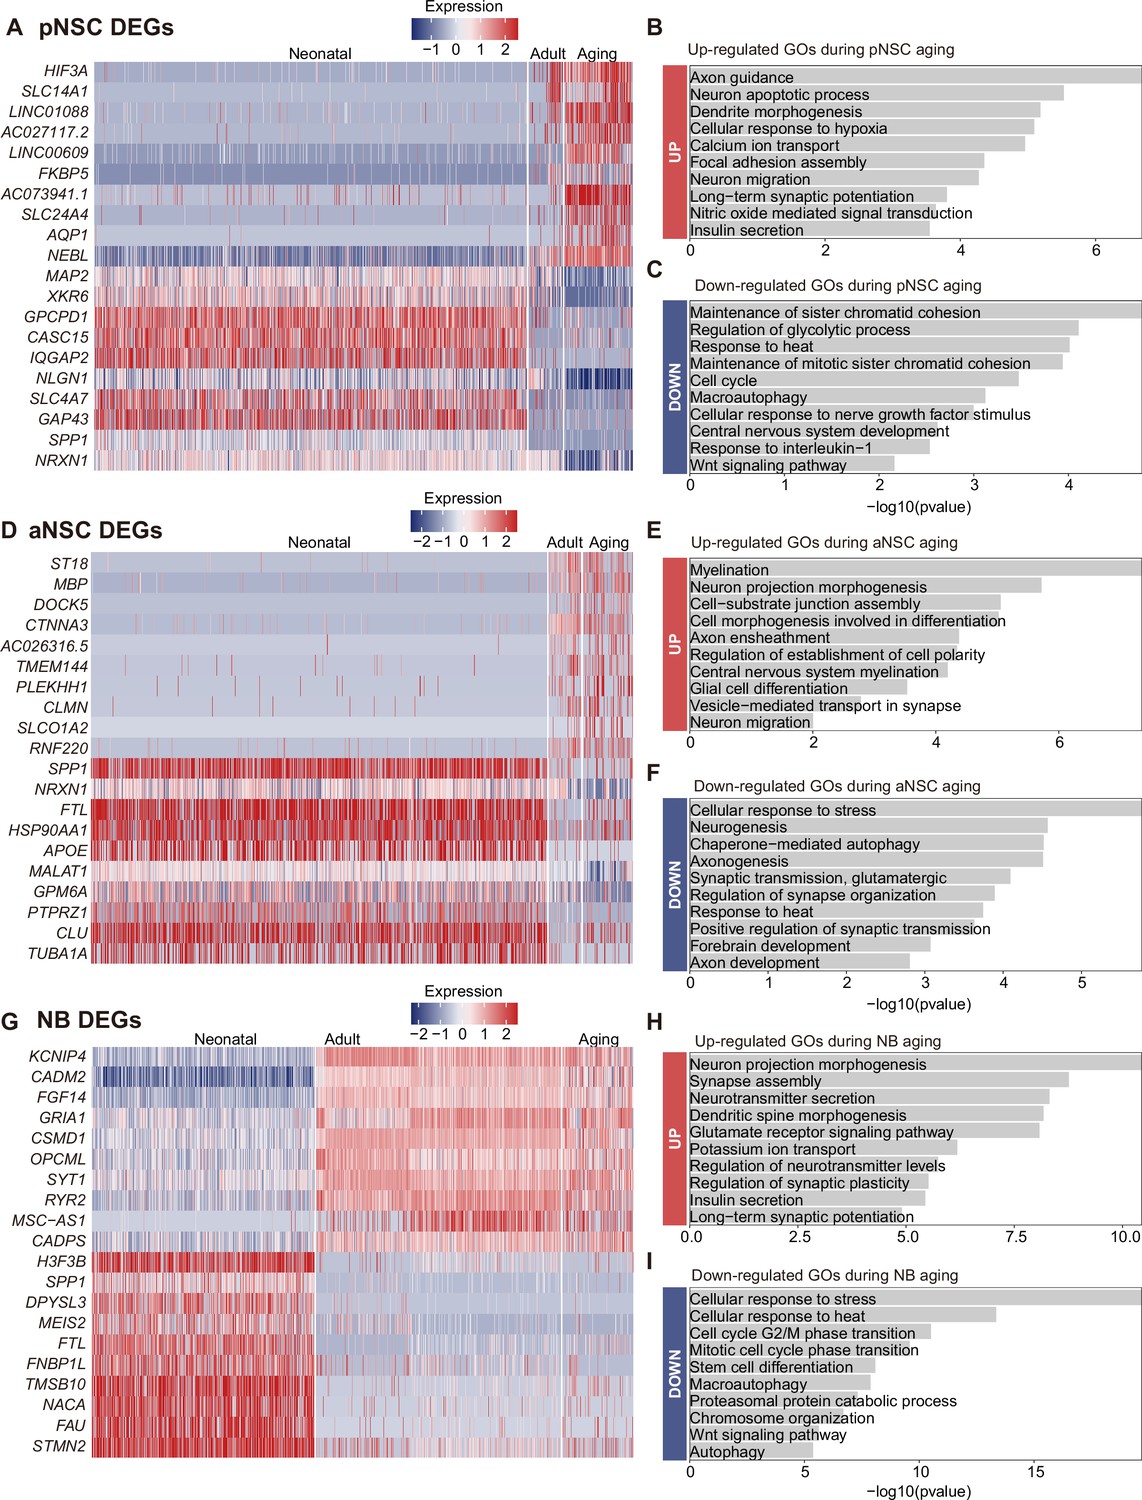
Differentially expressed genes (DEGs) and enrichment functions in primed neural stem cell (pNSC), active NSC (aNSC), and neuroblast (NB) along aging, respectively.
(A) Heatmap showing DEGs across neonatal, adult, aged pNSC (p-value <0.05). (B and C) Representative gene ontology (GO) terms of significantly up-regulated (B) and down-regulated (C) genes during pNSC aging (GO:BP, selected neural development related GO terms from top 200, p-value <0.05). (D) Heatmap showing DEGs across neonatal, adult, aged aNSC (p-value <0.05). (E and F) Representative GO terms of significantly up-regulated (E) and down-regulated (F) genes during aNSC aging (GO:BP, neural development related GO terms, p-value <0.05). (G) Heatmap showing DEGs across neonatal, adult, aged NB (p-value <0.05). (H and I) Representative GO terms of significantly up-regulated (H) and down-regulated (I) genes during NB aging (GO:BP, neural development related GO terms, p-value <0.05).
Figure 6 with 3 supplements
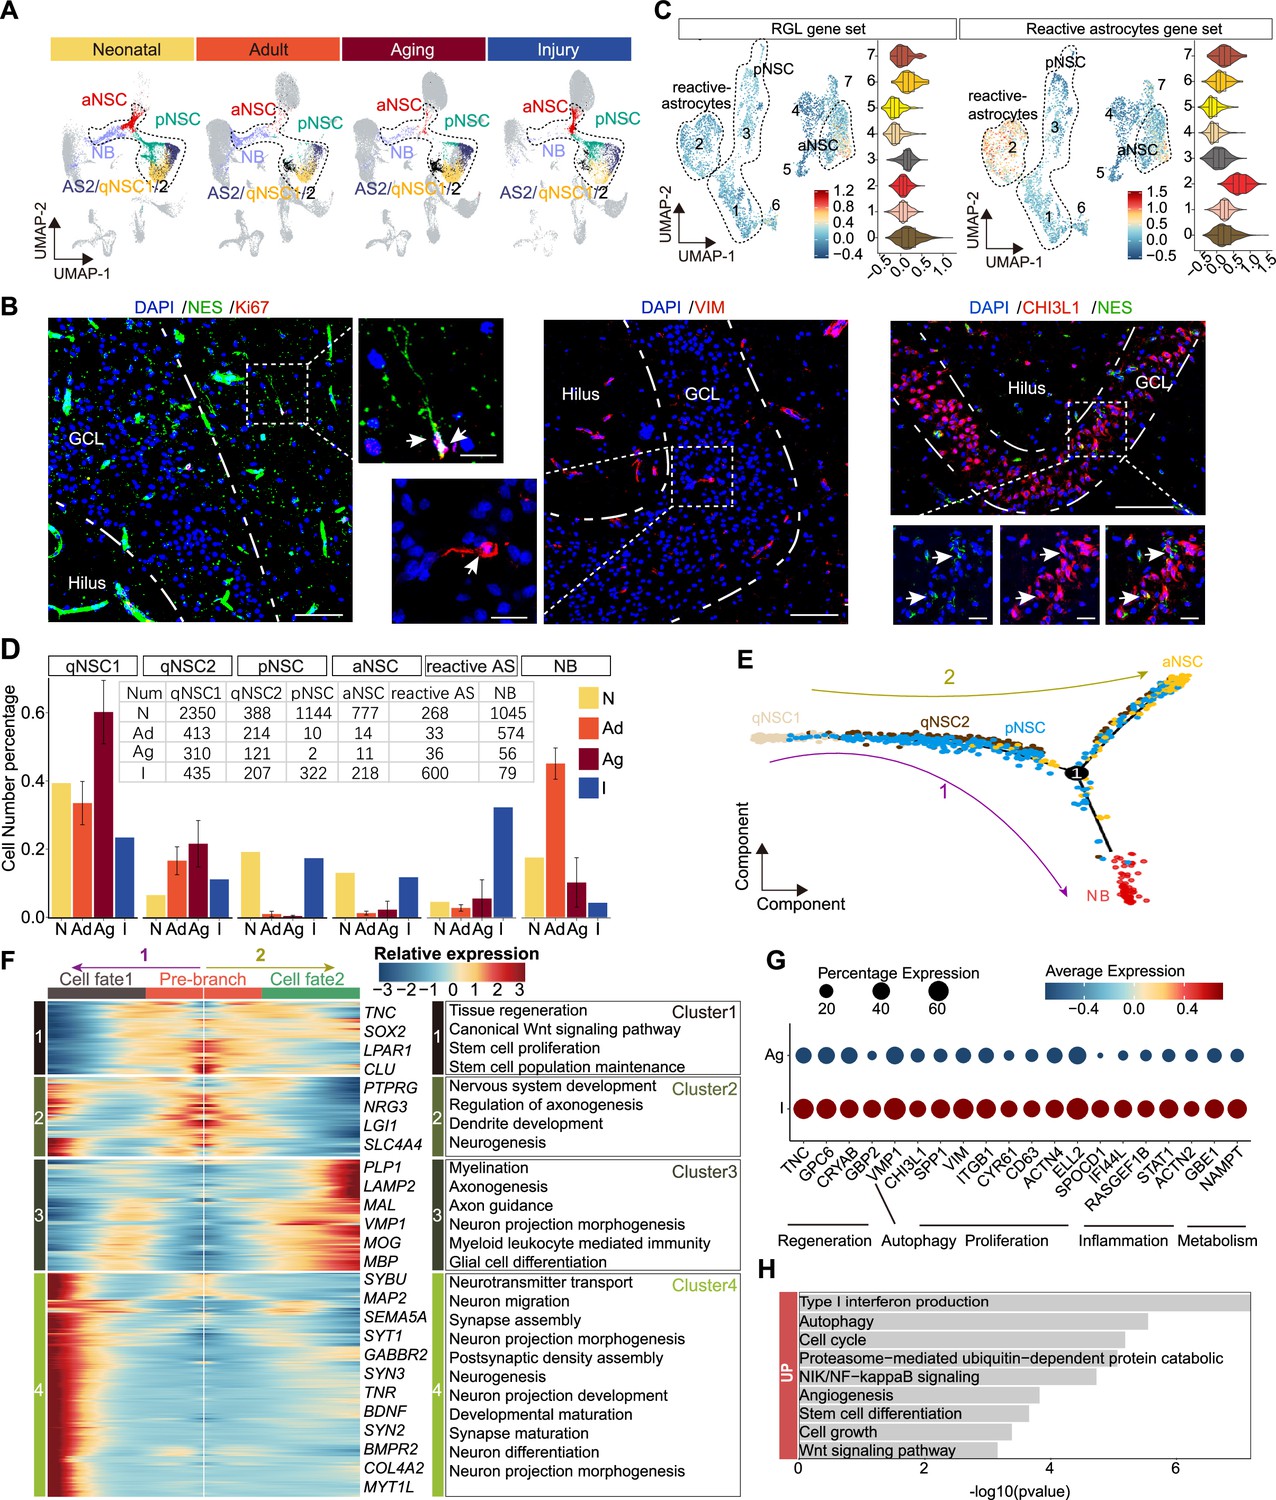
The transcriptomic signatures of the activated neurogenic lineage in the adult human injured hippocampus induced by stroke.
(A) The neurogenic lineage included qNSC1, qNSC2, reactivated primed/active neural stem cell (pNSC/aNSC) and neuroblast (NB). Cell distribution showing by feature plots. (B) Immunofluorescence images of NES (green)/Ki67 (red), VIM (red), and CHI3L1 (red)/NES (green) showing a few active NSCs in the 48-year-old injured hippocampal dentate gyrus. The arrows indicate radial morphology NES+/KI67+, VIM+, or CHI3L1+/NES+ active NSCs, respectively. Scale bars, 100 μm; the magnification, 20 μm. (C) Annotated into pNSC, aNSC, and reactive astrocytes according to gene set scores (average, over genes in the set, of Seurat function AddModuleScore). (D) Quantification of qNSC1, qNSC2, pNSCs, aNSCs, reactive astrocytes, and NB in neonatal (abbreviated as N, n=1), adult ( abbreviated as Ad, n=2), aging ( abbreviated as Ag, n=6), and stroke-injured ( abbreviated as I, n=1) hippocampus, respectively. (E) Pseudotime reconstruction of the neurogenic lineage in the stroke-injured human hippocampus. Different colors represent different cell types. The arrow indicates the developmental direction. (F) Heatmap showing the expression profiles of differentially expressed genes (DEGs) in four clusters along the pseudotime. Representative DEGs and enriched GO terms of each cluster are shown (GO:BP, regeneration related GO terms, p<0.05). (G) The significantly up-regulated genes in neurogenic lineage upon injury compared with aging. (H) The GO term analysis of up-regulated genes in the neurogenic lineage upon injury compared with aging (GO:BP, proliferation and regeneration related GO terms, p<0.05).
-
Figure 6—source data 1
Genes and enriched gene ontology (GO) terms of Figure 6F and H and Figure 6.
- https://cdn.elifesciences.org/articles/89507/elife-89507-fig6-data1-v1.xlsx
Figure 6—figure supplement 1
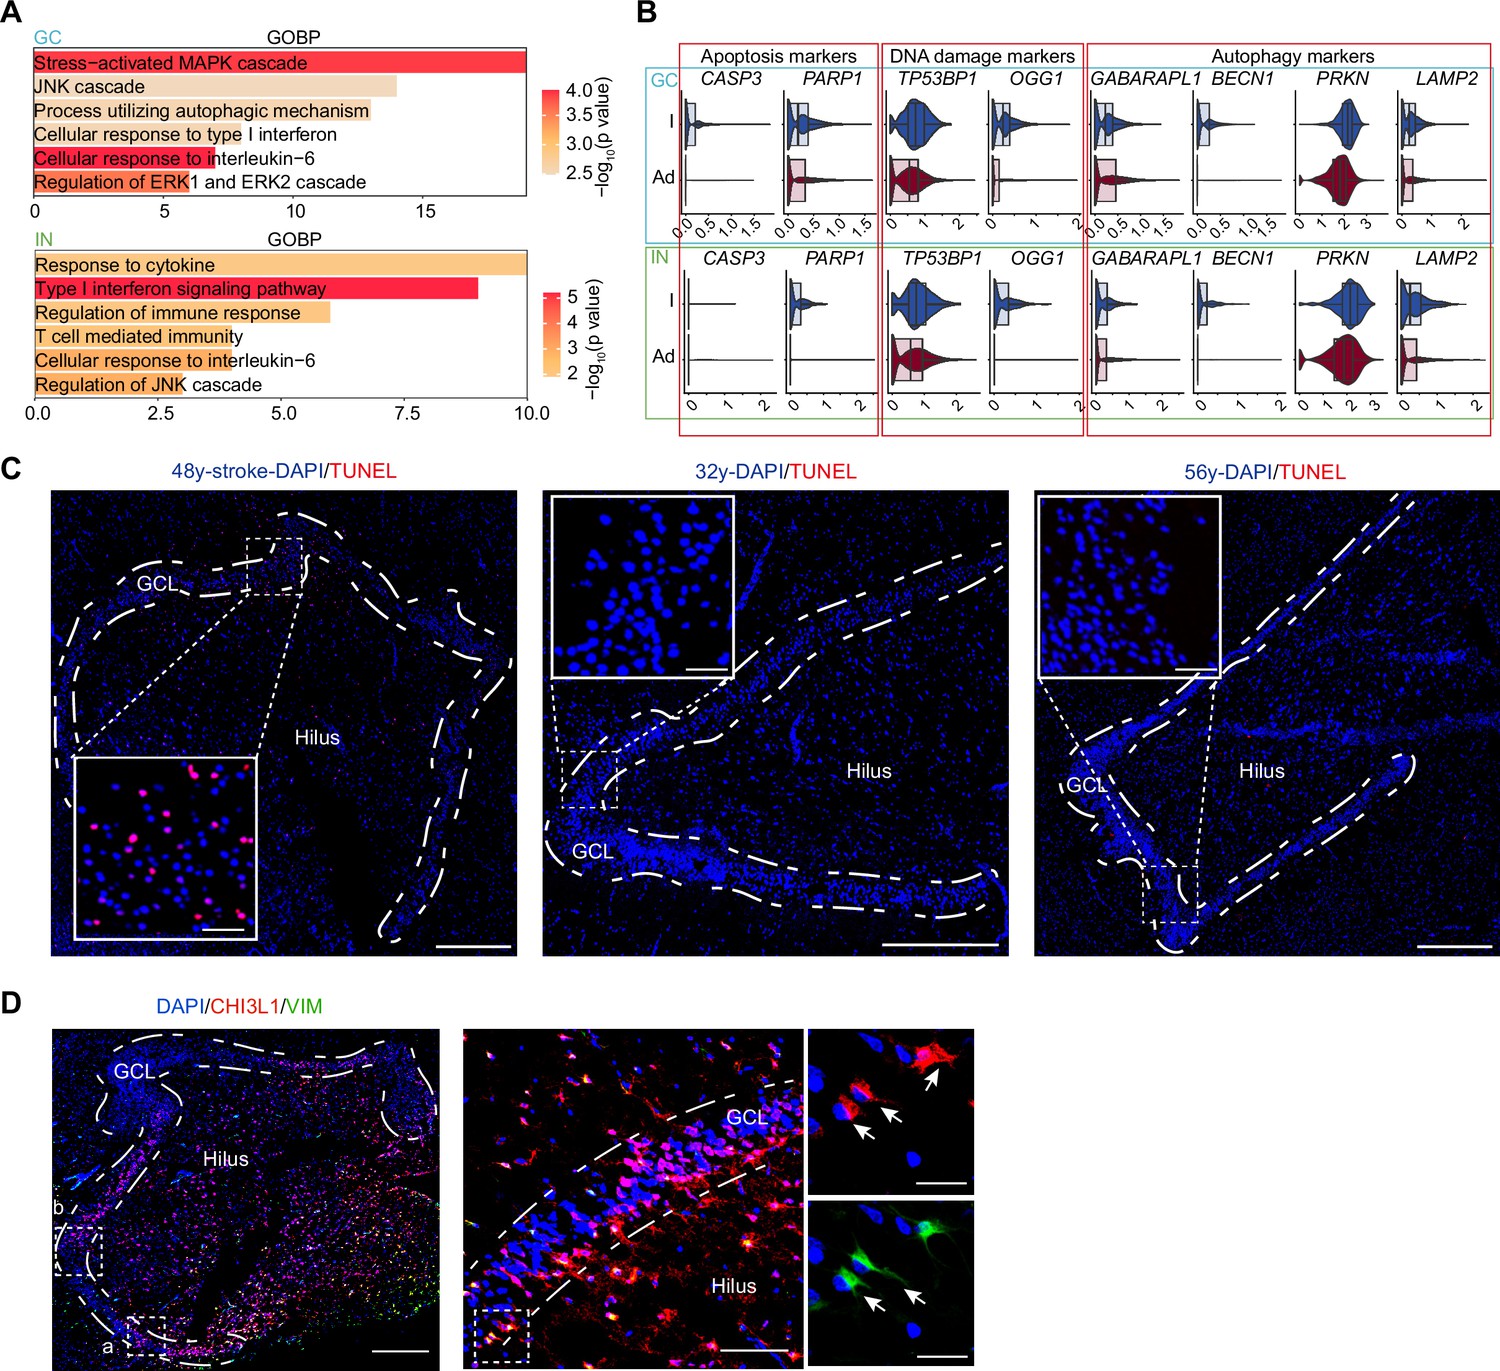
Stroke injury induced hippocampal cell apoptosis, astrocyte reactivation, and neuronal damages.
(A) Representative gene ontology (GO) terms of up-regulated genes in stroke-injured hippocampal granule cells (GCs) and interneurons (INs), compared with the normal aged hippocampus (GO:BP, selected stress and immune response related GO terms from top 200, p-value <0.05). (B) Genes relative to apoptosis, DNA damage, and autophagy were significantly up-regulated in the stroke-injured hippocampus, compared with the normal aged hippocampus. I, injury; Ag, aging. (C) Terminal deoxynucleotidyl transferase dUTP nick end labeling (TUNEL) assay showing obvious cell apoptosis in the 48y dentate gyrus, but not in other adult samples, which confirmed the stroke caused hippocampal injury. Scale bars, 500 μm. (D) CHI3L1 and VIM co-immunostaining showing some CHI3L1+VIM+ and CHI3L1+VIM-cells exhibited morphologies of reactive astrocyte (arrowhead) and neuron (arrow) in the granule cell layer (GCL) and hilus, respectively. Scale bars, 500 μm; the magnified images, 100 μm and 20 μm.
Figure 6—figure supplement 2
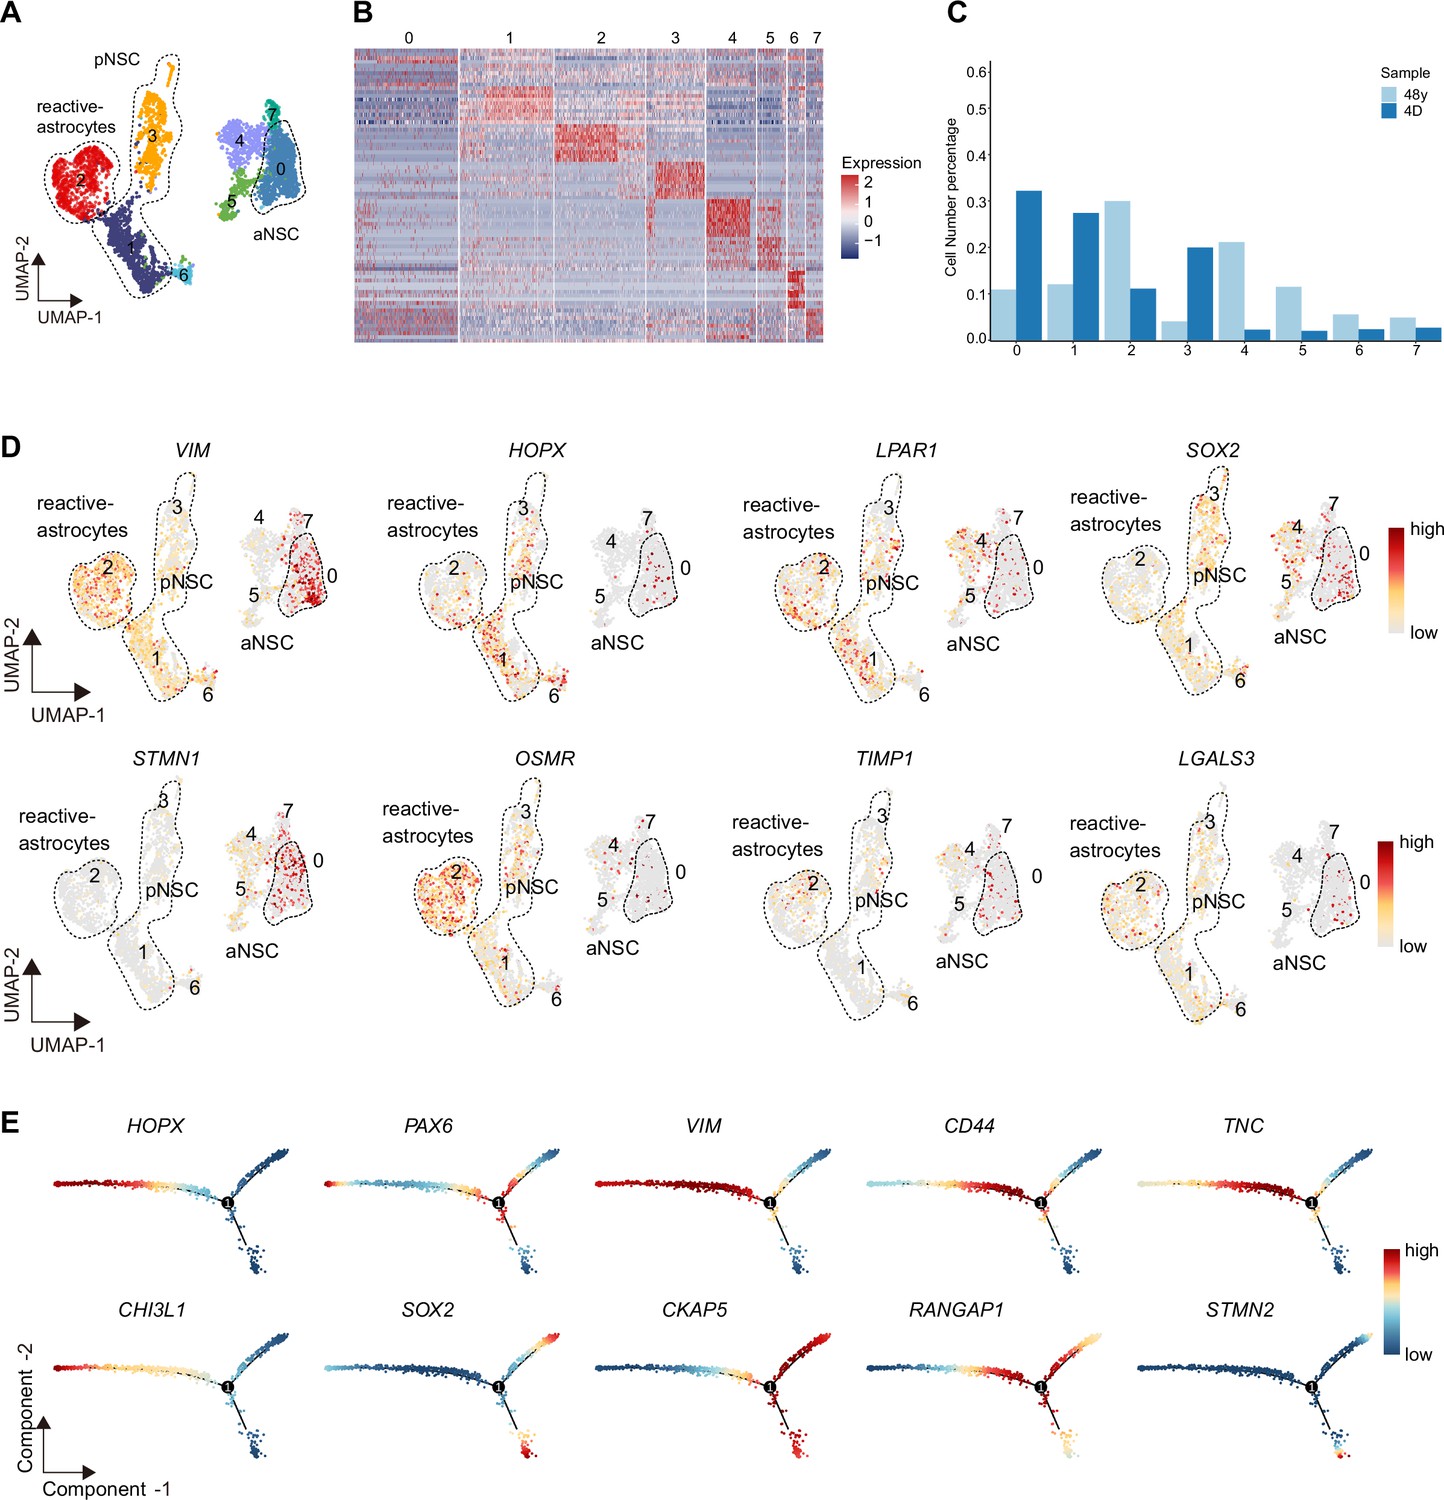
Initially defined primed neural stem cells (pNSCs) and active NSCs (aNSCs) from stroke-injured hippocampus contained reactive astrocytes and reactivated NSCs.
The integrative analysis of single-cell data was based on initially defined pNSC and aNSC populations from the neonatal day 4 and 48y-stroke injury hippocampus. (A) Integrative analysis of pNSC and aNSC from stroke injury and neonatal hippocampus showing that these cells were subclustered into eight clusters. (B) Heatmap of top 10 genes (p-value <0.05) specific for each major cluster after normalization, relative to Figure 6E. (C) The fraction of subpopulations in total cells (clusters 0–7). (D) Uniform Manifold Approximation and Projection (UMAP) feature plots showing expression distribution of cell type-specific genes in cell subpopulations, including radial glia-like cell (RGL) marker genes (VIM, HOPX, LPAR1, and SOX2), neurogenic development genes (STMN1), and reactive astrocytes marker gene (OSMR, TIMP, and LGALS3). (E) The dynamic expression of cell type-specific genes along the pseudotime. Each dot represents an individual cell. These representative genes included RGL genes PAX6 and HOPX, reactivated NSC genes VIM, CD44, TNC, CHI3L1, and SOX2, and cell cycle genes CKAP5 and RANGAP1, and neuroblast gene STMN2.
Figure 6—figure supplement 3
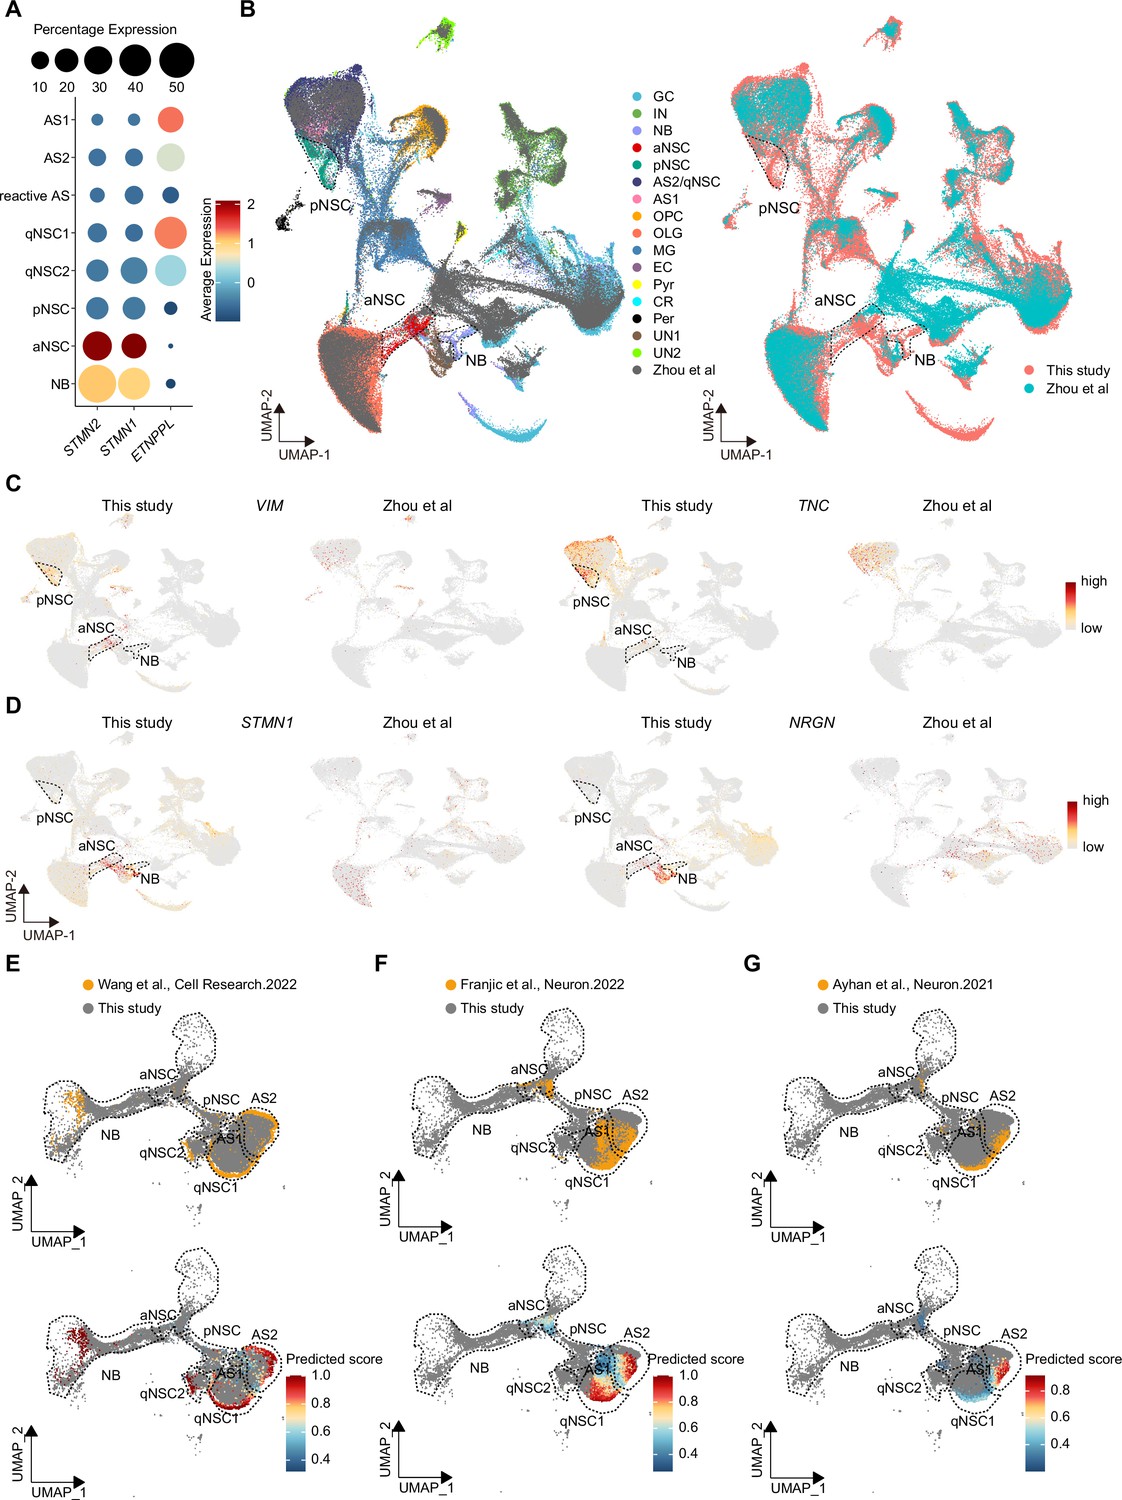
Integration of our single-nucleus RNA-seq (snRNA-seq) dataset with other published data.
(A) ETNPPL as a new neural stem cell (NSC) marker and STMN1/STMN2 as new immature neuron markers validated in Wang’s study were verified in our study. (B) Integration of Zhou’s snRNA-seq dataset of 14 aged donors (from 60 to 92 years of age) with our snRNA-seq dataset. We did not detect evident pNSC, aNSC, or NB populations in their dataset (circle with a dotted line). (C and D) Uniform Manifold Approximation and Projection (UMAP) visualization of pNSC/aNSC markers (TNC and VIM) (C), and neuroblast markers (STMN1 and NRGN) (D) in our and Zhou’s snRNA-seq dataset. Related to discussion. (E–G) The snRNA-seq dataset from Wang et al. (Cell Research, 2022a) (E), Franjic et al. (Neuron, 2022) (F), and Ayhan et al. (Neuron, 2021) (G) were mapped onto our snRNA-seq dataset using the ‘multimodal reference mapping’ method. Based on the mapping analysis, astrocytes, qNSCs, aNSCs, and NB were identified with varying correlation efficiencies in different datasets. The color scale represents the predicted correlation score.
Tables
Appendix 1—key resources table
| Reagent type (species) or resource | Designation | Source or reference | Identifiers | Additional information |
|---|---|---|---|---|
| Biological sample (Homo sapiens) | Neonatal hippocampal tissue (4 days, male) | ZHONG-ZHI-YI-GU Research Institute | Freshly isolated from donors' brain PMI 3–5 hr | |
| Biological sample (Homo sapiens) | Adult hippocampal tissue (31 years of age, male) | ZHONG-ZHI-YI-GU Research Institute | Freshly isolated from donors' brain PMI 3–5 hr | |
| Biological sample (Homo sapiens) | Adult hippocampal tissue (32 years of age, male) | ZHONG-ZHI-YI-GU Research Institute | Freshly isolated from donors' brain PMI 3–5 hr | |
| Biological sample (Homo sapiens) | Stroke hippocampal tissue (48 years of age, male) | ZHONG-ZHI-YI-GU Research Institute | Freshly isolated from donors' brain PMI 3–5 hr | |
| Biological sample (Homo sapiens) | Aged hippocampal tissue (50 years of age, male) | ZHONG-ZHI-YI-GU Research Institute | Freshly isolated from donors' brain PMI 3–5 hr | |
| Biological sample (Homo sapiens) | Aged hippocampal tissue (56 years of age, male) | ZHONG-ZHI-YI-GU Research Institute | Freshly isolated from donors' brain PMI 3–5 hr | |
| Biological sample (Homo sapiens) | Aged hippocampal tissue (60 years of age, male) | ZHONG-ZHI-YI-GU Research Institute | Freshly isolated from donors' brain PMI 3–5 hr | |
| Biological sample (Homo sapiens) | Aged hippocampal tissue (64 years of age, female) | ZHONG-ZHI-YI-GU Research Institute | Freshly isolated from donors' brain PMI 3–5 hr | |
| Biological sample (Homo sapiens) | Aged hippocampal tissue (64 years of age, male) | ZHONG-ZHI-YI-GU Research Institute | Freshly isolated from donors' brain PMI 3–5 hr | |
| Biological sample (Homo sapiens) | Aged hippocampal tissue (68 years of age, male) | ZHONG-ZHI-YI-GU Research Institute | Freshly isolated from donors' brain PMI 3–5 hr | |
| Biological sample (Macaca sapiens) | Cynomolgus monkey hippocampal tissues (3 months, male) | Kunming University of Science and Technology (KUST) | Freshly isolated from monkey’s brain | |
| Chemical compound, drug | Hibernate A | Gibco | Cat# A1247501 | |
| Chemical compound, drug | B27 | Thermo | Cat# 17504044; CAS: 145567-32-4 | |
| Chemical compound, drug | GlutaMAX | Invitrogen | Cat# 35050-061 | |
| Chemical compound, drug | Tris-HCl | Beyotime | Cat# ST768; CAS: 92451-00-8 | |
| Chemical compound, drug | NaCl | Aladdin | Cat# C111533; CAS: 14762-51-7 | |
| Chemical compound, drug | MgCl2 | Aladdin | Cat#M113692; CAS: 7786-30-3 | |
| Chemical compound, drug | 0.1% Nonidet P40 | Sigma-Aldrich | Cat# 74385 | |
| Chemical compound, drug | 30 µm MACS SmartStrainer | Miltenyi Biotec | Cat# 130-098-458 | |
| Chemical compound, drug | PBS | Solarbio | Cat# P1010 | |
| Chemical compound, drug | BSA | BOSTER | Cat# AR0189 | |
| Chemical compound, drug | RNase inhibitor | Sigma-Aldrich | Cat# 3335399001 | |
| Chemical compound, drug | Myelin Removal Beads II slurry | Miltenyi Biotec | Cat# 130-096-733 | |
| Chemical compound, drug | PFA | Sigma | Cat# 158127; CAS: 30525-89-4 | |
| Chemical compound, drug | Triton X-100 | BioFroxx | Cat# 1139ML100 | |
| Chemical compound, drug | DAPI staining | Sigma | Cat# 32670-5mg-F | 1:1000 |
| Commercial assay or kit | TUNEL-based method | BOSTER | Cat# MK1012 | |
| Commercial assay or kit | VECTOR TrueView autofluorescence quenching kit | Vectorlabs | Cat# SP-8500-15 | |
| Antibody | Anti-Nestin (rabbit monoclonal) | Millipore | Cat# MAB5326; RRID: AB_2251134 | 1:800 |
| Antibody | Anti-ki67 (mouse monoclonal) | R&D Systems | Cat# AF7649; RRID: AB_2687500 | 1:500 |
| Antibody | Anti-CHI3L1 (rabbit monoclonal) | Proteintech | Cat# 12036-1-AP; RRID: AB_2877819 | 1:500 |
| Antibody | Anti-Vimentin (rabbit monoclonal) | Abcam | Cat# ab137321; RRID: AB_2921312 | 1:800 |
| Antibody | Anti-Vimentin (mouse monoclonal) | Thermo Fisher Scientific | Cat# 14-9897-37; RRID: AB_2865507 | 1:500 |
| Antibody | Anti-HOPX (rabbit monoclonal) | Sigma | Cat# HPA030180; RRID: AB_10603770 | 1:1000 |
| Antibody | Anti-PSA-NCAM (mouse monoclonal) | Millipore | Cat# MAB5324; RRID: AB_95211 | 1:500 |
| Antibody | Anti-SST (mouse monoclonal) | Santa Cruz Biotechnology | Cat# sc-55565; RRID: AB_831726 | 1:500 |
| Antibody | Alexa Fluor 488 AffiniPure donkey anti-rabbit (secondary antibody) | Jackson Immunoresearch | Cat# 712-545-150; RRID: AB_2340683 | 1:500 |
| Antibody | Alexa Fluor 647 AffiniPure donkey anti-rabbit (secondary antibody) | Jackson Immunoresearch | Cat# 715-605-150; RRID: AB_2340862 | 1:500 |
| Antibody | Alexa Fluor 555 donkey anti-rabbit (secondary antibody) | Thermo Fisher | Cat# A-31572; RRID: AB_162543 | 1:500 |
| Software, algorithm | Seurat package (4.0.3) | Hao et al., 2022 | https://satijalab.org/seurat/ | |
| Software, algorithm | Complexheatmap v2.8.0 R package | Gu, 2022 | https://github.com/jokergoo/ComplexHeatmap | |
| Software, algorithm | Monocle 2R package (v2.20.0) | Trapnell et al., 2014 | https://cole-trapnell-lab.github.io/monocle-release/ | |
| Software, algorithm | clusterProfiler package | Yu et al., 2012 | https://github.com/JPingAMMS/clusterProfiler | |
| Software, algorithm | Single-cell hierarchical Poisson factorization (scHPF) | Levitin et al., 2019 | https://github.com/simslab/scHPF |
Additional files
Download links
A two-part list of links to download the article, or parts of the article, in various formats.
Downloads (link to download the article as PDF)
Open citations (links to open the citations from this article in various online reference manager services)
Cite this article (links to download the citations from this article in formats compatible with various reference manager tools)
Deciphering molecular heterogeneity and dynamics of human hippocampal neural stem cells at different ages and injury states
eLife 12:RP89507.
https://doi.org/10.7554/eLife.89507.4


