The rapidly evolving X-linked MIR-506 family fine-tunes spermatogenesis to enhance sperm competition
- Department of Physiology and Cell Biology, University of Nevada, Reno School of Medicine, United States
- The Lundquist Institute for Biomedical Innovation at Harbor-UCLA Medical Center, United States
- Developmental Biology Program, Sloan Kettering Institute, United States
- Department of Neuroscience, Developmental and Regenerative Biology, University of Texas at San Antonio, United States
- Department of Medicine, David Geffen School of Medicine, University of California, Los Angeles, United States
Figures
Figure 1 with 2 supplements
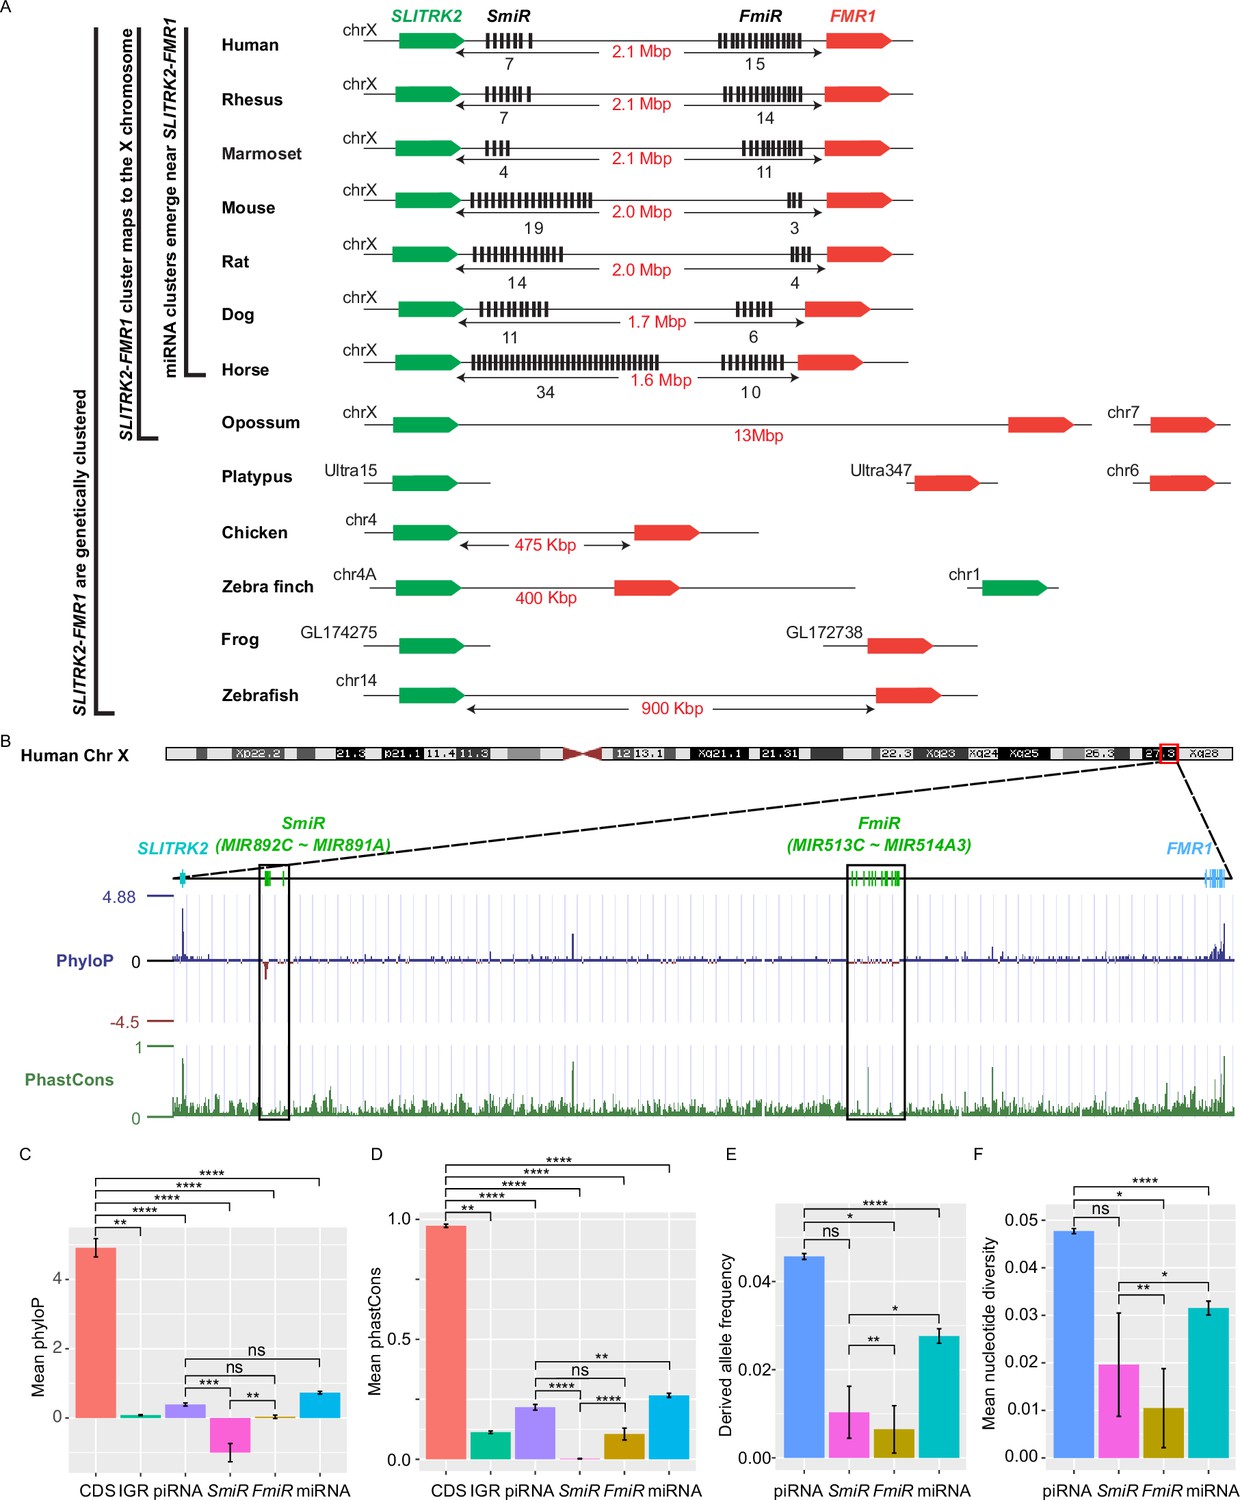
Genomic location, sequence alignment, and evolution conservation of the X-linked MIR-506 family.
(A) Genomic location of the X-linked MIR-506 family miRNAs (black bars) and the two flanking coding genes, SLITRK2 (green blocks) and FMR1 (red blocks). The number of miRNAs within each cluster is indicated underneath the miRNA clusters. (B) Evolution conservation of X-linked MIR-506 family based on Multiz Alignment and Conservation using the human genome as a reference. Positive PhyloP scores indicate conservation and vice versa. PhastCons has a score between 0–1, and the higher the score, the more conserved the DNA region is. (C, D) Comparison of mean PhyloP (C) and PhastCons (D) scores among CDS of SLITRK2 and FMR1, intergenic region (IGR), pachytene piRNAs, SmiRs, FmiRs, and all miRNAs. **, ***, and **** indicate adjusted p-value <0.01, 0.001, and 0.0001, respectively. ns, not significant. Kruskal–Wallis test was used for statistical analyses. (E, F) Comparison of derived allele (E) and mean nucleotide (F) frequencies among pachytene piRNAs, SmiRs, FmiRs, and all miRNAs. *, ** and **** indicate adjusted p-value <0.05, 0.01, and 0.0001, respectively. ns, not significant. Kruskal–Wallis test was used for statistical analyses.
Figure 1—figure supplement 1
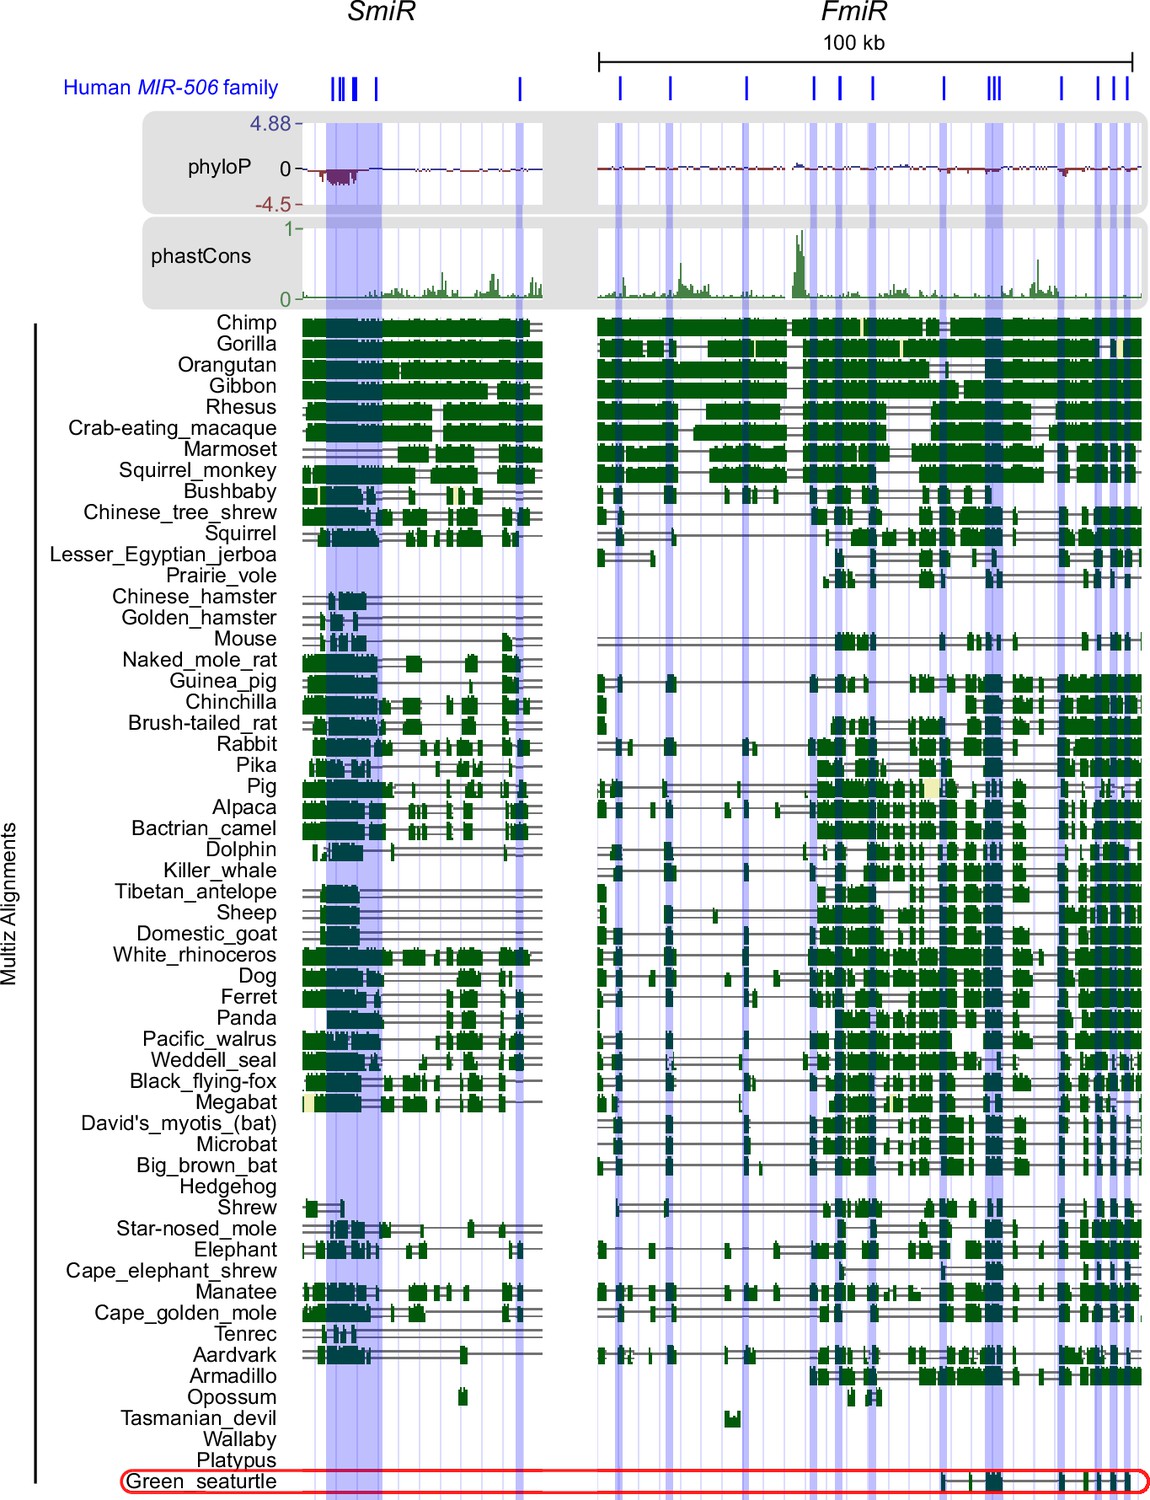
Multiz Alignment and Conservation analyses of X-linked MIR-506 family across 100 species using the human genomes as references.
miRNAs are highlighted in blue.
Figure 1—figure supplement 2
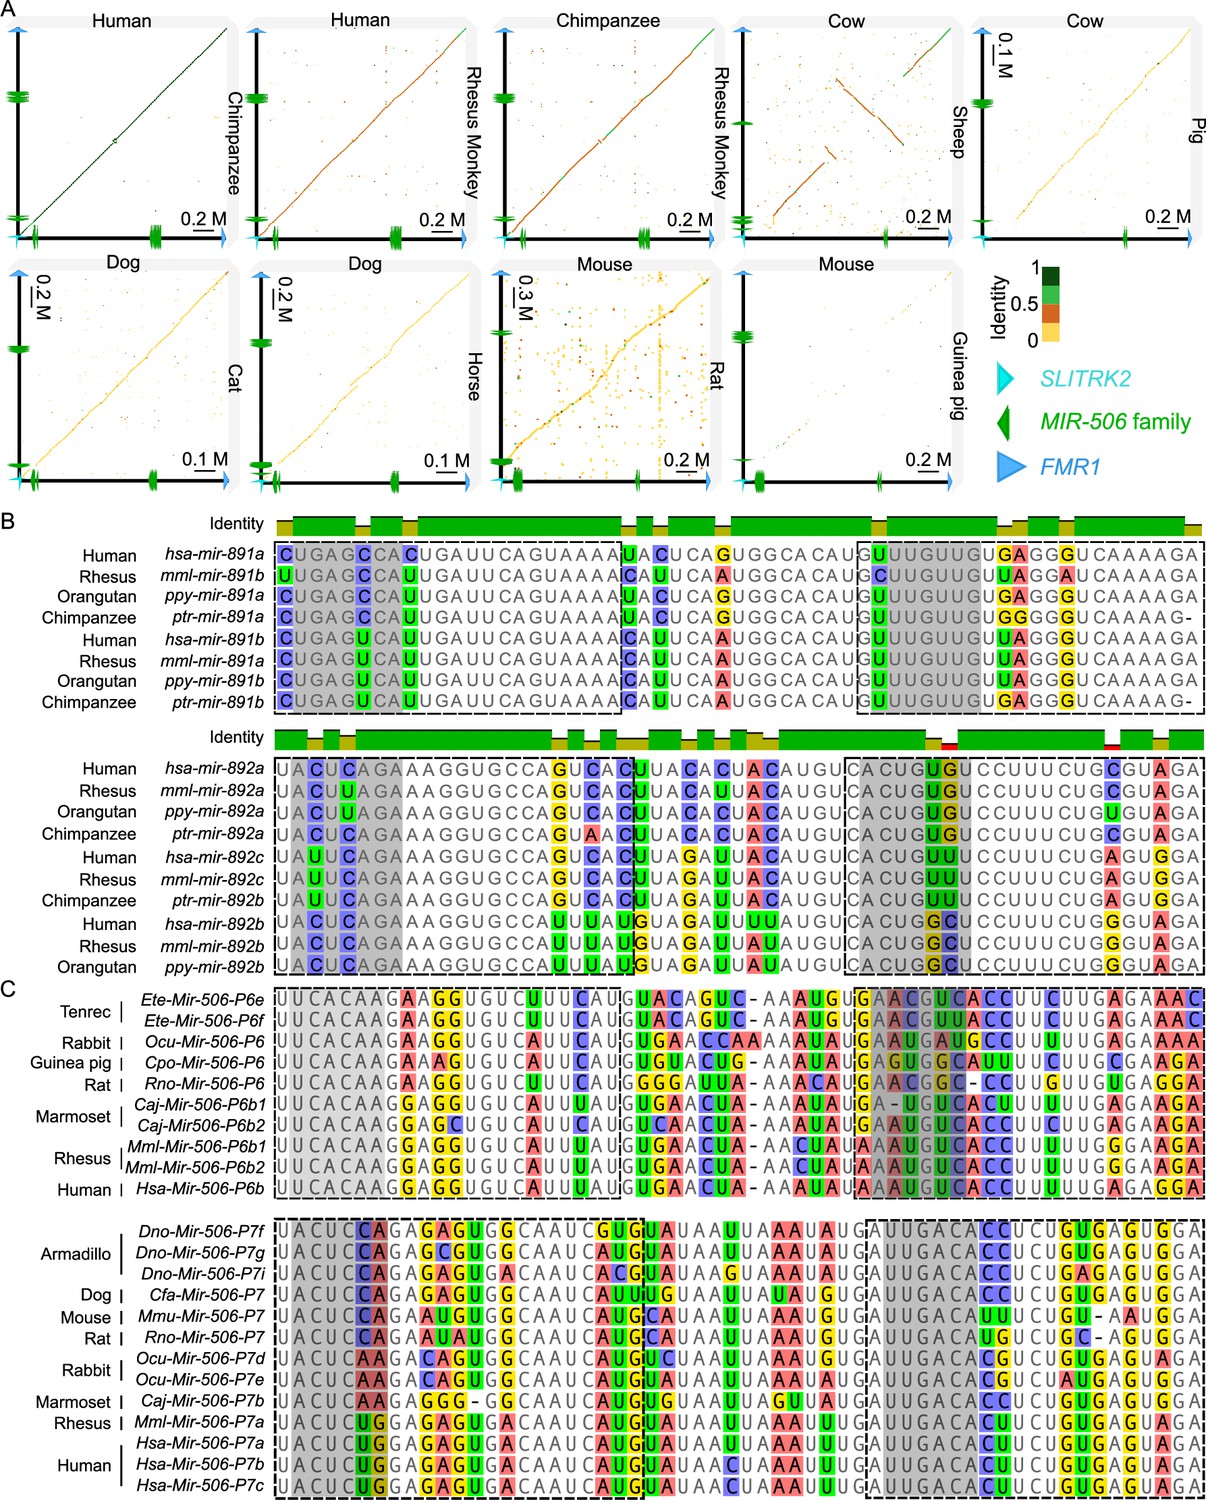
Genomic and sequence similarity among members of the X-linked MIR-506 family.
(A) Genomic similarity using GENIES-based dot plot analyses within clades. (B) Upper panel, sequences alignment of precursor Mir891 among primates. Lower panel, sequences alignment of precursor Mir892 among primates. Bases in the dashed square represent the mature miRNA sequences. Seed sequences are highlighted in gray, and alignments with mismatches are indicated with other colors. (C) Alignment of precursor miRNA of Mir-506-P6 (upper panel) and Mir-506-P7 (lower panel) subfamily across species. Bases in the dotted square represent the mature miRNA. Seed sequences are shown in the gray background, and alignments with mismatches are indicated in bases with the colored background.
Figure 2 with 3 supplements
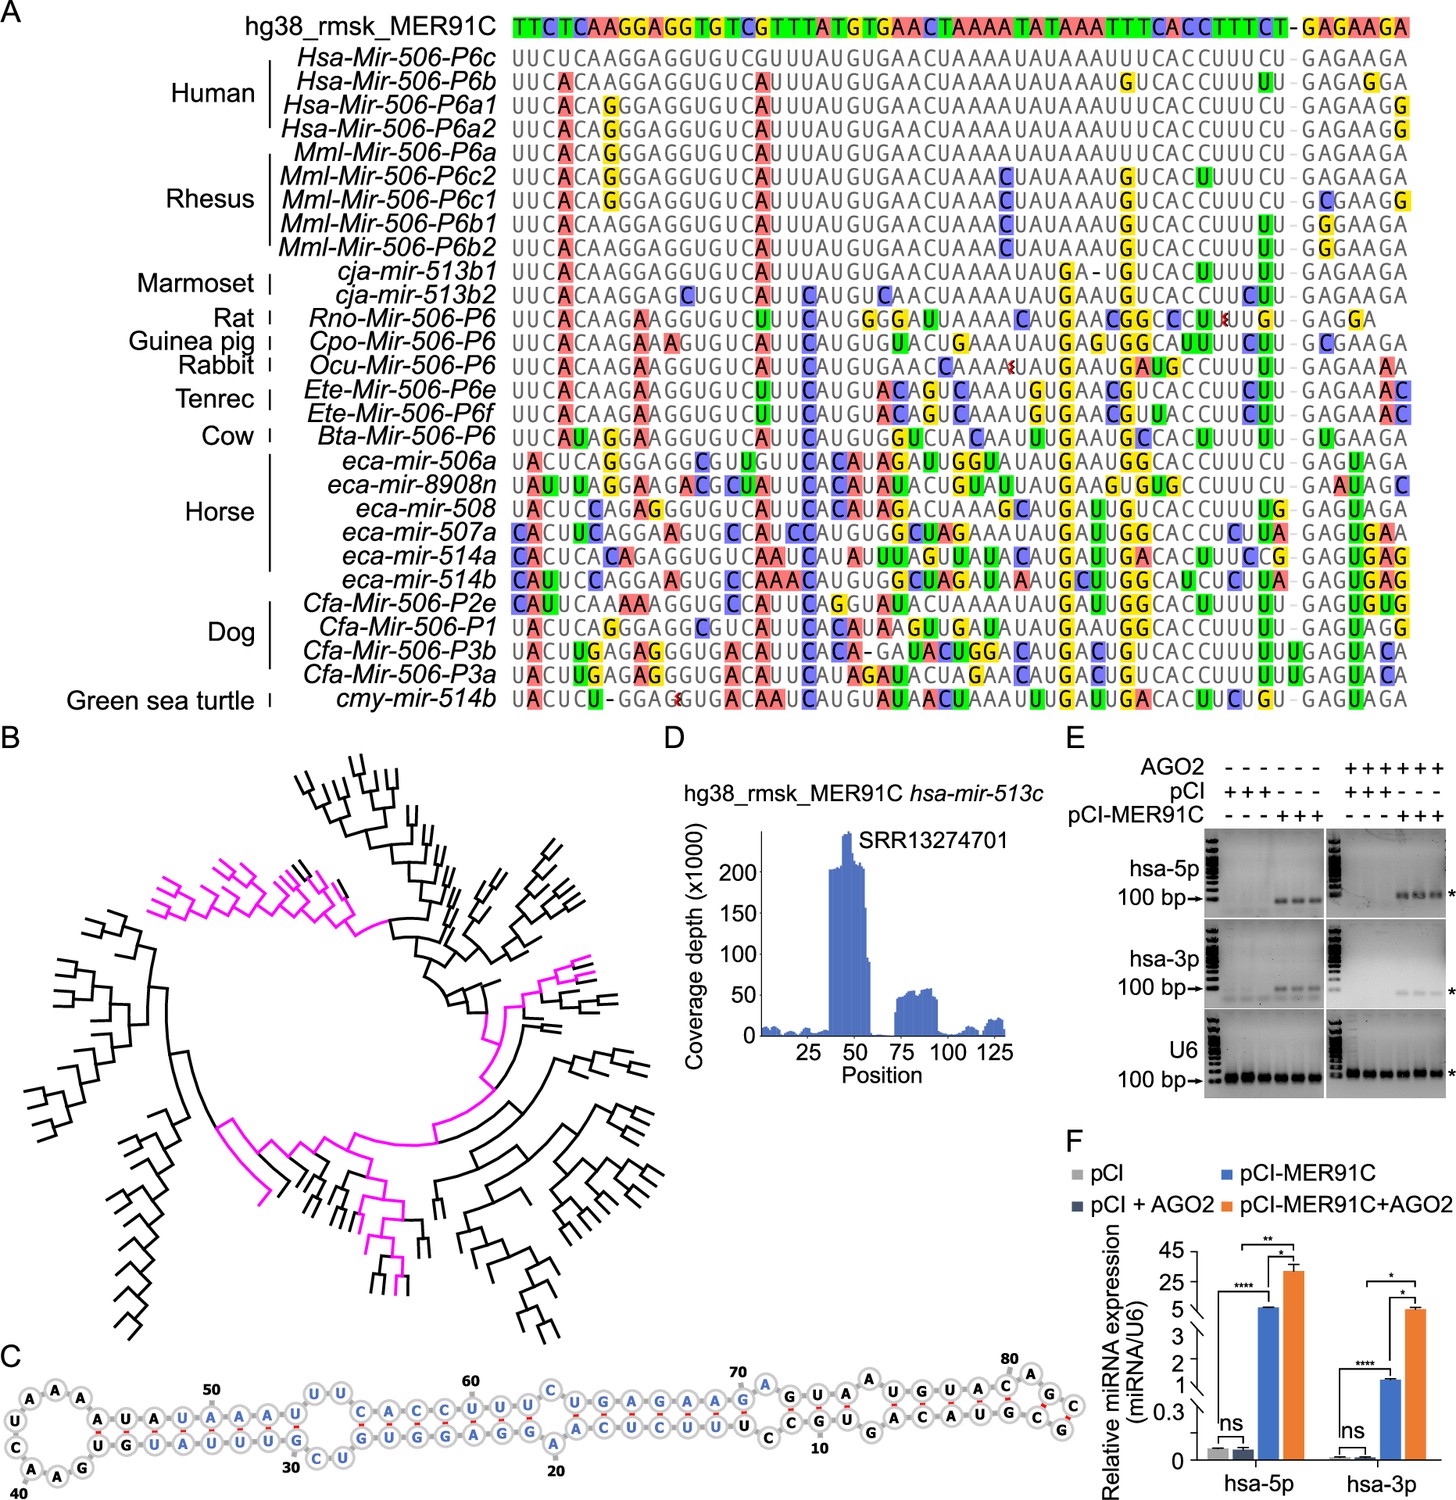
Evolutionary history of the X-linked MIR-506 family.
(A) Sequences alignment of FmiRs from various species using human MER91C DNA transposon as the reference. The first line is the human MER91C DNA transposon, and below are the miRNAs of various species. Mismatched nucleotides are highlighted with various colors. (B) A phylogenetic tree of the MER91C DNA transposons and the X-linked MIR-506 family miRNAs. The MER91C DNA transposons are labeled in purple. (C) RNA structure of the MER91C DNA transposon-derived miRNA (human MIR513C). (D) sRNA-seq reads (lower panel) of the MER91C DNA transposon-derived miRNA (human MIR513C). (E) Representative gel images showing expression levels of the MER91C DNA transposon-derived miRNA (human MIR513A1) in HEK293T cells. n = 3 for each group. The asterisk (*) indicates the expected miRNA size. U6 was used as the loading control. (F) qPCR analyses of expression levels of MER91C DNA transposon-derived miRNA (human MIR513A1) in HEK293T cells. n = 3 for each group. *, **, and **** indicate adjusted p-value <0.05, 0.01, and 0.0001, respectively. One-way ANOVA was used for statistical analyses.
-
Figure 2—source data 1
The original gel images of the MER91C DNA transposon-derived miRNAs from humans expressed in HEK293T cells in Figure 2E.
- https://cdn.elifesciences.org/articles/90203/elife-90203-fig2-data1-v1.zip
-
Figure 2—source data 2
The PDF contains Figure 2E and the original gel images labeled with the relevant bands.
- https://cdn.elifesciences.org/articles/90203/elife-90203-fig2-data2-v1.zip
Figure 2—figure supplement 1
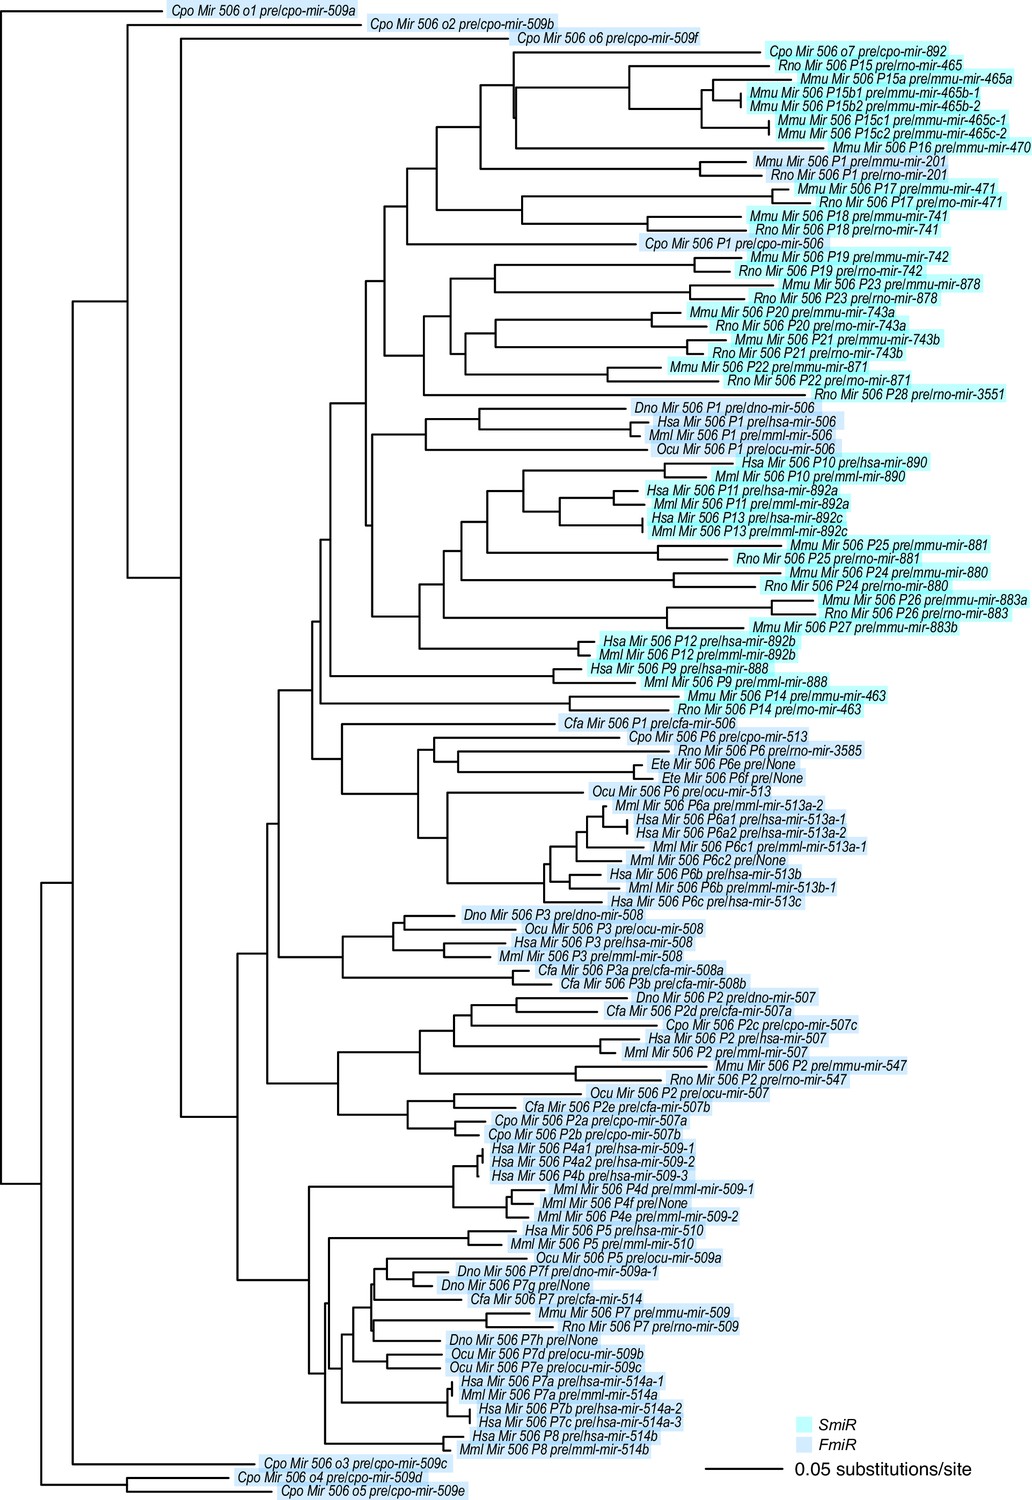
A phylogram of the X-linked MIR-506 family.
SmiRs and FmiRs are shown in cyan and blue, respectively.
Figure 2—figure supplement 2

A phylogenetic tree of the MER91C DNA transposons and the X-linked MIR-506 family miRNAs.
The MER91C DNA transposons are labeled in purple.
Figure 2—figure supplement 3
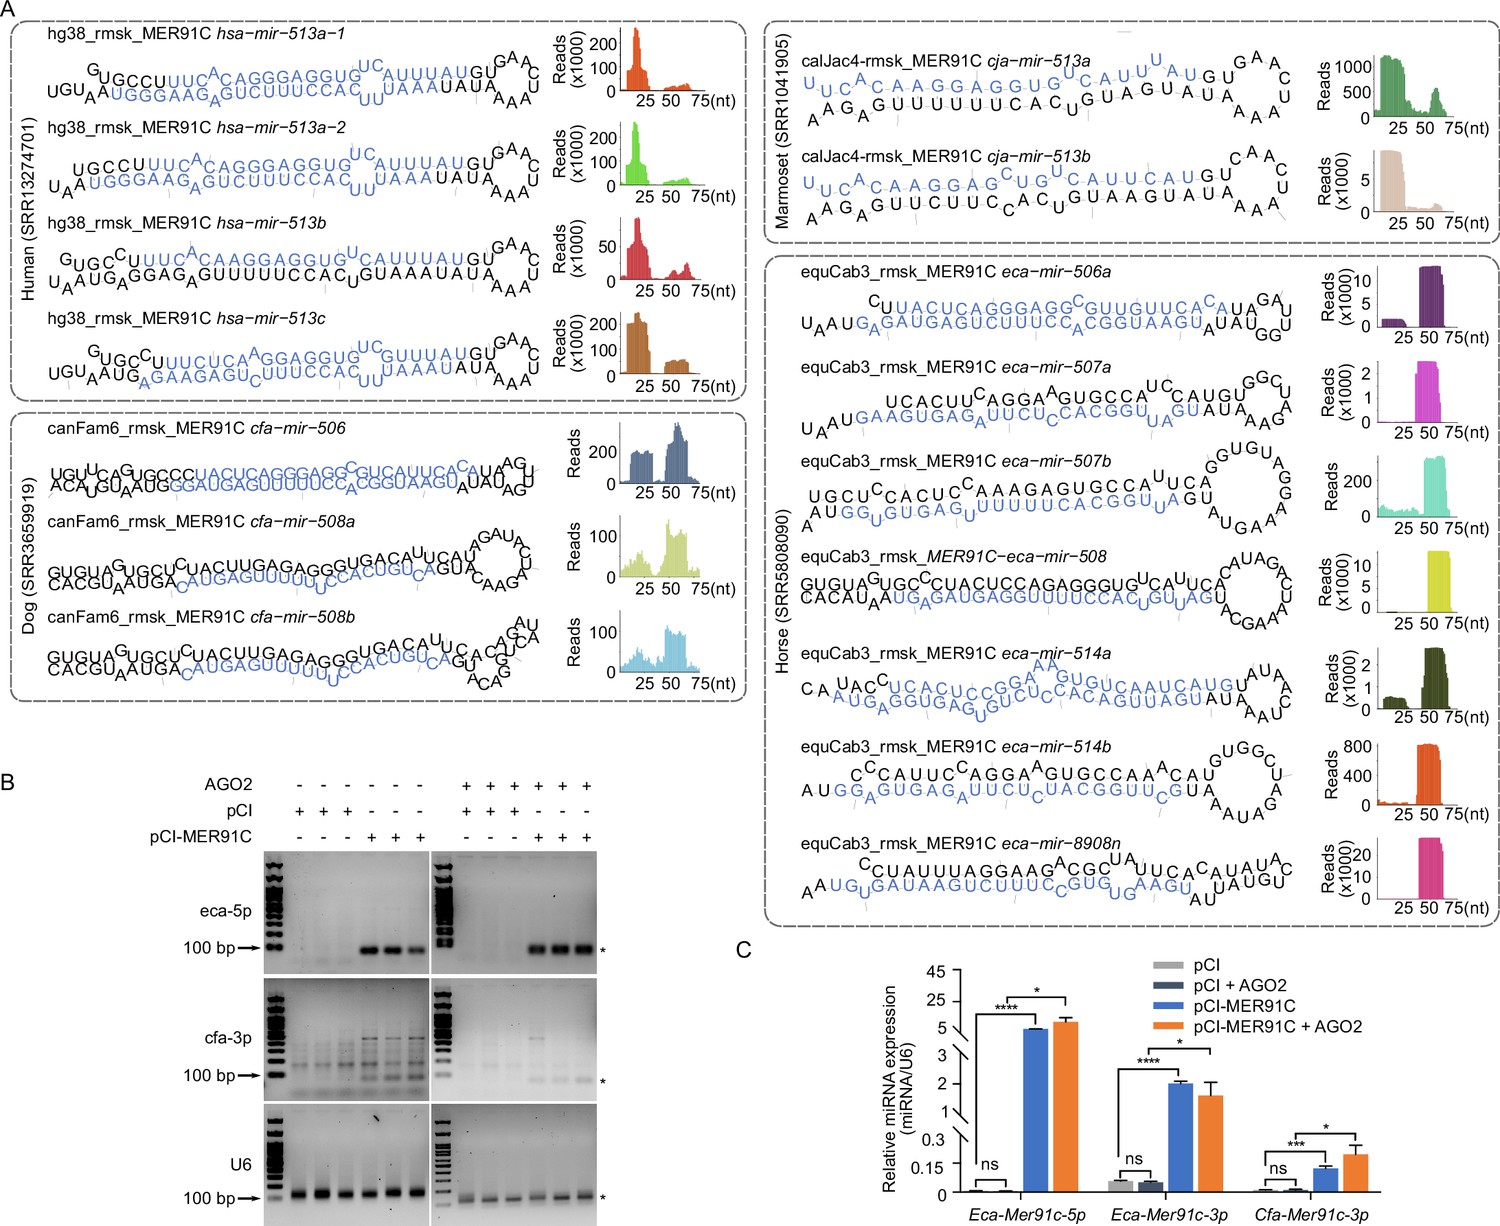
X-linked MIR-506 family is derived from MER91C DNA transposon and expanded via LINE retrotransposons.
(A) RNA structure and sRNA-seq reads of the MER91C DNA transposon-derived miRNAs in humans, marmosets, horses, and dogs. The mature miRNAs are labeled in blue in the RNA structure. (B) A representative gel image of the MER91C DNA transposon-derived miRNAs from horses and dogs expressed in HEK293T cells. n = 3 for each sample. * indicates the expected size of the miRNA. U6 was used as the internal control. (C) qPCR of the MER91C DNA transposon-derived miRNAs expression in HEK293T cells. n = 3 for each sample. *, ***, and **** indicate p<0.05, 0.001, and 0.0001, respectively. One-way ANOVA was used for the statistical analysis.
-
Figure 2—figure supplement 3—source data 1
The original gel images of the MER91C DNA transposon-derived miRNAs from horses and dogs expressed in HEK293T cells in Figure 2—figure supplement 3B.
- https://cdn.elifesciences.org/articles/90203/elife-90203-fig2-figsupp3-data1-v1.zip
-
Figure 2—figure supplement 3—source data 2
The PDF contains Figure 2—figure supplement 3B and the original gel images labeled with the relevant bands.
- https://cdn.elifesciences.org/articles/90203/elife-90203-fig2-figsupp3-data2-v1.zip
Figure 3 with 1 supplement
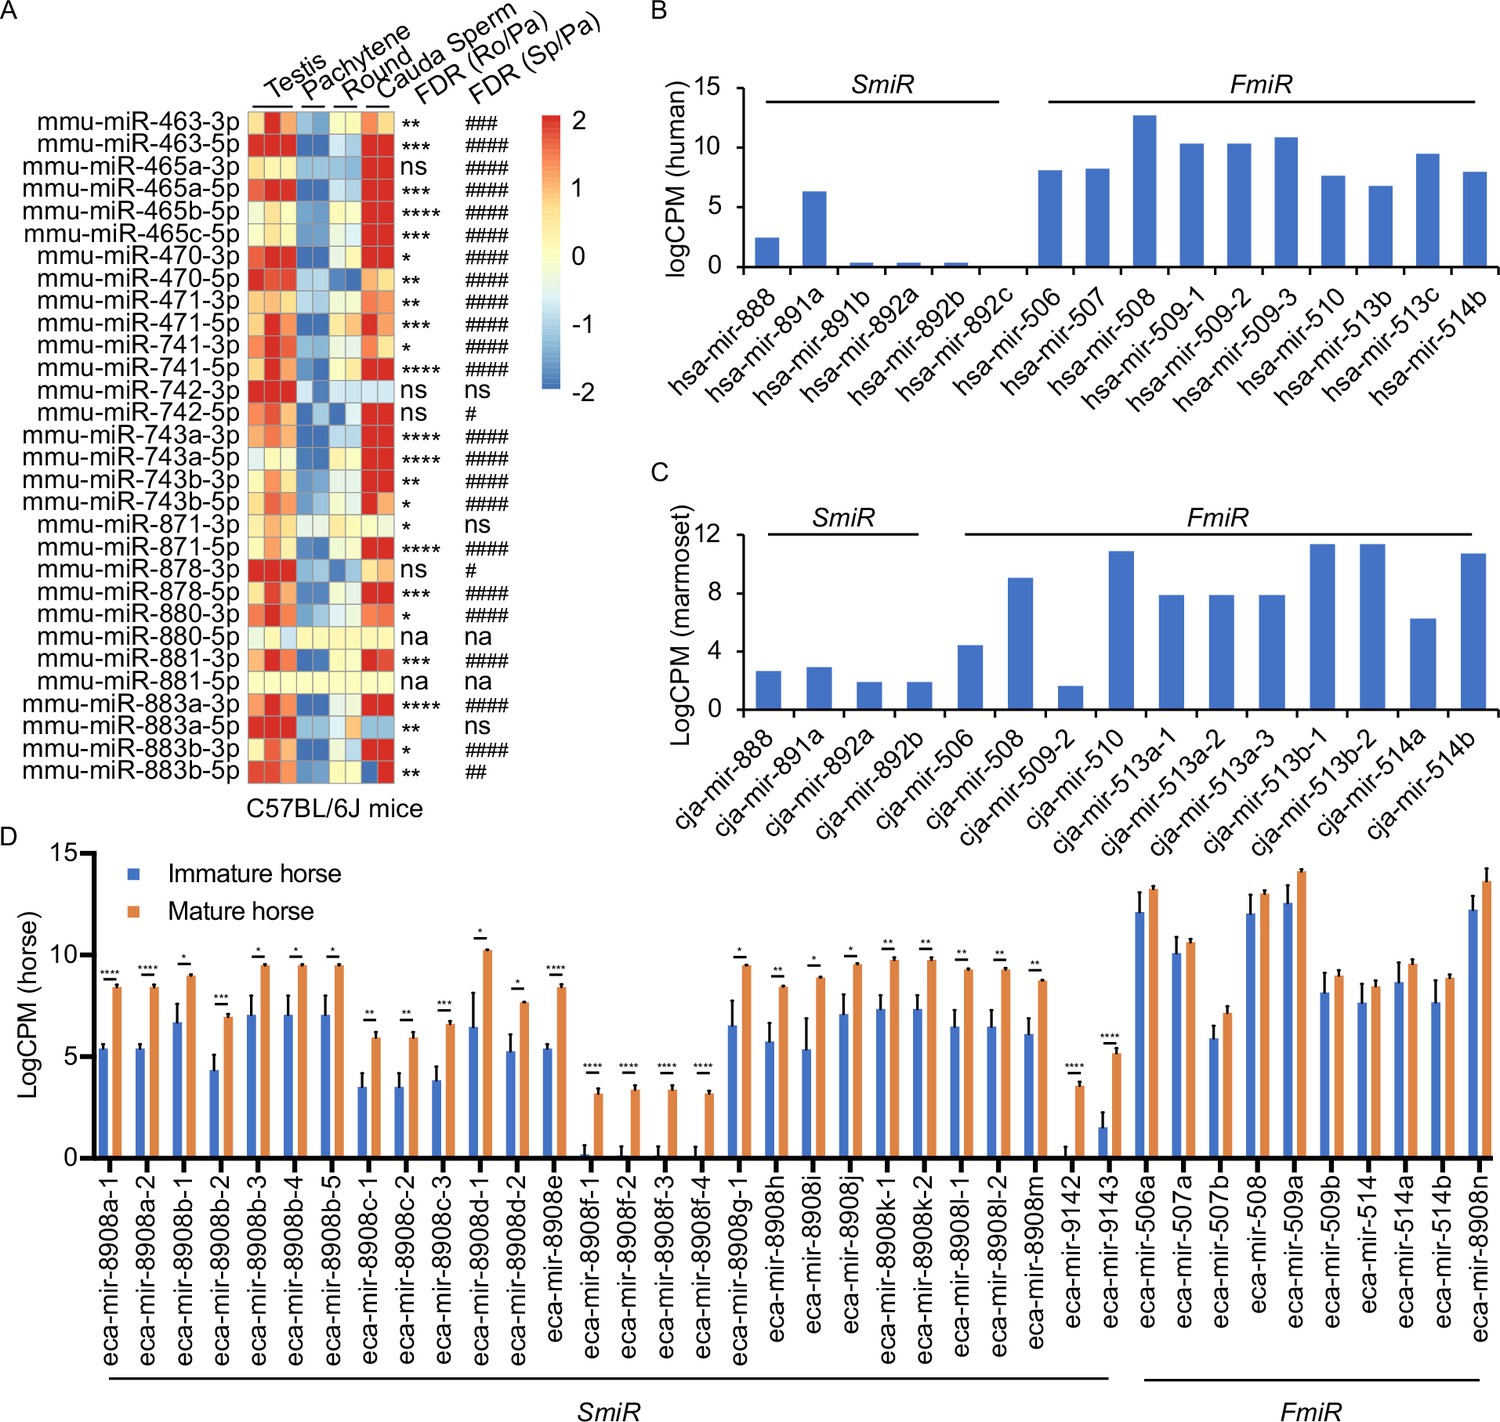
Expression profiles of X-linked MIR-506 family in mammalian testes and male germ cells.
(A) Heatmaps showing the MIR-506 family expression in the testis, pachytene spermatocytes, round spermatids, and sperm in mice. Biological triplicates of the testis samples (n = 3) and duplicates of pachytene spermatocytes, round spermatids, and sperm samples isolated from 2 to 4 mice were used for sRNA-seq. *, **, ***, and **** indicate false discovery rate (FDR) <0.05, 0.01, 0.001, and 0.0001, respectively, when comparing round spermatids to pachytene spermatocytes. #, ##, ###, and #### indicate FDR <0.05, 0.01, 0.001, and 0.0001, respectively, when comparing cauda sperm to pachytene spermatocytes. ns and na indicate not significantly and not applicable, respectively. (B, C) LogCPM bar graphs showing the MIR-506 family expression in the testis of humans n = 1 (B) and marmosets n = 1 (C). (D) LogCPM bar graph showing the MIR-506 family expression in sexually immature and mature horse testes. n = 3. *, **, ***, and **** indicate FDR <0.05, 0.01, 0.001, and 0.0001, respectively.
Figure 3—figure supplement 1
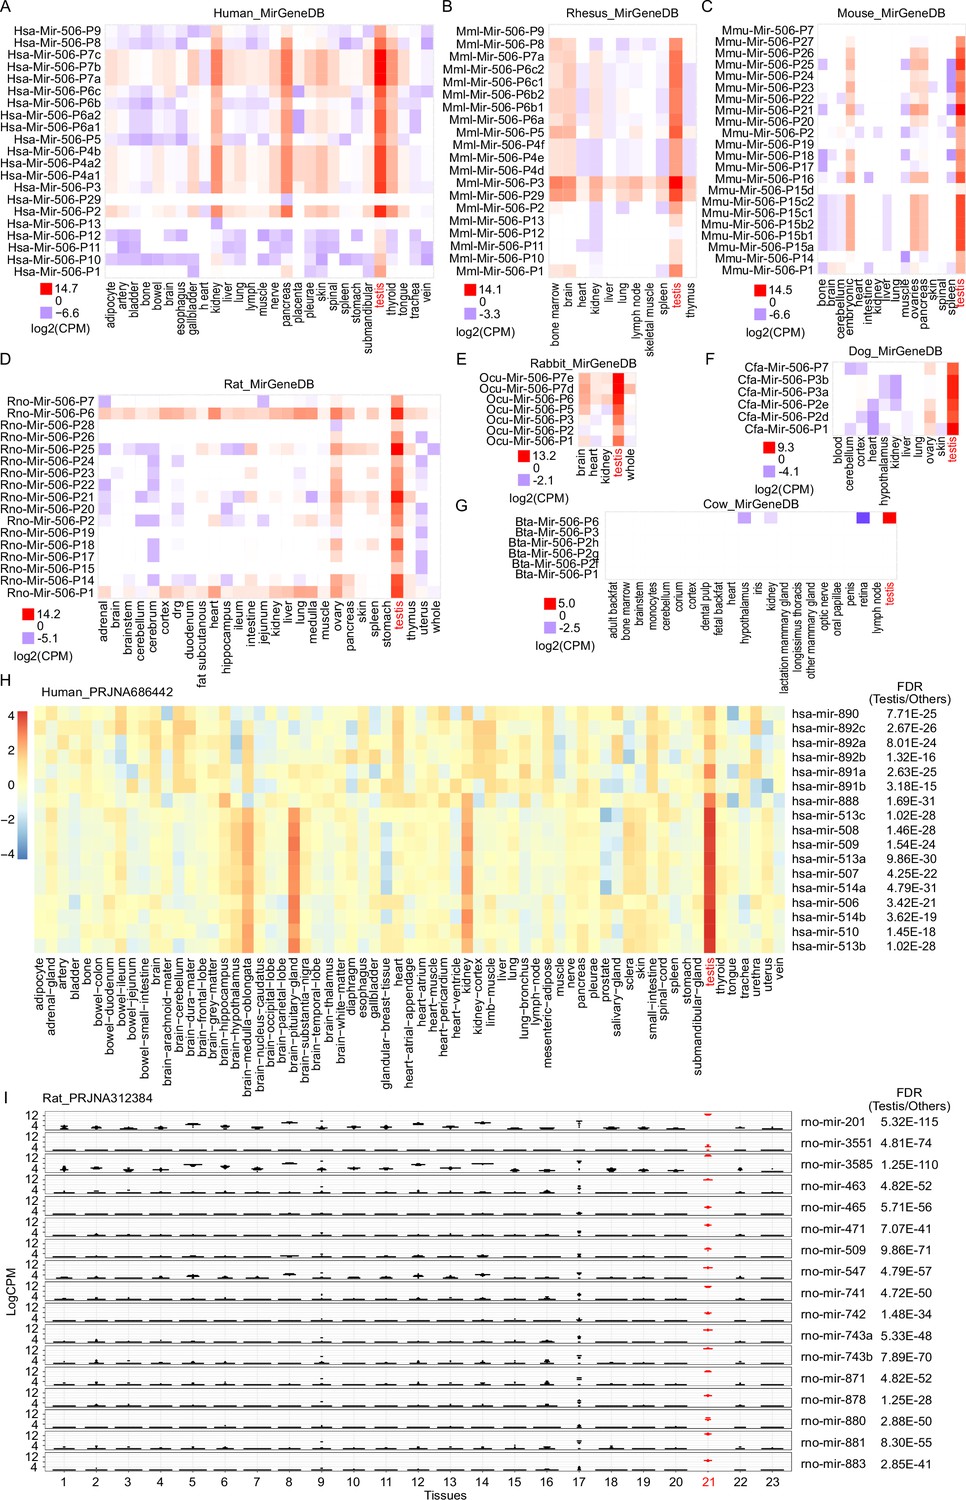
sRNA-seq of multiple tissues from different species.
(A) sRNA-seq from MirGeneDB across multiple tissues in humans. n = 1 for each group. (B) sRNA-seq from MirGeneDB across multiple tissues in rhesus. n = 1 for each group. (C) sRNA-seq from MirGeneDB across multiple tissues in mice. n = 1 for each group. (D) sRNA-seq from MirGeneDB across multiple tissues in rats. n ≥ 1 for each group. (E) sRNA-seq from MirGeneDB across multiple tissues in rabbits. n = 1 for each group. (F) sRNA-seq from MirGeneDB across multiple tissues in dogs. n = 2 for the testis samples and n = 1 for other samples. (G) sRNA-seq from MirGeneDB across multiple tissues in cows. n = 1 for each group. (H) sRNA-seq from RPJNA686442 across multiple tissues in humans. The testis sample is labeled in red. False discovery rate (FDR) is indicated on the right side of the plot. The average value was used for the heatmap, n ≥ 2 for each group. I. sRNA-seq from RPJNA312384 across multiple tissues in rats. n ≥ 6 for each group. Testis samples are labeled in red. FDR is indicated on the right side of the plot. Rats’ tissues analyzed include 1. adrenal, 2. brainstem, 3. cerebellum, 4. cerebrum, 5. cortex, 6. dorsal root ganglia, 7. duodenum, 8. heart, 9. hippocampus, 10. ileum, 11. jejunum, 12. kidney, 13. liver, 14. medulla, 15. muscle biceps, 16. muscle soleus, 17. ovary, 18. pancreas, 19. stomach glandular, 20. stomach non-glandular, 21. testicle, 22. uterus, and 23. whole blood.
Figure 4 with 1 supplement
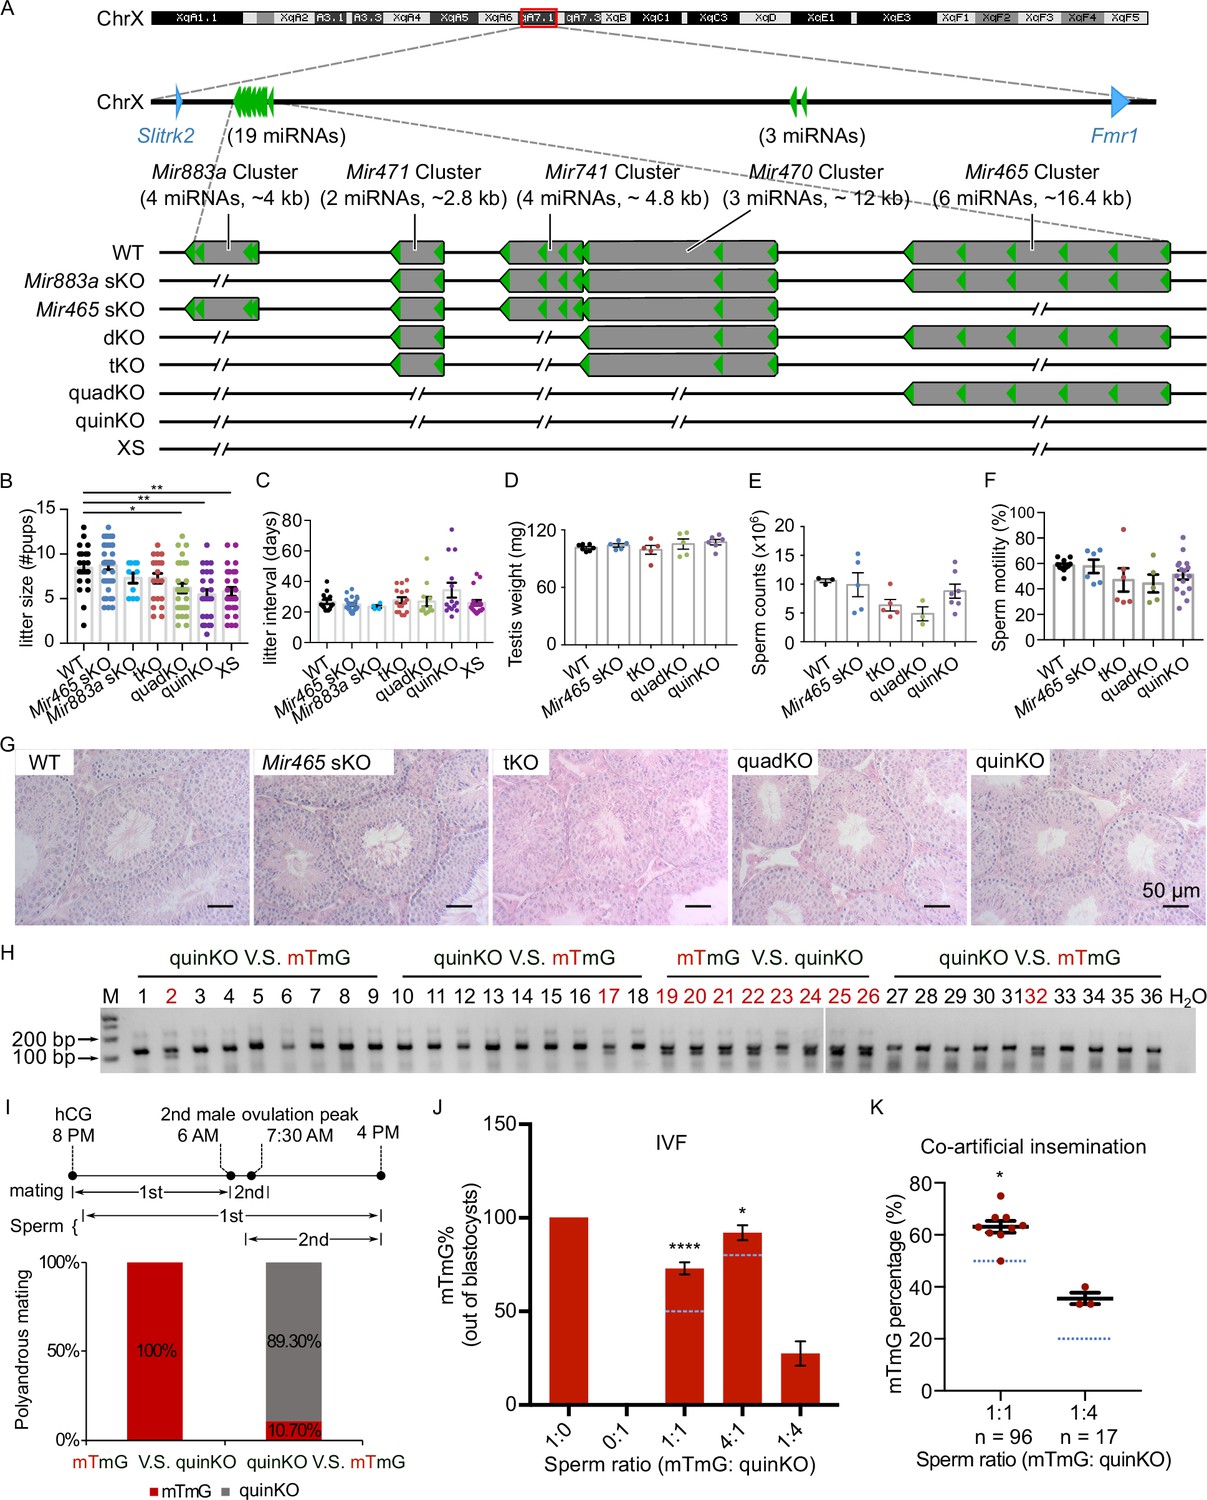
Ablation of X-linked MIR-506 family miRNAs compromised sperm competitiveness and reproductive fitness in male mice.
(A) Schematics showing the strategy used to generate six lines of KO mice lacking individual or combined miRNA clusters within the MIR-506 family using CRISPR-Cas9. (B, C) Litter size (B) and litter interval (C) of six MIR-506 family KO lines, at least 10 litters from three different breeding pairs for each KO line were counted. Dunnett’s multiple comparisons test as the post hoc test following one-way ANOVA was used for the statistical analysis. ns, not significant. * and ** indicate adjusted p-value <0.05 and 0.01, respectively. (D–F) Analyses of testis weight (D), sperm counts (E), and sperm motility (F) in four MIR-506 family KO lines. n ≥ 3 and Dunnett’s multiple comparisons test as the post hoc test following one-way ANOVA was used for the statistical analysis. (G) Testicular histology of WT and four MIR-506 family KO lines showing largely normal spermatogenesis. Scale bars = 50 µm. (H) Representative genotyping results of the sequential mating experiments. (I) Sequential mating of WT female mice with mTmG and quinKO males. Upper panel, an overview of the polyandrous mating scheme. ‘mTmG V.S. quinKO’: mTmG male mice mated first; ‘quinKO V.S. mTmG’: quinKO male mice mated first. (J) Percentage of mTmG blastocysts obtained from in vitro fertilization (IVF) using WT MII oocytes and mixed sperm from mTmG (control) and quinKO males at different ratios. Data were based on three independent IVF experiments. The expected ratio was indicated as the blue line. Chi-squared test was used for statistical analyses. * and **** indicate p<0.05 and 0.0001, respectively. (K) Percentage of mTmG embryos obtained from co-artificial insemination using different ratios of mTmG and quinKO sperm. Data were based on nine and three independent AI experiments for the 1:1 and 1:4 sperm ratio (mTmG: quinKO), respectively. The expected ratio is indicated as the blue line. Chi-squared test was used for statistical analyses. *p<0.05.
-
Figure 4—source data 1
The original gel images of the genotyping results of the sequential mating experiments in Figure 4H.
- https://cdn.elifesciences.org/articles/90203/elife-90203-fig4-data1-v1.zip
-
Figure 4—source data 2
The PDF contains Figure 4H and the original gel images labeled with the relevant bands.
- https://cdn.elifesciences.org/articles/90203/elife-90203-fig4-data2-v1.zip
Figure 4—figure supplement 1
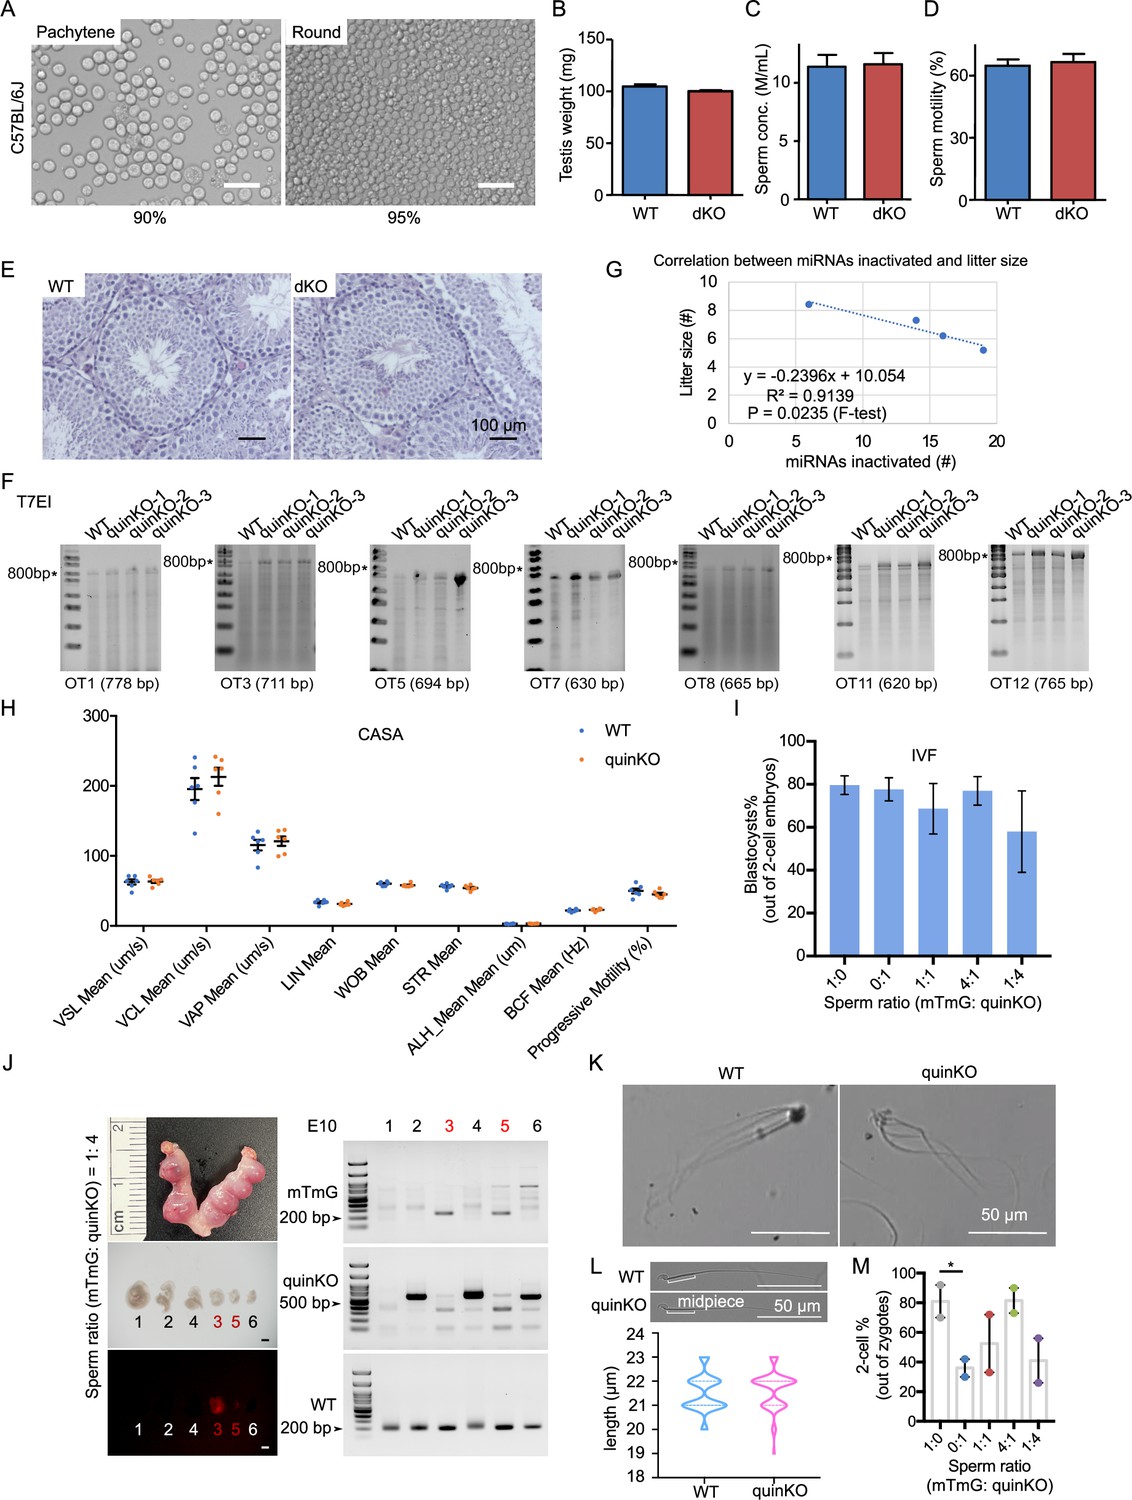
Phenotypes of MIR-506 family KO mice.
(A) The purity of pachytene spermatocytes and round spermatids after STA-PUT cell sorting in C57BL/6J mice. Scale bar = 25 μm. (B) Testis weight of WT and dKO mice. n = 3 for each sample. (C) Sperm concentrations of WT and dKO males. n = 3 for each sample. (D) Sperm motility of WT and dKO. n = 3 for each sample. (E) HE staining of WT and dKO testes. Scale bar = 25 μm. Data presented in panels (B–D) represent mean ± SD, n = 5. (F) T7EI assay on the WT and quinKO mice genomic DNA from tail snips. * indicates 800 bp. (G) Correlation between miRNAs inactivated and litter size in the four KO animal models: Mir465 sKO, tKO, quadKO, and quinKO. (H) Sperm parameters assessed by CASA. n = 6 for each sample. VSL, straight-line velocity; VCL, curvilinear velocity; VAP, average path velocity; LIN, linearity; WOB, wobble VAP/VCL; STR, straightness; ALH, amplitude of lateral head displacement; BCF, beat cross frequency. (I) Percentage of blastocytes developed from WT MII oocytes fertilized by mixed sperm from mTmG (control) and quinKO males at different ratios. Data were based on three independent in vitro fertilization (IVF) experiments. (J) Representative embryos and gel images obtained from the co-artificial insemination at embryonic day 10 (E10) using a sperm ratio (mTmG: quinKO) of 1:4. Left panel, a representative image of the embryos collected at E10; right panel, PCR validation of the embryos’ genotype. Scale bar = 1 mm. (K) Sperm aggregation in WT and quinKO mice. Scale bar = 50 μm. (L) Sperm midpiece size of WT and quinKO mice. Scale bar = 50 μm. At least 70 sperm were counted for each sample. Upper panel, representative images of WT and quinKO sperm. (M) IVF two-cell rate of mTmG and quinKO with different sperm ratios. Two-cell ratios were calculated as the number of two-cell embryos out of the number of zygotes. Data were based on two independent IVF experiments. *p<0.05, paired t-test was used for the statistical analysis.
-
Figure 4—figure supplement 1—source data 1
The original gel images of the T7EI assay on the WT and quinKO mice genomic DNA from tail snips in Figure 4—figure supplement 1F.
- https://cdn.elifesciences.org/articles/90203/elife-90203-fig4-figsupp1-data1-v1.zip
-
Figure 4—figure supplement 1—source data 2
The PDF contains Figure 4—figure supplement 1F and the original gel images labeled with the relevant bands.
- https://cdn.elifesciences.org/articles/90203/elife-90203-fig4-figsupp1-data2-v1.zip
-
Figure 4—figure supplement 1—source data 3
The original gel images of genotyping the E10 embryos from co-artificial insemination in Figure 4—figure supplement 1J.
- https://cdn.elifesciences.org/articles/90203/elife-90203-fig4-figsupp1-data3-v1.zip
-
Figure 4—figure supplement 1—source data 4
The PDF contains Figure 4—figure supplement 1J and the original gel images labeled with the relevant bands.
- https://cdn.elifesciences.org/articles/90203/elife-90203-fig4-figsupp1-data4-v1.zip
Figure 5 with 1 supplement
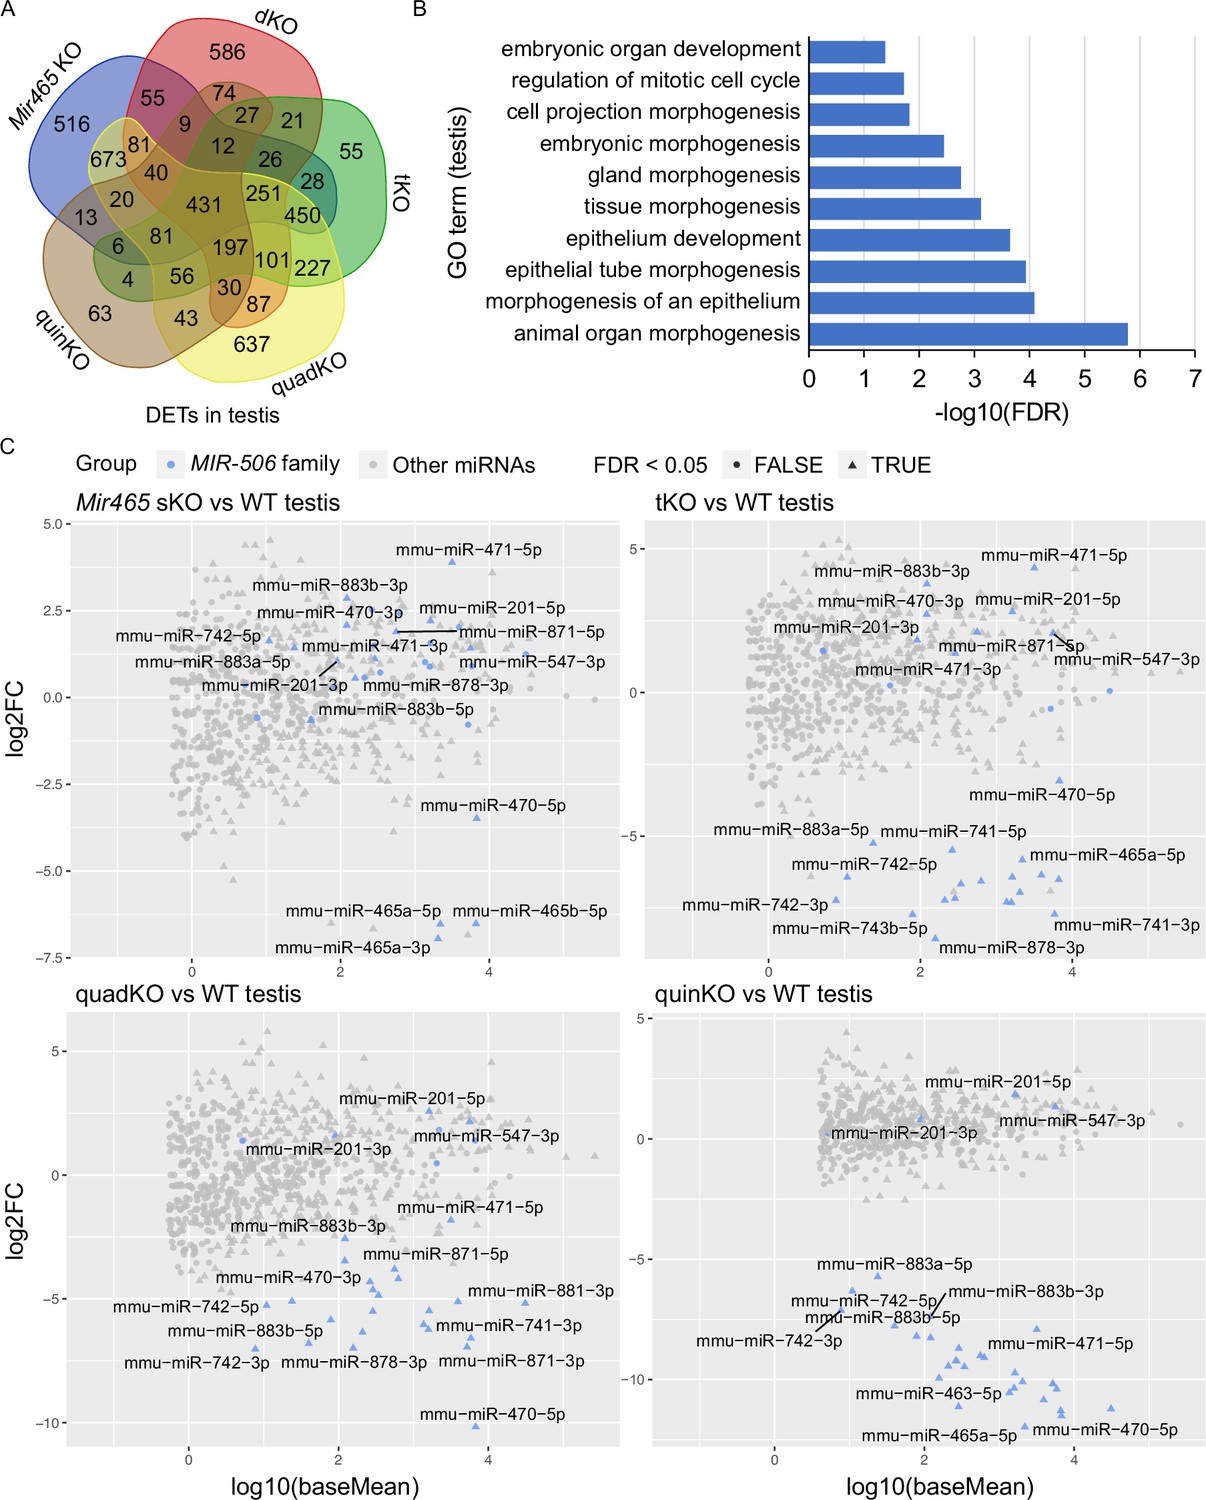
Target genes and genetic compensation of the X-linked MIR-506 family miRNAs.
(A) Intersections of the differentially expressed targets (DETs) among different KO testes. (B) GO term enrichment analyses of the 431 DETs shared among the four different MIR-506 family KO testes. (C) MA plots showing the expression levels of the MIR-506 family miRNAs in WT, sKO, tKO, quadKO, and quinKO testes. Three biological replicates (n = 3) were used for sRNA-seq analyses.
Figure 5—figure supplement 1

Dysregulated targets in the X-linked MIR-506 family KO testes.
(A) Differentially expressed genes (DEGs) between KO and WT testes, n = 3 for each sample. Predicted targets are indicated as the triangle, and the genes with |log2FC| ≥ 1 and false discovery rate (FDR) < 0.05 are labeled in blue. (B) GO term enrichment analyses of the genes fall in differentially expressed (|log2FC| ≥ 1 and FDR < 0.05) and predicted targets, termed as differentially expressed targets (DETs), in KO testes. (C) qPCR validation of differentially expressed genes in the quinKO testis. n = 3 for each sample. * and ** indicate p<0.05 and 0.01, respectively. t-test was used for the statistical analysis. (D) Immunofluorescence of CRISP1 in WT sperm. Scale bar = 50 µm. (E) Western blot of CRISP1 in WT and quinKO testis samples. (F) Luciferase assay of Egr1 3′UTR and MIR-506 family miRNAs from mice. Three biological replicates were done for each sample. Left panel, the predicted binding sites for the MIR-506 family miRNAs and Egr1 3′UTR; right panel, luciferase activity of the MIR-506 family miRNAs and the Egr1 3′UTR. *** and **** indicate adjusted p<0.001 and 0.0001, respectively. One-way ANOVA was used for the statistical analysis. (G) Luciferase assay of Crisp1 3′UTR and MIR-506 family miRNAs from mice. Three biological replicates were done for each sample. Left panel, the predicted binding sites for the MIR-506 family miRNAs and Crisp1 3′UTR; right panel, luciferase activity of the MIR-506 family miRNAs and the Crisp1 3′UTR. *** and **** indicate adjusted p<0.001 and 0.0001, respectively. One-way ANOVA was used for the statistical analysis.
-
Figure 5—figure supplement 1—source data 1
The original Western blot of CRISP1 in WT and quinKO testis samples in Figure 5—figure supplement 1E.
- https://cdn.elifesciences.org/articles/90203/elife-90203-fig5-figsupp1-data1-v1.zip
-
Figure 5—figure supplement 1—source data 2
The PDF contains Figure 5—figure supplement 1E and the original WB images labeled with the relevant bands.
- https://cdn.elifesciences.org/articles/90203/elife-90203-fig5-figsupp1-data2-v1.zip
Figure 6 with 1 supplement
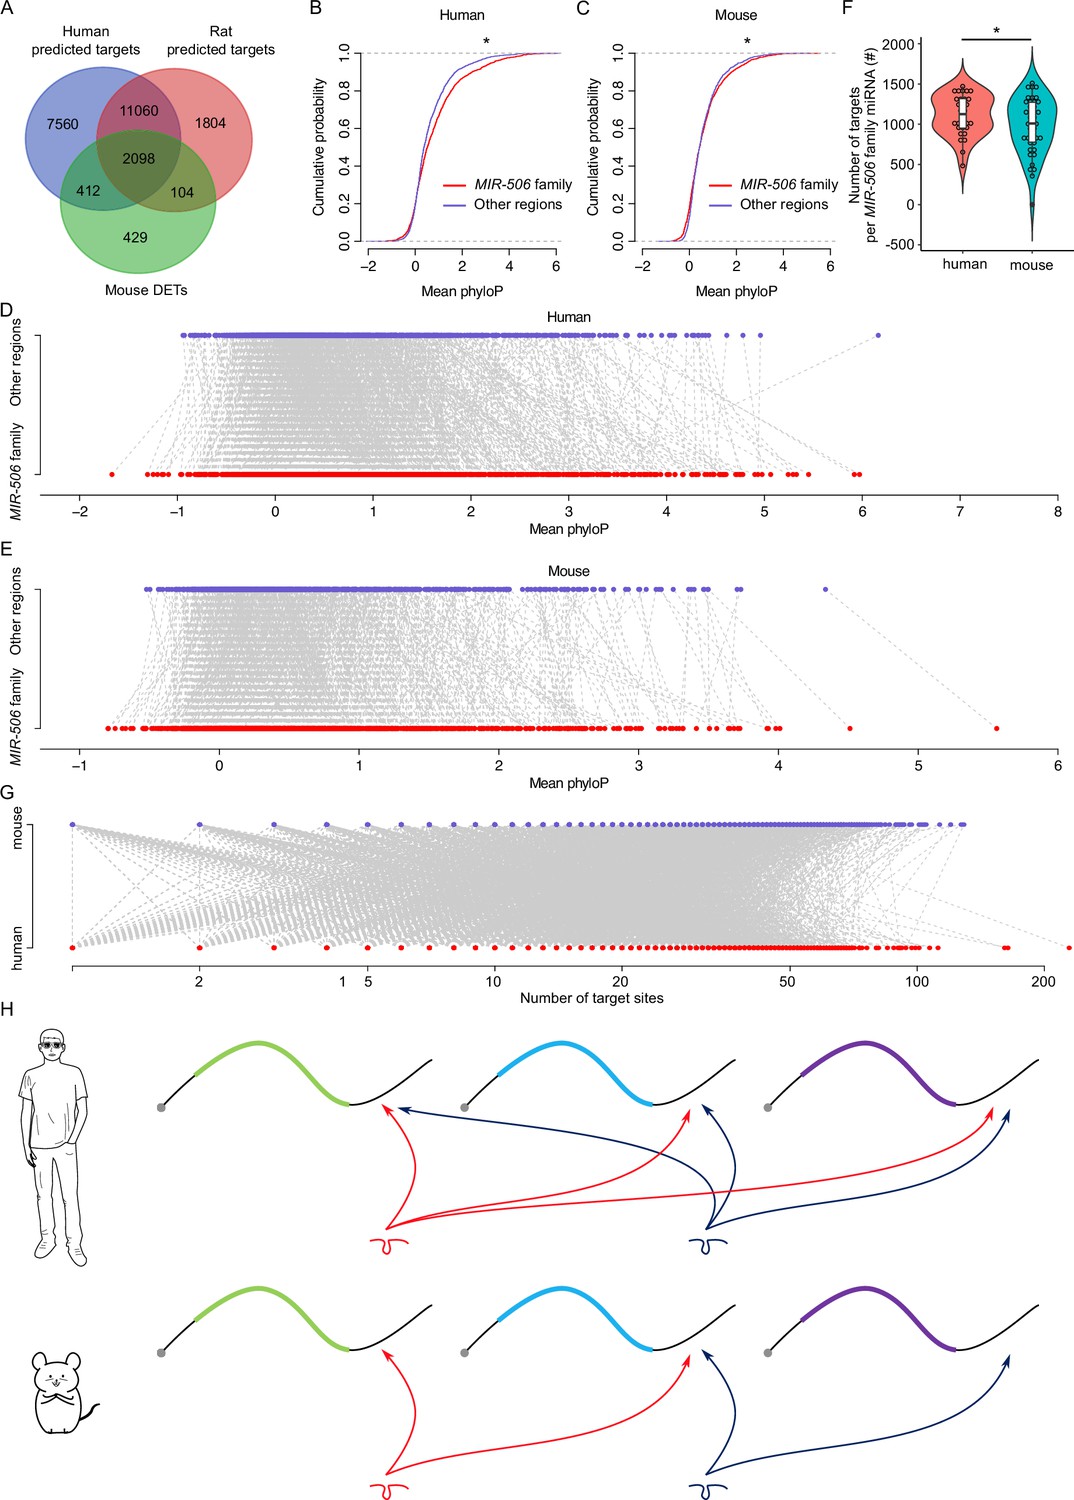
Rapid evolution of the X-linked MIR-506 family miRNAs correlates with increased complexity of genetic networks that regulate spermatogenesis across mammalian species.
(A) Overlap between the dysregulated targets in mice and the predicted targets in humans and rats. (B) Comparison of the cumulative distribution between the MIR-506 family targeting sites and the other regions in humans. *p<0.05; t-test was used for statistical analyses. (C) Comparison of the cumulative distribution between the MIR-506 family targeting sites and the other regions in mice. *p<0.05; t-test was used for statistical analyses. (D) Paired comparison of the PhyloP score between the MIR-506 family targeting sites and the other regions in humans. (E) Paired comparison of the PhyloP score between the MIR-506 family targeting sites and the other regions in mice. (F) Comparison of the number of the targets per miRNA for the X-linked MIR-506 family in mice and humans. *p<0.05; t-test was used for statistical analyses. (G) The number of target sites within individual target mRNAs in both humans and mice. (H) Schematics show that human MIR-506 family miRNAs have more targets relative to those of mice during evolution.
Figure 6—figure supplement 1

Dysregulated targets are shared across humans, mice, and rats.
(A) Luciferase assay of CRISP1 3′UTR and MIR-506 family miRNAs from humans. Three biological replicates were done for each sample. Left panel, the predicted binding sites for the MIR-506 family miRNAs and CRISP1 3′UTR; right panel, luciferase activity of the MIR-506 family miRNAs and the CRISP1 3′UTR. **** indicates adjusted p<0.0001. One-way ANOVA was used for the statistical analysis. (B) Luciferase assay of FMR1 3′UTR and MIR-506 family miRNAs from humans. Three biological replicates were done for each sample. Left panel, the predicted binding sites for the MIR-506 family miRNAs and FMR1 3′UTR; right panel, luciferase activity of the MIR-506 family miRNAs and the FMR1 3′UTR. **** indicates adjusted p<0.0001. One-way ANOVA was used for the statistical analysis. (C) Intersections of predicted targets of the MIR-506 family, without using RNA-seq as a reference, in humans, mice, and rats from four databases: miRWalk, TargetScan, miRDB, and microrna.org. (D) Comparison of the number of the predicted targets, without using RNA-seq as a reference, per miRNA for the X-linked MIR-506 family and all the miRNAs (baseline) in mice and humans. (E) Intersections of human and mouse common targets with transcripts containing MER91C DNA transposon in their 3′UTR in humans and mice.
Author response image 1

sRNA-seq of WT and MIR-506 family KO testis samples.
Additional files
-
Supplementary file 1
The X-linked MIR-506 family miRNAs in different species.
- https://cdn.elifesciences.org/articles/90203/elife-90203-supp1-v1.xlsx
-
Supplementary file 2
TEs analysis for the X-linked MIR-506 family miRNAs.
- https://cdn.elifesciences.org/articles/90203/elife-90203-supp2-v1.xlsx
-
Supplementary file 3
sRNA-seq analysis among different species.
- https://cdn.elifesciences.org/articles/90203/elife-90203-supp3-v1.xlsx
-
Supplementary file 4
Male infertility associated with the X-linked MIR-506 family miRNAs in humans.
- https://cdn.elifesciences.org/articles/90203/elife-90203-supp4-v1.xlsx
-
Supplementary file 5
Dysregulated large RNAs in the X-linked MIR-506 family miRNAs KO mice.
- https://cdn.elifesciences.org/articles/90203/elife-90203-supp5-v1.xlsx
-
Supplementary file 6
Dysregulated small RNAs in the X-linked MIR-506 family miRNAs KO mice.
- https://cdn.elifesciences.org/articles/90203/elife-90203-supp6-v1.xlsx
-
Supplementary file 7
Common targets of the X-linked MIR-506 family miRNAs among humans, mice, and rats.
- https://cdn.elifesciences.org/articles/90203/elife-90203-supp7-v1.xlsx
-
Supplementary file 8
Primers used in this study.
- https://cdn.elifesciences.org/articles/90203/elife-90203-supp8-v1.xlsx
-
MDAR checklist
- https://cdn.elifesciences.org/articles/90203/elife-90203-mdarchecklist1-v1.docx
Download links
A two-part list of links to download the article, or parts of the article, in various formats.
Downloads (link to download the article as PDF)
Open citations (links to open the citations from this article in various online reference manager services)
Cite this article (links to download the citations from this article in formats compatible with various reference manager tools)
The rapidly evolving X-linked MIR-506 family fine-tunes spermatogenesis to enhance sperm competition
eLife 13:RP90203.
https://doi.org/10.7554/eLife.90203.3


