Interplay between charge distribution and DNA in shaping HP1 paralog phase separation and localization
- Artie McFerrin Department of Chemical Engineering, Texas A&M University, United States
- Center for Materials Physics and Technology, Naval Research Laboratory, United States
- Department of Chemistry and Biochemistry, University of California, San Diego, United States
- Department of Chemistry, Texas A&M University, United States
- Interdisciplinary Graduate Program in Genetics and Genomics, Texas A&M University, United States
Figures
Figure 1
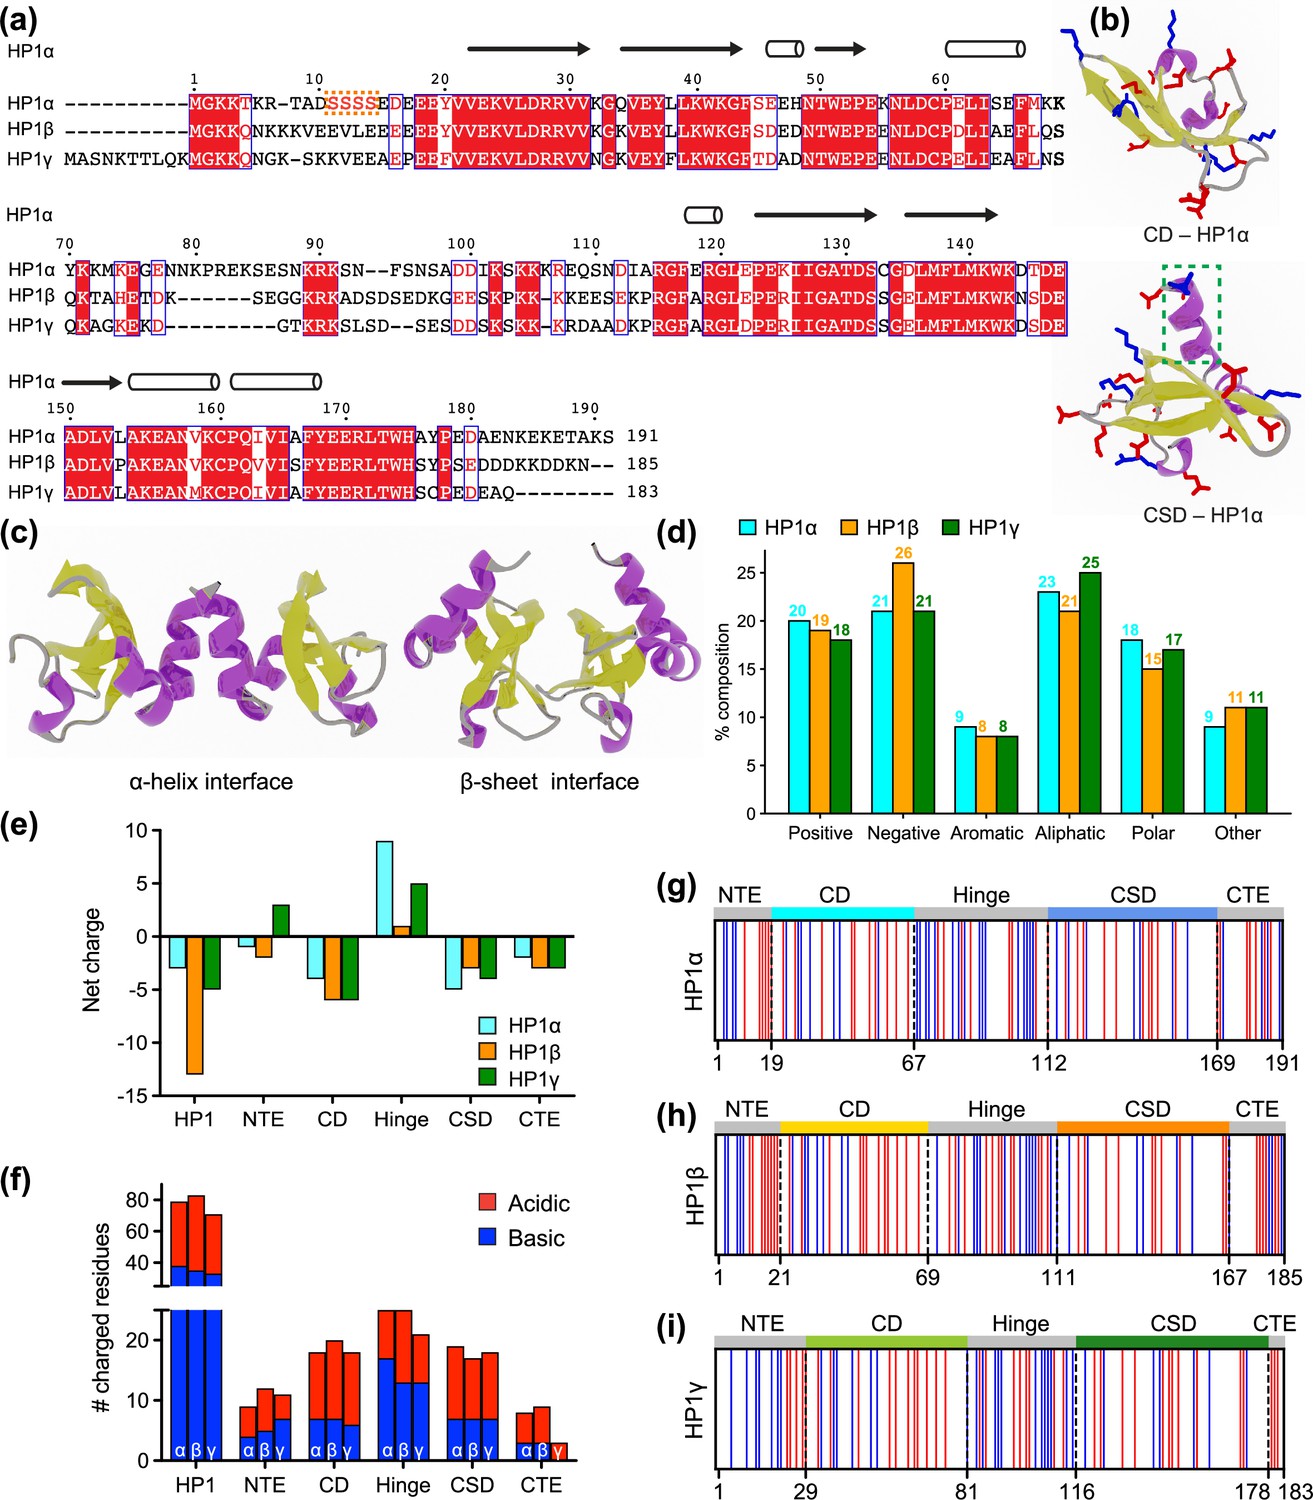
Properties of human heterochromatin protein 1 (HP1) paralogs.
(a) Multiple sequence alignment of human HP1α, HP1β, and HP1γ. Red boxes with white letters show identical amino acids, while white boxes with red letters indicate amino acids with similar properties. The orange box highlights the unique block of four serine residues in HP1α NTE that can be constitutively phosphorylated in vivo. (b) Structures of the HP1α chromo (CD – PDB code 3fdt) and chromoshadow (CSD – PDB code 3i3c) domains. Positively and negatively charged residues are shown in blue and red licorice representations, respectively. The green dashed box marks the additional helix in the chromoshadow domain (CSD) compared to the chromodomain (CD). (c) HP1α CSD-CSD homodimer can dimerize via α-helix and β-sheet binding interfaces. (d) Amino acid composition of HP1 paralogs is organized into Positive (Arg, Lys), Negative (Asp, Glu), Aromatic (His, Phe, Tyr, Trp), Aliphatic (Ala, Ile, Leu, Met, Val), Polar (Asn, Gln, Ser, Thr), and Other (Cys, Gly, Pro). (e, f) Differences in the net charge and charged amino acids content of each domain of the HP1 paralogs. (g, h, i) Charge distribution in the sequences of the HP1 paralogs (blue = positively charged residues, red = negatively charged residues).
Figure 2 with 5 supplements
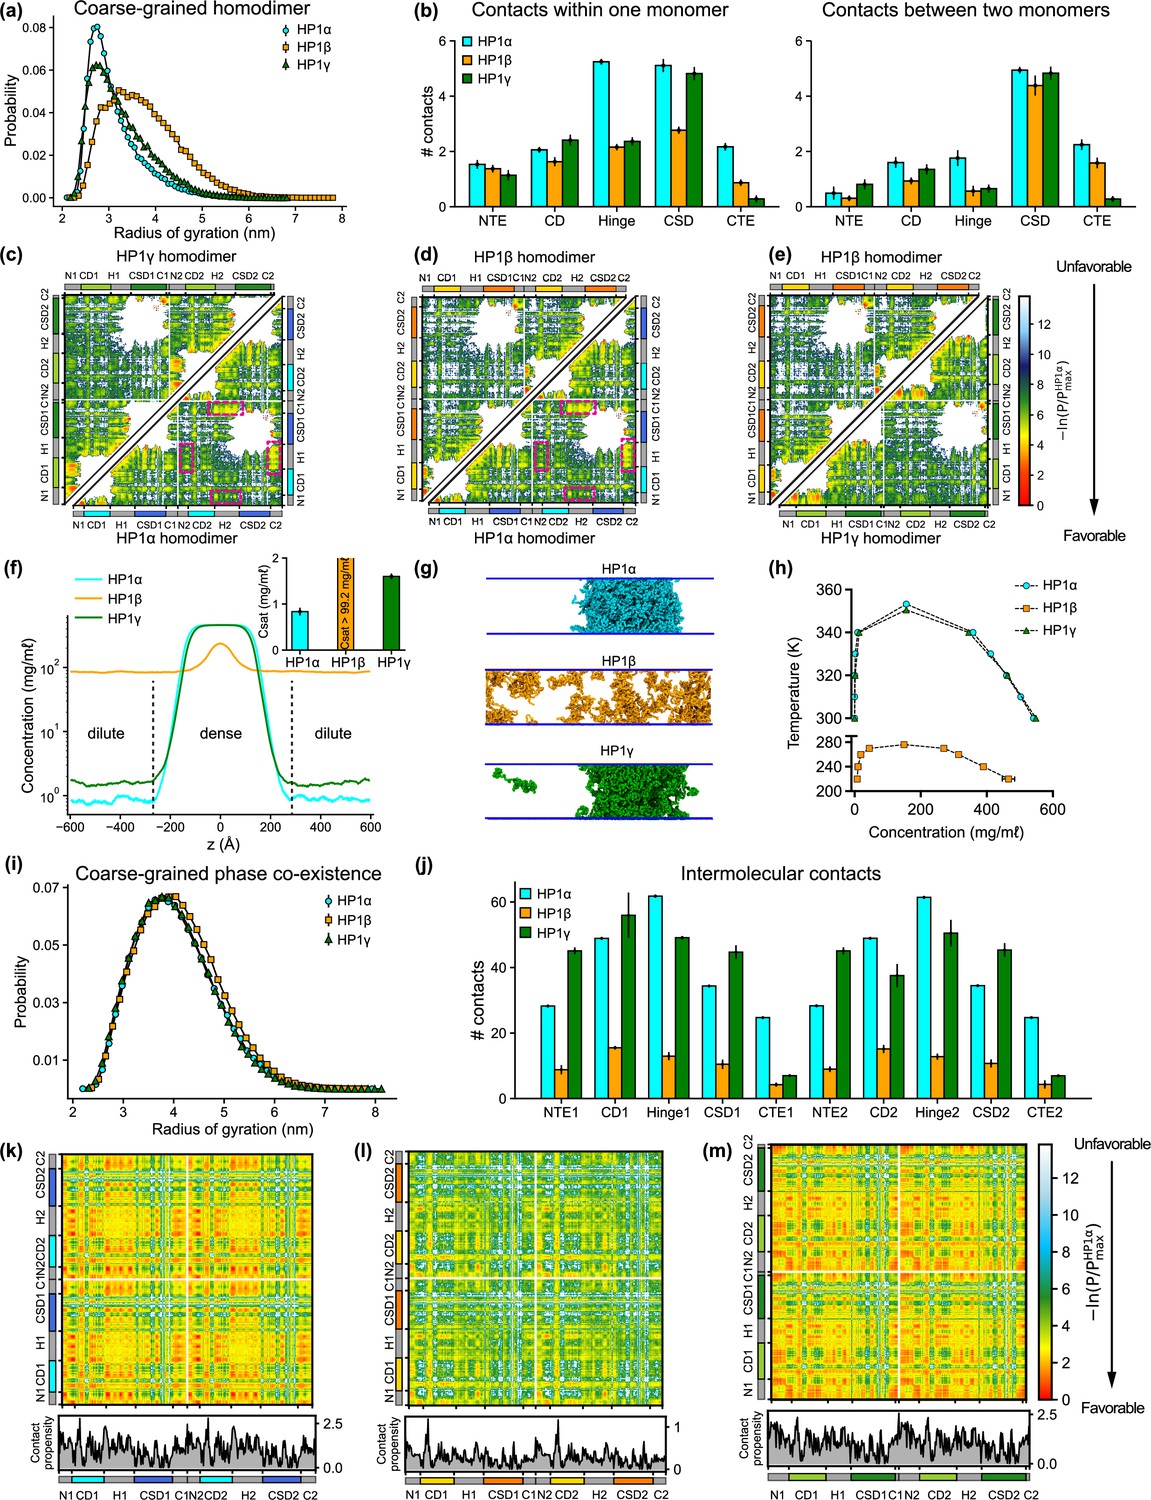
Sequence differences result in differences in conformation and phase separation of heterochromatin protein 1 (HP1) paralogs.
(a) Rg distributions of HP1 paralogs in coarse-grain (CG) single homodimer simulations using the HPS-Urry model. (b) Average intramolecular contacts within one chain and average intermolecular contacts between two chains on each domain of the three HP1 paralogs. Two residues were considered to be in contact if the distance between them was less than 1.5 of their vdW arithmetic mean. (c, d, e) Pairwise two-dimensional (2D) contact maps between two HP1 homodimers. The intramolecular interactions within one monomer and the intermolecular interactions between two monomers are shown in the two small triangles and the off-diagonal quadrant, respectively. The contact propensity of HP1β and HP1γ is normalized to the highest contact propensity of HP1α. The magenta boxes highlight strong electrostatic attractions between the hinge and C terminal extension (CTE) regions in HP1α. (f) Density profiles of HP1 paralogs in CG coexistence simulations. The inset shows the respective saturation concentrations. (g) Representative snapshots of each system in the CG coexistence simulations. (h) Phase diagrams of HP1 paralogs at different temperatures calculated in CG simulations where a dilute phase of free monomers co-exists with a dense phase. The critical temperatures of HP1α, HP1β, and HP1γ are 353.3 K, 276.1 K, and 350.5 K, respectively. (i) Rg distributions of the HP1 paralogs as calculated in the CG phase coexistence simulations. (j) Average intermolecular contacts made by each domain of the HP1 paralogs in CG phase coexistence simulations. The error bars represent the standard deviation from triplicate simulation sets. (k, l, m) Intermolecular contacts within the condensed phase of HP1 paralogs along the sequence of each homodimer. The panels below each map show the average contacts per chain as a function of residue number. The contact propensity of HP1β and HP1γ is normalized to the highest contact propensity of HP1α. (a-e) show the results obtained under dilute conditions, while (f–m) illustrates the conditions of phase coexistence. The CG simulations under dilute and phase coexistence conditions were conducted using the HPS-Urry model at 320 K and 100 mM salt concentration.
Figure 2—figure supplement 1
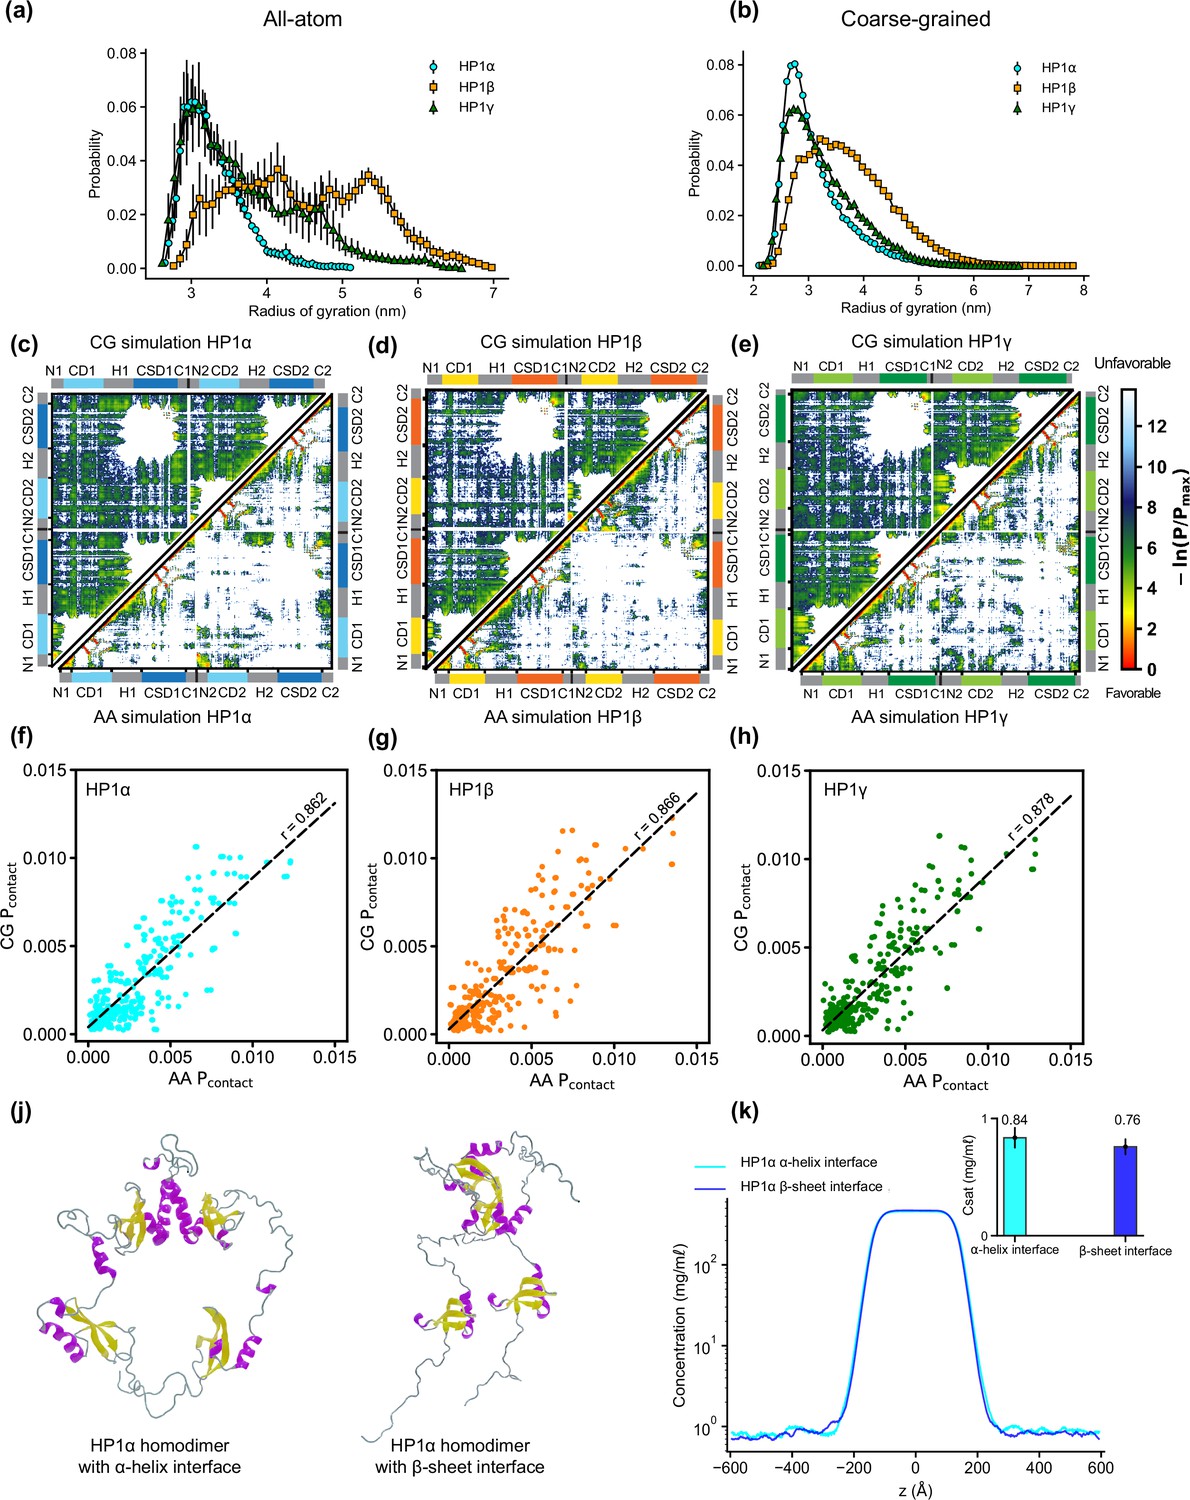
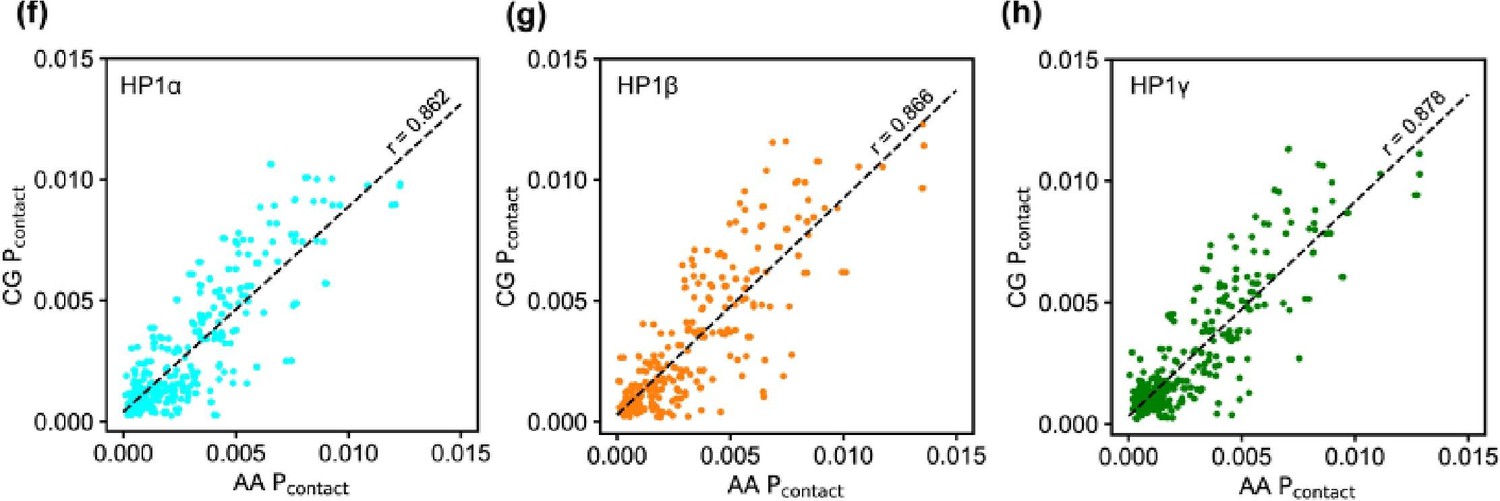
AA and CG simulations of heterochromatin protein 1 (HP1) paralogs.
(a, b) Rg distributions of HP1 paralogs in all-atom (AA) and coarse-grained (CG) simulations. Errors of the Rg distributions are estimated using block averages with five blocks. (c, d, f) Contact maps for HP1 paralogs from all-atom simulations (bottom triangle) and coarse-grained simulations (top triangle). (f, g, h) Correlation of contact probability per residue between AA and CG simulations of the three HP1 paralogs. Pearson correlation coefficient (r) is shown above the regression line. Panels (a–h) present the results from AA and CG simulations under dilute conditions. (j) Full-length HP1α homodimers in which the chromoshadow domain (CSD)-CSD domains dimerize via α-helix or β-sheet binding interfaces. (k) Density profiles of the two HP1α configurations in the CG phase coexistence simulations, conducted using the HPS-Urry model at 320 K and 100 mM salt concentration. The inset shows the saturation concentrations. The error bars represent the standard deviation from triplicate simulation sets.
Figure 2—figure supplement 2
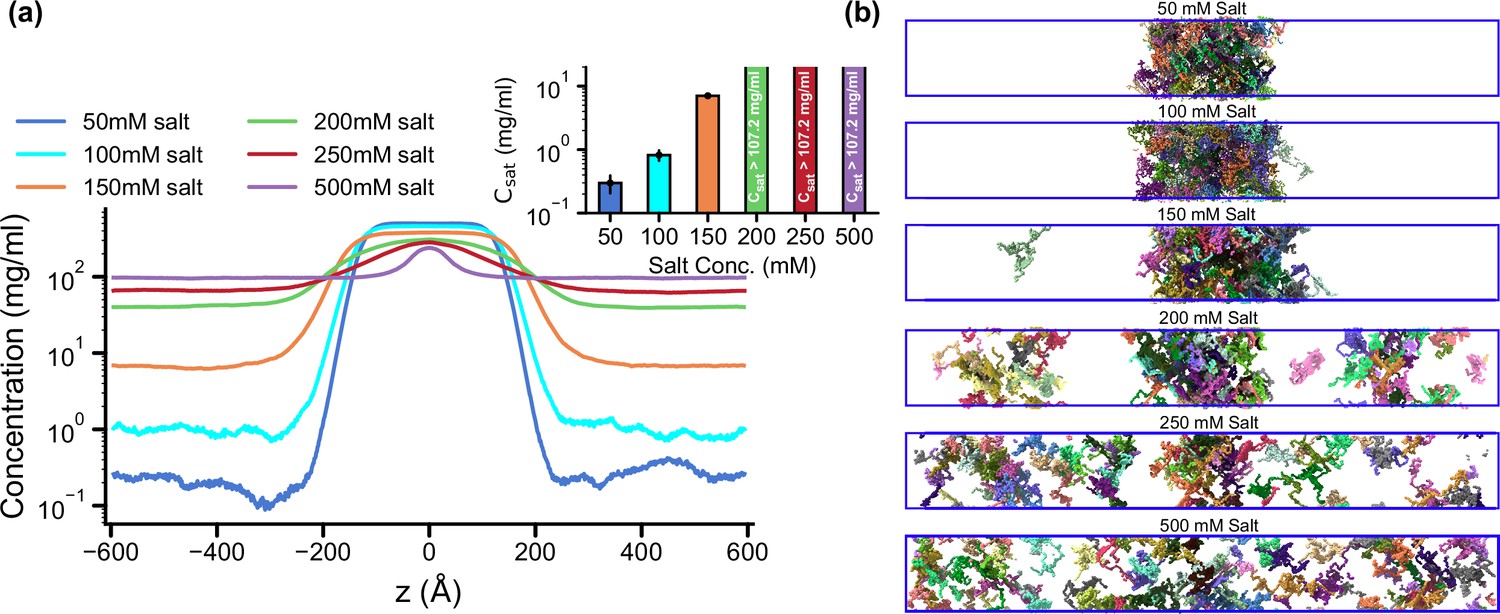
Salt-dependent effects on the liquid-liquid phase separation (LLPS) of HP1α homodimers.
(a, b) Density profiles and snapshots of HP1α homodimer simulations with box dimensions of 170 × 170 × 1190 Å3 at differing salt concentrations, 50, 100, 150, 200, 250, and 500 mM, respectively. The simulations were conducted at 320 K using the HPS-Urry model. The error bars represent the standard deviation from triplicate simulation sets.
Figure 2—figure supplement 3
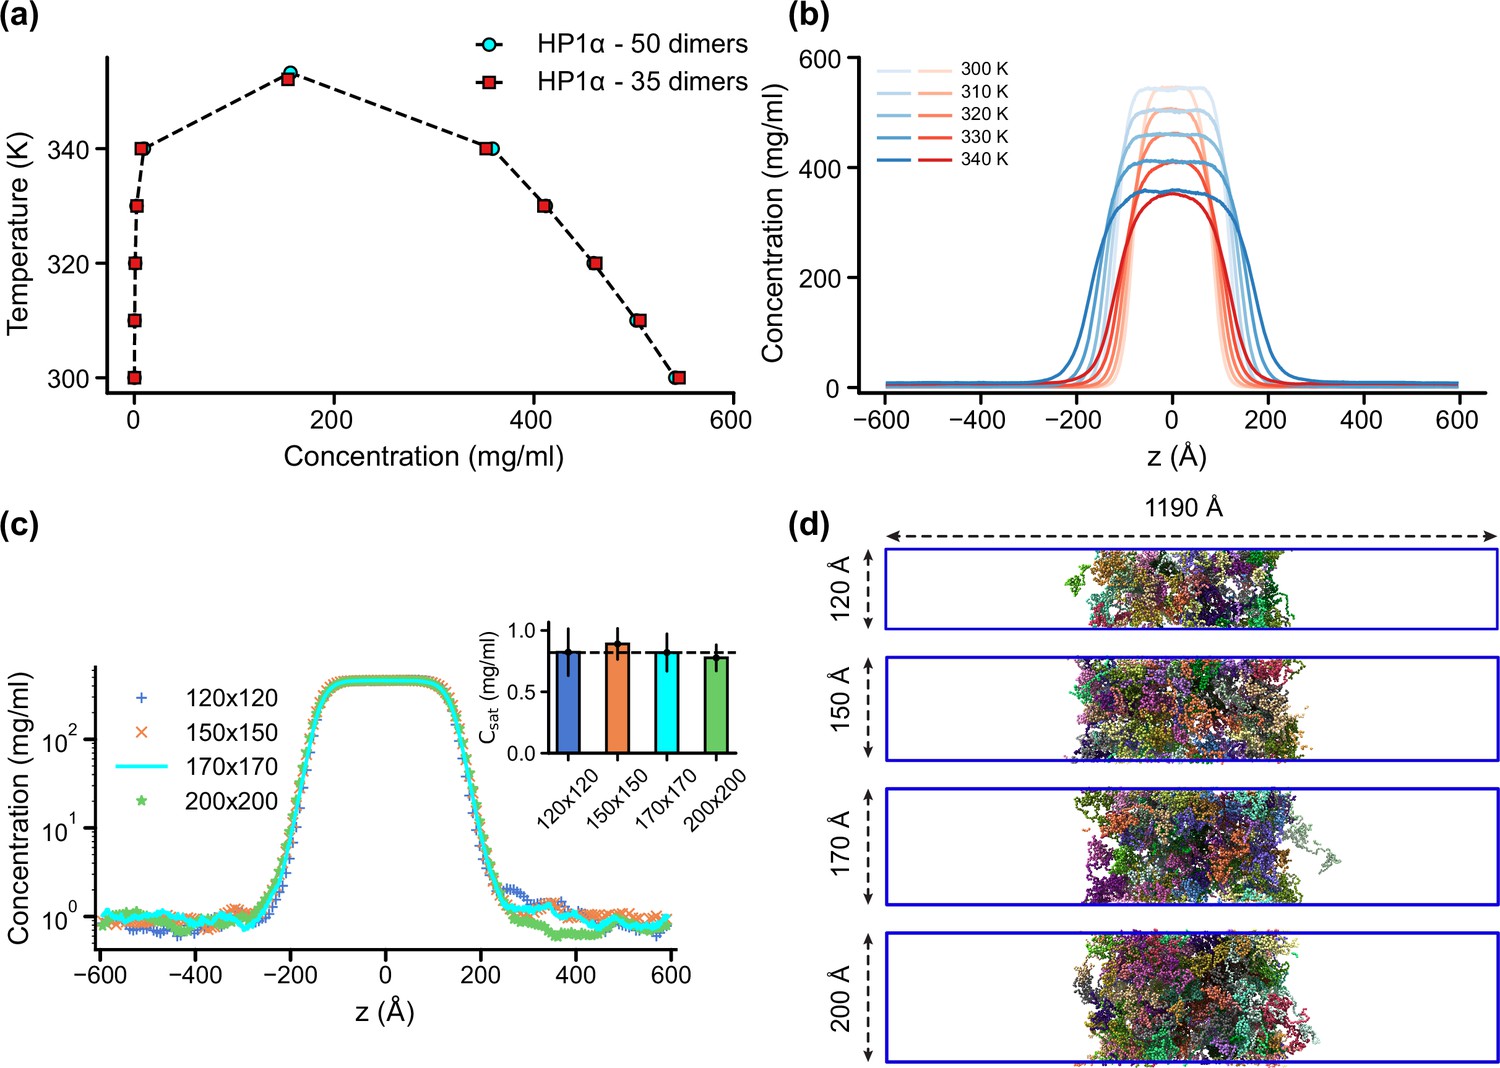
Finite-size analysis.
(a) Phase diagrams for the HP1α homodimer (50 dimers) and for a system reduced in size by 30% (35 dimers), with the critical temperatures of 353.3 K and 352.1 K, respectively. (b) Density profiles of HP1α and its reduced size counterpart at various temperatures (blue – 50 dimers, red – 35 dimers). (c, d) Density profiles and snapshots of HP1α homodimer simulation with box dimensions of 170 × 170 × 1190 Å3 and for the systems with the z-direction length fixed at 1190 Å and varying cross-sectional areas: 120 × 120, 150 × 150, and 200 × 200 Å2. The black dashed line shows the simulated saturation concentration of wild-type HP1α homodimer in the box dimensions of 170 × 170 × 1190 Å3. The simulations were conducted at 320 K and 100 mM salt concentrations. The error bars represent the standard deviation from triplicate simulation sets.
Figure 2—video 1
Coarse-grain (CG) simulations of single-chain heterochromatin protein 1 (HP1) paralogs.
Figure 2—video 2
Coarse-grain (CG) phase coexistence simulations of heterochromatin protein 1 (HP1) paralogs.
Figure 3 with 1 supplement
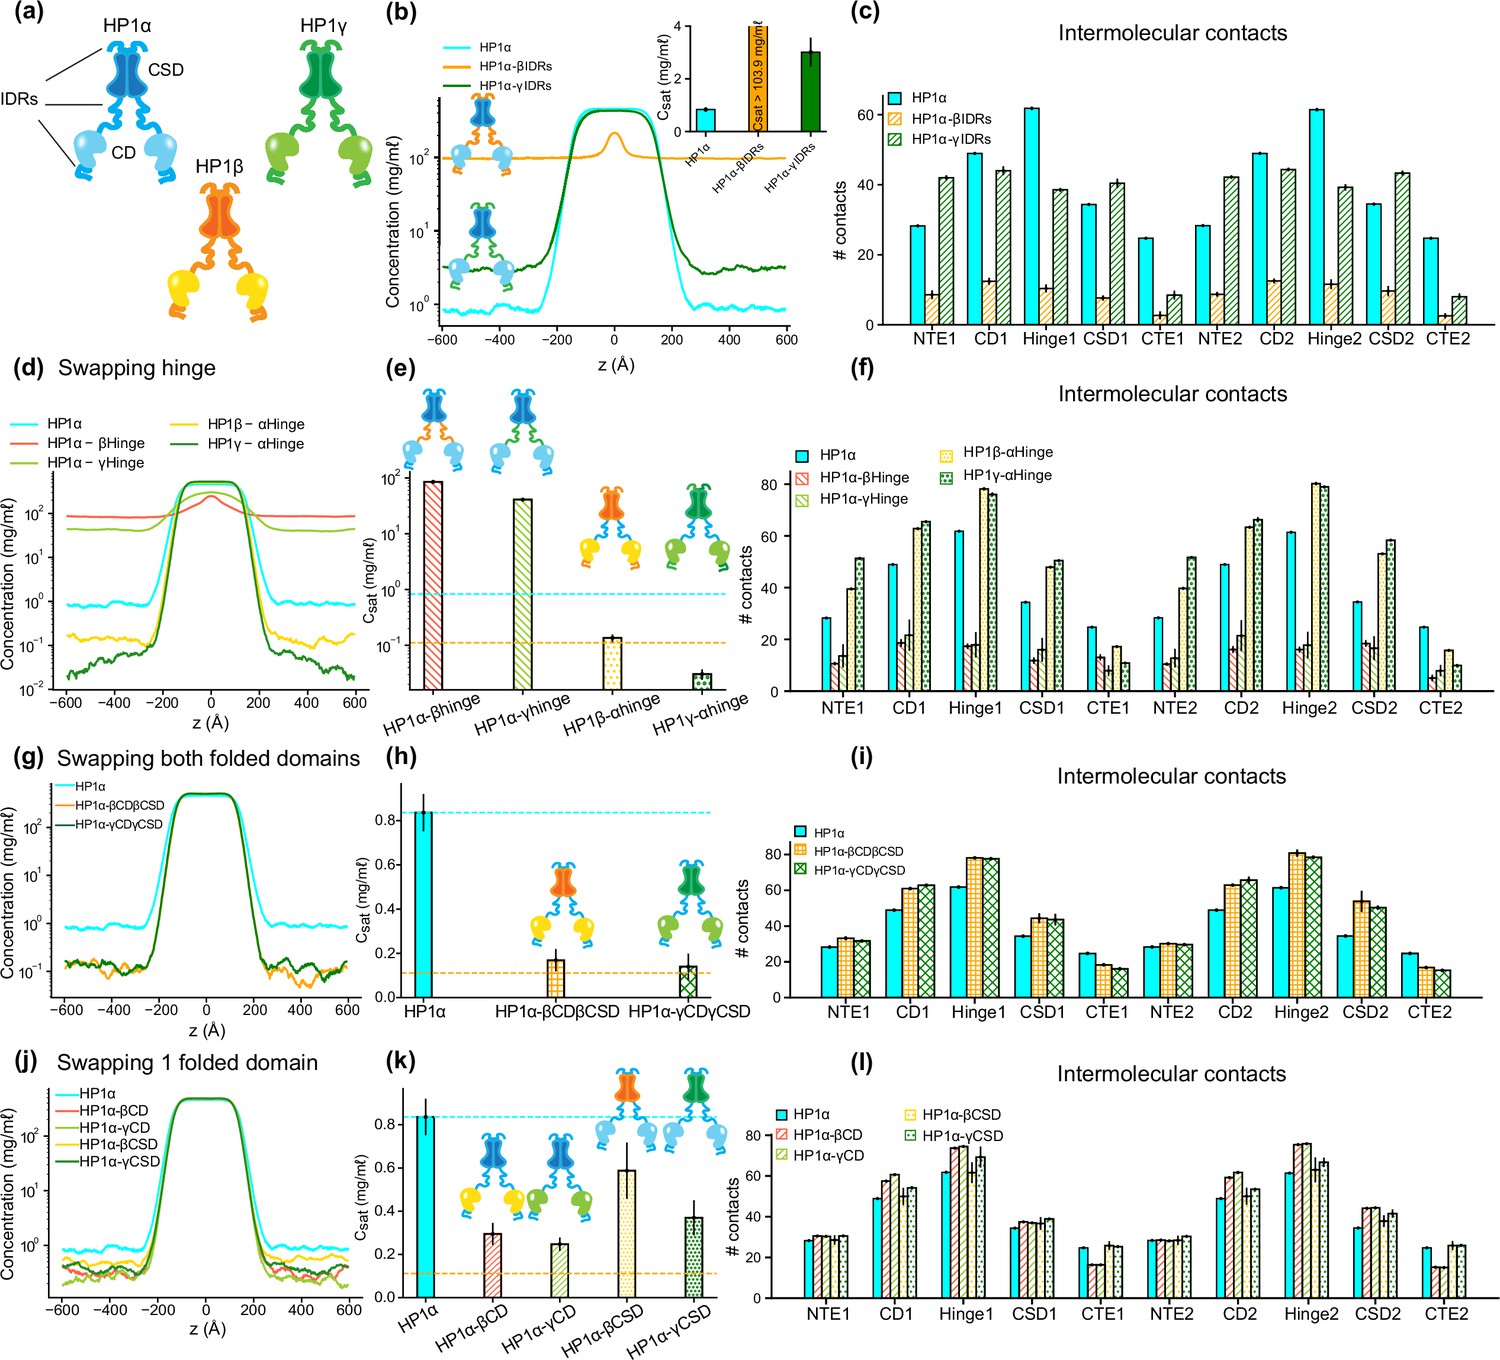
The interplay of intrinsically disordered regions (IDRs) and folded domains in mediating phase separation of heterochromatin protein 1 (HP1) paralogs.
(a) Cartoons representing the three human HP1 paralogs. (b, c) Density profiles, saturation concentrations (inset), and average contacts made by each domain of HP1α with IDRs replaced with those from HP1β or HP1γ. (d, e, f) Density profiles, saturation concentrations, and average contacts made by each domain of HP1α chimeras whose hinge was swapped with the hinge from either HP1β or HP1γ(HP1α-βHinge and HP1α-γHinge, respectively),and HP1β and HP1γ chimeras whose hinge regions were replaced with the hinge of HP1α (HP1β-αHinge or HP1γ-αHinge, respectively). (g, h, i) Density profiles, saturation concentrations, and average contacts made by each domain of HP1α chimeras with folded domains replaced with those from HP1β or HP1γ (HP1α-βCDβCSD and HP1α-γCDγCSD, respectively). (j, k, l) Density profiles, saturation concentrations, and average contacts made by each domain of HP1α chimeras with either chromodomain (CD) or chromoshadow domain (CSD) replaced with the corresponding domain from HP1β (HP1α-βCD and HP1α-βCSD, respectively) or HP1γ (HP1α-γCD and HP1α-γCSD, respectively). The cyan and orange dashed lines show the simulated saturation concentrations of wild-type HP1α and pHP1α, respectively. The error bars represent the standard deviation from triplicate simulation sets. The coarse-grain (CG) coexistence simulations were conducted using the HPS-Urry model at 320 K and 100 mM salt concentration.
Figure 3—figure supplement 1

Intermolecular interactions of heterochromatin protein 1 (HP1) chimeras within the condensed phase.
Intermolecular contact maps within the condensed phase of (a) wild-type HP1α, (b, c) chimeras in which the HP1α hinge was swapped with the hinge of HP1β or HP1γ, and (d, e) HP1α chimeras whose folded domains were replaced with those from either HP1β or HP1γ. (e, f) The number of basic and acidic residues and the total solvent-accessible surface areas (SASA) of basic and acidic residue on the chromodomain (CD) domain of HP1 paralogs. (h, i, j, k) Intermolecular contact maps of HP1α constructs whose CD or chromoshadow domain (CSD) was replaced with the corresponding folded domain from either HP1β (HP1α-βCD and HP1α-βCSD, respectively) or HP1γ (HP1α-γCD and HP1α-γCSD, respectively).
Figure 4 with 1 supplement
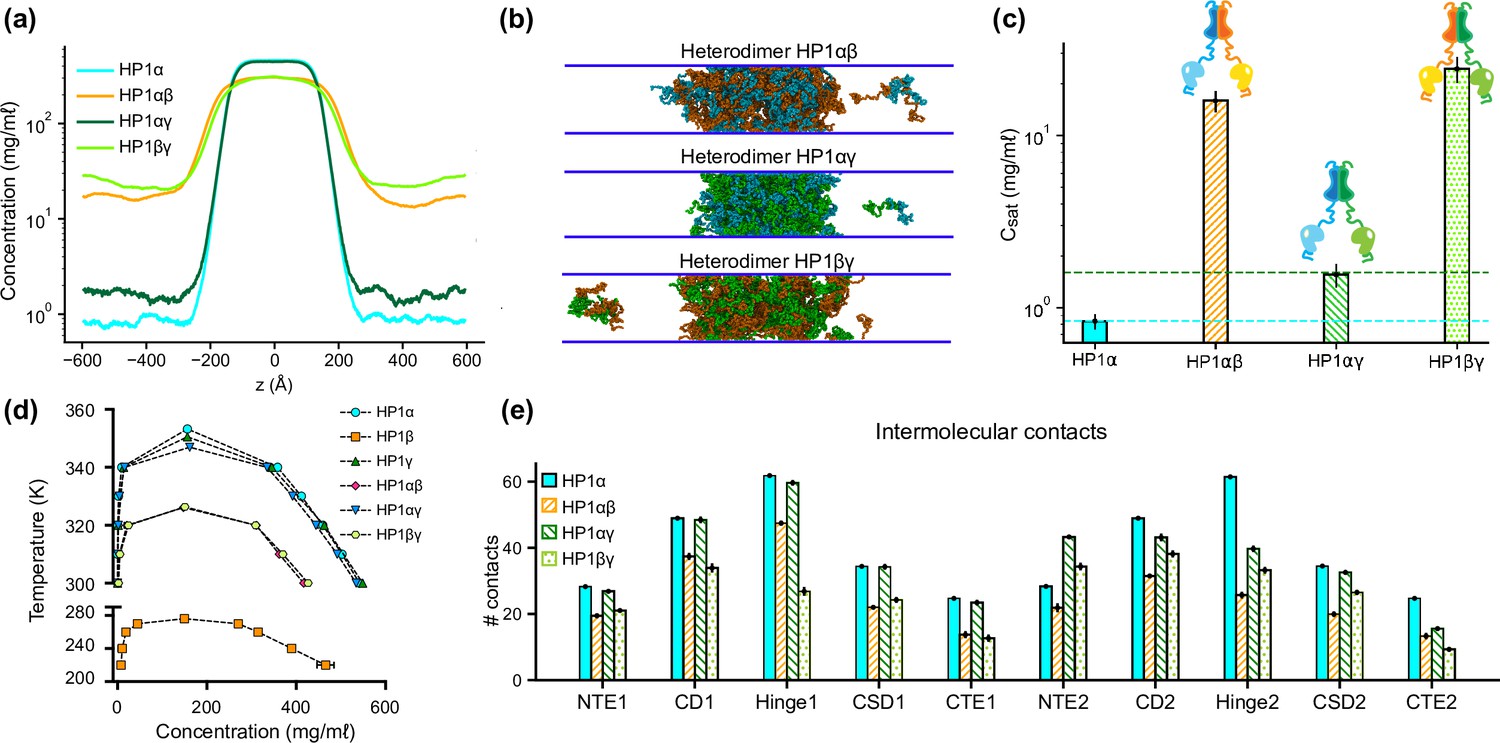
Phase separation of heterochromatin protein 1 (HP1) heterodimers.
(a, b, c) Density profiles, snapshots of the condensates, and saturation concentrations in the coarse-grain (CG) coexistence simulations performed with heterodimers HP1αβ, HP1αγ, and HP1βγ. (d) Phase diagram of HP1 heterodimer phase separation conducted at different temperatures. (e) Average intermolecular contacts for each domain of the HP1 heterodimers in CG coexistence simulations. The error bars represent the standard deviation from triplicate simulation sets. The CG coexistence simulations were conducted using the HPS-Urry model at 320 K and 100 mM salt concentration.
Figure 4—figure supplement 1
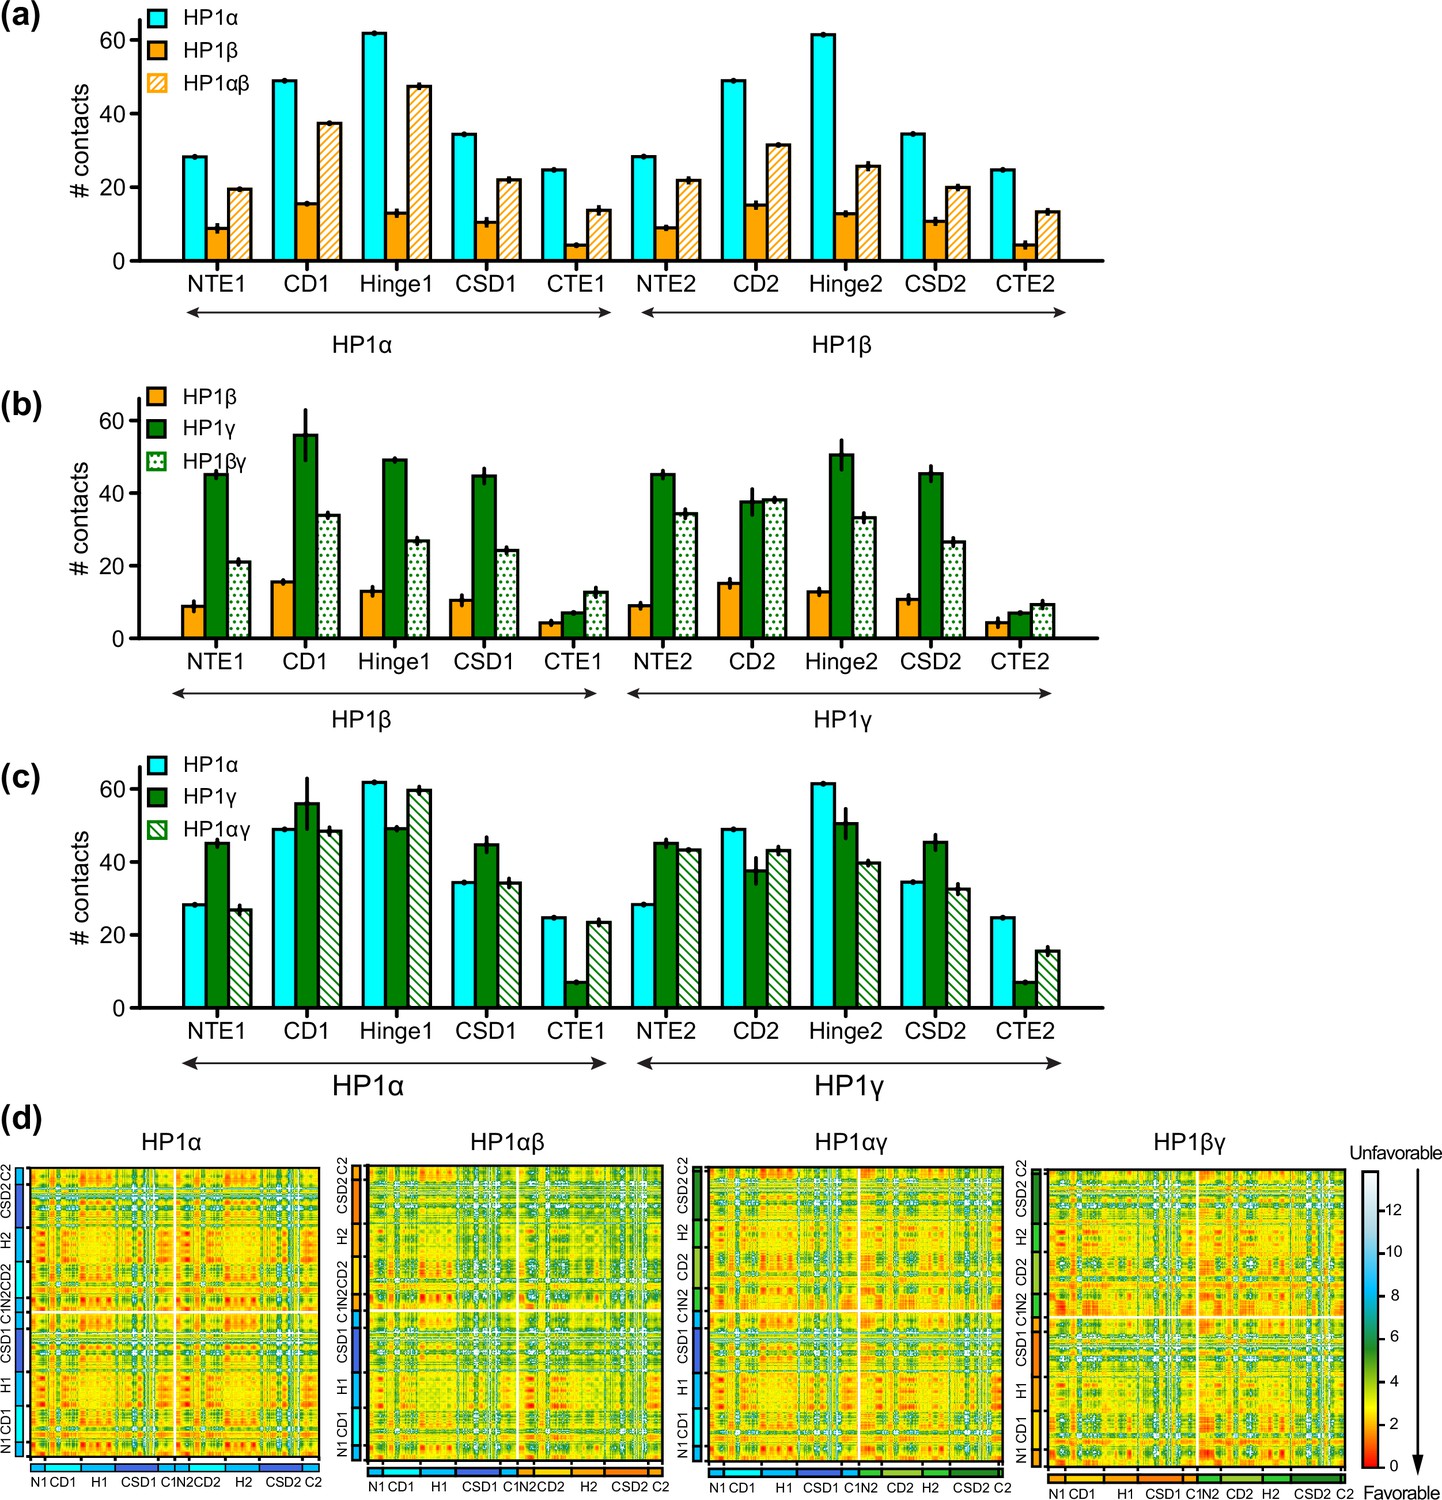
Intermolecular interactions of heterochromatin protein 1 (HP1) heterodimers within the condensed phase.
(a, b, c) Intermolecular contacts of different domains within condensates comprised of HP1αβ heterodimers (compared to HPα and HP1β homodimers), HP1αγ heterodimers (compared to HPα and HP1γ homodimers), and HP1βγ heterodimers (compared to HPβ and HP1γ homodimers). The labels under each plot mark the regions of the monomers in the heterodimer. The error bars represent the standard deviation from triplicate simulation sets. (d) Two-dimensional (2D) intermolecular contact maps within condensates comprised of HP1α homodimers or HP1αβ, HP1αγ, and HP1βγ heterodimers.
Figure 5 with 1 supplement
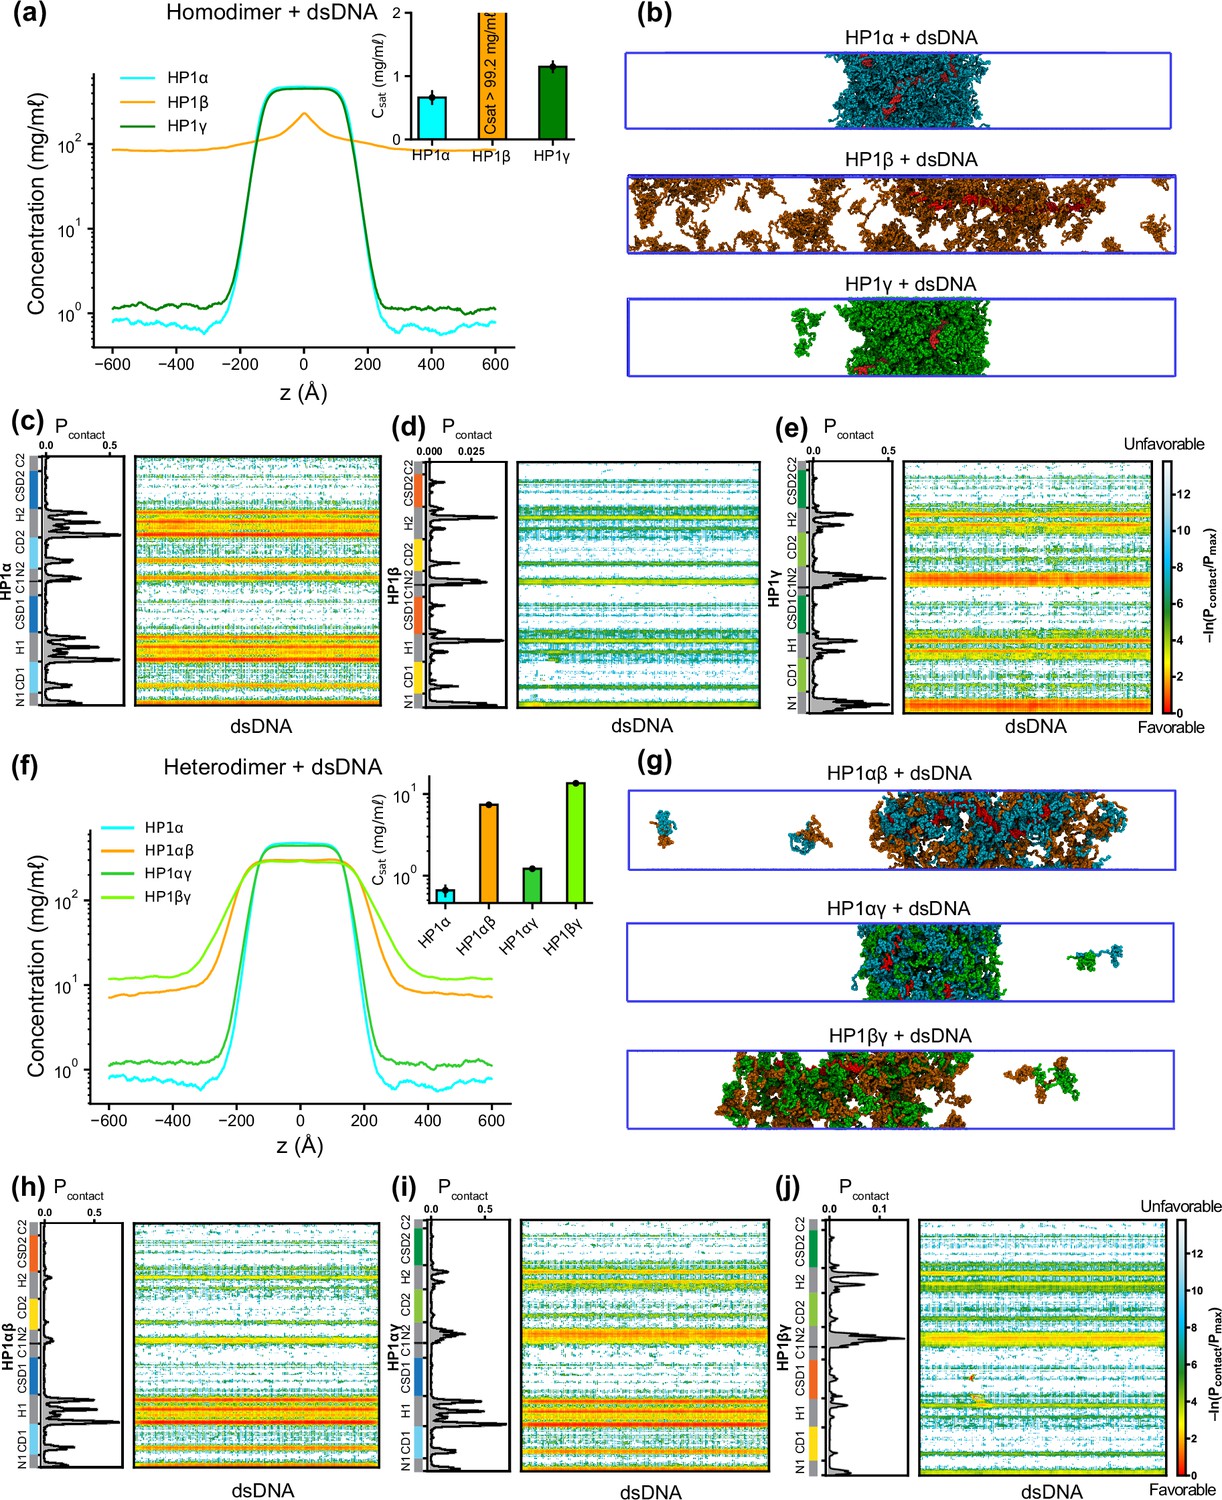
Phase separation of heterochromatin protein 1 (HP1) homo- and heterodimers with DNA.
(a, b) Density profiles, saturation concentrations (inset), and snapshots of HP1 paralogs with one chain of 147 bp double-stranded DNA in the coarse-grain (CG) coexistence simulations. (c, d, e) Intermolecular contacts between HP1 homodimers and DNA. (f, g) Density profiles, saturation concentrations (inset), and snapshots of HP1 heterodimers with one chain of 147 bp double-stranded DNA in the CG coexistence simulations. (h, i, j) Intermolecular contacts between HP1 heterodimers and DNA. Preferential interactions between HP1 protein and DNA are shown in red. The error bars represent the standard deviation from triplicate simulation sets. The CG coexistence simulations were conducted using the HPS-Urry model at 320 K and 100 mM salt concentration.
Figure 5—video 1
Coarse-grain (CG) phase coexistence simulations of heterochromatin protein 1 (HP1) paralogs with dsDNA.
Figure 6 with 2 supplements
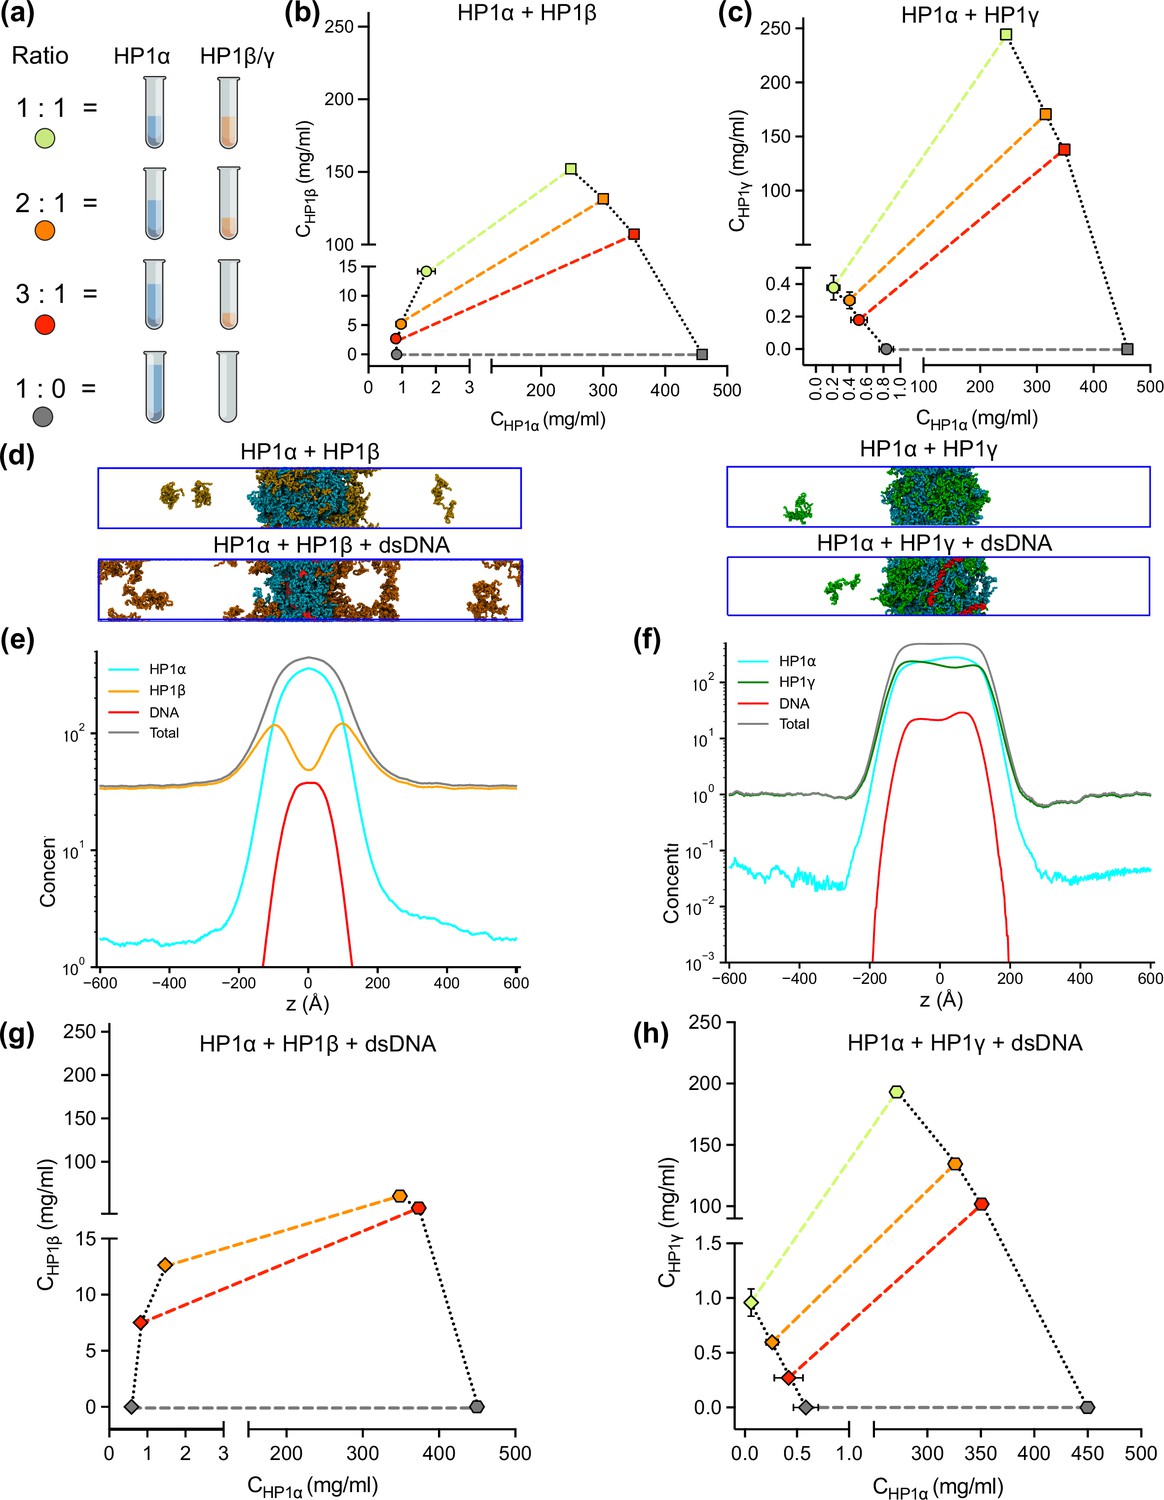
DNA regulates the condensation of heterochromatin protein 1 (HP1) paralog mixtures.
(a) Schematic of the ratios of HP1α and HP1β (or HP1γ) used to generate multicomponent phase diagrams. The total concentration of the mixture was fixed in all cases. (b, c) Multicomponent phase diagrams of HP1α mixing with HP1β (or HP1γ). The color code corresponds to the ratios shown in the schematic in (a). The circles and the squares show the protein concentrations in the dilute and the dense phases, respectively. The tie line (colored dashed line) connects the concentrations in the dense and dilute phases for each ratio. Phase existence lines (black dotted lines) define the two arms of the phase diagram at low and high concentrations. (d) Snapshots of the condensates in the coarse-grain (CG) coexistence simulations of HP1α+HP1β and HP1α+HP1γ mixtures at an equimolar concentration in the absence and presence of dsDNA. (e, f) The density profiles of the mixtures at an equimolar concentration in the presence of dsDNA. (g, h) Multicomponent phase diagrams of HP1α mixing with HP1β or HP1γ in the presence of DNA. The 1:1 ratio data points for HP1α and HP1β mixing with DNA were excluded in (g) due to the instability of the condensate. The diamonds and the hexagons show the protein concentrations in the dilute and the dense phases, respectively. The error bars represent the standard deviation from triplicate simulation sets. The CG coexistence simulations were conducted using the HPS-Urry model at 320 K and 100 mM salt concentration.
Figure 6—video 1
Coarse-grain (CG) phase coexistence simulations of HP1α+HP1β and HP1α+HP1γ mixtures at an equimolar concentration.
Figure 6—video 2
Coarse-grain (CG) phase coexistence simulations of HP1α+HP1β and HP1α+HP1γ mixtures at an equimolar concentration in the presence of dsDNA.
Figure 7 with 2 supplements
Distinct interaction patterns of heterochromatin protein 1 (HP1) paralogs influence the localization patterns of HP1α, HP1β, and HP1γ in the absence and presence of DNA.
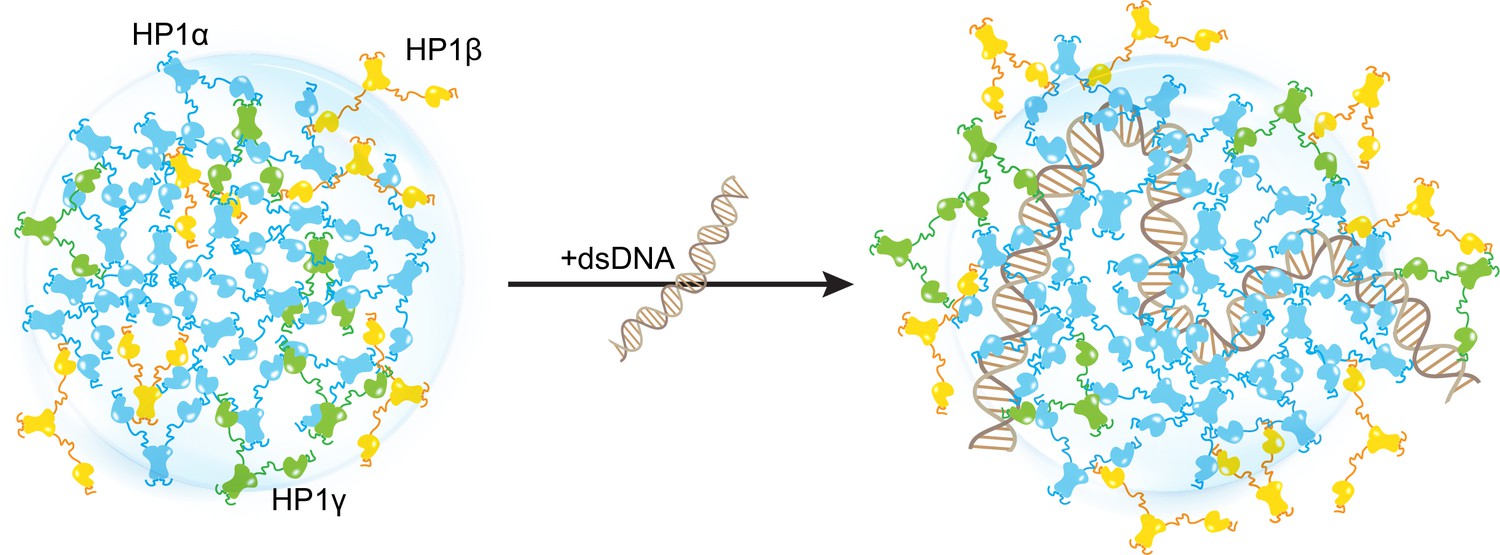
Figure 7—figure supplement 1

Model of heterochromatin protein 1 (HP1) paralogs influences chromatin organization via liquid-liquid phase separation (LLPS).
Figure 7—video 1
Coarse-grain (CG) simulations of the droplet of HP1 paralogs (HP1α+HP1β+HP1γ mixture) in the absence and presence of dsDNA.
Author response image 1

Salt-dependent effects on the LLPS of HP1α homodimer.
(a, b) Density profiles and snapshots of HP1α homodimer simulation with the box dimensions of 170x170x1190 Å3 at differing salt concentrations, 50, 100, 150, 200, 250, and 500 mM, respectively. The simulations were conducted at 320 K using the HPS-Urry model.
Author response image 2
Author response image 3

Finite-size analysis.
(a) Phase diagrams for the HP1α homodimer (50 dimers) and for a system reduced in size by 30% (35 dimers), with critical temperatures of 353.3 K and 352.1 K, respectively. (b) Density profiles of HP1α and its reduced size counterpart at various temperatures. (c, d) Density profiles and snapshots of HP1α homodimer simulation with box dimensions of 170x170x1190 Å3 and for systems with z-direction length fixed at 1190 Å and varying cross-sectional areas: 120x120, 150x150, and 200x200 Å2. The black dashed line shows the simulated saturation concentration of wildtype HP1α homodimer in the box dimensions of 170x170x1190 Å3. The simulations were conducted at 320 K and 100 mM salt concentrations. The error bars represent the standard deviation from triplicate simulation sets.
Additional files
-
Supplementary file 1
Protein and DNA sequences were used in this study.
- https://cdn.elifesciences.org/articles/90820/elife-90820-supp1-v1.docx
-
MDAR checklist
- https://cdn.elifesciences.org/articles/90820/elife-90820-mdarchecklist1-v1.docx
Download links
A two-part list of links to download the article, or parts of the article, in various formats.
Downloads (link to download the article as PDF)
Open citations (links to open the citations from this article in various online reference manager services)
Cite this article (links to download the citations from this article in formats compatible with various reference manager tools)
Interplay between charge distribution and DNA in shaping HP1 paralog phase separation and localization
eLife 12:RP90820.
https://doi.org/10.7554/eLife.90820.3


