Continuous endosomes form functional subdomains and orchestrate rapid membrane trafficking in trypanosomes
- Department of Cell & Developmental Biology, Biocentre, University of Würzburg, Germany
- Department of Biotechnology & Biophysics, Biocentre, University of Würzburg, Germany
- Molecular, Cellular & Developmental Biology, University of Colorado Boulder, United States
- Imaging Core Facility, Biocentre, University of Würzburg, Germany
Figures
Figure 1 with 8 supplements
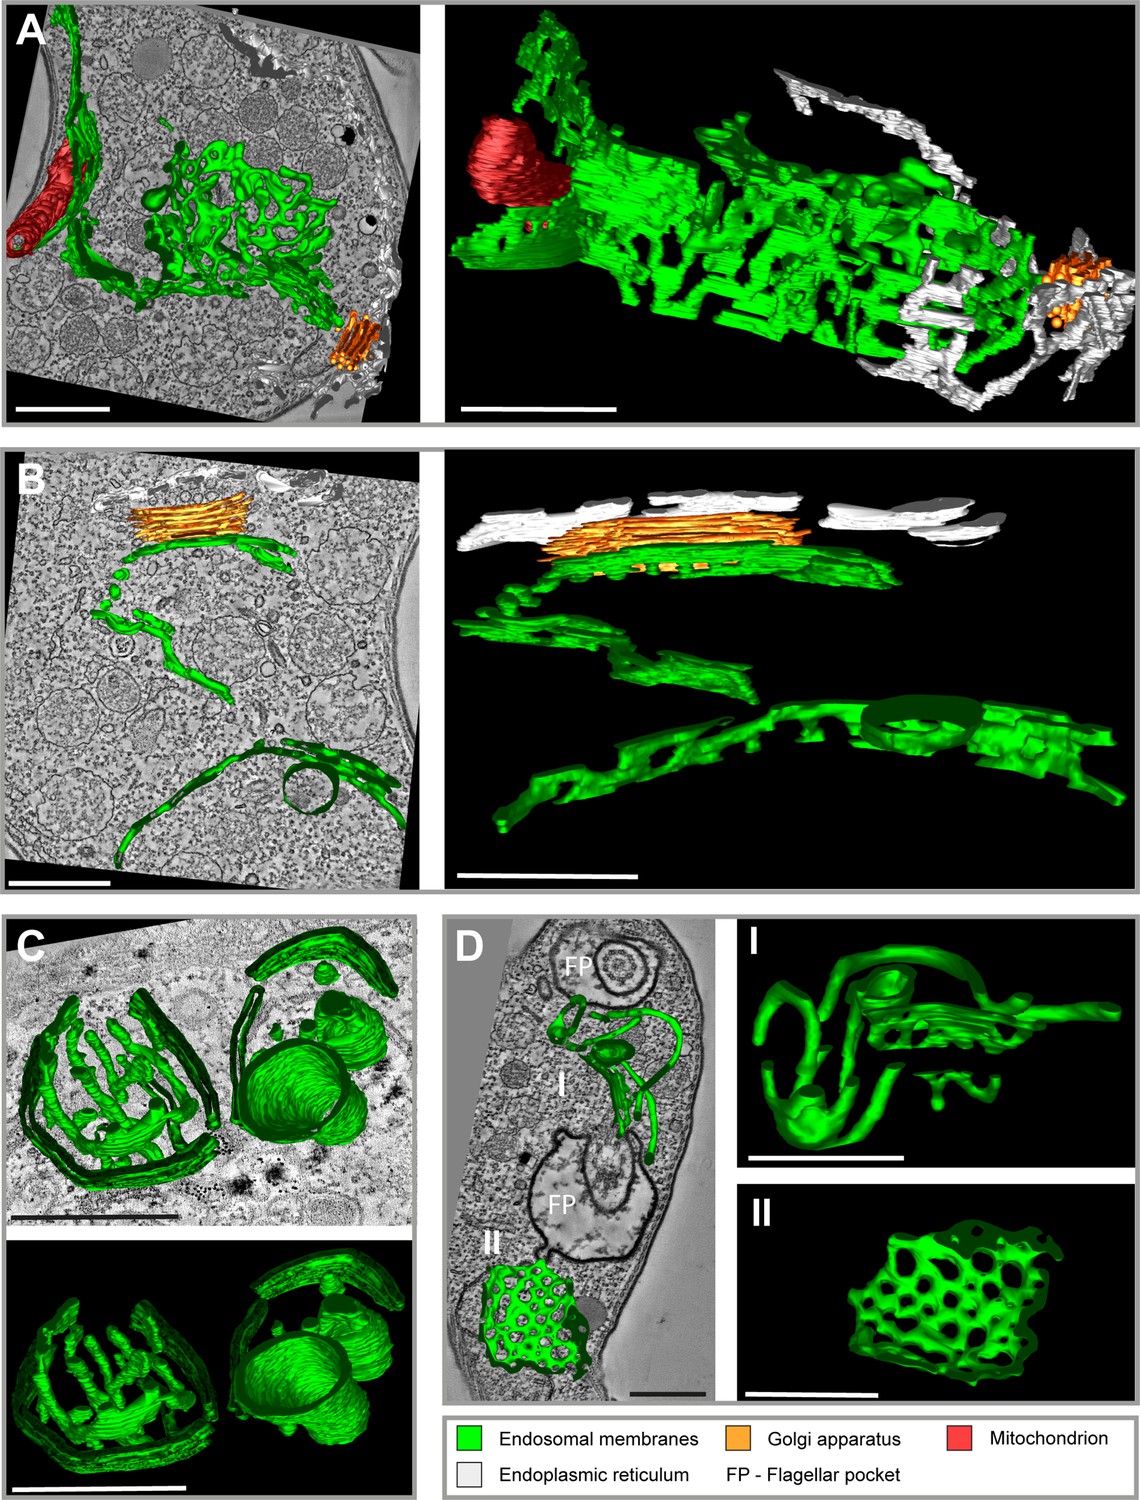
Tomographic reconstructions of the endosomal apparatus of T. brucei after cargo uptake reveal a large and mostly continuous membrane system.
(A) Elongated and highly fenestrated endosomal sheets and palisades. (B) Elongated and slightly fenestrated endosomes. (C) Large circular endosomal cisternae. (D) Two different substructures are displayed: one contains tubular palisades (I) while the other one is a heavily fenestrated sheet (II). Horseradish peroxidase (HRP) endocytosis and 3,3′-diaminobenzidine (DAB) photooxidation were performed prior to tomogram acquisition (A, B, D). Ferritin endocytosis was performed prior to tomogram acquisition (C). All sections are 250 nm thick. The reconstructions (A) and (D) are based on three and two sections, respectively. The reconstructions (B) and (C) are based on one section each. The section and corresponding tomogram (C) originate from the same sample block as the image in Figure 4I from Engstler et al., 2004. Endosomal membranes are shown in green. The endoplasmic reticulum is visualized in white colour. The Golgi apparatus is labelled in orange and the mitochondrion is shown in red. Abbreviation: flagellar pocket (FP). Scale bars: 500 nm. Movies corresponding to panel A–D can be found here: (A) Figure 1—video 1, Figure 1—video 2; (B) Figure 1—video 3, Figure 1—video 4; (C) Figure 1—video 5, Figure 1—video 6; (D) Figure 1—video 7, Figure 1—video 8. The tomograms provided serve as a representative sample among the 37 tomograms that were recorded.
Figure 1—video 1
z-stack of electron tomogram from Figure 1A.
Scale bar: 500 nm.
Figure 1—video 2
3D model of electron tomogram from Figure 1A.
Scale bar: 500 nm.
Figure 1—video 3
z-stack of electron tomogram from Figure 1B.
Scale bar: 500 nm.
Figure 1—video 4
3D model of electron tomogram from Figure 1B.
Scale bar: 500 nm.
Figure 1—video 5
z-stack of electron tomogram from Figure 1C.
Scale bar: 500 nm.
Figure 1—video 6
3D model of electron tomogram from Figure 1C.
Scale bar: 500 nm.
Figure 1—video 7
z-stack of electron tomogram from Figure 1D.
Scale bar: 500 nm.
Figure 1—video 8
3D model of electron tomogram from Figure 1D.
Scale bar: 500 nm.
Figure 2 with 2 supplements
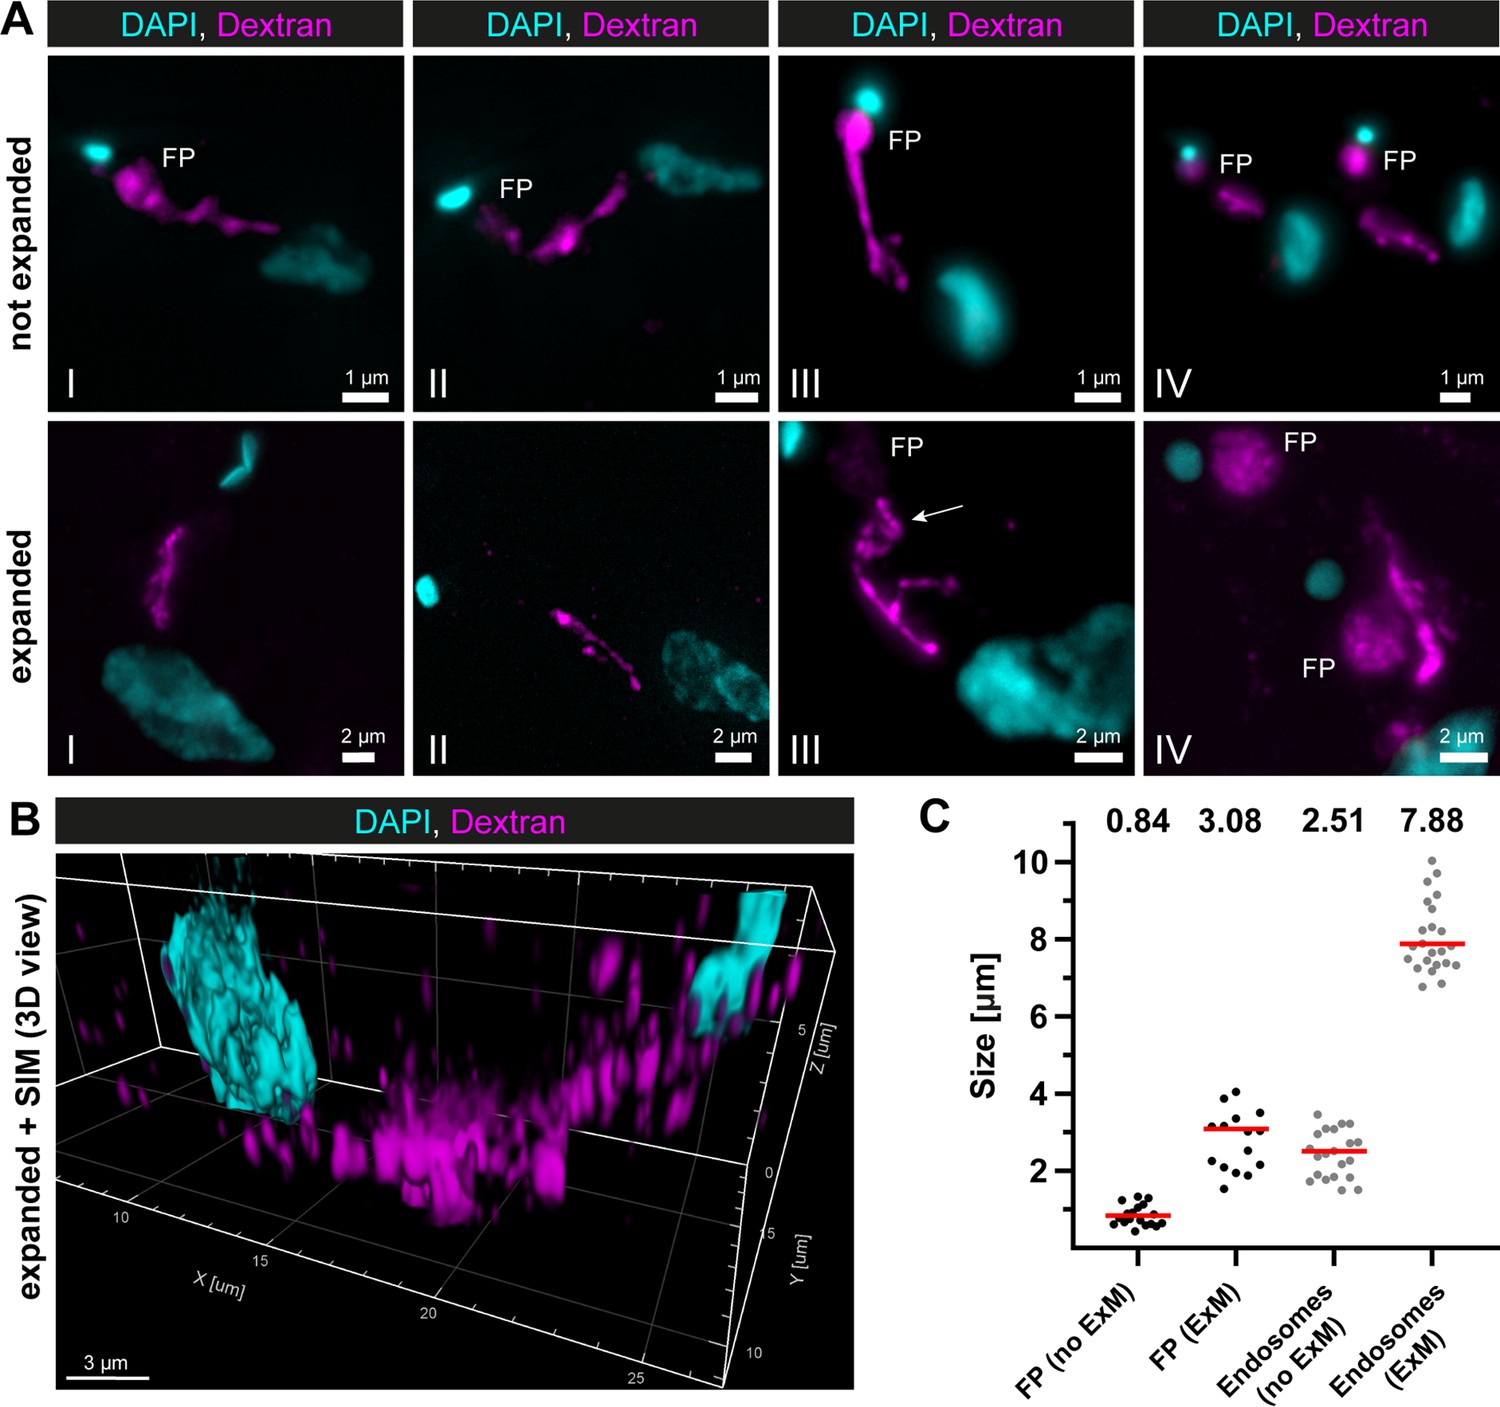
Super-resolution light microscopy reveals continuous endosomal membranes.
(A) Visualization of the endosomal system in T. brucei using expansion microscopy (ExM). Bloodstream form cells were pulsed with dextran conjugated to Alexa488 and fixed with 4% formaldehyde and 0.2% glutaraldehyde. Shown are exemplary images (I–IV) of not expanded and expanded cells imaged using widefield microscopy. All images represent a merge of 4',6-diamidino-2-phenylindole (DAPI) staining (cyan) and dextran signal (magenta). Flagellar pockets (FP) are annotated. (B) 3D presentation of the endosomal system using a combination of ExM and structured illumination microscopy (SIM). The same gels as imaged in (B) were analysed with SIM. The 3D presentation was generated using the IMARIS package (Bitplane). (C) Scatter plot of the quantification of the expansion factor. The diameter of the fluorescence signal corresponding to FP and length of the endosomes were measured in multiple not expanded (no ExM) and expanded cells (ExM) (n ≥ 15). The median values are indicated as red bars and the corresponding numbers are shown in the upper part of the panel.
Figure 2—figure supplement 1

Visualization of the endosomal system in T. brucei by direct stochastic optical reconstruction microscopy (dSTORM).
A transgenic EP1::HaloTag expressing bloodstream form cell line was generated and used to visualize the endosomal system. Cells were labelled with a HaloTag ligand and fixed with 4% formaldehyde. Shown are a merge of transmitted light, DAPI staining and the EP1::HaloTag signal (I), a merge of DAPI staining and the EP1::HaloTag signal (II), the EP1::HaloTag signal (III), and a magnified view of the EP1::HaloTag signal (IV). Occasionally thin membrane bridges are indicated by an arrow in one exemplary image.
Figure 2—figure supplement 2
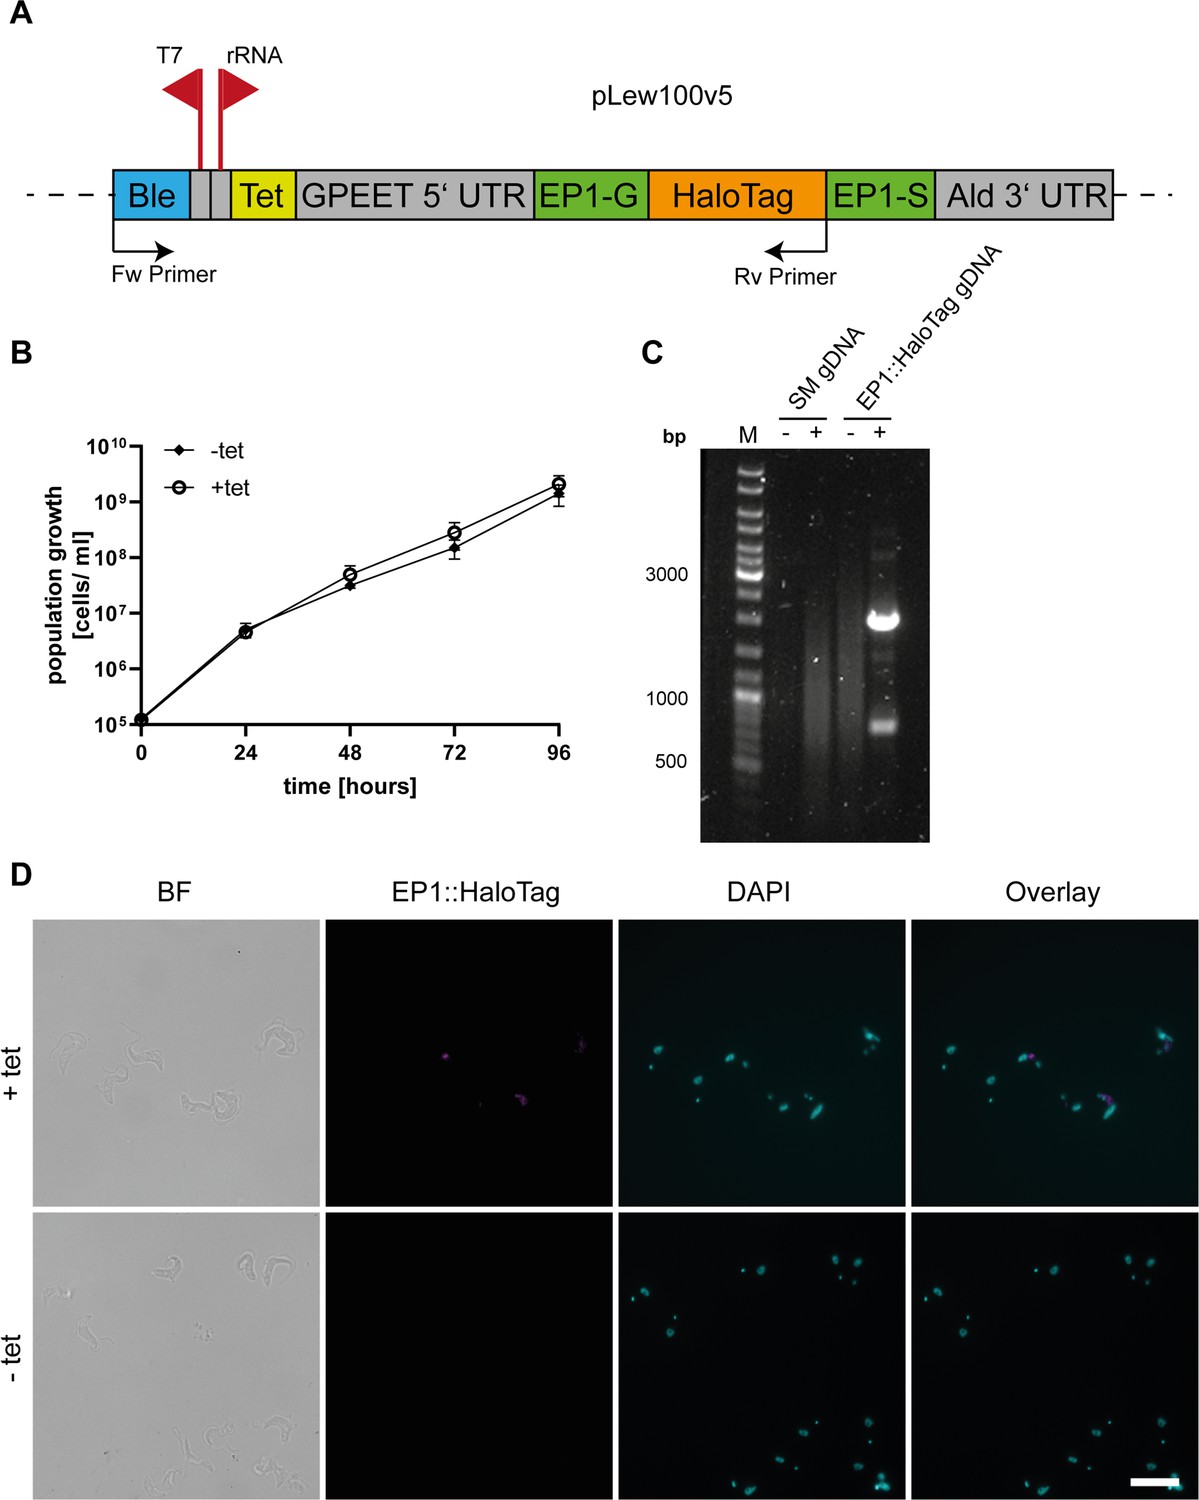
Validation of the generated EP1::HaloTag cell line.
(A) Schematic of the tagging construct used for the inducible, ectopic expression of the Halo-tagged version of EP1. The bleomycin (Ble) resistance is driven by the T7 promoter while the expression of the EP1::HaloTag construct is driven by a ribosomal RNA promoter that is regulated via a tetracycline repressor binding site (Tet). The EP1 construct is flanked by a GPEET 5′UTR and an Aldolase 3′UTR. Forward (Fw) and reverse (Rv) primers used for validation of integration by polymerase chain reaction (PCR) are indicated. (B) Growth curve of the uninduced (−tet) and induced (+tet) EP1::HaloTag cell line. Three independent clones were counted over the time of 4 days to confirm that the expression of the construct was not interfering with the overall cell vitality. (C) Integration PCR with parental cell line (SM) and EP1::HaloTag gDNA as template. Reactions were run with (+) and without (−) template DNA. As the plasmid would integrate into an unspecific ribosomal RNA spacer region, primers were designed to amplify the antibiotic resistance together with the EP1::HaloTag protein sequence. No product was visible in the parental cell line, while a main product of the expected size (2000 bp) was visible in the EP1::HaloTag cell line. (D) Immunofluorescence of uninduced and induced EP1::HaloTag cells. Cells were labelled with Halo ligand TMR to visualize the EP1 signal and DAPI to show the nucleus and kinetoplast. Additionally, a brightfield image (BF) and an overlay of the fluorescence channels are given. Without induction, no signal of the Halo-tag was visible. After induction, a clear Halo-tag signal was visible which also corresponds to the anti-EP1 signal. The main localization of the signal is between the kinetoplast and the nucleus. The gene expression is heterogenous in the population as not all cells show a strong fluorescent signal. Scale bar: 10 µm. Arrow: indicating thin membrane bridges.
-
Figure 2—figure supplement 2—source data 1
Integration PCR for generation of EP1::Halo cell line.
- https://cdn.elifesciences.org/articles/91194/elife-91194-fig2-figsupp2-data1-v1.zip
-
Figure 2—figure supplement 2—source data 2
Integration PCR for generation of EP1::Halo cell line - labelled.
- https://cdn.elifesciences.org/articles/91194/elife-91194-fig2-figsupp2-data2-v1.zip
Figure 3 with 1 supplement
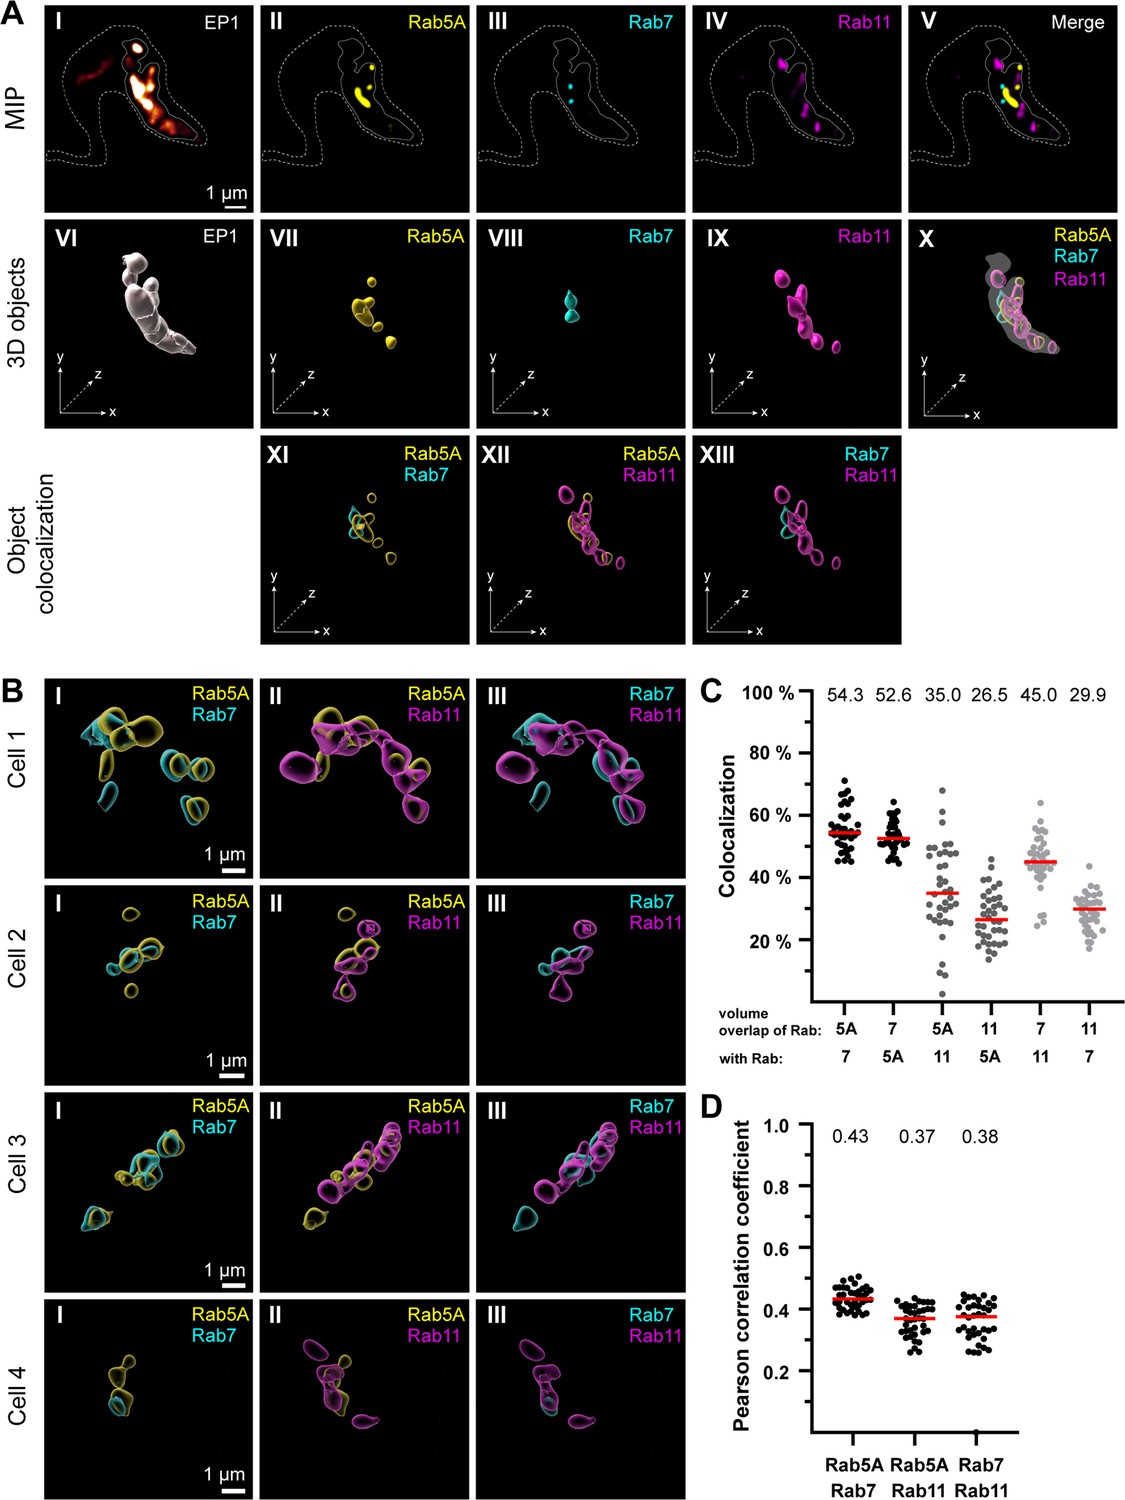
The endosomal markers TbRab5A, TbRab7, and TbRab11 partly colocalize in the posterior region of the cell.
(A) The experimental workflow, from fluorescence images to object generation and quantitative 3D colocalization analysis, is exemplified. EP1::GFP (I) expressing cells were fixed and labelled with anti-TbRab5A (II), anti-TbRab7 (III), and anti-TbRab11 (IV) antibodies and imaged using widefield microscopy. Upper row: maximum intensity projections (MIPs) for each individual fluorescence channel (I–V) as well as a merge of all three anti-TbRab marker channels (V). The outline of the cell is shown by a dashed line (I–V) and the region of interest (ROI; endosomal system) is presented by a solid line (I–V). Middle row: corresponding 3D objects to display the ROI (VI) and the TbRab marker objects (VII–IX). The merge of all objects confirmed that the TbRab marker objects are located within the ROI (X). Lower row: colocalization of the objects representing TbRab5A and TbRab7 (XI), TbRab5A and TbRab11 (XII), and TbRab7 and TbRab11 (XIII). The x, y, and z axes are indicated to support the three-dimensional view. (B) Object colocalization shown for additional cells. The colocalization of TbRab5A and TbRab7 (I), TbRab5A and TbRab11 (II), and TbRab7 and TbRab11 (III) is shown for different cells (Cells 1–4). (C, D) Quantification of colocalization analysis for TbRab marker combinations. The colocalization function of IMARIS was used for the quantification. The EP1 surfaces defined the ROI (see panel A) and the automatic thresholding function (Costes et al., 2004) ensured minimal user bias. Each data point (n = 38) represents a field of view with 30–40 cells, corresponding to a total number of ~1200 analysed cells. The median is highlighted with a red line and the corresponding number is written on top of the dataset. (C) Scatter plot of the colocalization analysis for the different TbRab marker combinations using the percentage of volume overlap. (D) Scatter plot of the colocalization analysis for the different TbRab marker combinations using the Pearson correlation coefficient.
Figure 3—figure supplement 1

Validation of different anti-TbRab antibodies.
Antibodies against (A) TbRab5A, (B) TbRab7, and (C) TbRab11 were generated in different animals and validated by immunoblotting using protein samples of RNAi cell lines. Each panel shows the cumulative growth profile of the corresponding RNAi cell line. Three independent clones were analysed for 4 days in the presence (+tet) or absence (−tet) of tetracycline. In addition, western blot analysis of the protein expression of the different TbRab in the corresponding RNAi cell line 0, 8, 16, 24, 32, and 48 hr after tetracycline induction. The parental 2T1 cells served as a positive control and the TbPFR1,2 (PFR) proteins served as loading control. For each TbRab protein different numbers and species of animals were immunized. Depicted are those that gave antisera with compatible antibodies.
-
Figure 3—figure supplement 1—source data 1
Antibody validation western blots unlabelled.
- https://cdn.elifesciences.org/articles/91194/elife-91194-fig3-figsupp1-data1-v1.zip
-
Figure 3—figure supplement 1—source data 2
Antibody validation western blots labelled.
- https://cdn.elifesciences.org/articles/91194/elife-91194-fig3-figsupp1-data2-v1.zip
Figure 4
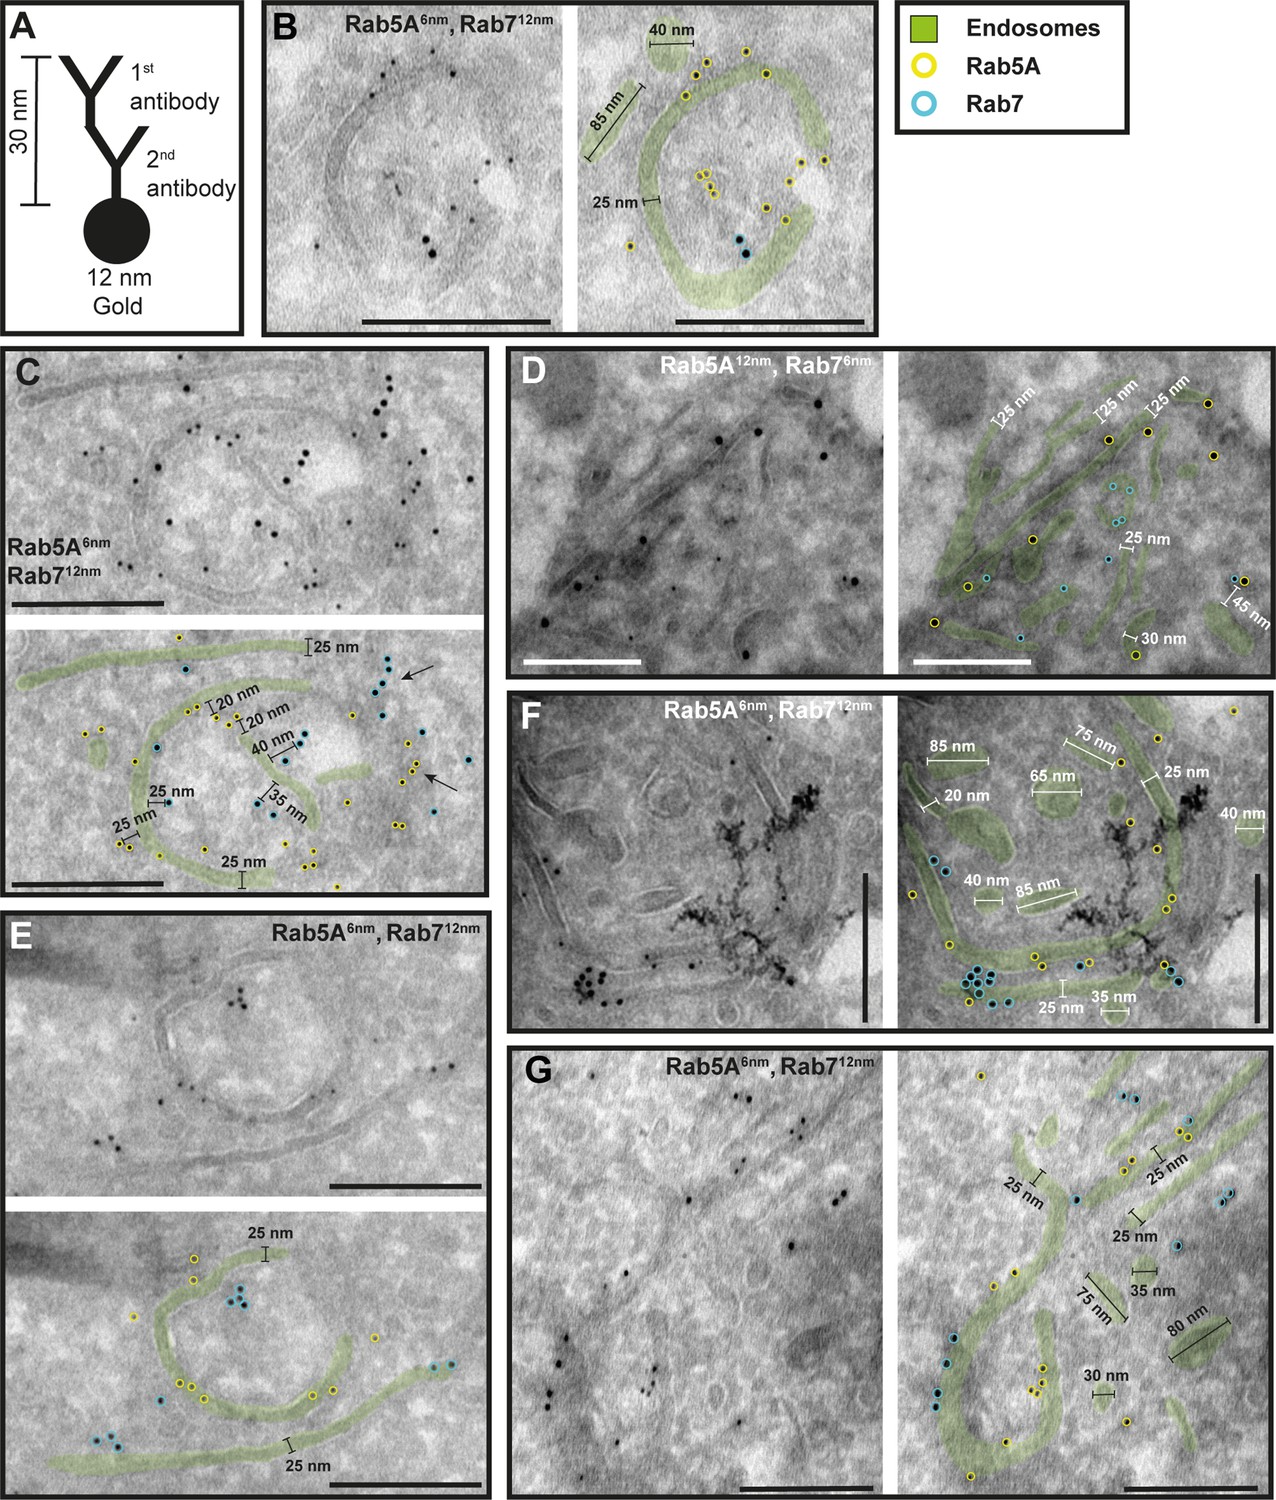
The endosomal markers TbRab5A and TbRab7 are present on the same membrane.
(A) Schematic representation of antibody binding to visualize the maximum linkage error of 30 nm between a bound epitope and the gold particle. (B–G) Electron micrographs of cryosections labelled with rat anti-TbRab5A and guinea pig anti-TbRab7 antibodies and visualized with 6 or 12 nm gold-coupled secondary antibodies. For each panel, an annotated and an unedited version of the image is presented. Endosomes are highlighted in green. Gold particles corresponding to TbRab5A signals are labelled in yellow. Gold particles corresponding to TbRab7 signals are highlighted in cyan. Scale bars: 200 nm. The images shown are representative examples drawn from over 300 micrographs generated in four distinct labelling experiments.
-
Figure 4—source data 1
Uncropped electron micrographs of Figure 4.
- https://cdn.elifesciences.org/articles/91194/elife-91194-fig4-data1-v1.zip
Figure 5
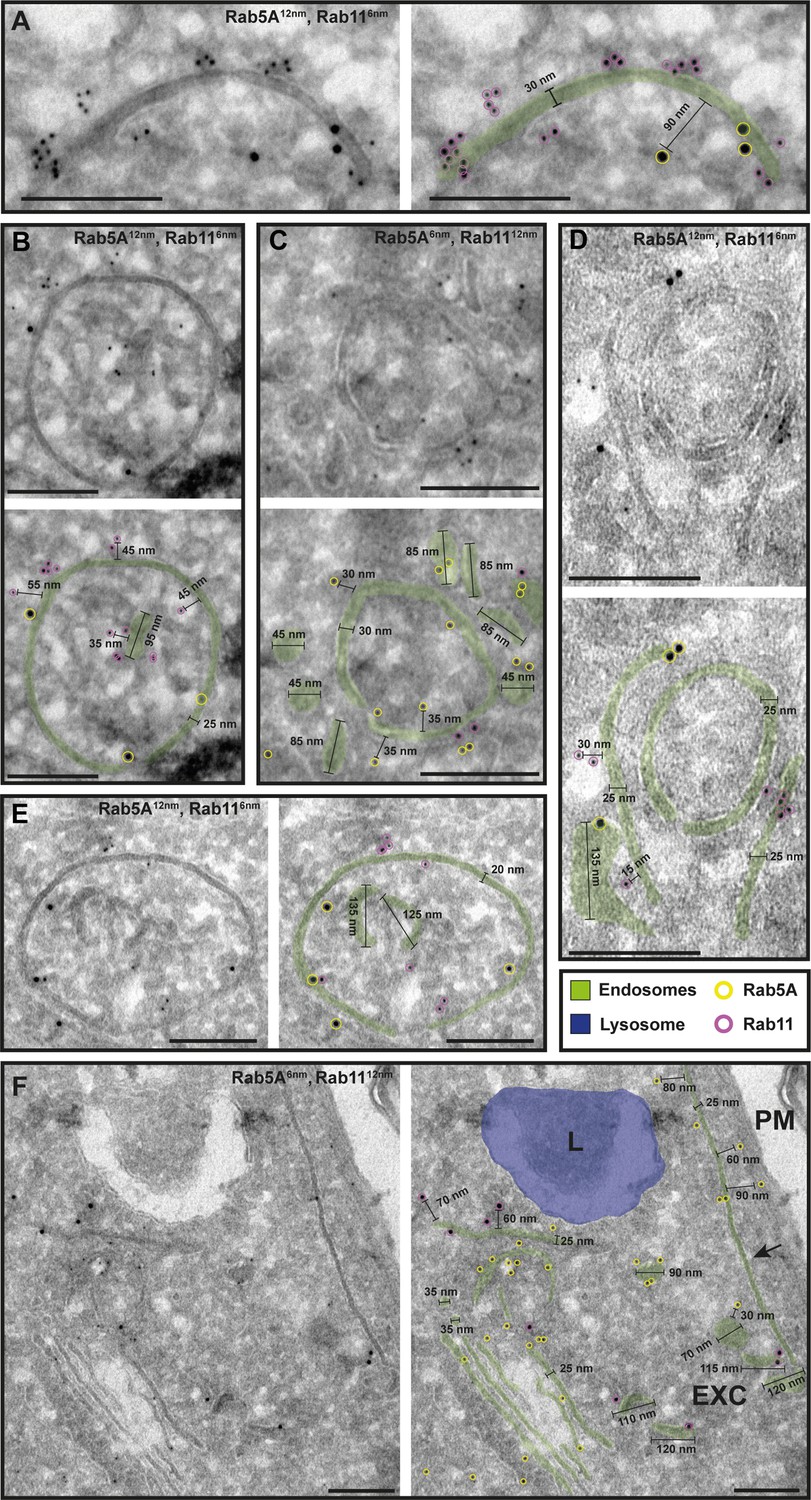
The endosomal markers TbRab5A and TbRab11 are present on the same membranes.
(A–F) Electron micrographs of cryosections labelled with rat anti-TbRab5A and rabbit anti-TbRab11 antibodies and visualized with 6 or 12 nm gold-coupled secondary antibodies. For each panel, an annotated and an unedited version of the image is presented. Endosomes are marked in green, and the lysosome is highlighted in blue. Gold particles are marked in yellow (TbRab5A) and in magenta (TbRab11). Scale bars: 200 nm. Exocytic carrier (EXC), lysosome (L), and plasma membrane (PM). The displayed images are representative examples drawn from over 300 images generated in four distinct labelling experiments.
-
Figure 5—source data 1
Uncropped electron micrographs of Figure 5.
- https://cdn.elifesciences.org/articles/91194/elife-91194-fig5-data1-v1.zip
Figure 6
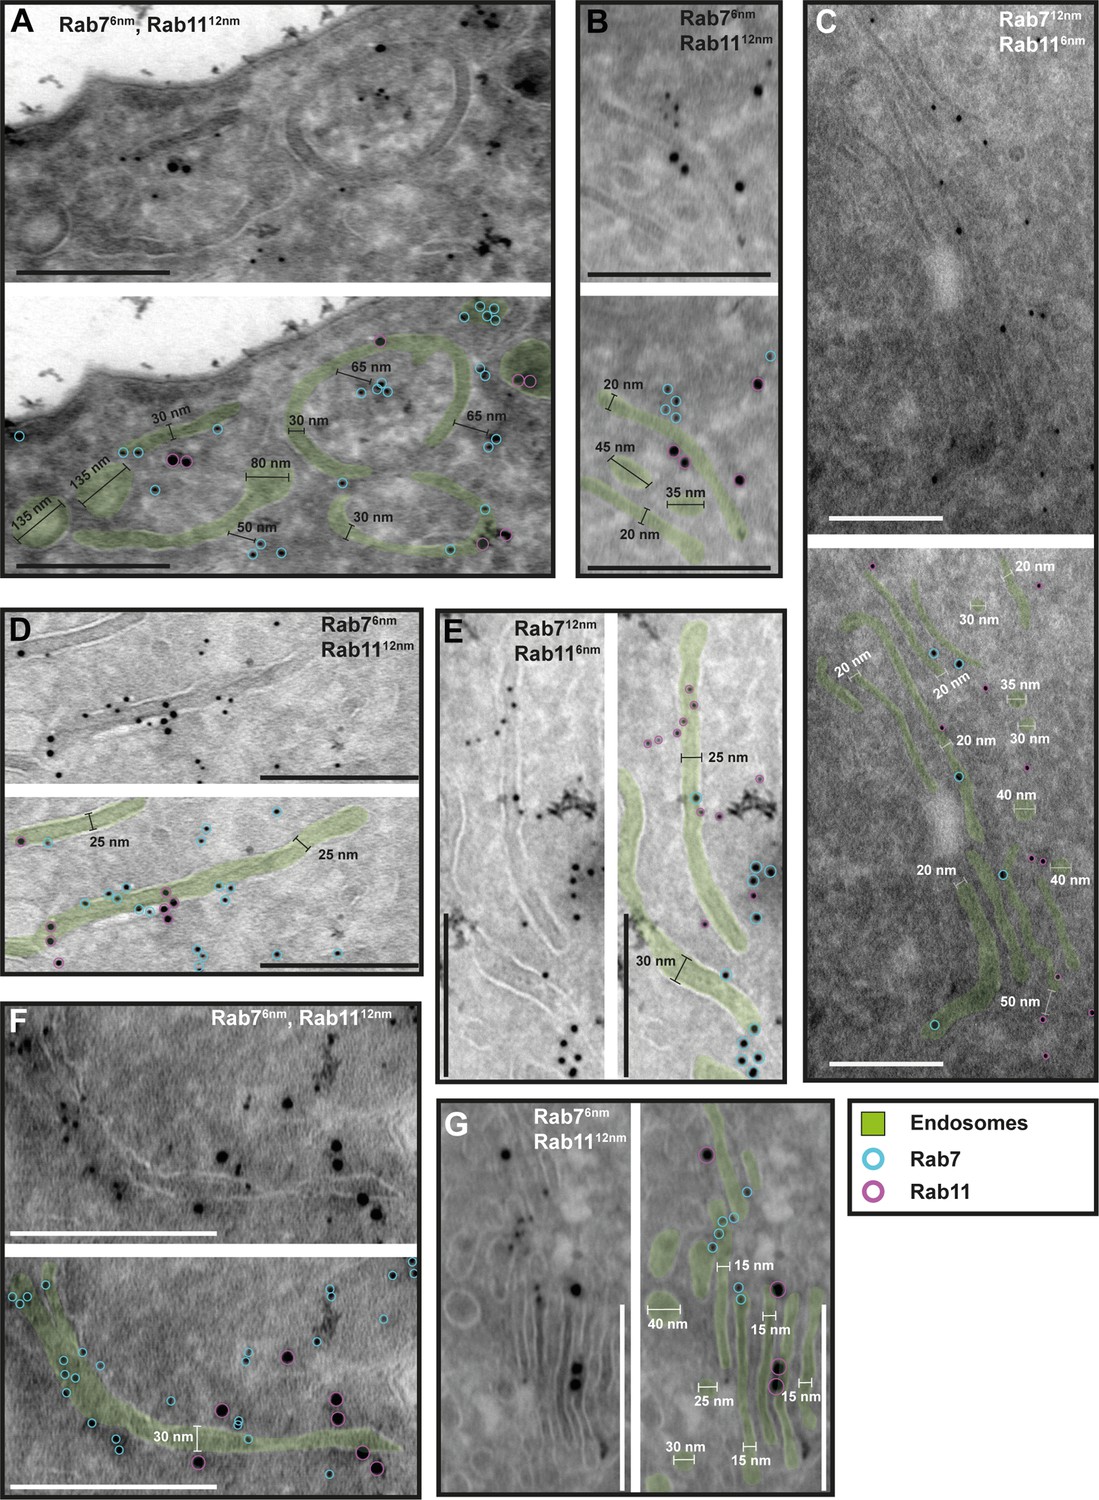
The endosomal markers TbRab7 and TbRab11 are present on the same membranes.
(A–G) Electron micrographs of cryosections labelled with guinea pig anti-TbRab7 and rabbit anti-TbRab11 antibodies visualized with 6 or 12 nm gold-coupled secondary antibodies. For each panel, an annotated and an unedited version of the image is presented. Endosomes are highlighted in green. Gold particles are labelled in cyan (TbRab7) and in magenta (TbRab11). Scale bars: 200 nm. The displayed images are representative examples drawn from over 200 images generated in three distinct labelling experiments.
-
Figure 6—source data 1
Uncropped electron micrographs of Figure 6.
- https://cdn.elifesciences.org/articles/91194/elife-91194-fig6-data1-v1.zip
Figure 7
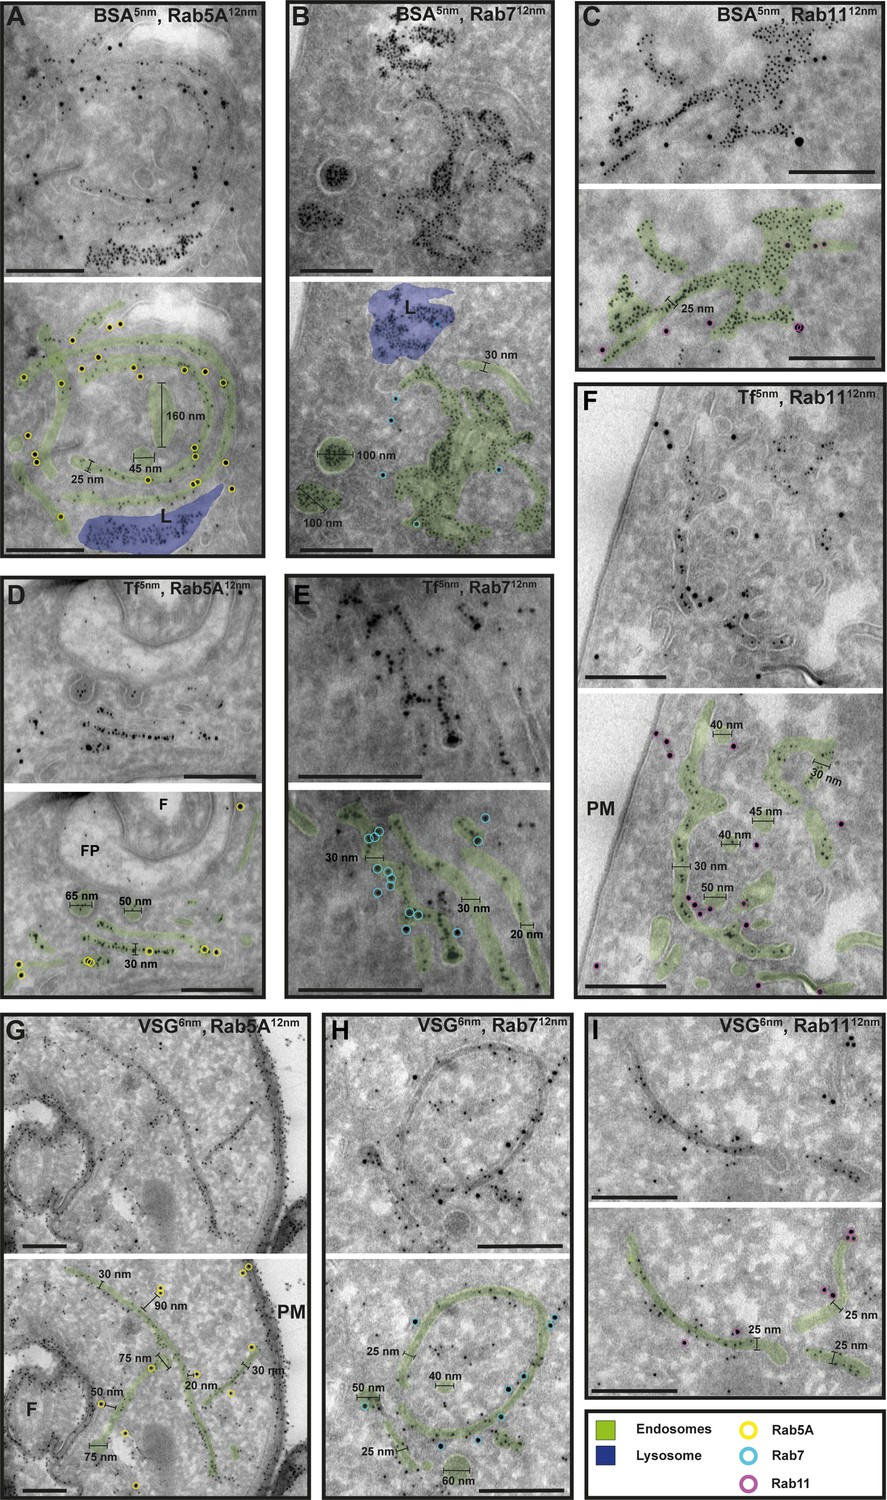
Cargo uptake and anti-VSG immunogold labelling confirm the endosomal identity.
(A–I) Electron micrographs of cryosections labelled with anti-TbRab5A (yellow), anti-TbRab7 (cyan), or anti-TbRab11 (magenta) antibodies and 12 nm gold-conjugated secondary antibodies. For each panel, an annotated and an unedited version of the image is presented. Endosomes are highlighted in green, the lysosome in blue. Parasites were incubated with 5 nm gold-conjugated bovine serum albumin (BSA) (A–C) or transferrin (Tf) (D–F), prior to fixation, sectioning, and immunolabelling. BSA and transferrin cargo were observed in vesicles, endosomes, and lysosome. (H, I) Cells were labelled with anti-VSG antibodies and 6 nm gold-conjugated secondary antibodies. (F) Flagellum, (FP) flagellar pocket, (PM) plasma membrane, (L) lysosome. Scale bars: 200 nm. The displayed images are representative examples drawn from over 50 images generated in three distinct labelling experiments.
Figure 8 with 4 supplements
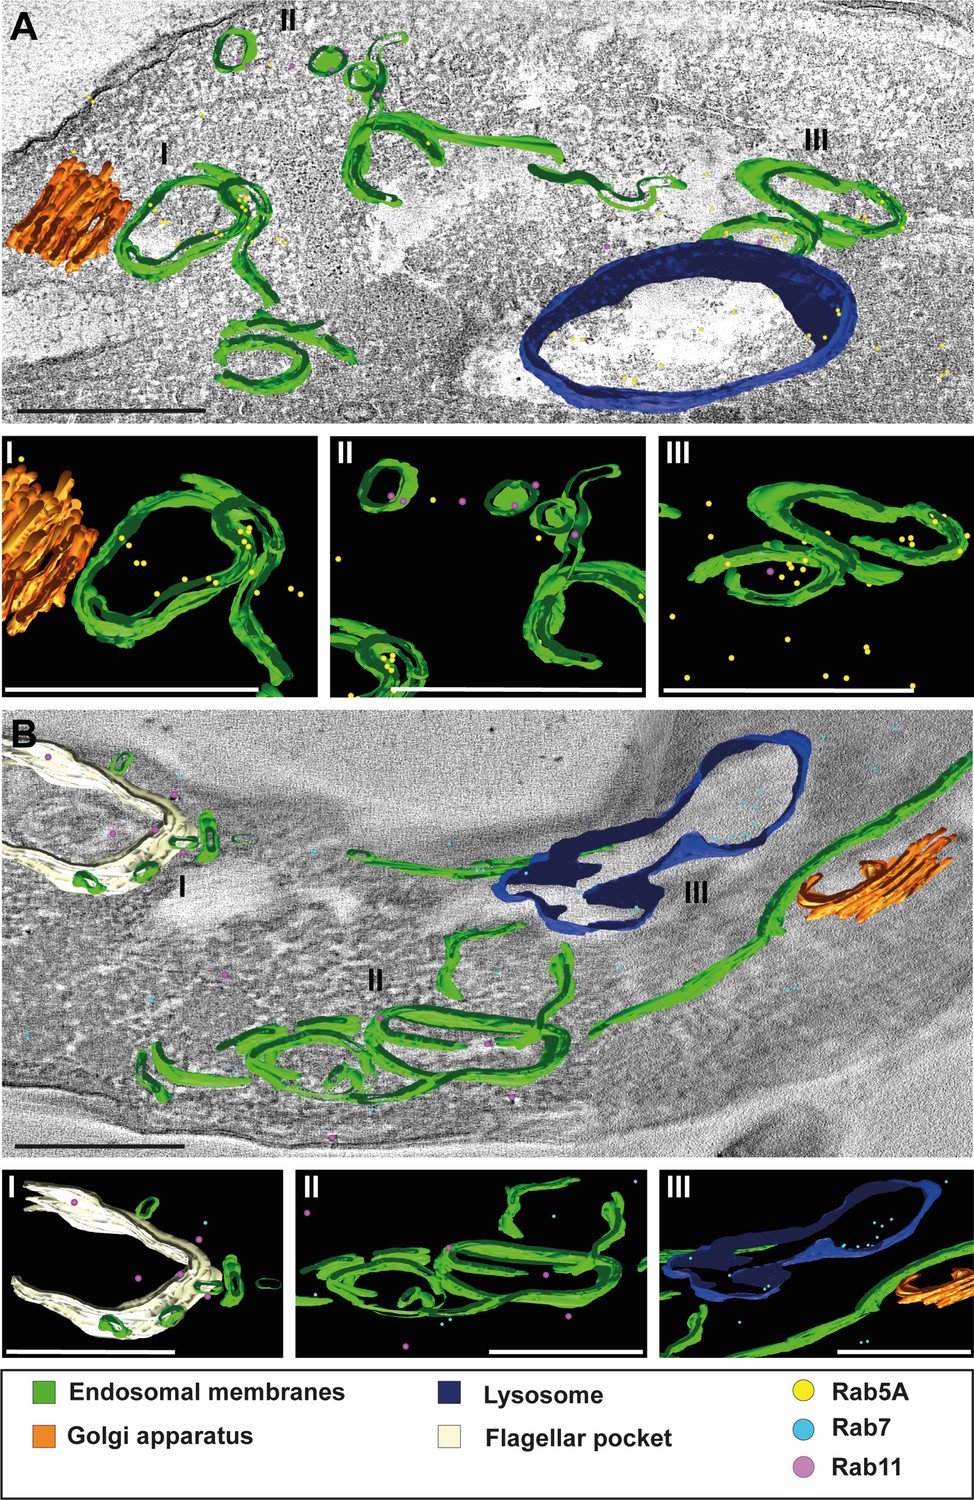
3D Tokuyasu demonstrated continuous endosomal membranes in cryosections.
(A, B) Tomographic reconstruction of the endosomal apparatus. (I–III) Isolated view of different organelle structures. Cryosections (250 nm) were labelled with anti-TbRab antibodies and 6 or 12 nm gold-coupled secondary antibodies. Endosomes are shown in green, lysosomes in blue, the flagellar pocket in white, the Golgi apparatus in orange. Gold particles are indicated as coloured spheres; TbRab5A (yellow), TbRab7 (cyan), or TbRab11 (magenta). Scale bars: 500 nm. Movies corresponding to panels A and B can be found here: (A) Figure 8—video 1, Figure 8—video 2; (B) Figure 8—video 3, Figure 8—video 4. The provided tomograms serve as a representative sample among the 35 tomograms that were recorded.
Figure 8—video 1
z-stack of electron tomogram from Figure 8A.
Scale bar: 500 nm.
Figure 8—video 2
3D model of electron tomogram from Figure 8A.
Scale bar: 500 nm.
Figure 8—video 3
z-stack of electron tomogram from Figure 8B.
Scale bar: 500 nm.
Figure 8—video 4
3D model of electron tomogram from Figure 8B.
Scale bar: 500 nm.
Figure 9
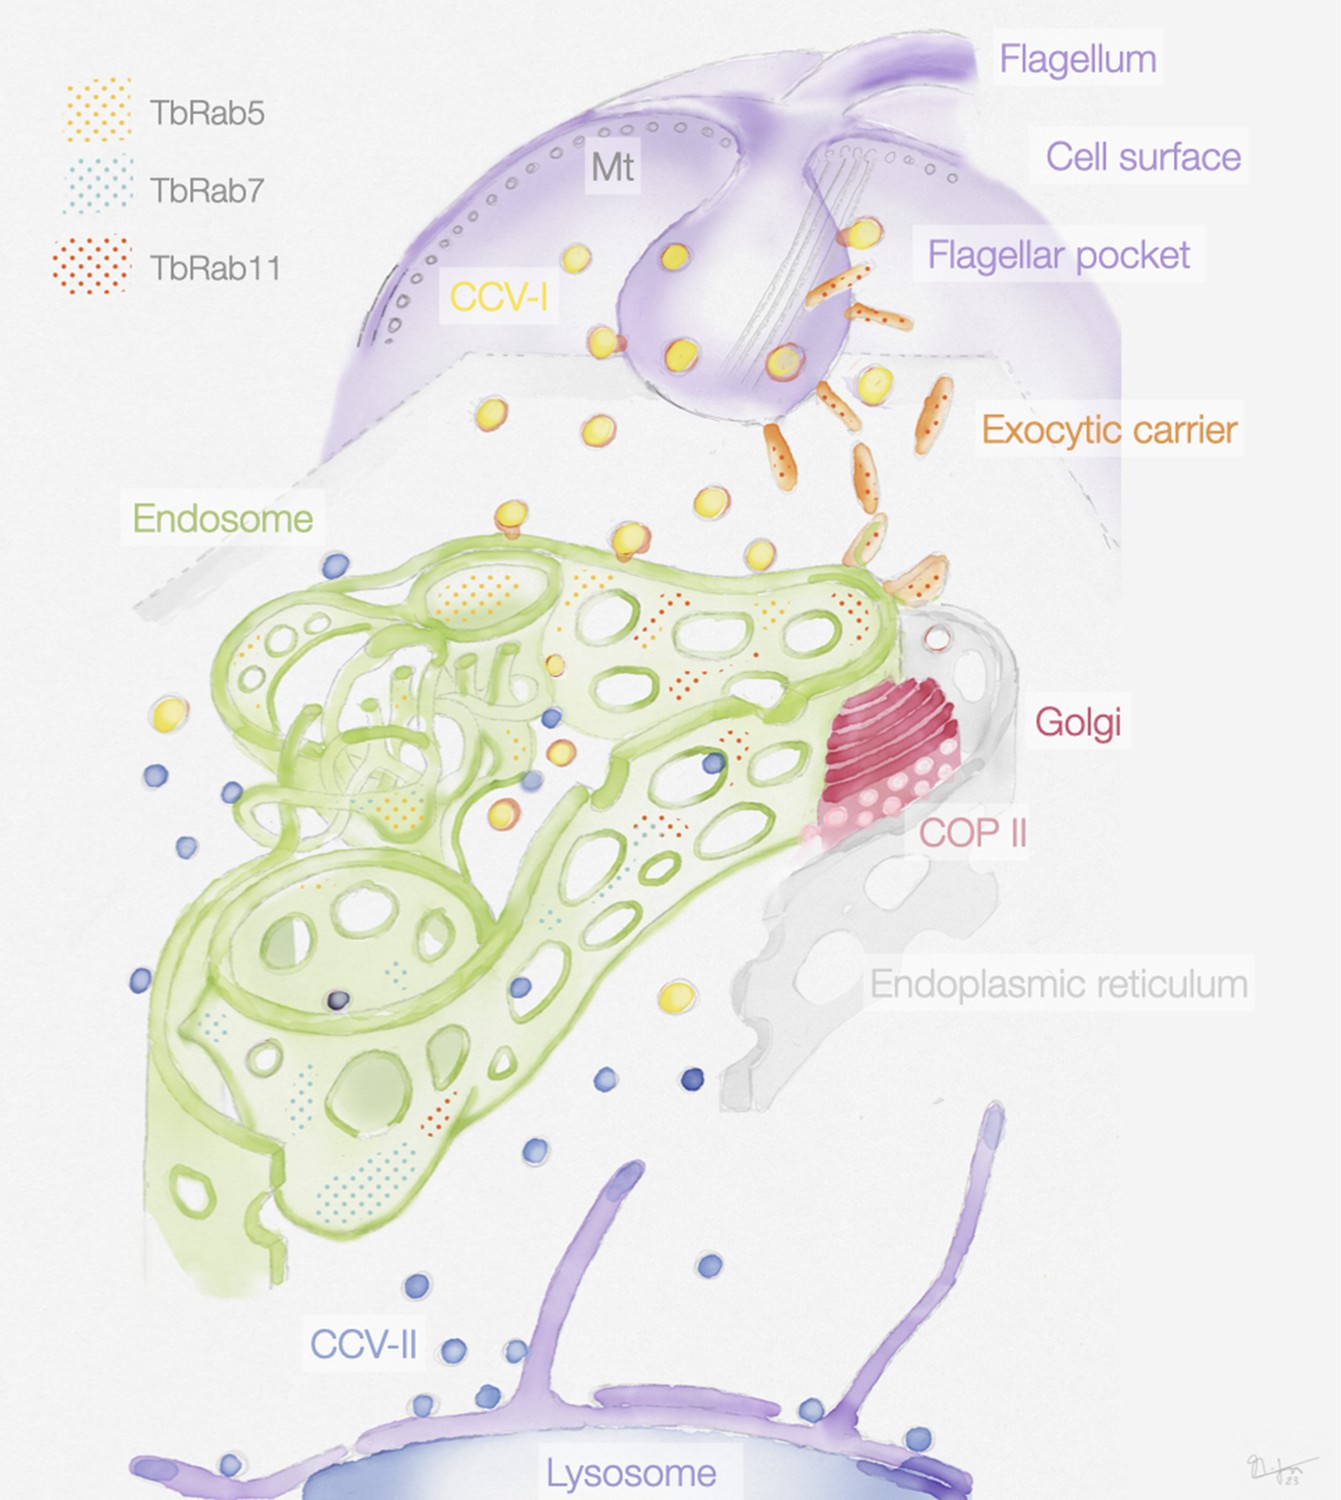
Schematic representation of the endosomal system in T. brucei.
The endosome is marked by the presence of small GTPases of the Rab family: Rab5A (yellow dots), Rab7 (cyan dots), and Rab11 (red dots). Class I clathrin-coated vesicles (CCV I), class II clathrin-coated vesicles (CCV II), vesicles coated with coat protein (COP) II.
Videos
Video 1
Tomographic reconstructions of T. brucei.
The movie is available online and includes annotations for better understanding.
Video 2
Tomographic reconstructions of T. brucei.
Cells were chemically fixed before further processing. Scale bar: 500 nm.
Video 3
Tomographic reconstructions of T. brucei.
Cells were chemically fixed before further processing. Scale bar: 500 nm.
Video 4
Tomographic reconstructions of T. brucei.
Cells were chemically fixed before further processing. Scale bar: 500 nm.
Additional files
Download links
A two-part list of links to download the article, or parts of the article, in various formats.
Downloads (link to download the article as PDF)
Open citations (links to open the citations from this article in various online reference manager services)
Cite this article (links to download the citations from this article in formats compatible with various reference manager tools)
Continuous endosomes form functional subdomains and orchestrate rapid membrane trafficking in trypanosomes
eLife 12:RP91194.
https://doi.org/10.7554/eLife.91194.3


