Post-transcriptional splicing can occur in a slow-moving zone around the gene
- Department of Bioengineering, University of Pennsylvania, United States
- School of Life Sciences, Westlake University, China
- Department of Genetics, Blavatnik Institute, Harvard Medical School, United States
- Department of Cell and Developmental Biology, Penn Institute of Epigenetics, Perelman School of Medicine, University of Pennsylvania, United States
- Broad Institute of MIT and Harvard, United States
- Department of Cell and Molecular Biology, University of Pennsylvania, United States
- Departments of Biological Engineering and Brain and Cognitive Sciences, Media Lab and McGovern Institute, Massachusetts Institute of Technology, United States
- Department of Genetics, Perelman School of Medicine, University of Pennsylvania, United States
Figures
Figure 1 with 3 supplements
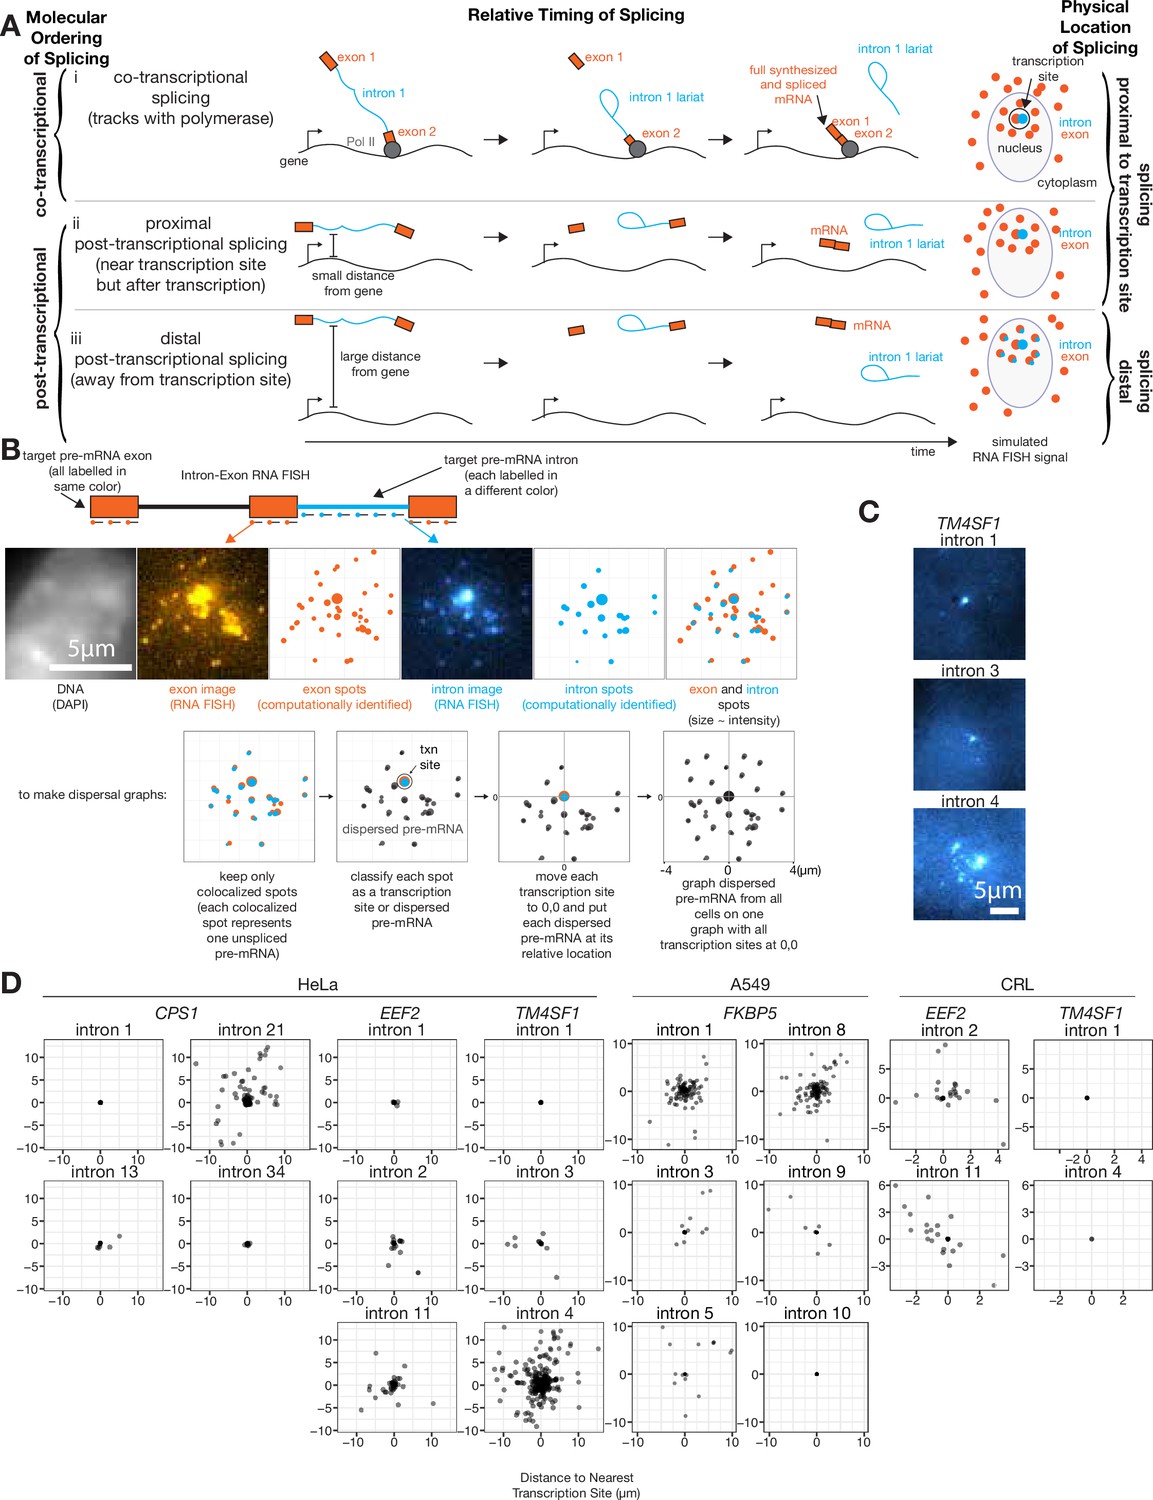
At least one intron from every tested endogenous gene is post-transcriptionally spliced.
(A) Schematic depicting three categories of splicing. (B) Schematic depicting RNA FISH method and translation of RNA FISH images into dispersal graphs. Computed spots are calculated by fitting a Gaussian to the distribution of intensity signals and pinpointing the center of that Gaussian at sub-pixel resolution. Gene depicted is FKBP5. (C) Example images of dispersed (intron 4) and not dispersed (introns 1 and 3) transcription sites, via RNA FISH. Each image is a max merge of 30 optical z-sections, 0.3 µm step distance. (D) Graphs indicating dispersal distance or the distance of each detected pre-mRNA to its nearest transcription site. Leftmost graphs of CPS1, EEF2, and TM4SF1 data are from HeLa cells, FKBP5 data is from A549 cells after 8 hr in dexamethasone, rightmost graphs of EEF2 and TM4SF1 data are from CRL-2097. All scale bars represent 5 µm unless otherwise noted.
Figure 1—figure supplement 1

Transcription site choice.
(A) Histograms of intron intensities for TM4SF1 intron 1 and intron 4, before, after, and during defining a global thresholding cutoff and other transcription site selection methods, as well as dispersal graphs generated based on those transcription site selections. (B) Number of dispersed pre-mRNA per cell.
Figure 1—figure supplement 2

Defining post-transcriptionality.
(A) Parameter sweep of colocalization threshold and associated dispersal graphs. (B) Example classification of pre-mRNA as either transcription sites or dispersed pre-mRNA. (C) Distances between 5’ and 3’ ends of RNA as detected by RNA FISH for either the 3’ or 5’ end of the RNA of interest. (D) Example classification of RNA as ‘distal’ or ‘proximal’ to the transcription site. (E) Histogram showing type of pre-mRNA as defined by RNA FISH for stated introns in FKBP5, as a function of distance to the nearest transcription site.
Figure 1—figure supplement 3

Sequencing corroborates RNA FISH dispersal results.
(A) Schematic of sequencing experiment design (in HeLa cells). (B) Comparison of mean dispersal (as assessed by RNA FISH, see Figure 1) and mean splicing index (as assessed by sequencing). FKBP5 is not present on this graph due to low read counts in HeLa cells (FISH was performed for FKBP5 in A549 cells). (C) Splicing index of each intron for which we obtained RNA FISH measurements. Error bars represent mean ± sd. n=2. (D) Comparison of transcription site size (as assessed by RNA FISH) and splicing index, as assessed by sequencing.
Figure 2 with 3 supplements
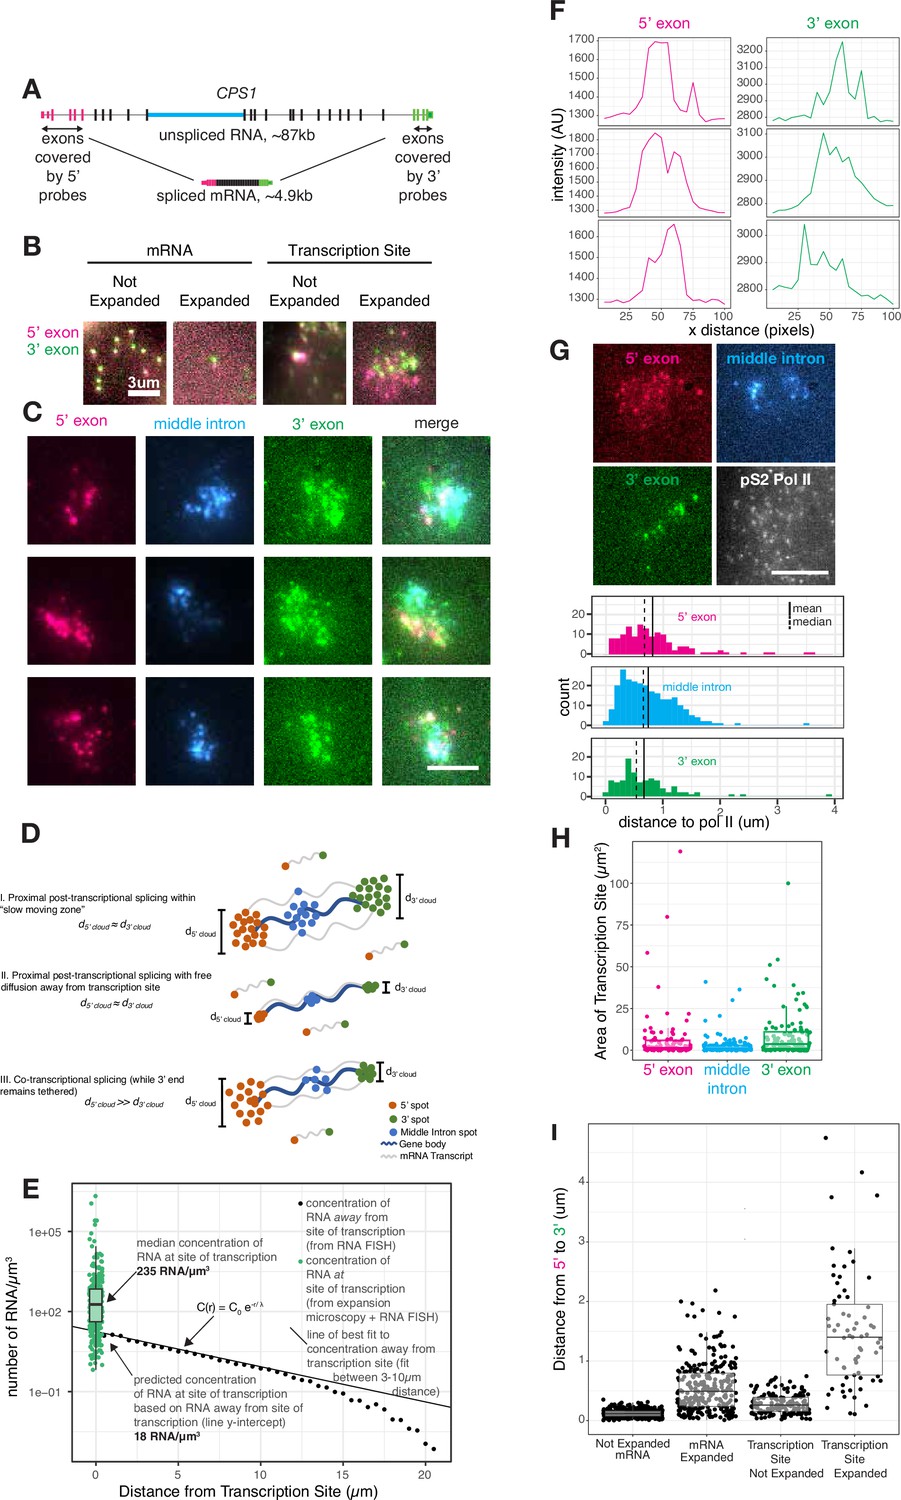
Transcripts dwell at the site of transcription after transcription is completed.
(A) Gene and probe position diagram for CPS1 pre-mRNA and mRNA. (B) Example images of RNA FISH for CPS1 before and after expansion microscopy for individual mRNA and transcription sites (in HeLa cells, different representative cells shown in each image). (C) Example images of 5’, 3’, and middle intron CPS1 RNA FISH after expansion. (D) Schematic depicting simulated RNA FISH signal for three potential scenarios: a slow-moving zone around the site of transcription (I), free diffusion away from the transcription site (II), or co-transcriptional splicing of tethered transcripts (III). (E) Schematic depicting RNA FISH signal for diffusion or a slow-moving proximal zone for completed (but not necessarily spliced) transcripts. (F) Line scans of fluorescence intensity (arbitrary units) from transcription sites like in C. (G) Example images of co-IF (polymerase II) and RNA FISH for CPS1 after expansion. Quantification of images like that in G, and others, representing distance from each RNA spot to the nearest polymerase II IF spot. (H) Graph depicting area (in pixels) of polygons drawn around individual transcription sites after expansion. (I) Distance from 5’ to 3’ of expanded and unexpanded mRNA and transcription sites, as detected by CPS1 RNA FISH. This distance was calculated using nearest neighbors with replacement. All scale bars represent 5 µm unless otherwise noted. All expanded images and calculations are shown in expanded space scale (reduced by 4.65× to yield original space scale).
Figure 2—figure supplement 1
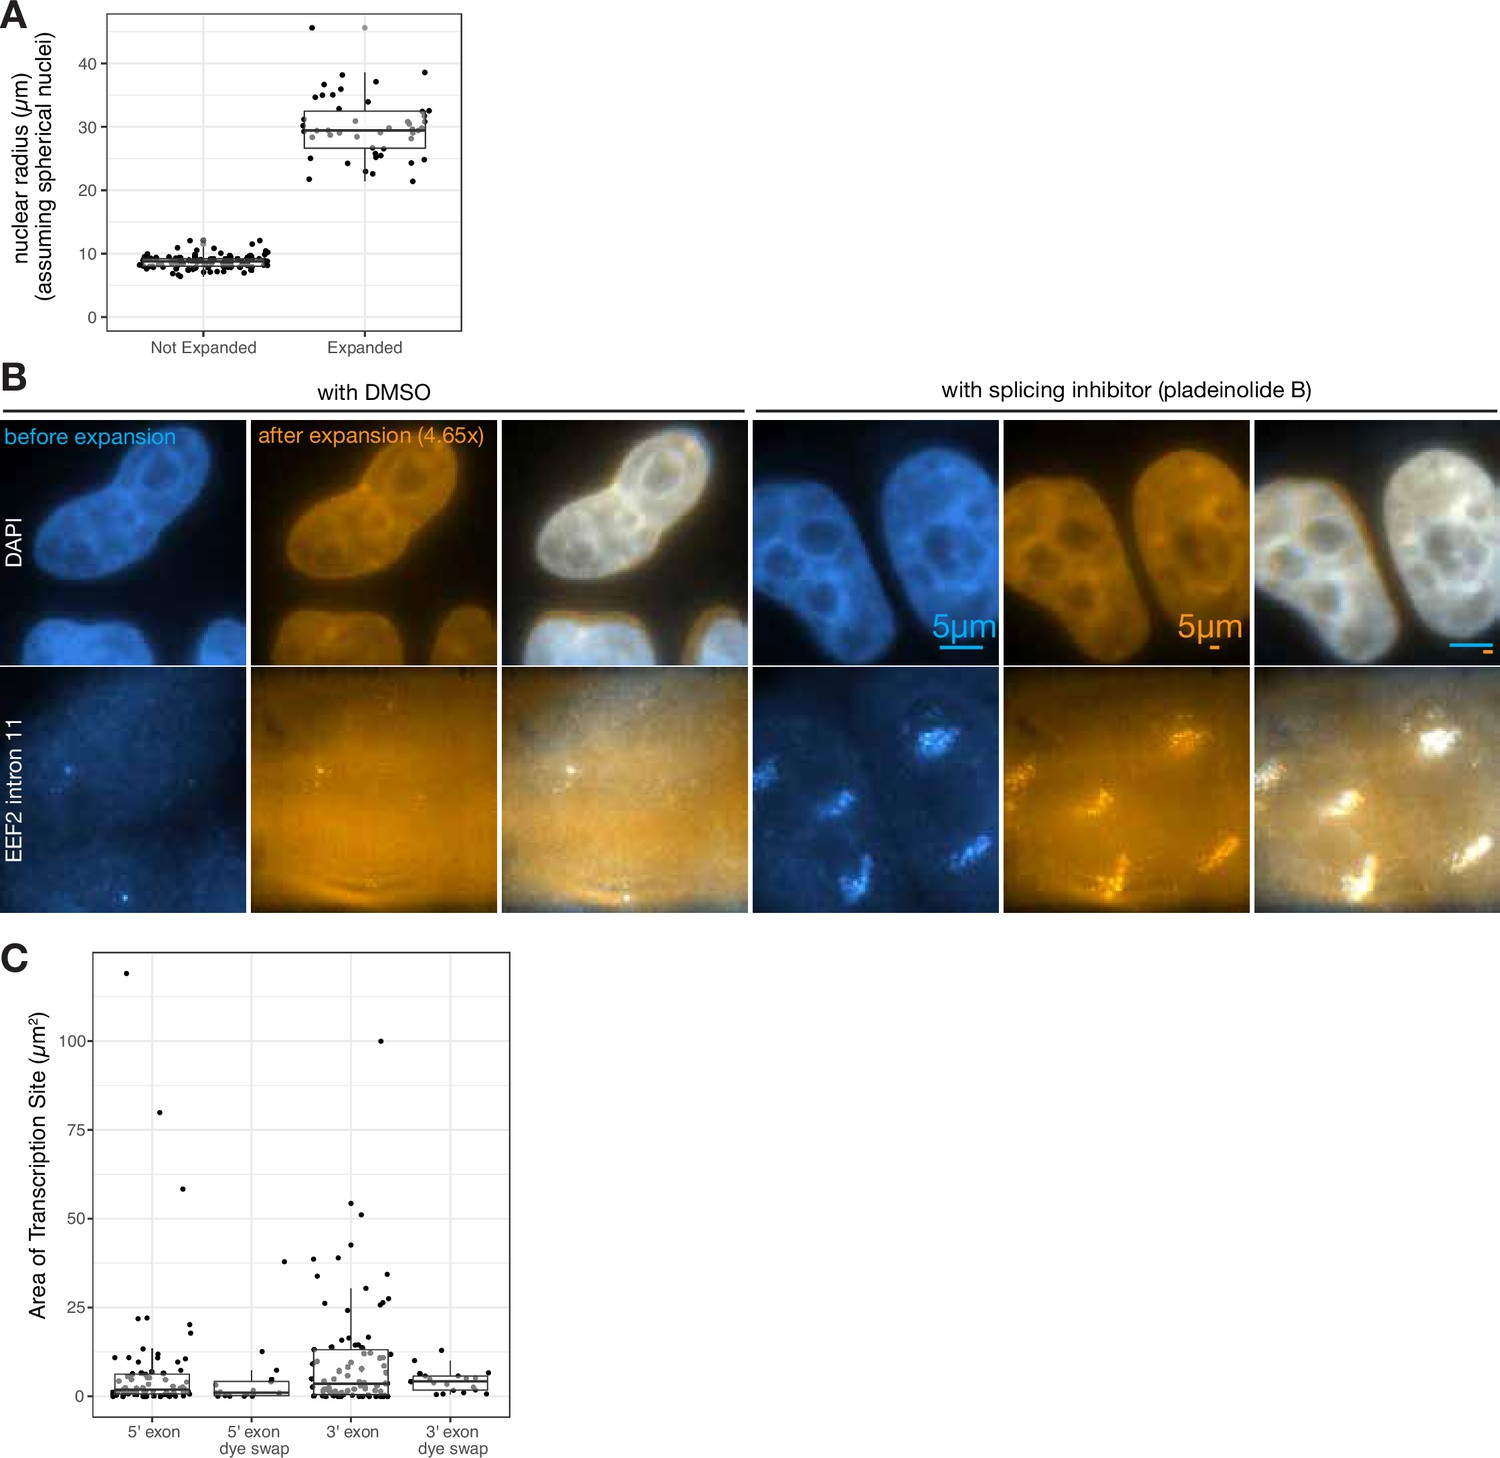
Expansion microscopy yields a 4.65-fold linear expansion and expands isotropically.
(A) Comparison of radii of nuclei (based on DAPI staining, and assuming spherical nuclei) before and after expansion. (B) Images of the same cell before and after expansion, with or without pladeinolide B treatment (as noted). Scale bars = 5 μm. (C) Transcription site area (microns squared) for 5’ and 3’ probes, with and without dye swap.
Figure 2—figure supplement 2
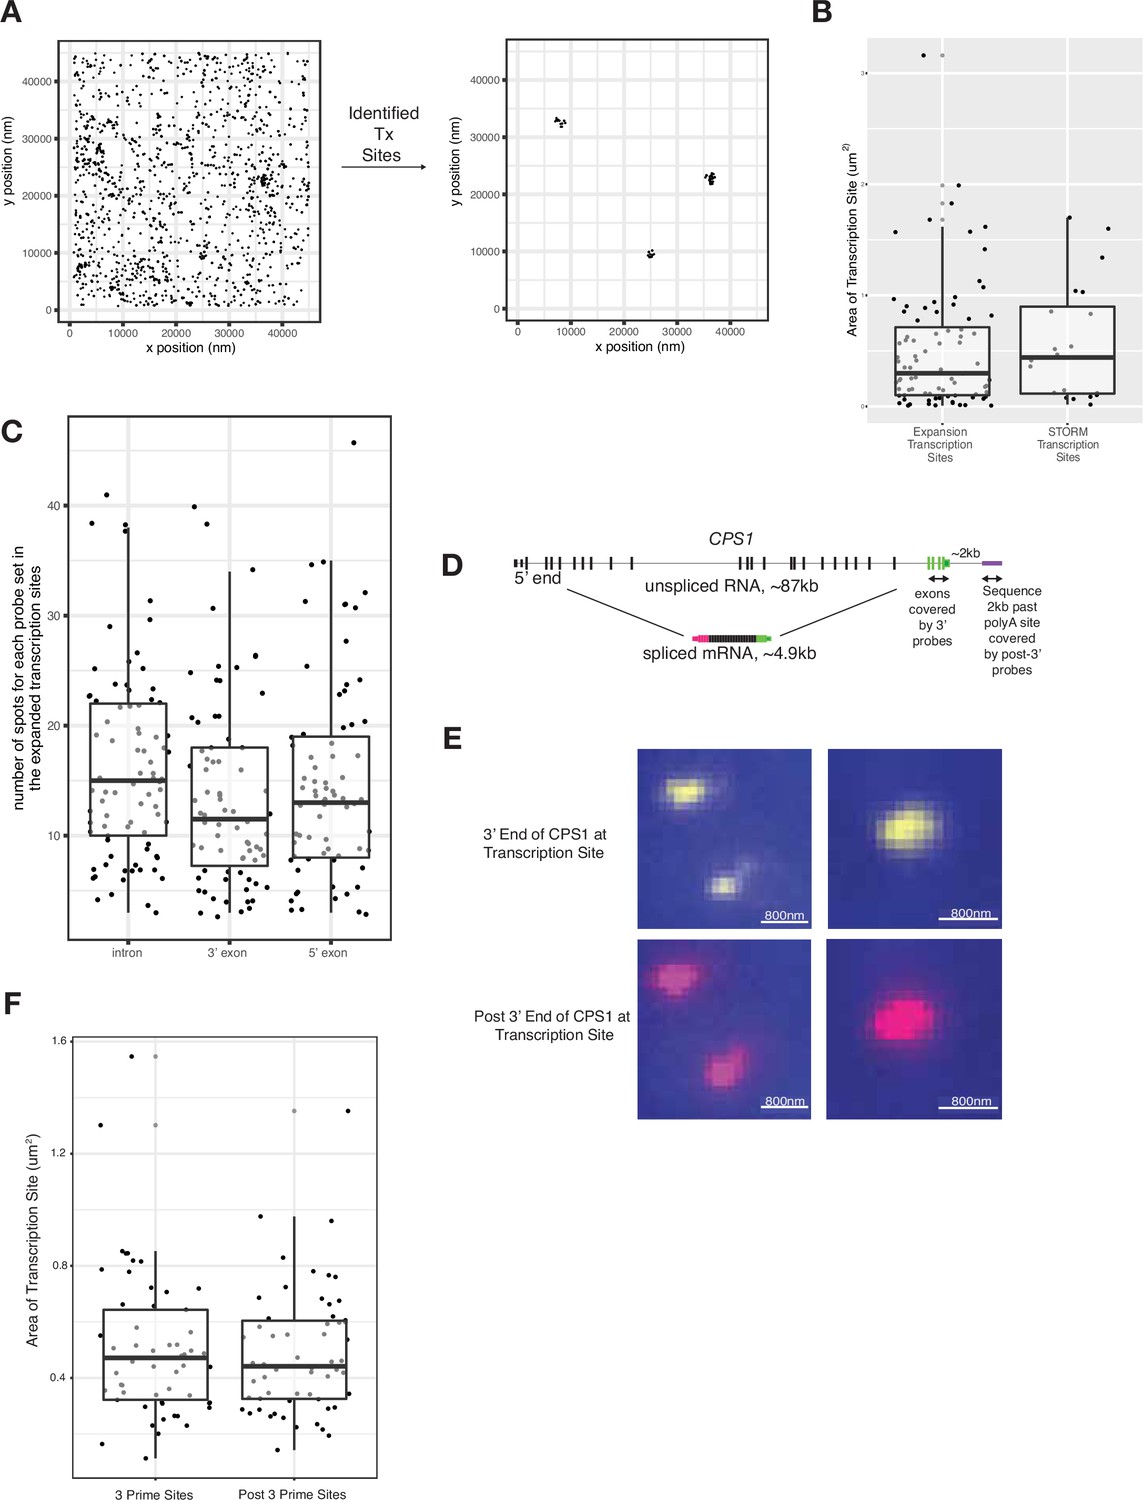
Stochastic optical reconstruction microscopy (STORM) validation and post-3’ RNA FISH.
(A) Sample STORM image to demonstrate identification of transcription sites. (B) Comparison of CSP1 transcription site size in cells imaged through expansion microscopy and STORM. Distances are in unexpanded space. (C) Quantification of spots within transcription site clouds exemplified in Figure 2C. (D) Gene and probe position diagram for CPS1 pre-mRNA to test for a potential tether beyond the 3’ end of the gene. (E) Representative images of 3’ and post-3’ RNA FISH signal at transcription sites (in unexpanded cells). (F) Comparison of 3’ and post-3’ RNA FISH signal at transcription sites.
Figure 2—figure supplement 3

Intron characteristics do not influence dispersal.
(A) Comparison of intron size versus mean dispersal by RNA FISH. (B–C) Comparison of 3’ splice site (X3SS), (B) and 5’ splice site (X5SS), (C) scores versus mean dispersal by RNA FISH.
Figure 3 with 3 supplements
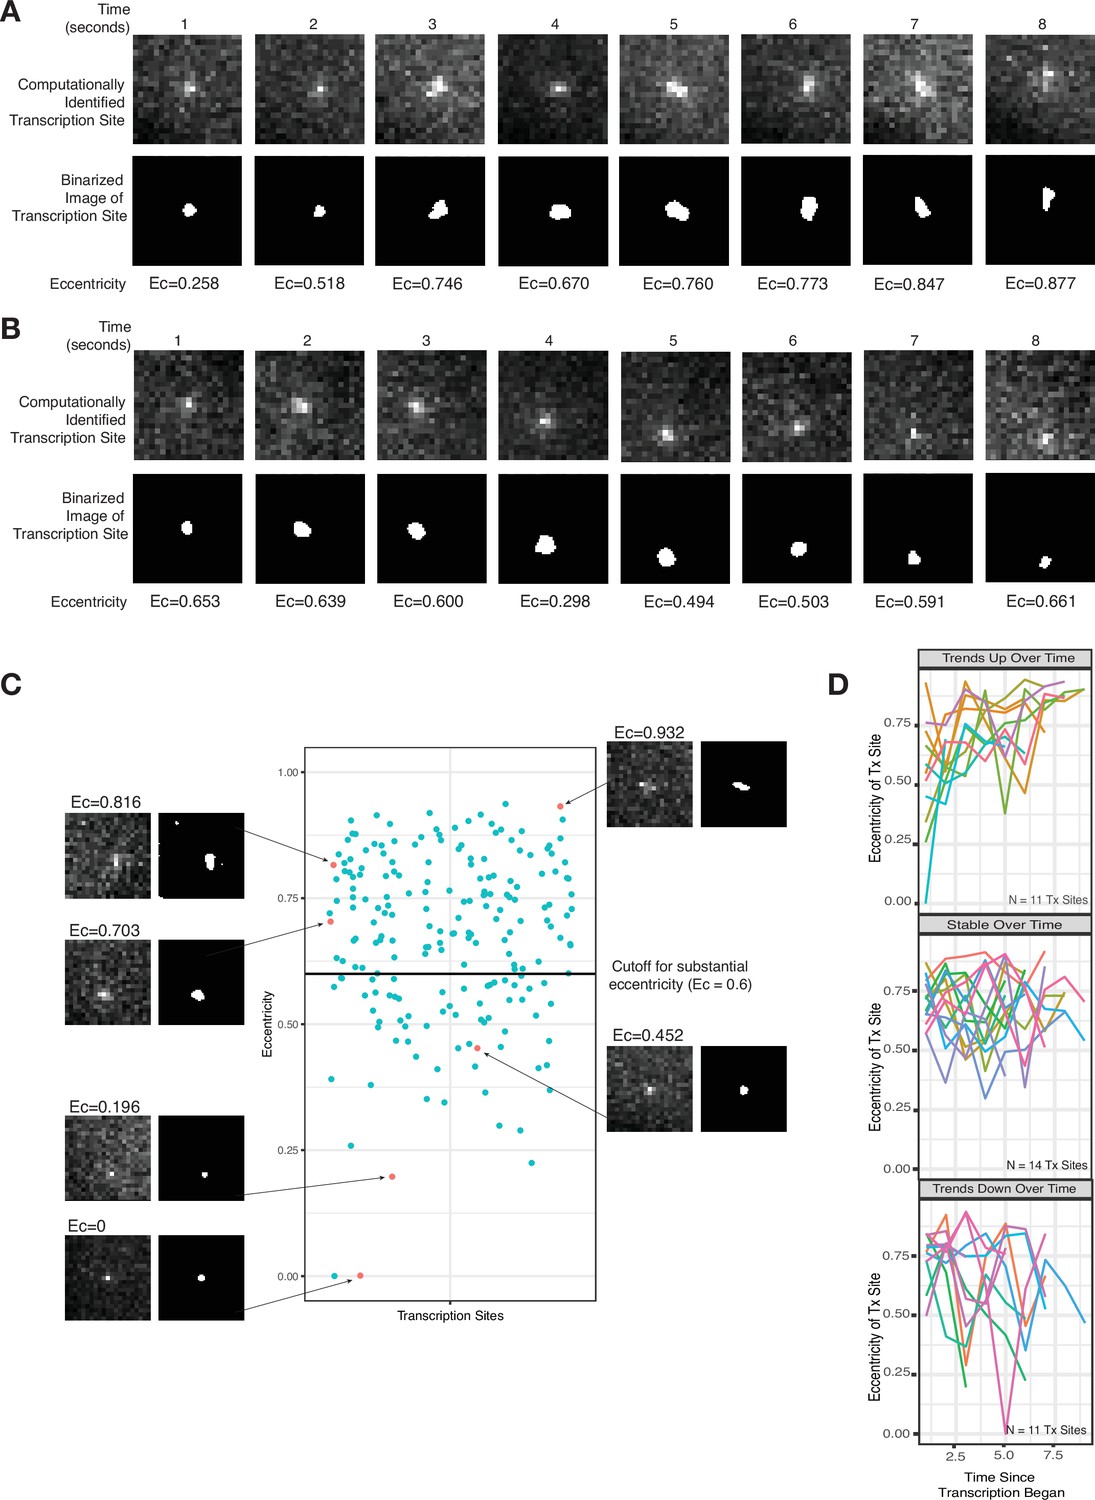
Live-cell imaging corroborates a slow-moving zone around the site of transcription.
(A–B) Representative images from two cells of a transcriptional burst of TFF1 labeled with MS2-GFP. Each image is taken 1 s apart. Shown are the raw, computationally identified transcription site images, as well as the binarized image used to calculate eccentricity. (C) Plot of eccentricity for each transcription site image, alongside representative images that show both eccentric and non-eccentric sites. (D) Graphs of eccentricity measured in individual transcription sites tracked over time.
Figure 3—video 1
Representative example of live-cell videos analyzed in Figure 3.
The 3’ UTR of the gene TFF1 was labeled with MS2-GFP, with one z-plane image captured every second. The pixel size was 0.066 microns. Raw TIFFs used to generate .MOV files are available on the Dryad repository for this paper.
Figure 3—video 2
Representative example of live-cell videos analyzed in Figure 3.
The 3’ UTR of the gene TFF1 was labeled with MS2-GFP, with one z-plane image captured every second. The pixel size was 0.066 microns. Raw TIFFs used to generate .MOV files are available on the Dryad repository for this paper.
Figure 3—video 3
Representative example of live-cell videos analyzed in Figure 3.
The 3’ UTR of the gene TFF1 was labeled with MS2-GFP, with one z-plane image captured every second. The pixel size was 0.066 microns. Raw TIFFs used to generate .MOV files are available on the Dryad repository for this paper.
Figure 4 with 1 supplement
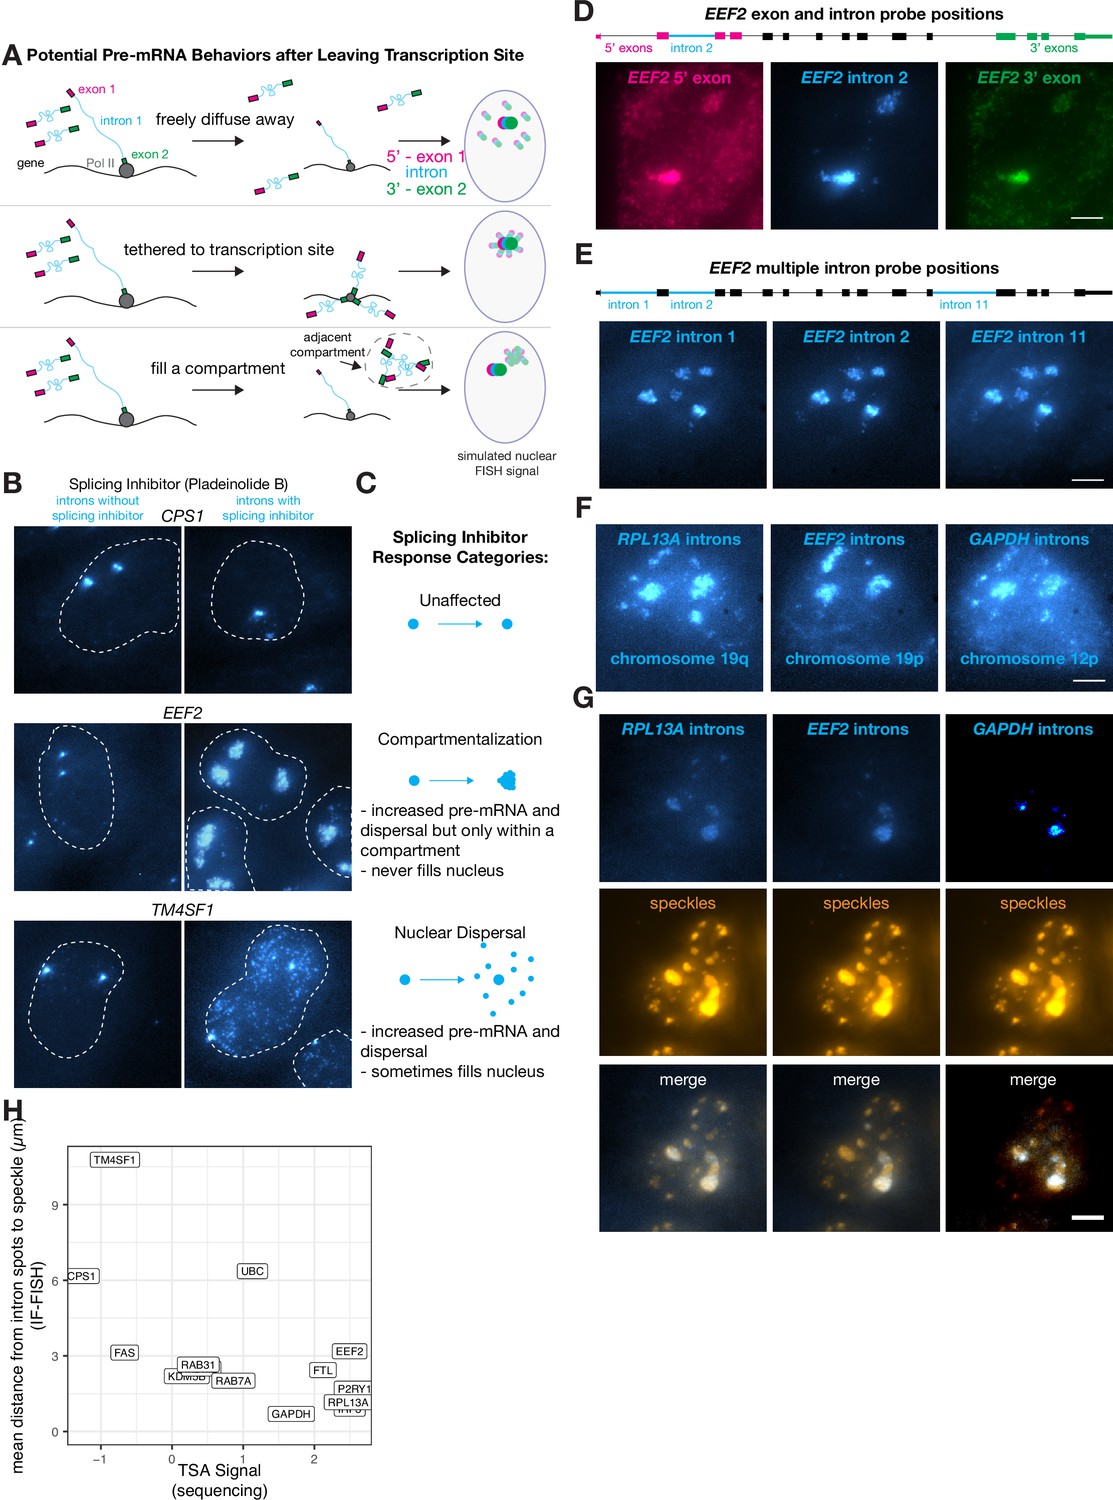
Some transcripts localize to a speckle-proximal compartment after splicing inhibition.
(A) Schematic of possibilities for RNA movement post- transcription. (B) Example images of introns of specified genes before and after pladienolide B treatment (treatment status as indicated in figure). Outline represents nucleus. (C) Description of three response types to pladienolide B. (D) EEF2 RNA FISH exon and intron images with pladeinolide B treatment. Scale bar = 5 µm. (E) EEF2 RNA FISH intron only images with pladeinolide B treatment. Scale bar = 5 µm. (F) RPL13A, GAPDH, and EEF2 RNA FISH intron images with pladeinolide B treatment. Scale bar = 5 µm. (G) Co-staining of RNA FISH for specified intron and SC35 IF in the same cell treated with pladeinolide B. Scale bar = 5 µm. (H) Quantification of speckle decile from previously published data (Tyramide Signal Amplification [TSA]-Seq 2.0), compared with distance from nearest speckle calculated based on RNA FISH of specified genes without pladeinolide B treatment.
Figure 4—figure supplement 1

Compartmentalization genes before splicing inhibition.
(A) Schematic of compartmentalization phenotype with and without tether. (B) RNA FISH of RPL13A, EEF2, and GAPDH introns before pladienolide B treatment. Scale bar = 5 μm. (C) Combined RNA FISH for the stated introns and IF for SC35, before pladienolide B treatment. Scale bar = 5 μm.
Figure 5
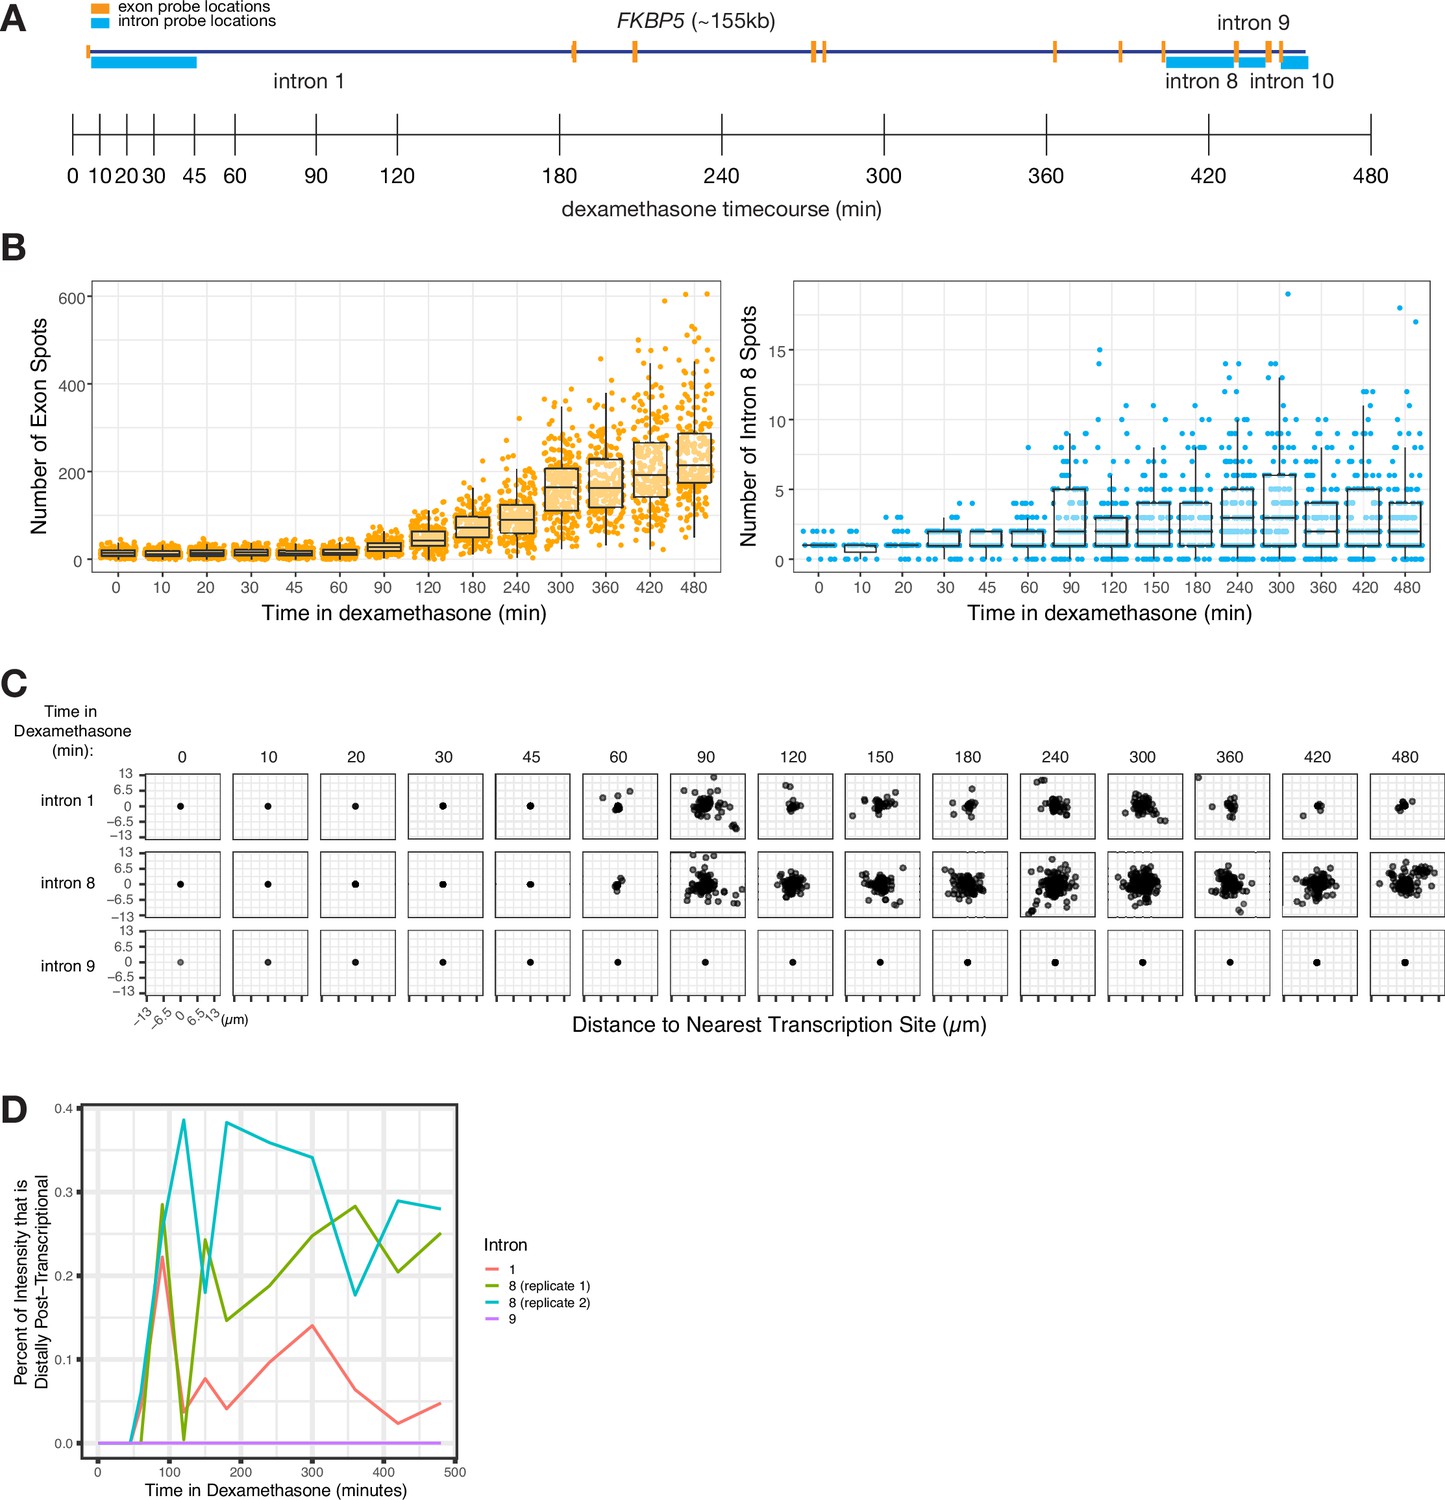
Intron dispersal varies with transcription level and is therefore not an inherent property of each intron.
(A) Gene and probe diagram for FKBP5 and schematic of dexamethasone treatment schedule. (B) Quantification of FKBP5 RNA FISH exon and intron spots over time of treatment in dexamethasone (in A549 cells). (C) Dispersal graphs (as quantified from RNA FISH) of FKBP5 introns 1, 8, and 9 over time in dexamethasone (in A549 cells). (D) Graph showing the percentage of intron intensity that is distally post-transcriptional for three FKBP5 introns over time in dexamethasone.
Tables
Key resources table
| Reagent type (species) or resource | Designation | Source or reference | Identifiers | Additional information |
|---|---|---|---|---|
| Antibody | Anti-SC35 (mouse monoclonal) | Abcam | ab11826 | IF: (1:200) |
| Antibody | Phospho S2 polymerase II (rat monoclonal) | Active Motif | 61083 | IF: (1:200) |
| Cell line (Homo sapiens) | HeLa | Lab of Dr. Phillip Sharp (MIT) | ||
| Cell line (Homo sapiens) | HeLa-S3 | ATCC | CCL-2.2 | |
| Cell line (Homo sapiens) | A549 | ATCC | CCL-185 | |
| Cell line (Homo sapiens) | CRL-2097 | ATCC | CCD-1079Sk | |
| Chemical compound, drug | Pladienolide B | Tocris Biosciences | 6070500U | |
| Chemical compound, drug | Dexamethasone | Sigma | D2915 | |
| Chemical compound, drug | 4sU (4-thiouridine) | Sigma | T4509 | |
| Sequence-based reagent | Single-molecule RNA FISH probes targeting CSP1, FKBP5, TM4SF1, and EEF2 | IDT DNA | See Supplementary file 2 for sequences | |
| Software, algorithm | rajlabimagetools | GitHub; Raj et al., 2018 | https://github.com/arjunrajlaboratory/rajlabimagetools | |
| Software, algorithm | KNIME | GitHub; Larson and Wan, 2019 | https://github.com/CBIIT/Larson-Lab-CCR-NCI/tree/master/Wan_GeneTrap_2019/KNIME_Workflows | |
| Software, algorithm | STAR (v2.5.1a) | Dobin et al., 2013 |
Additional files
-
MDAR checklist
- https://cdn.elifesciences.org/articles/91357/elife-91357-mdarchecklist1-v1.pdf
-
Supplementary file 1
Tables showcasing distal post-transcriptional splicing and splicing order.
(A) Dispersal and percent of splicing that occurs distally post-transcriptional, as assayed through RNA FISH. Each row indicates one probe set. (B) Percent of intermediate splicing products that splice in one order versus the other, indicating that splicing can generally occur in any order.
- https://cdn.elifesciences.org/articles/91357/elife-91357-supp1-v1.docx
-
Supplementary file 2
List of oligo sequences used to generate FISH probes.
- https://cdn.elifesciences.org/articles/91357/elife-91357-supp2-v1.csv
Download links
A two-part list of links to download the article, or parts of the article, in various formats.
Downloads (link to download the article as PDF)
Open citations (links to open the citations from this article in various online reference manager services)
Cite this article (links to download the citations from this article in formats compatible with various reference manager tools)
Post-transcriptional splicing can occur in a slow-moving zone around the gene
eLife 12:RP91357.
https://doi.org/10.7554/eLife.91357.3


