Foxp3 depends on Ikaros for control of regulatory T cell gene expression and function
- Center for Spatial and Functional Genomics, The Children’s Hospital of Philadelphia, United States
- Department of Pathology, Perelman School of Medicine at the University of Pennsylvania and The Children’s Hospital of Philadelphia, United States
- Department of Pediatrics, Perelman School of Medicine at the University of Pennsylvania and The Children’s Hospital of Philadelphia, United States
Figures
Figure 1 with 1 supplement
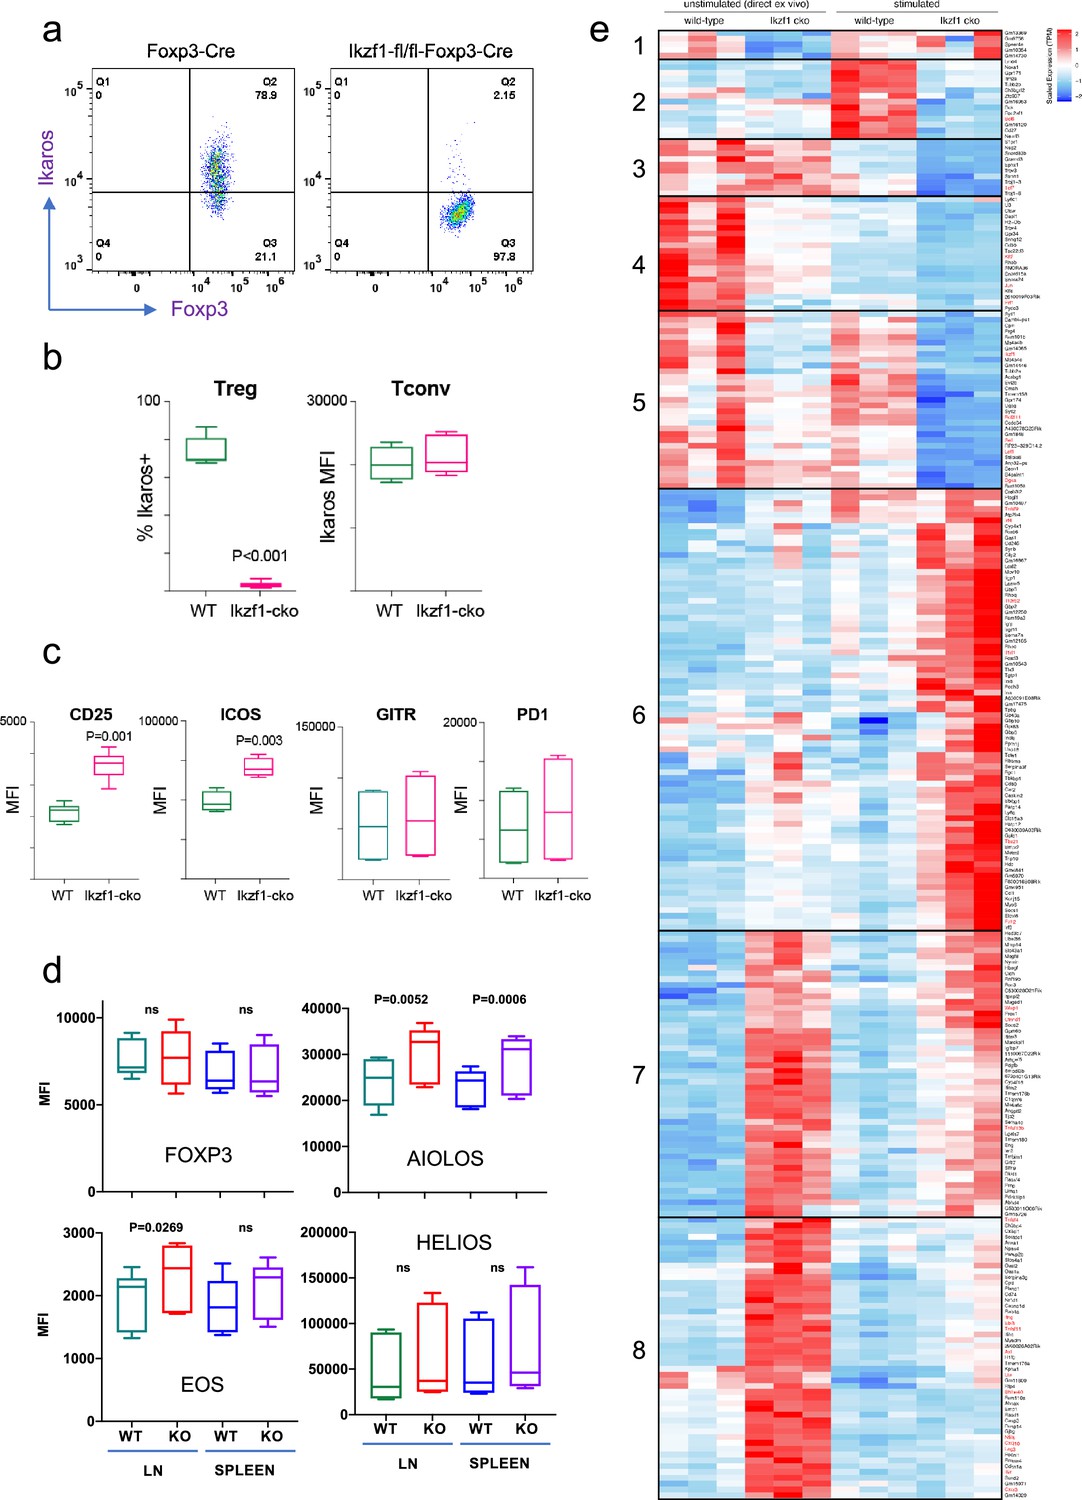
Impact of loss of Ikaros function on peripheral regulatory T cells (Treg) phenotype.
Example histograms (a) and quantified expression (b) of Ikaros protein by peripheral Treg and Tconv from Foxp3-YFP-Cre (green) and Ikzf1-fl-Foxp3-YFP-Cre (red) mice (n=6 mice per group). (c) Expression of CD25, ICOS, GITR, and PD1 by wild-type (WT) (green) and Ikzf1-cko (red) Treg (n=6 mice per group). (d) Flow cytometric measurement of Foxp3, Aiolos, Eos, and Helios protein expression in WT and Ikzf1-cko Treg (n=6 mice per group). (e) Transcriptomic analysis of WT vs. Ikzf1-cko Treg gene expression. Top differentially expressed genes (FDR <0.05) organized into eight clusters in ex vivo or in vitro stimulated WT and Ikzf1-cko Treg. The heatmap represents scaled transcripts per million (tpm, n=3 replicates per group).
Figure 1—figure supplement 1
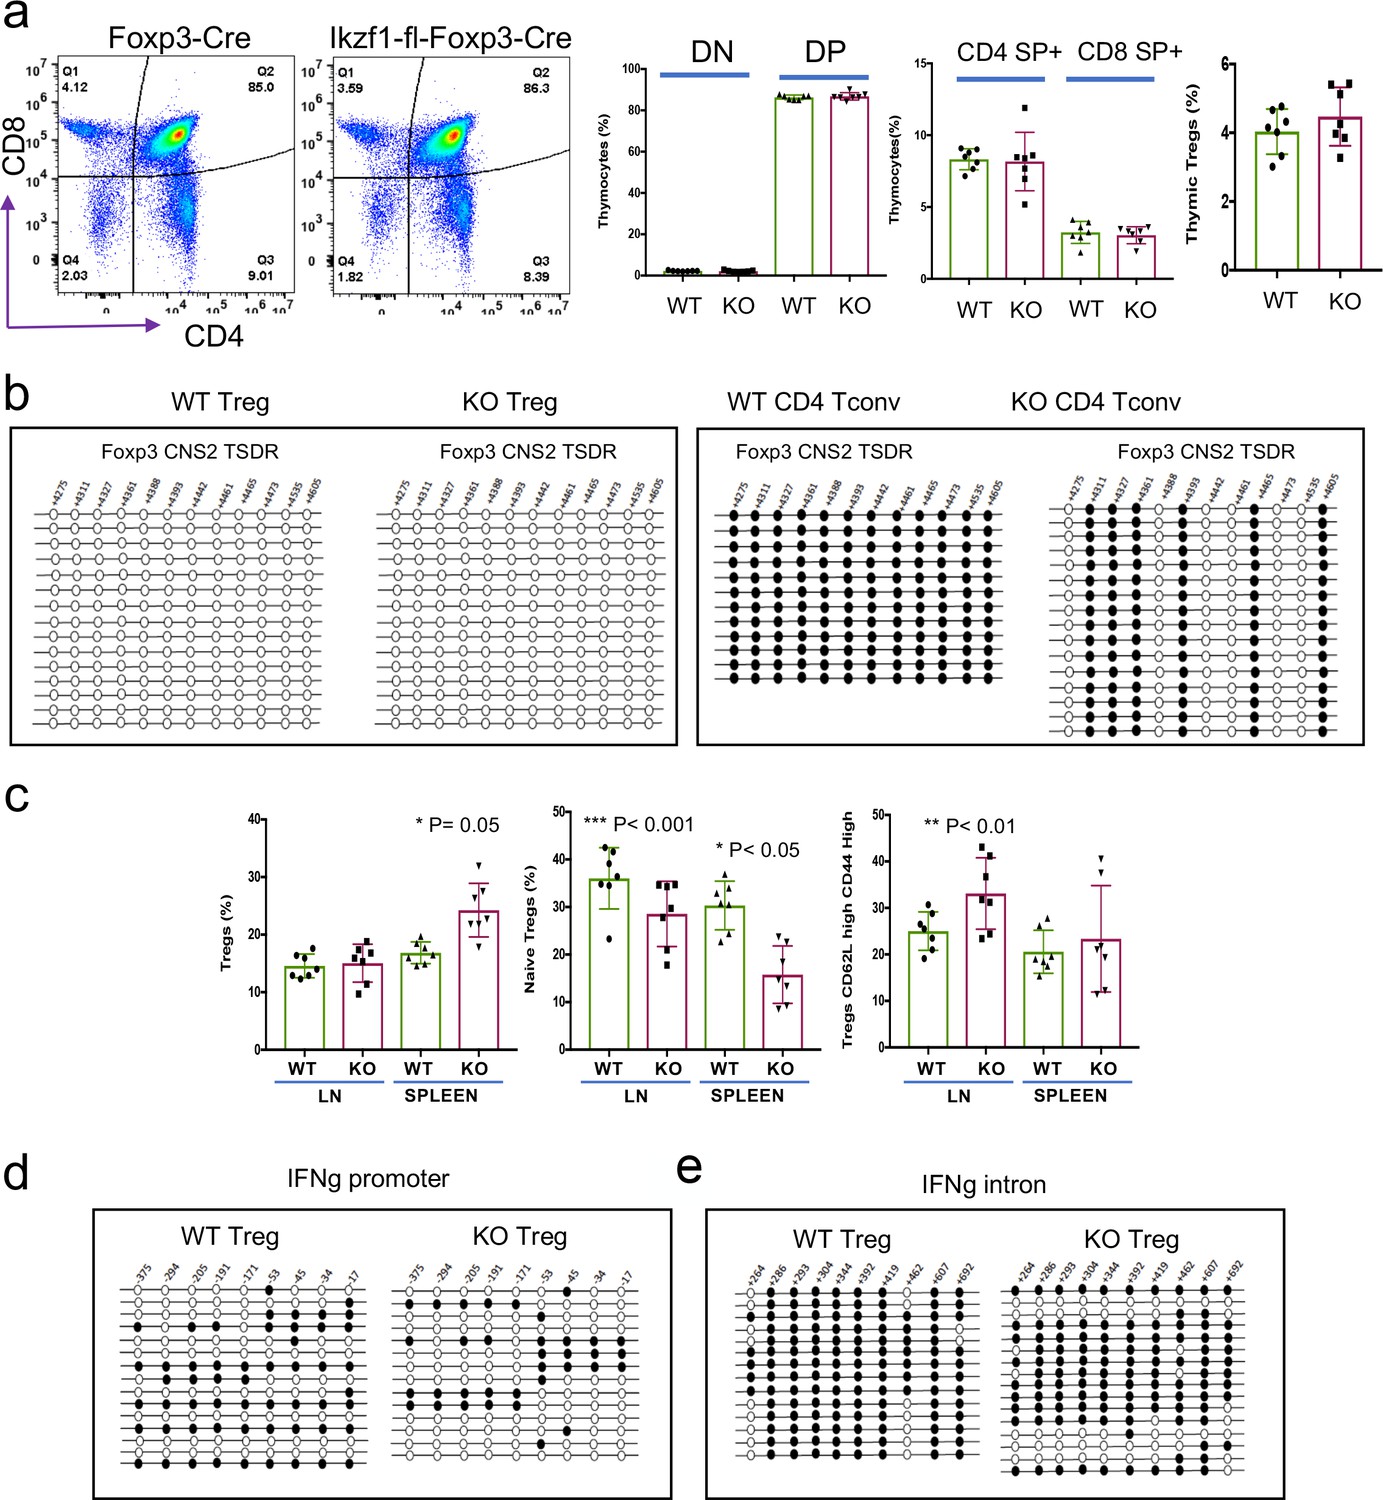
Immunophenotyping and DNA methylation analyses.
Immunophenotyping of thymi from Ikzf1-fl-Foxp3-YFP-Cre or Foxp3-YFP-Cre control mice (a). Bisulfite DNA methylation analysis of the Foxp3 CNS2/TSDR region in peripheral regulatory T cells (Treg) and Tconv from Ikzf1-fl-Foxp3-YFP-Cre or Foxp3-YFP-Cre control mice (b). Quantification of total peripheral Treg, CD44lo cTreg, and CD44hi eTreg in Ikzf1-fl-Foxp3-YFP-Cre and Foxp3-YFP-Cre mice (c). Bisulfite DNA methylation analysis of the IFNg promoter (d) and IFNg intronic enhancer (e) regions in peripheral Treg and Tconv from Ikzf1-fl-Foxp3-YFP-Cre or Foxp3-YFP-Cre control mice.
Figure 2
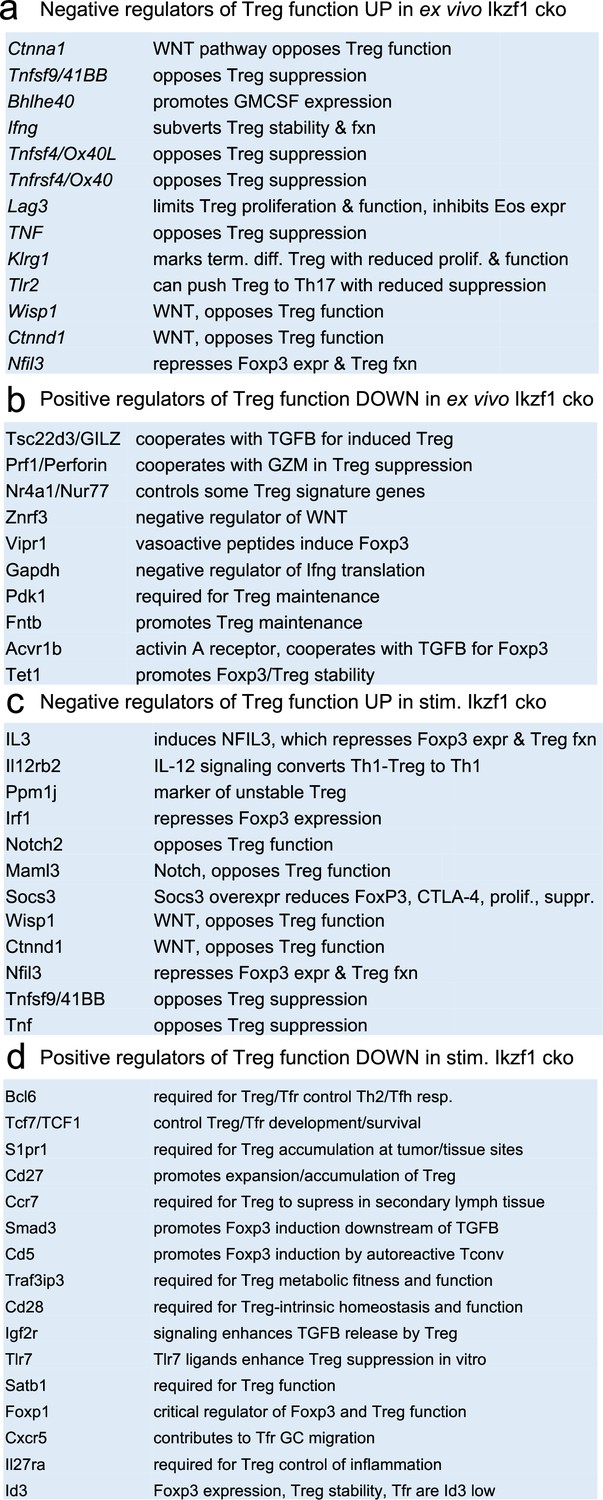
Survey of relevant differentially expressed genes in wild-type (WT) vs.Ikzf1-cko regulatory T cells (Treg).
(a) Known negative regulators of Treg function up-regulated in ex vivo Ikzf1-cko Treg, (b) positive regulators of Treg function down-regulated in ex vivo Ikzf1-cko Treg, (c) negative regulators of Treg function up-regulated in in vitro stimulated Ikzf1-cko Treg, (d) positive regulators of Treg function down-regulated in in vitro stimulated Ikzf1-cko Treg. See Supplementary file 1 for all differential genes and Supplementary file 2 for a larger list of functionally relevant differentially expressed genes.
Figure 3
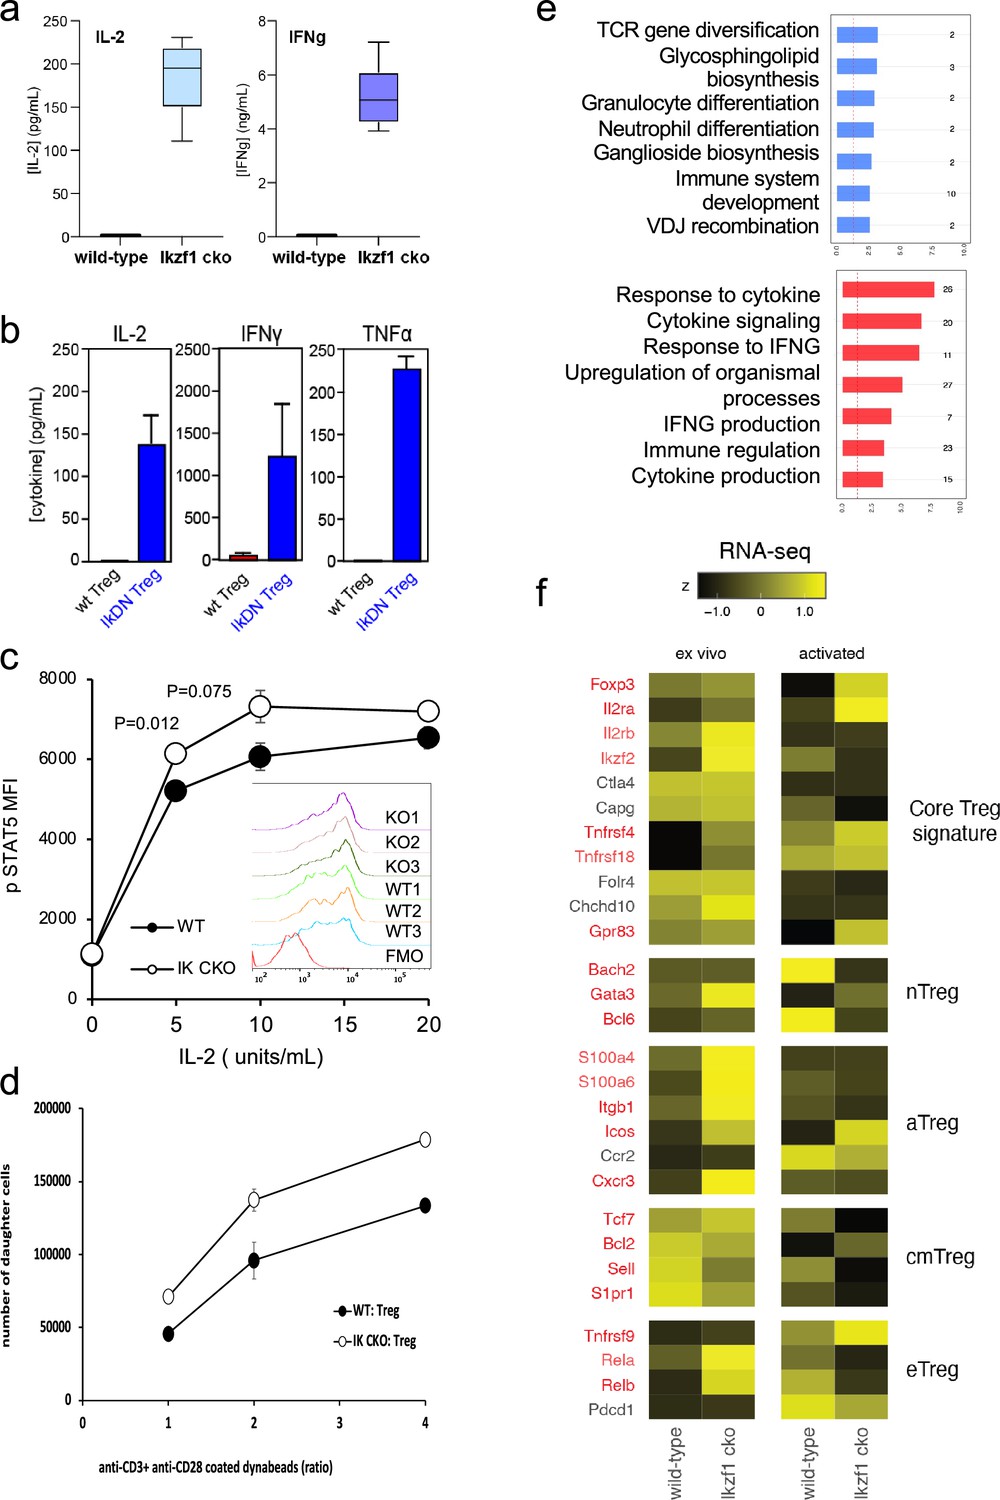
In vitro analysis of wild-type (WT) vs. Ikzf1-cko regulatory T cells (Treg).
(a) Secretion of IL-2 and IFNg protein by WT and Ikzf1-cko Treg measured by ELISA (n=3). (b) IL-2, IFNg, and TNFa production by Treg from WT mice vs. mice with a dominant-negative form of Ikaros (IkDN) measured by ELISA (n=3). (c) IL-2-induced phosphorylation of STAT5 in WT and Ikzf1-cko Treg measured by flow cytometry in vitro. Mean fluorescence intensity (MFI) and individual histograms (inset, n=3) are depicted. (d) Activation-induced proliferation of WT (closed) and Ikzf1-cko (open) Treg measured by dye dilution (n=3). (e) Gene ontology analysis of genes down-regulated (top panel) and up-regulated (bottom panel) in Ikzf1-cko compared to WT Treg. The x-axis is fold enrichment and numbers to the right are unique genes in each pathway. (f) Differential expression of core Treg, nTreg, aTreg, cTreg, and eTreg genes (Shevyrev and Tereshchenko, 2019) in ex vivo (left panel) and in vitro stimulated (right panel) WT and Ikzf1-cko Treg. The heatmap represents z-score and genes significantly differentially expressed are shown in red.
Figure 4
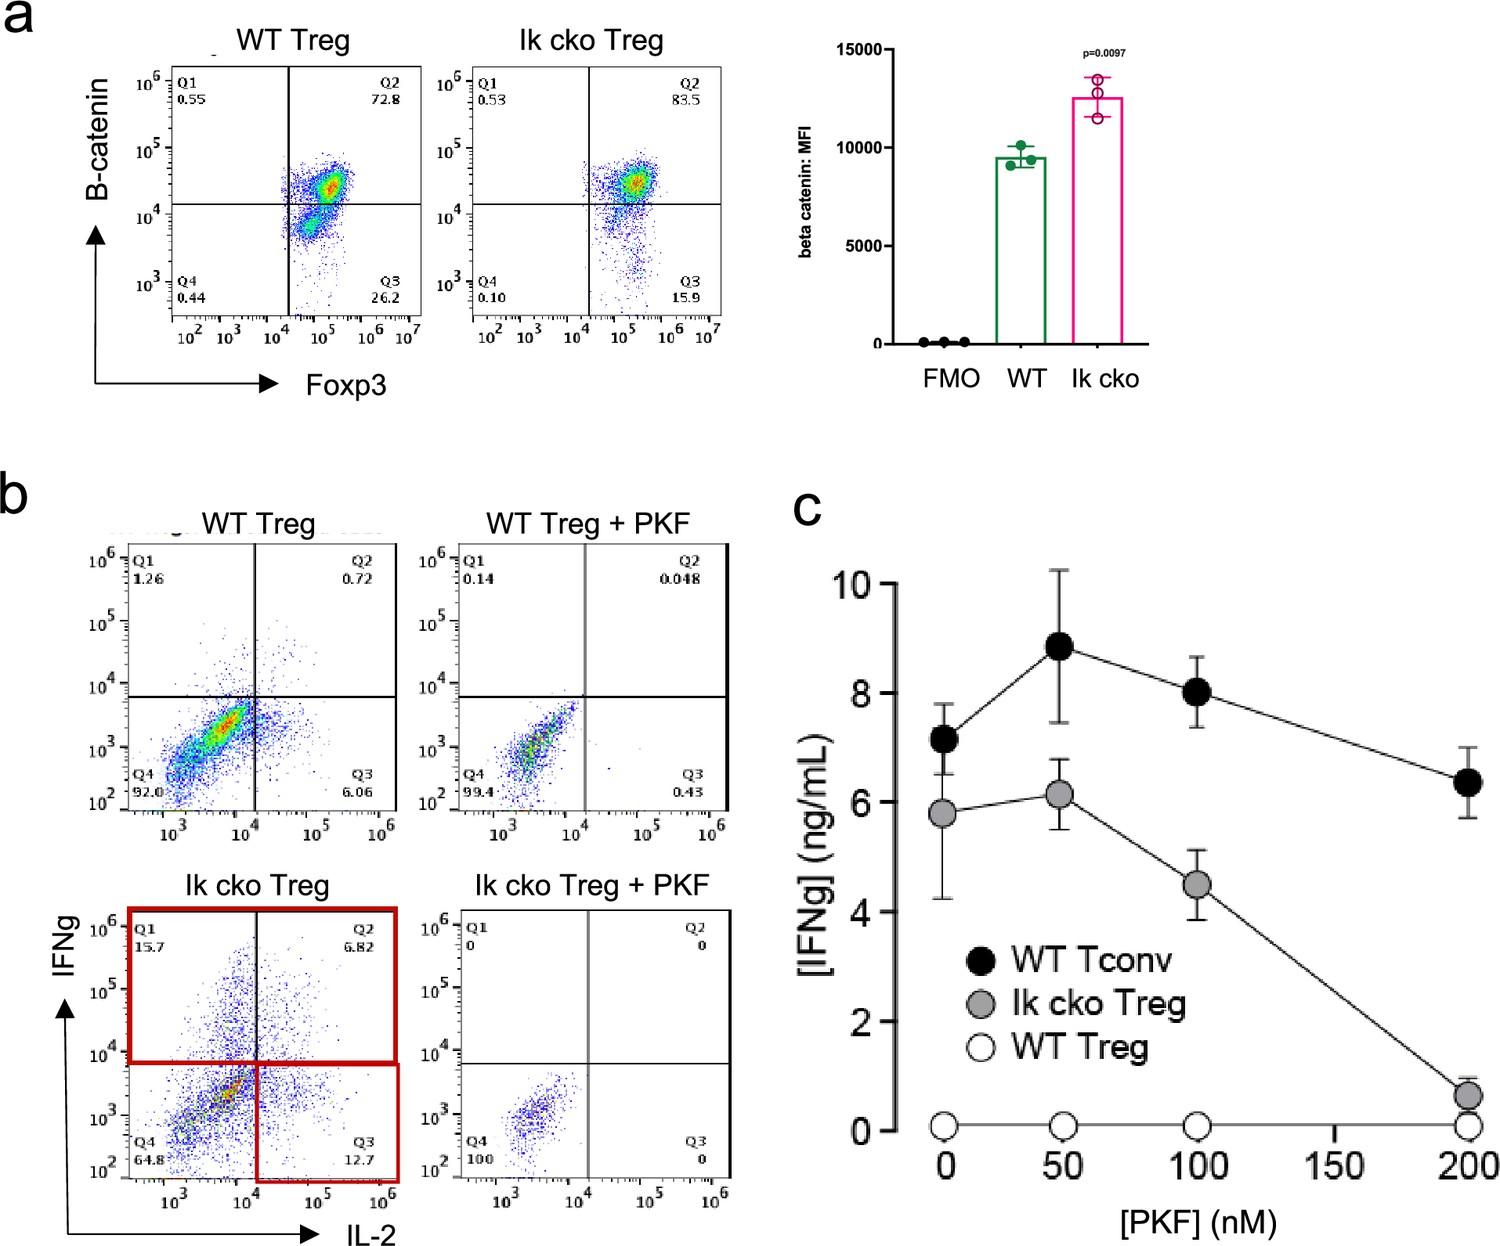
Ectopic activation of the Wnt-catenin pathway in Ikzf1-cko regulatory T cells (Treg).
(a) Expression of B-catenin by wild-type (WT) (left histogram) vs. Ikzf1-cko (right histogram) Treg measured by flow cytometry (plot depicts B-catenin mean fluorescence intensity (MFI) from n=3 experiments). (b) IFNg secretion by WT (top panels) vs. Ikzf1-cko (bottom panels) Treg activated with (right panels) or without (left panels) the Wnt pathway inhibitor PKF. (c) IFNg secretion (measured by ELISA) by Ikzf1-cko Treg, but not by conventional T cells, is inhibited in a dose-dependent manner by PKF (n=3).
Figure 5 with 3 supplements
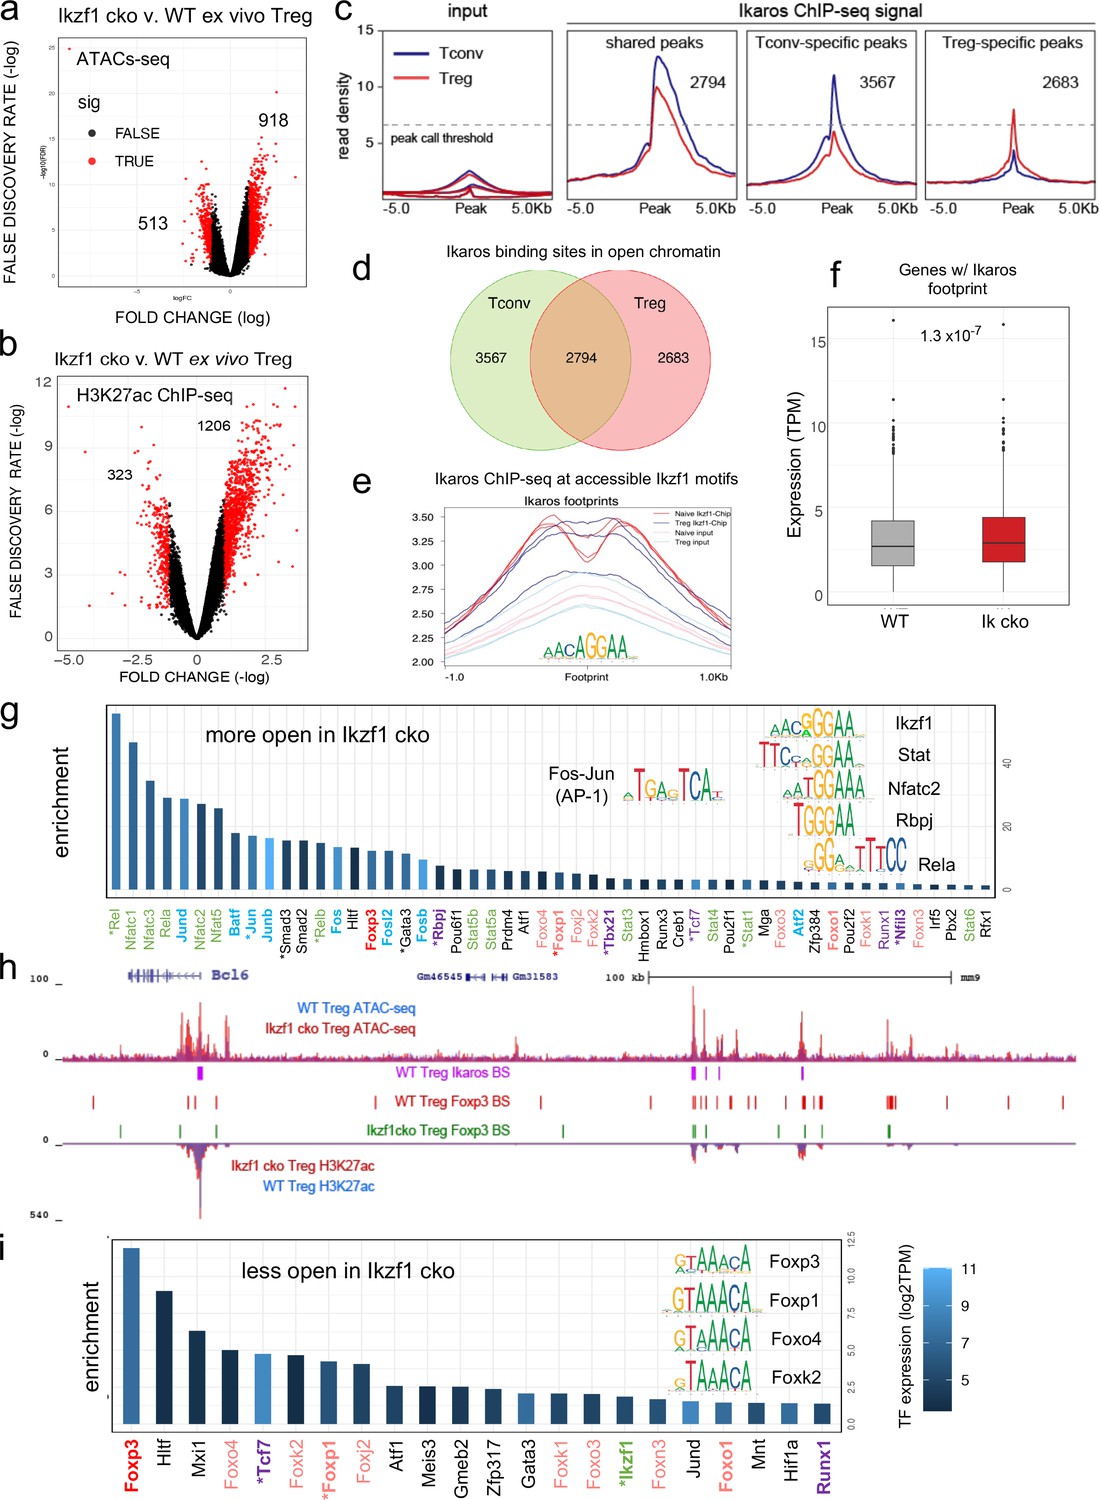
Genome-wide assessment of open chromatin, histone acetylation, and Ikaros occupancy in wild-type (WT) and Ikzf1-cko regulatory T cells (Treg).
Differential analysis of open chromatin (a) and H3K27ac (b) in WT vs. Ikzf1-cko Treg (FDR <0.05, n=3). Peaks with FC >2 are depicted in red. (c) Ikaros ChIP-seq signal (read density) at genomic regions shared (panel 2) in Tconv (blue) vs. Treg (red), unique to Tconv (panel 3), or unique to Treg (panel 4). Panel 1 depicts read densities at the same regions in control input libraries. (d) Unique vs. shared Ikaros binding sites in Treg (red) vs. Tconv (green) open chromatin. (e) Enrichment of Ikaros ChIP-seq signal (footprint, solid lines) or input background (transparent lines) at accessible Ikaros motifs (AGGAA) in WT Treg (blue) and Tconv (red). (f) Expression (tpm) of genes with open chromatin enriched for the Ikaros consensus binding motif in WT vs. Ikzf1-cko Treg. (g) Enrichment of TF consensus binding motifs in genomic regions that are more accessible in Ikzf1-cko Treg. Inset depicts motifs for Ikaros/Ikzf1, Stat, Nfat, Rbpj, Rela, and AP-1. (h) Open chromatin (top tracks) and H3K27ac (bottom tracks) in WT (blue) and Ikzf1-cko (red) Treg, Ikaros binding sites (purple marks) and Foxp3 binding sites (red marks) in WT Treg, and Foxp3 binding sites in Ikzf1-cko Treg (green marks) at the Bcl6 locus. (i) Enrichment of TF consensus binding motifs in genomic regions that are less accessible in Ikzf1-cko Treg. Inset depicts motifs for forkhead family members. In (g) and (i), factors with roles in Treg function are colored green and purple, forkhead family members are colored red, and factors differentially expressed in Ikzf1-cko Treg are indicated with an asterisk. ATAC-seq was performed on Treg purified directly ex vivo, while ChIP-seq analyses were performed on Treg expanded in vivo using IL-2/anti-IL-2 complexes.
Figure 5—figure supplement 1

ATAC-seq and H3K27ac ChIP-seq library metrics.
Assessment of wild-type (WT) and Ikzf1-cko ex vivo and stimulated regulatory T cells (Treg) library reproducibility by principal component (a) and spearman correlation (b) analysis. (c) Hierarchical clustering of 12,030 differentially accessible regions (DAR, FDR <0.05, abs[logFC]>1) into seven groups from the root. Red vs. blue indicate increased vs. decreased accessibility. (d) Enrichment of GO terms for genes nearest to differential accessibility (DAR) (FDR <0.05,>5 genes). (e) Association of DAR accessibility changes with changes in expression of the nearest gene. Enrichment is over the mean increase or decrease in expression, indicated by red vs. blue.
Figure 5—figure supplement 2
ATAC-seq and H3K27ac ChIP-seq library metrics.
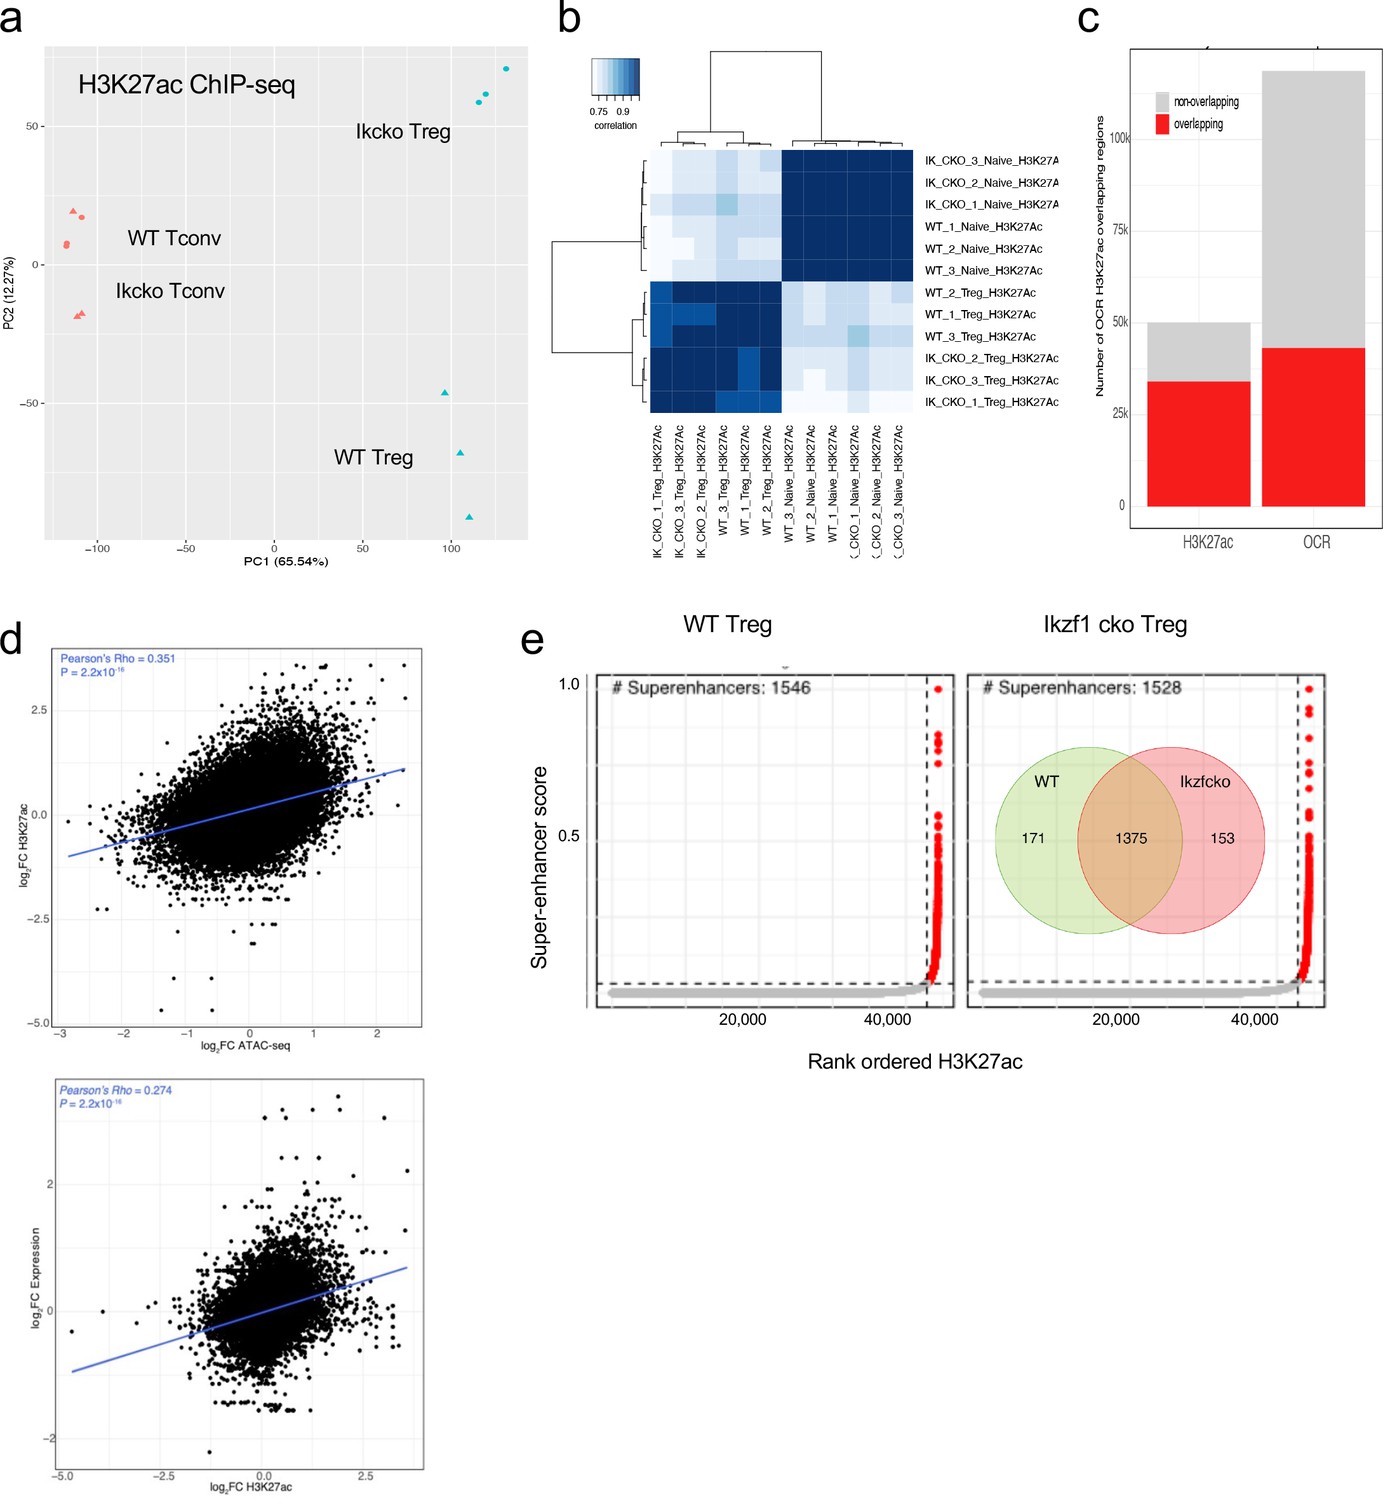
Assessment of WT and Ikzf1-cko H3K27ac ChIP-seq library reproducibility by principal component (a) and pairwise spearman correlation (b) analysis. Overlap (c) and Pearson correlation between ATAC-seq and H3K27ac ChIP-seq peaks and H3K27ac and gene expression (d). Identification of super-enhancer regions based on H3K27ac density (e). The Venn diagram (inset) depicts the number of super-enhancers shared between WT and Ikzf1-cko Treg (orange), unique to WT Treg (green), and unique to Ikzf1-cko Treg (red).
Figure 5—figure supplement 3
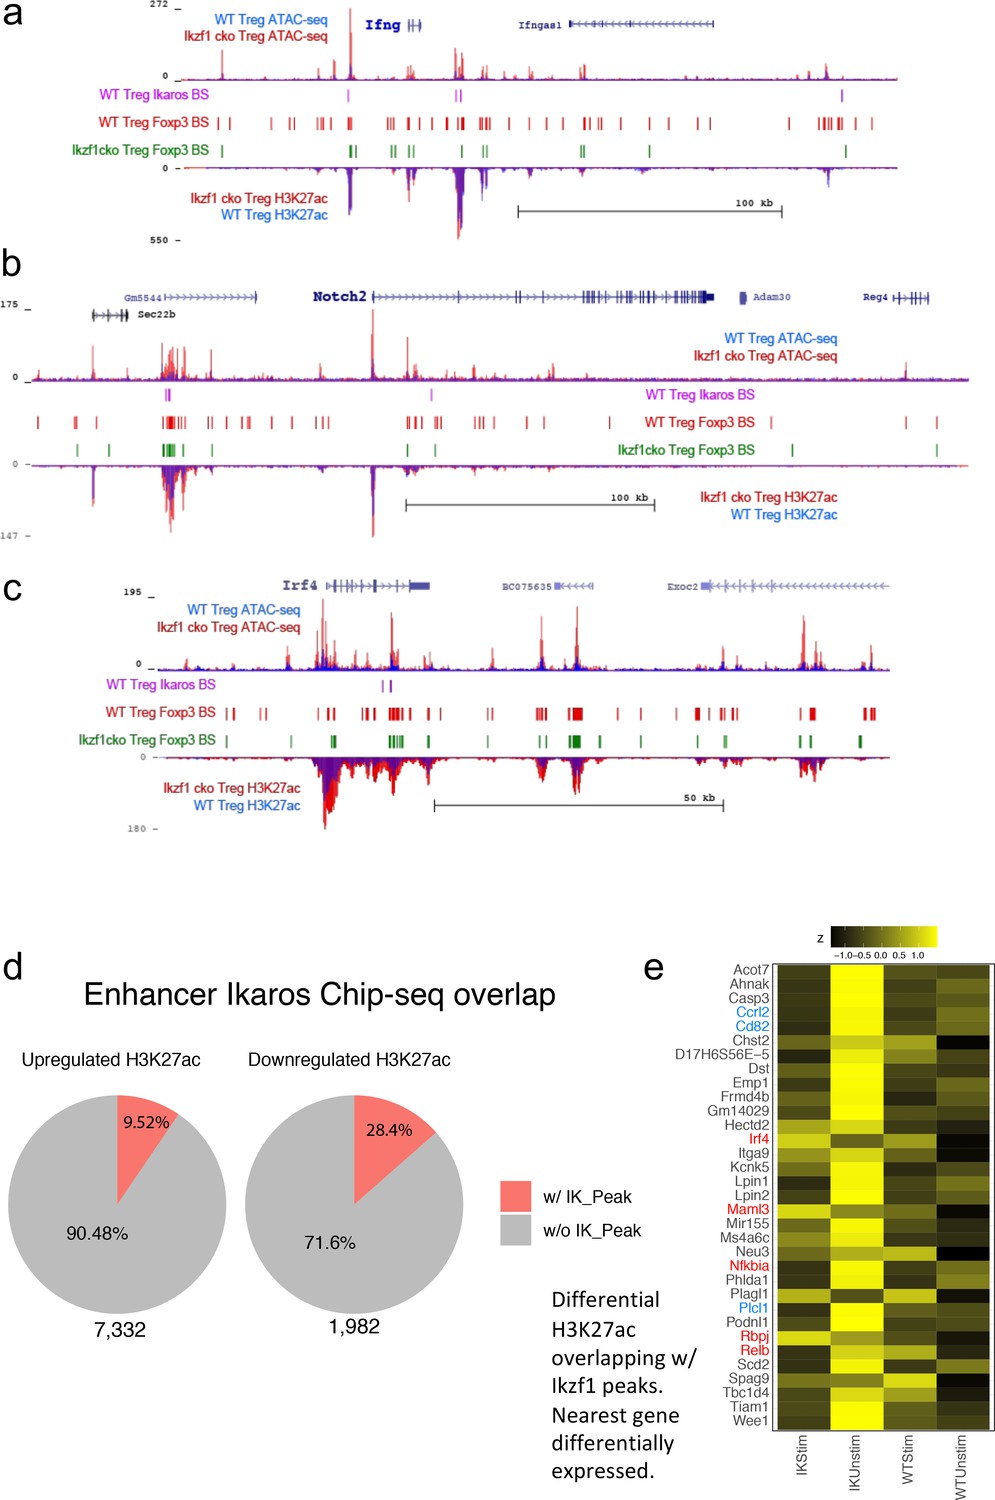
Multi-omic integration of differential ATAC-seq, ChIP-seq and RNA-seq analyses.
(a–c) Ikaros-dependent changes in accessibility, enhancer signatures, and Foxp3 occupancy at genes differentially expressed in Ikzf1-cko regulatory T cells (Treg). Open chromatin (top tracks) and H3K27ac (bottom tracks) in wild-type (WT) (blue) and Ikzf1-cko (red) Treg, Ikaros binding sites (purple marks) and Foxp3 binding sites (red marks) in WT Treg, and Foxp3 binding sites in Ikzf1-cko Treg (green marks) at the Ifng (a) and Notch2 (b) and Irf4 (c) loci. (d) Overlap between Ikaros ChIP-seq peaks and differentially acetylated regions is indicated in red in the pie charts. (e) Differential H3K27ac (z-score) at top Ikaros-bound DEG in ex vivo and stimulated WT and Ikzf1-cko Treg.
Figure 6 with 1 supplement
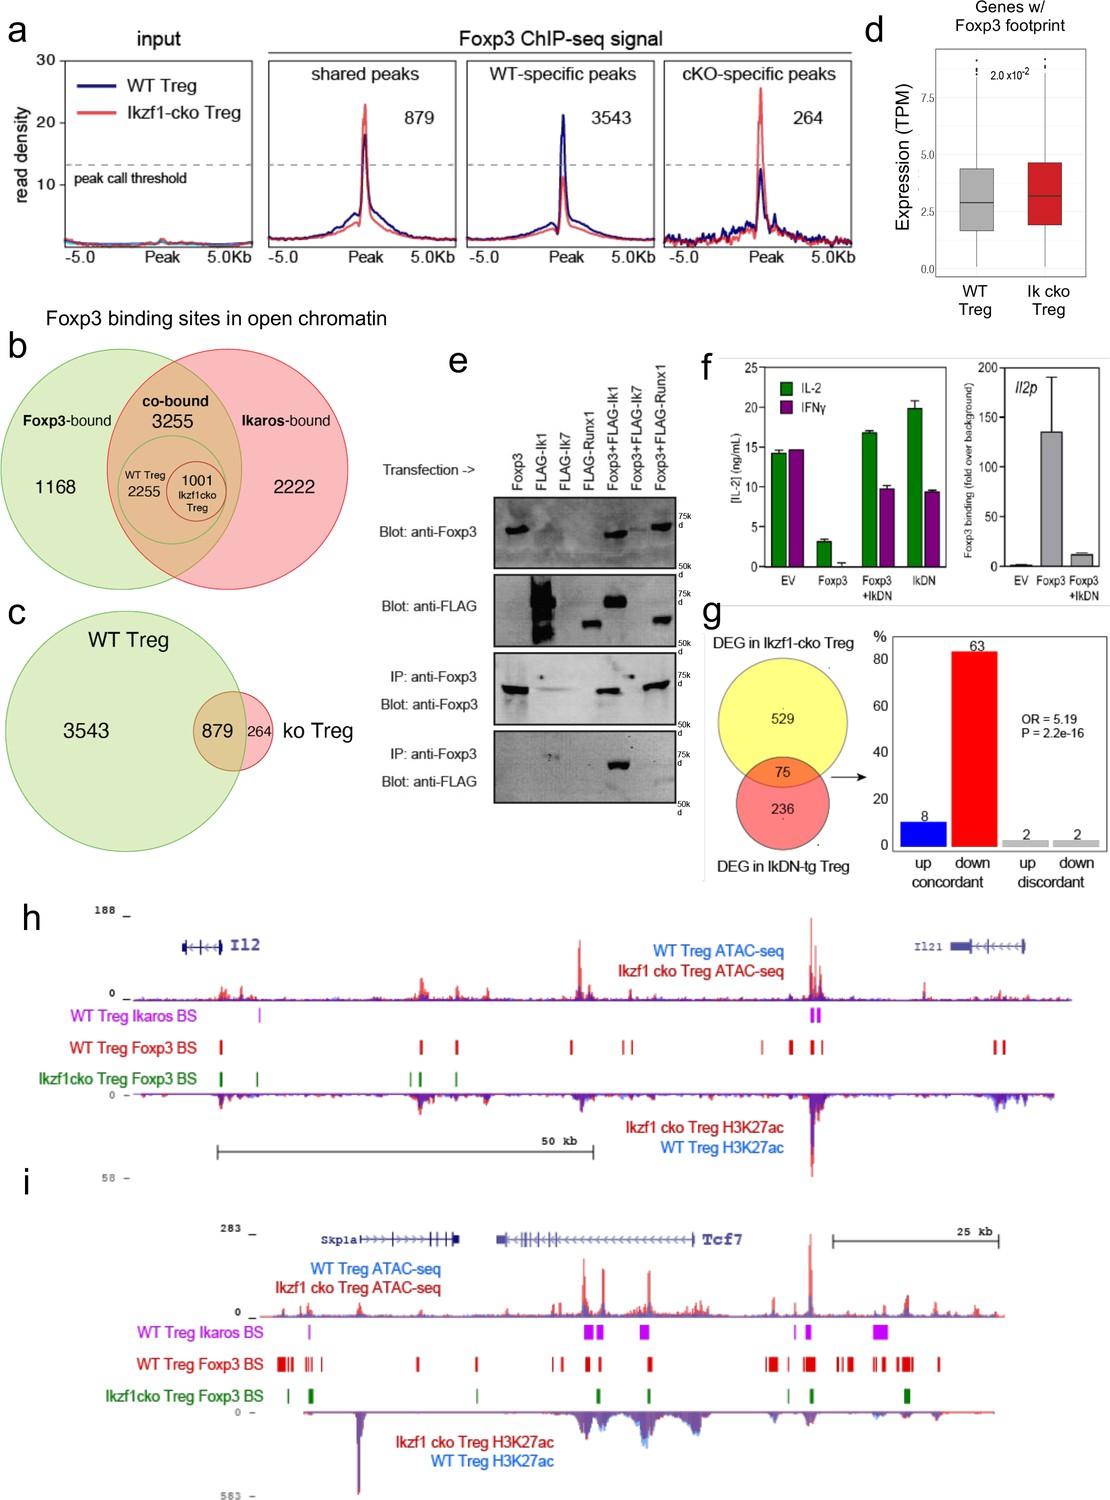
Ikaros-dependent Foxp3 function in regulatory T cells (Treg).
(a) Input vs. Foxp3 ChIP-seq at genomic regions shared or unique in wild-type (WT) (blue) vs. Ikzf1-cko (red) Treg (n=3 per group). (b) Foxp3- (green), Ikaros- (red), and Foxp3-Ikaros co-bound (orange) open chromatin regions (OCR). Inset depicts Foxp3-Ikaros co-bound regions in WT (green) vs. Ikzf1-cko (red) Treg. (c) Foxp3 binding sites in WT (green) vs. Ikzf1-cko (red) Treg. (d) Expression (tpm) of genes enriched for accessible Foxp3 consensus motifs in WT vs. Ikzf1-cko Treg. (e) 293T cells transfected with FLAG-tagged full-length Ikaros (Ik1), DNA-binding mutant Ikaros (Ik7), or Runx1 alone (lanes 1–4) or in combination with untagged Foxp3 (lanes 5–7). Whole extracts (panels 1–2) or Foxp3-immunoprecipitated extracts (panels 3–4) probed for Foxp3 or FLAG. (f) IL-2 or IFNg production (left panel) and Foxp3 ChIP-qPCR at Il2 promoter (right panel) in Tconv transduced with vector, Foxp3, Ik7/DN, or Foxp3 + Ik7/DN. (g) Concordant vs. discordant genes co-regulated in Ikzf1-cko vs. IkDN Treg (odds ratio = 5.19, P-value = 2.2 × 10⁻¹⁶). (h, i) Open chromatin (top) and H3K27ac (bottom) in WT (blue) and Ikzf1-cko (red) Treg, Ikaros binding (purple marks), and Foxp3 binding (red marks) in WT Treg, and Foxp3 binding in Ikzf1-cko Treg (green marks) at Il2 (h) and Tcf7 (i).
-
Figure 6—source data 1
Immunoblot analysis of Foxp3-Ikaros co-precipitation in transfected HEK293T cells.
- https://cdn.elifesciences.org/articles/91392/elife-91392-fig6-data1-v1.pdf
Figure 6—figure supplement 1

Foxp3 ChIP-seq library metrics.
Assessment of wild-type (WT) and Ikzf1-cko library reproducibility by principal component (a) and pairwise spearman correlation (b) analysis. (c) Strand cross-correlation analysis of FoxP3 ChIP-seq signal vs. noise corresponding to the broad peak (red) and phantom peak (blue; mappability bias). (d) Differential H3K27ac (z-score) at top Foxp3-bound differential expression gene (DEG) in ex vivo and stimulated WT and Ikzf1-cko Treg. (e) Ikaros-dependent changes in accessibility, enhancer signatures, and Foxp3 occupancy at the Il2ra, Rbpj, and Maml3 genes differentially expressed in Ikzf1-cko Treg. Open chromatin (top tracks) and H3K27ac (bottom tracks) in WT (blue) and Ikzf1-cko (red) Treg, Ikaros binding sites (purple marks) and Foxp3 binding sites (red marks) in WT Treg, and Foxp3 binding sites in Ikzf1-cko Treg (green marks).
Figure 7 with 1 supplement
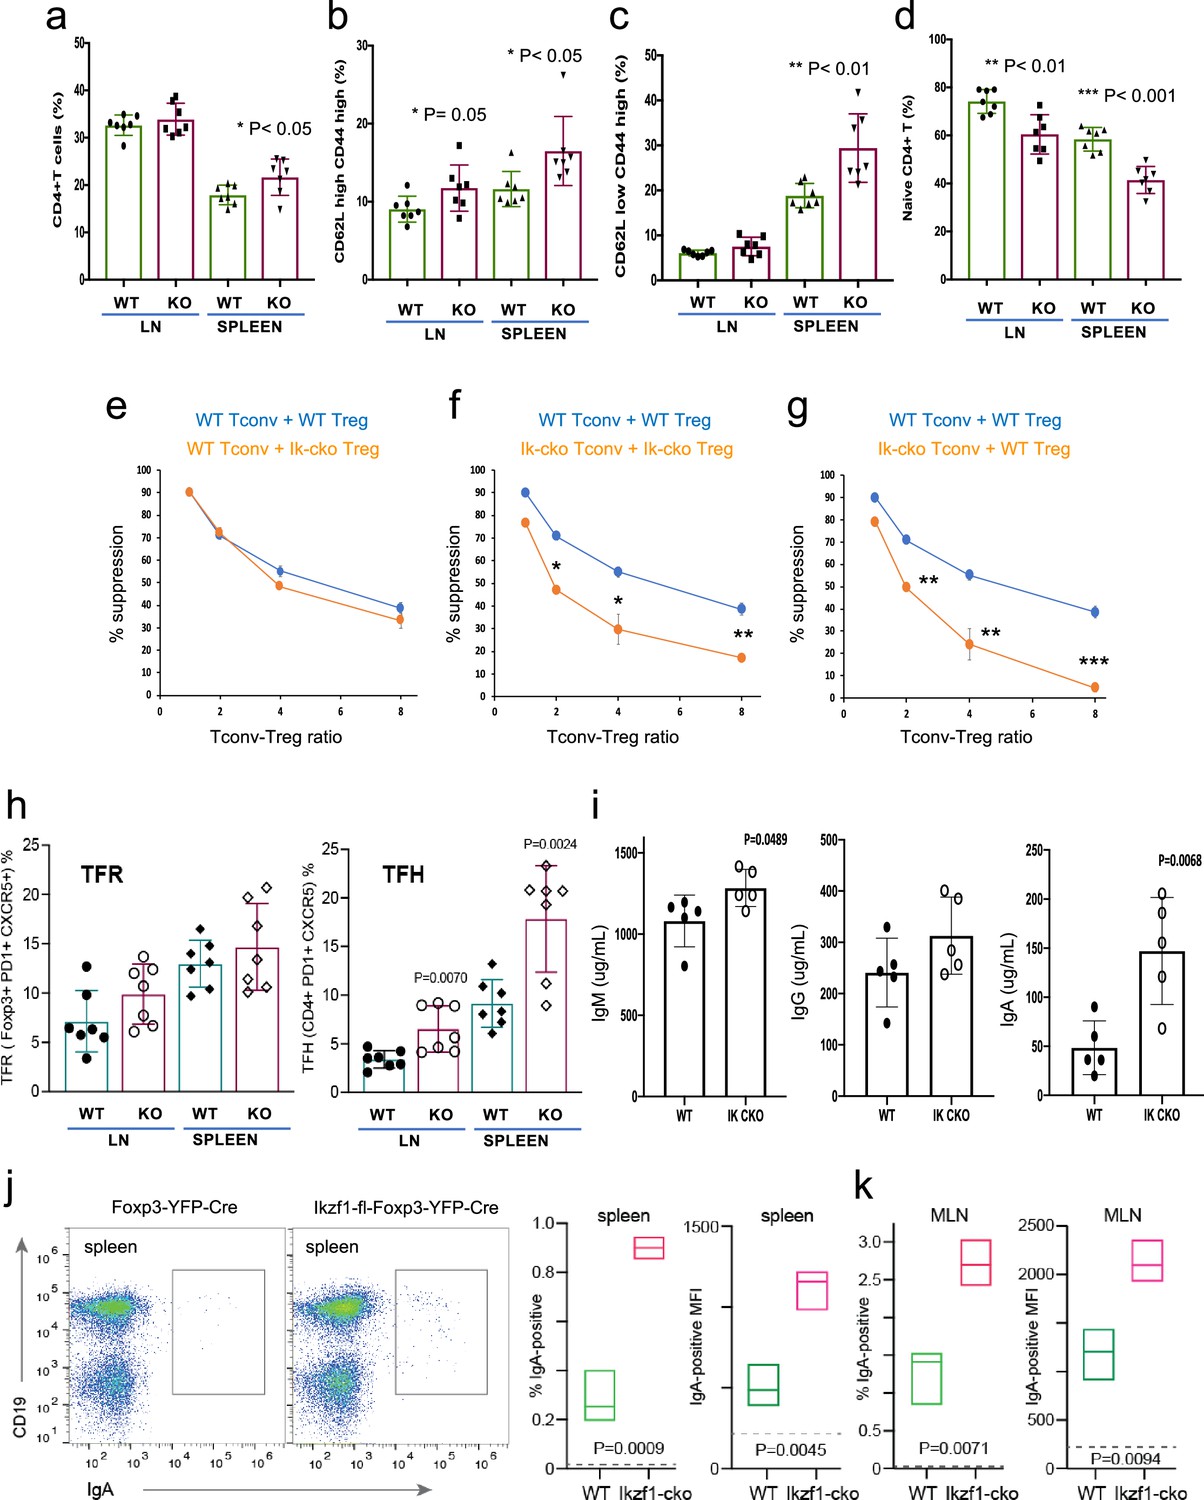
Immunophenotyping of Tconv from Ikzf1-fl-Foxp3-YFP-Cre and Foxp3-YFP-Cre mice.
Frequencies of total (a), memory (b, c), and naïve (d) phenotype Tconv in secondary lymphoid tissues of 6–8 week-old Ikzf1-fl-Foxp3-YFP-Cre (purple) and Foxp3-YFP-Cre (green) mice (n=7). (e) In vitro suppressive activity of wild-type (WT) (blue) vs. Ikzf1-deficient (orange) Treg against Tconv from WT mice. (f) In vitro suppressive activity of WT Treg against Tconv from WT mice (blue) vs. Ikzf1-deficient Treg against Tconv from Ikzf1-cko mice (orange). (g) In vitro suppressive activity of WT Treg against Tconv from WT (blue) vs. Ikzf1-deficient mice (orange). Tconv proliferation was measured by dye dilution in all cultures (n=3). (h) Frequencies of Foxp3+PD1hiCXCR5hi follicular regulatory T cells (Tfr) and PD1hiCXCR5hi follicular helper T cells (Tfh) in secondary lymphoid tissues of 6-month-old Ikzf1-fl-Foxp3-YFP-Cre (purple) and Foxp3-YFP-Cre (green) mice (n=7). (i) Total serum levels of IgM, IgG, and IgA from Ikzf1-fl-Foxp3-YFP-Cre vs. Foxp3-YFP-Cre mice (n=4). Frequency of IgA-positive B cells and surface density (MFI) of IgA-positive B cells in spleen (j) and mesenteric lymph nodes (k) from 9-month-old WT (green) vs. Ikzf1-deficient (red) mice (N=3). p-values are indicated for significant differences.
Figure 7—figure supplement 1

Histology of 1-year-old Ikzf1-fl-Foxp3-YFP-Cre and Foxp3-YFP-Cre control mice.
(a) Analysis of hematoxylin and eosin (H&E)-stained paraffin sections of liver, lung, kidney, and colon from 1-year-old Ikzf1-fl-Foxp3-YFP-Cre (n=3) or age-matched Foxp3-YFP-Cre control mice (n=3). Representative images at 100 X magnification are shown. Scale bar = 100 µm. All tissues showed normal appearance with no evidence of spontaneous autoimmunity. (b) Immunophenotyping of Tconv from Ikzf1-fl-Foxp3-YFP-Cre and Foxp3-YFP-Cre mice. Frequencies of total (left panel), CD62LhiCD44lo naive (middle panel), and CD62LloCD44hi memory (right panel) phenotype Tconv in secondary lymphoid tissues of 10-month-old Ikzf1-fl-Foxp3-YFP-Cre (purple) and Foxp3-YFP-Cre (green) mice (n=3).
Figure 8 with 1 supplement
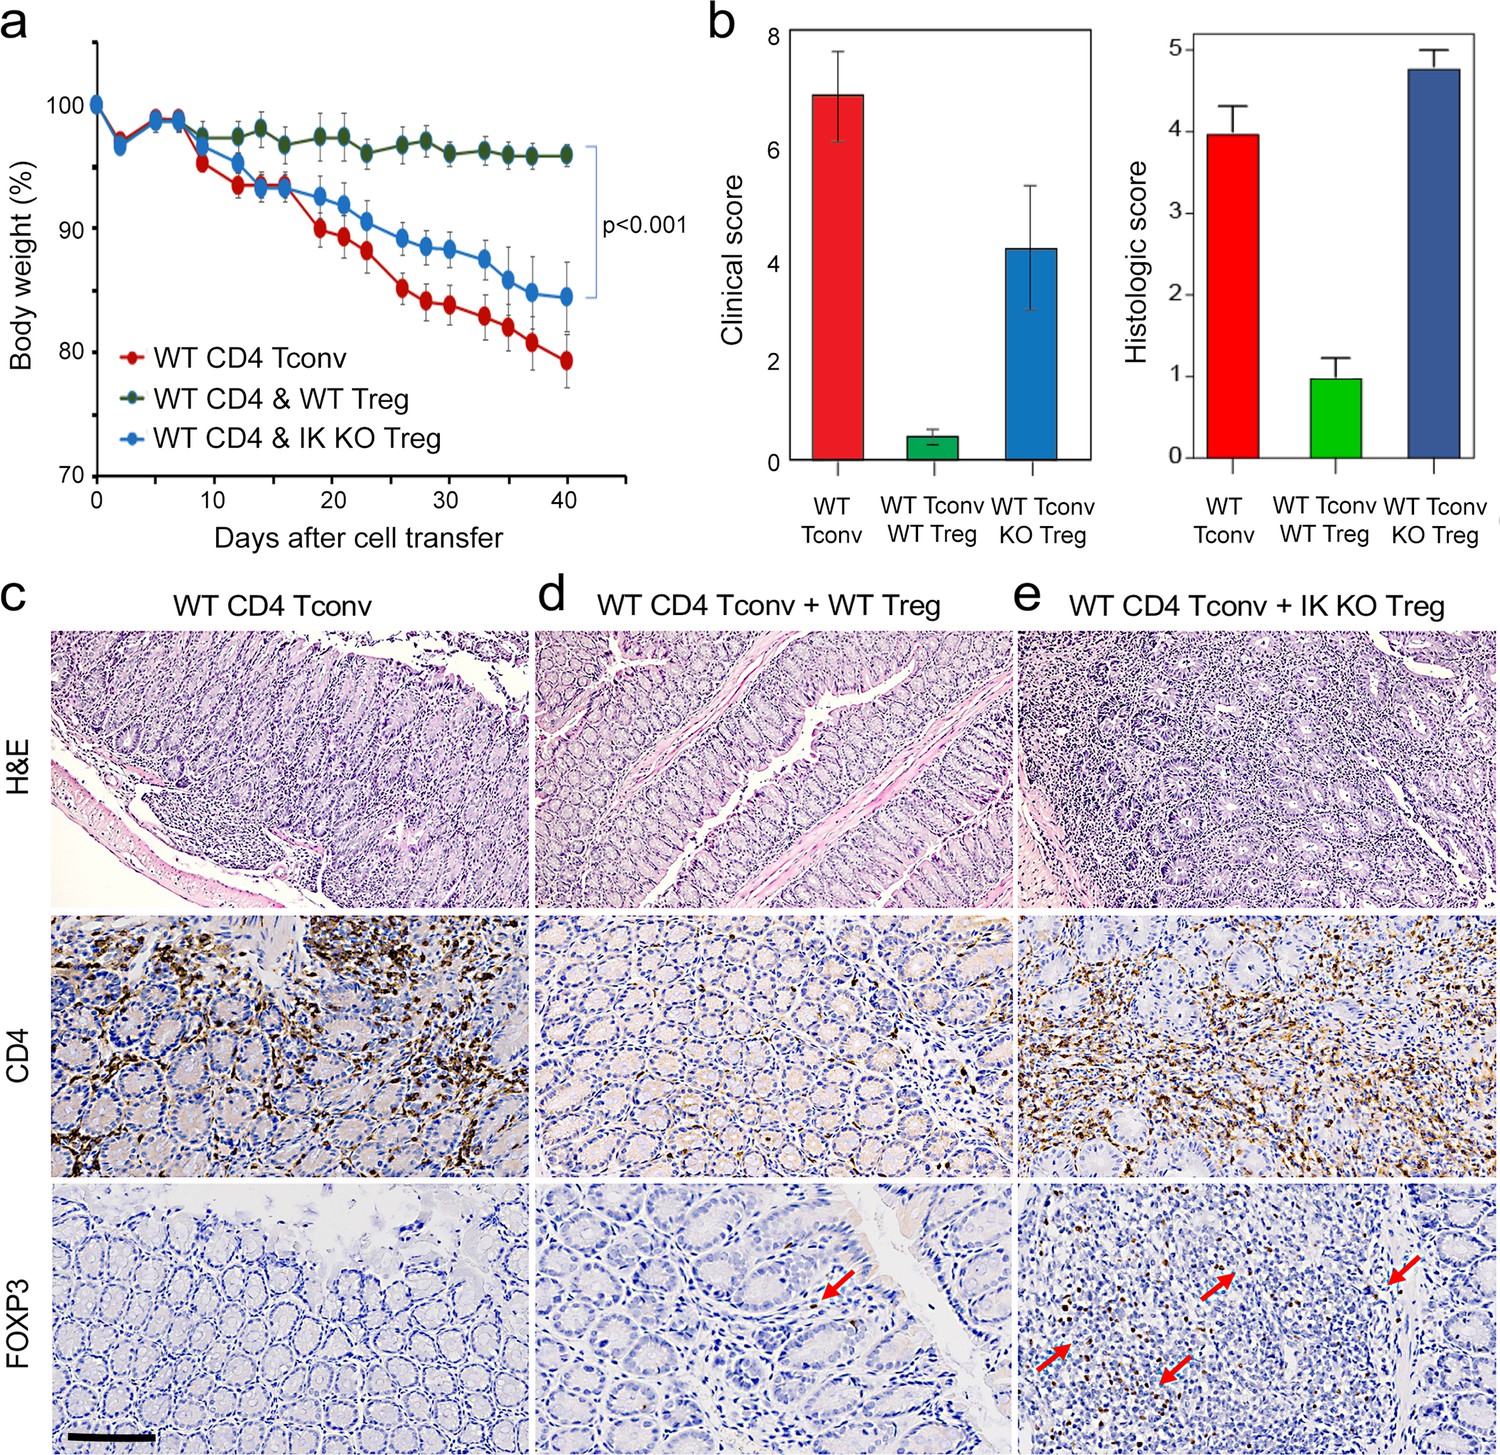
Role of Ikaros in regulatory T cells (Treg)-mediated control of inflammatory colitis.
Wild-type (WT) CD4 +CD25- Tconv were transferred alone (red), or together with WT (green) or Ikzf1-cko (blue) CD4 +CD25+Treg into RAG1ko mice (n=5). Animal weight was monitored for 40 days (a), and intestines were scored for pathology at the gross and histologic levels (b). Example histopathology of colons from RAG1ko recipients of WT Tconv (c), WT Tconv+WT Treg (d), and WT Tconv+Ikzf1 cko Treg (e). Hematoxylin and eosin (H&E) (top row), CD4 (middle row), and Foxp3 (bottom row) staining are shown at 200x. Scale bar = 100 µm. Mean Foxp3 + cells per 200 X field from n=3 animals is 3.4 in (d) and 22 in (e), p<0.05.
Figure 8—figure supplement 1
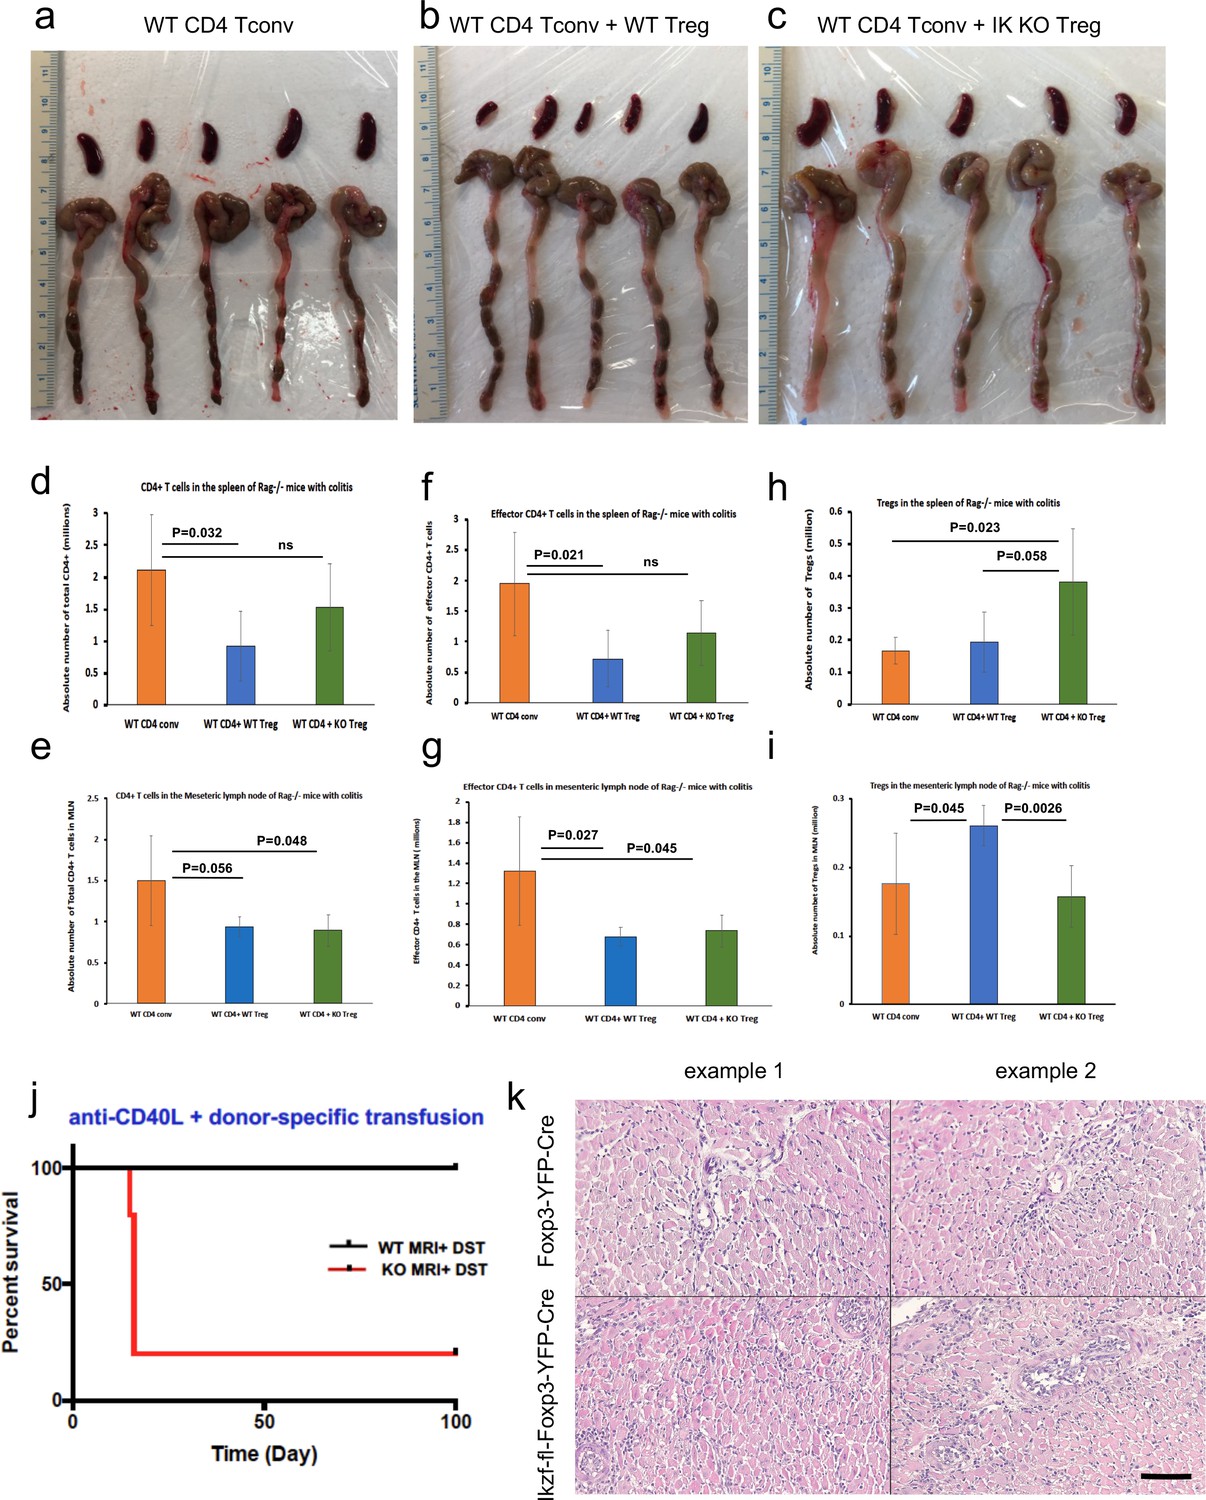
Role of Ikaros in regulatory T cells (Treg)-mediated protection from colitis.
Spleens and colons from Rag1ko recipients of wild-type (WT) Tconv (a), WT Tconv plus WT Treg (b) and WT Tconv plus Ikzf1-cko Treg (c) harvested at day 40 post-transfer. Quantitation of total CD4 + T cells (d, e), CD4+CD44+ effector Tconv (f, g), and CD4+Foxp3+ Treg (h, i) in the spleens (d, f, h) and mesenteric lymph nodes (e, g, i) from Rag1ko recipients of WT Tconv (orange), WT Tconv plus WT Treg (blue) and WT Tconv plus Ikzf1-cko Treg (green) harvested at day 40 post-transfer. Role of Ikaros in Treg-dependent acquired cardiac transplant tolerance. (j) B6 Ikzf1-fl-Foxp3-YFP-Cre (red) or Foxp3-YFP-Cre (black) mice received BALB/c cardiac allografts, donor-specific transfusion (DST), and anti-CD40L. Graft survival was monitored for 100 days. (k) Histopathological analysis of cardiac grafts harvested at day 14 post-transplant from Foxp3-YFP-Cre and Ikzf1-fl-Foxp3-YFP-Cre recipients (n=3, scale = 200 x, scale bar = 100 µm).
Figure 9
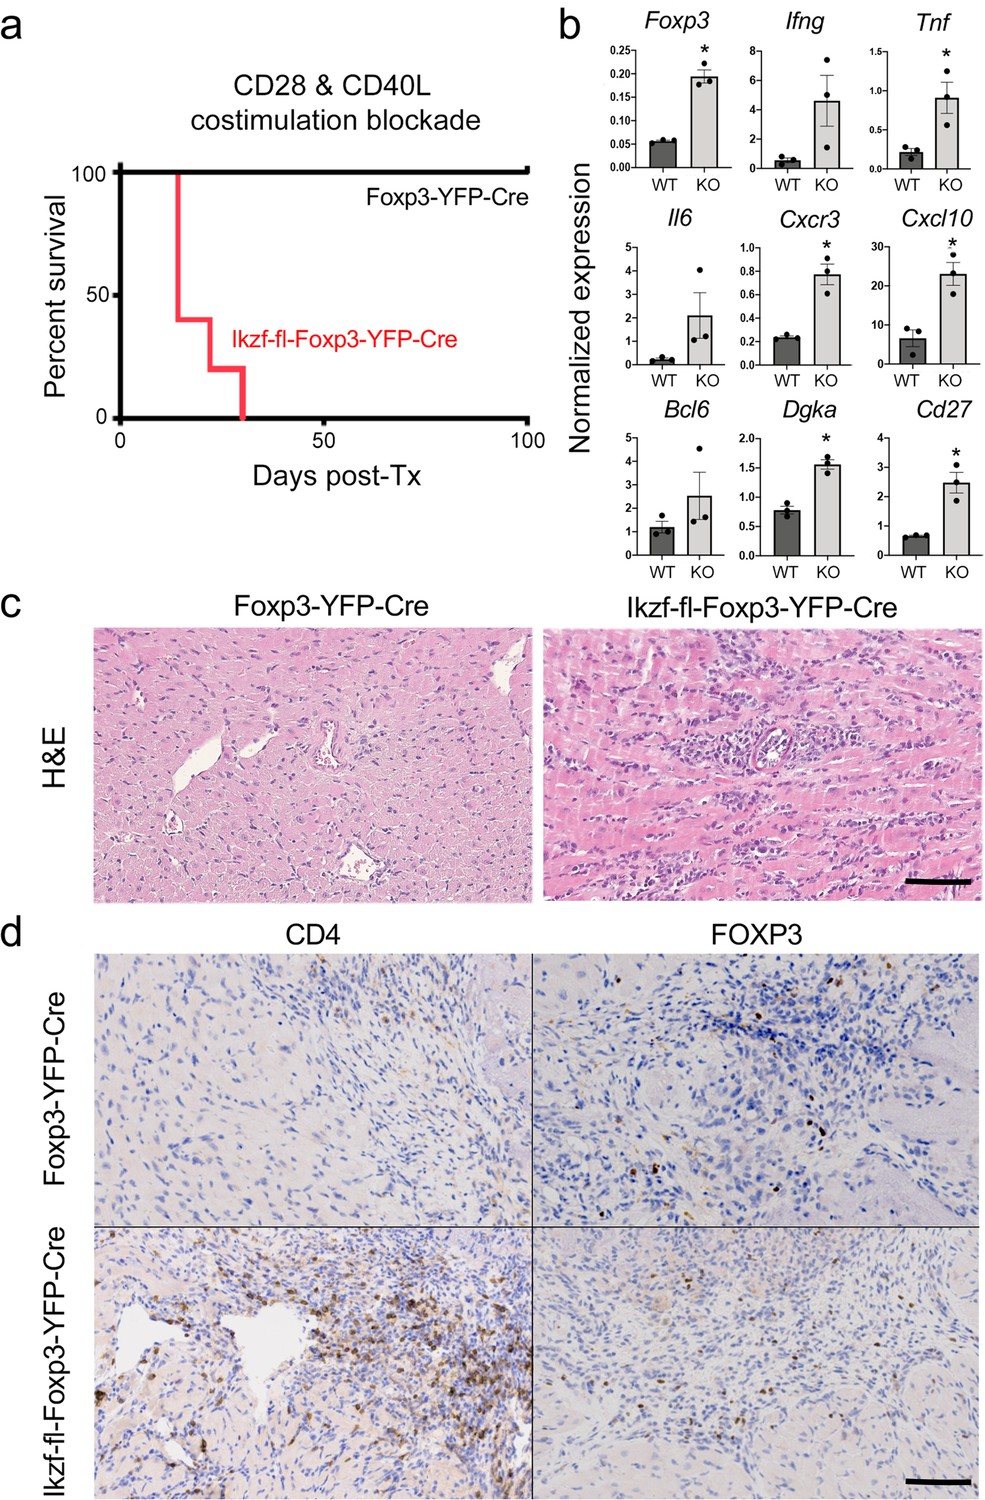
Role of Ikaros in regulatory T cells (Treg)-dependent acquired cardiac transplant tolerance.
(a) B6 Ikzf1-fl-Foxp3-YFP-Cre (red) or Foxp3-YFP-Cre (black) mice (n=5) received BALB/c cardiac allografts under combined CD28 +CD40 costimulatory blockade and graft survival was monitored for 100 days. (b) Analysis of intra-graft transcript levels of the indicated genes from grafts harvested at day 19 post-transplant (*p<0.01). Histopathological analysis of cardiac grafts harvested at day 19 post-transplant from Foxp3-YFP-Cre and Ikzf1-fl-Foxp3-YFP-Cre recipients by hematoxylin and eosin (H&E) (c) and CD4 and Foxp3 (d) staining (scale = 200 x, scale bar = 100 µm).
Figure 10
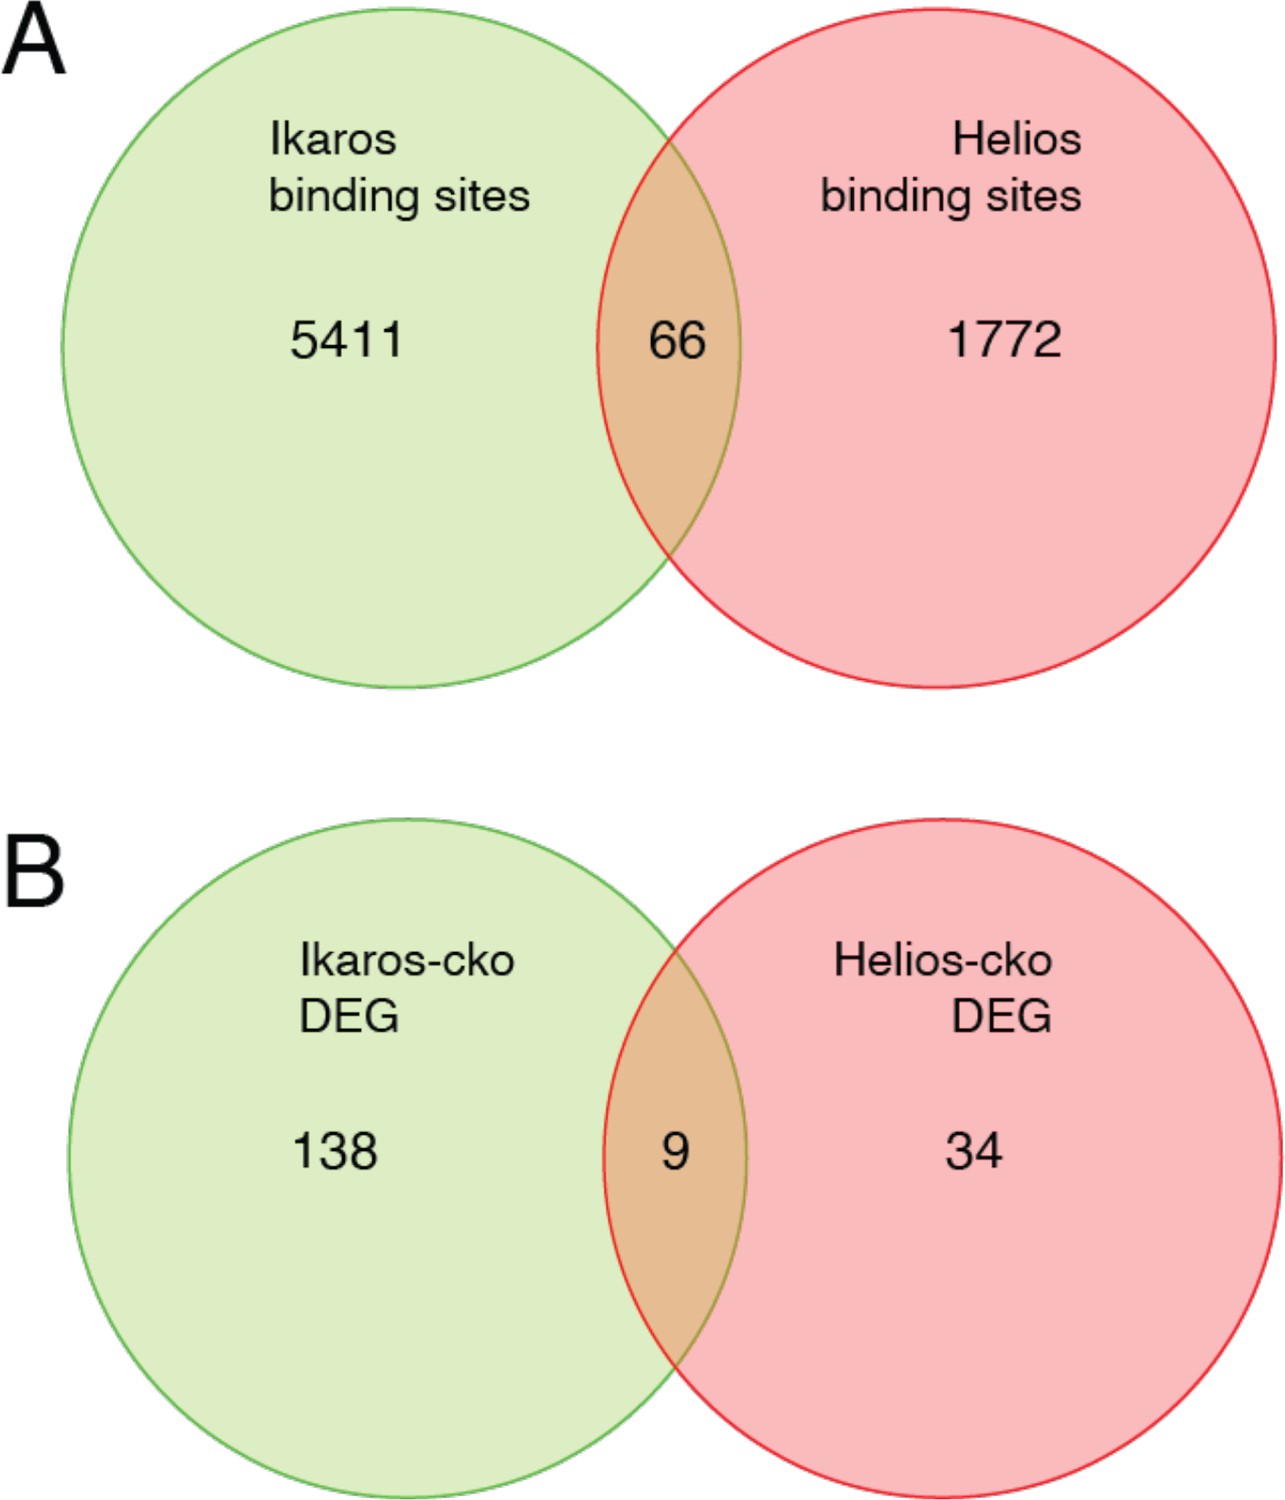
Comparison of Ikaros vs. Helios binding sites and regulated genes.
Venn diagram in (A) depicts the comparison of published ChIP-seq Helios binding sites (Kim et al., 2015) (one replicate) with at least one bp of overlap with Ikaros binding sites from this study. Venn diagram in (B) depicts the overlap of differentially expressed genes (FDR <0.5 & abs(log2FC)>1) in Ikaros or Helios conditional knockout (Yates et al., 2018).
Additional files
-
Supplementary file 1
Genes differentially expressed (DEG) between Ikzf1-cko and wild-type regulatory T cells (Treg) in stimulated and unstimulated conditions measured by RNA-seq.
Genes are annotated to Ensembl mm9/NCBIM37 release 67.
- https://cdn.elifesciences.org/articles/91392/elife-91392-supp1-v1.xlsx
-
Supplementary file 2
Differential expression gene (DEG) with known roles in regulatory T cells (Treg) function.
- https://cdn.elifesciences.org/articles/91392/elife-91392-supp2-v1.xlsx
-
Supplementary file 3
Gene set enrichment using MSigDB GO biological processes and MsigDB immune annotations for the upregulated and downregulated sets of genes.
Enrichment was determined using one-sided hypergeometric tests with FDR adjustment.
- https://cdn.elifesciences.org/articles/91392/elife-91392-supp3-v1.xlsx
-
Supplementary file 4
Coordinates and statistics genomic regions with differential accessibility (DAR) in Ikzf1-cko vs. wild-type regulatory T cells (Treg) measured by ATAC-seq.
Differentially accessible regions (DAR) were annotated to the nearest gene TSS.
- https://cdn.elifesciences.org/articles/91392/elife-91392-supp4-v1.xlsx
-
Supplementary file 5
Enrichment statistics for genomic regions with differential H3K27 acetylation in Ikzf1-cko vs. wild-type regulatory T cells (Treg) measured by ChIP-seq.
- https://cdn.elifesciences.org/articles/91392/elife-91392-supp5-v1.xlsx
-
Supplementary file 6
Coordinates of super-enhancer regions identified using the ROSE algorithm in Ikzf1-cko vs. wild-type regulatory T cells (Treg) as measured by H3K27ac ChIP-seq density.
Super-enhancers were annotated to the nearest gene TSS.
- https://cdn.elifesciences.org/articles/91392/elife-91392-supp6-v1.xlsx
-
Supplementary file 7
Annotation of Ikaros ChIP-seq peaks.
Peak calls of Ikaros ChIP peaks, whether the peak was found in Tconv vs. Tregs specifically or common to both. Nearest gene, distance to nearest gene. In_ocr indicates whether the Ikzf1 peak overlaps with an open chromatin region (OCR).
- https://cdn.elifesciences.org/articles/91392/elife-91392-supp7-v1.xls
-
Supplementary file 8
TF motif enrichment analysis at differentially accessible region (DAR).
Enriched TF name, family, and the associated expression value (log2TPM) in the indicated condition are shown. The PWMEnrich p-values were adjusted using FDR.
- https://cdn.elifesciences.org/articles/91392/elife-91392-supp8-v1.xlsx
-
Supplementary file 9
Foxp3 binding sites called in Ikzf1-cko vs. wild-type regulatory T cells (Treg) as measured by ChIP-seq.
The coordinates (mm9) for each peak are indicated as well as the nearest gene and associated distance. In_ocr indicates whether the Foxp3 peak overlaps with an open chromatin region (OCR).
- https://cdn.elifesciences.org/articles/91392/elife-91392-supp9-v1.xlsx
-
MDAR checklist
- https://cdn.elifesciences.org/articles/91392/elife-91392-mdarchecklist1-v1.pdf
Download links
A two-part list of links to download the article, or parts of the article, in various formats.
Downloads (link to download the article as PDF)
Open citations (links to open the citations from this article in various online reference manager services)
Cite this article (links to download the citations from this article in formats compatible with various reference manager tools)
Foxp3 depends on Ikaros for control of regulatory T cell gene expression and function
eLife 12:RP91392.
https://doi.org/10.7554/eLife.91392.3


