Metabolomics identifies and validates serum androstenedione as novel biomarker for diagnosing primary angle closure glaucoma and predicting the visual field progression
- Department of Clinical Laboratory, Eye & ENT Hospital, Shanghai Medical College, Fudan University, China
- Department of Ophthalmology & Visual Science, Eye & ENT Hospital, Shanghai Medical College, Fudan University, China
- State Key Laboratory of Medical Neurobiology, Institutes of Brain Science, Fudan University, China
- Key Laboratory of Myopia, Chinese Academy of Medical Sciences, China
- NHC Key Laboratory of Myopia, Fudan University, China
- Department of Clinical Laboratory, Shanghai Xuhui Central Hospital, Fudan University, China
- Department of Ophthalmology, Shanghai General Hospital, Shanghai Jiao Tong University School of Medicine, China
- National Clinical Research Center for Eye Diseases, Shanghai Key Laboratory of Ocular Fundus Diseases, Shanghai Engineering Center for Visual Science and Photomedicine, China
Figures
Figure 1 with 2 supplements

Study design and workflow.
A five-phase study (discovery phase [discovery set 1, the discovery set 2], validation phase 1, validation phase 2, supplemental phase, and cohort phase) design. (A) The workflow of the discovery phase, validation phase 1, supplemental phase, and cohort phase were analyzed by liquid chromatography-mass spectrometry (LC-MS) for untargeted metabolomics. (B) The workflow of validation phase 2 was analyzed by chemiluminescence immunoassay for targeted detection. (C) A total of 440 patients and controls were recruited and assigned to discovery set 1 (n=140), discovery set 2 (n=180), and validation set 1 (n=120). The biomarker signature was identified on the metabolomic data from the discovery phase, comparing primary angle closure glaucoma (PACG) with control patients. These data were used as a discovery set for the algorithm. (D) Validation phase 2 (n=176) was included as the second validation cohort. (E) Three measurements were performed in the supplemental phase. (F) Cohort phase was performed to validate the predictive value of biomarker (n=97).
Figure 1—figure supplement 1
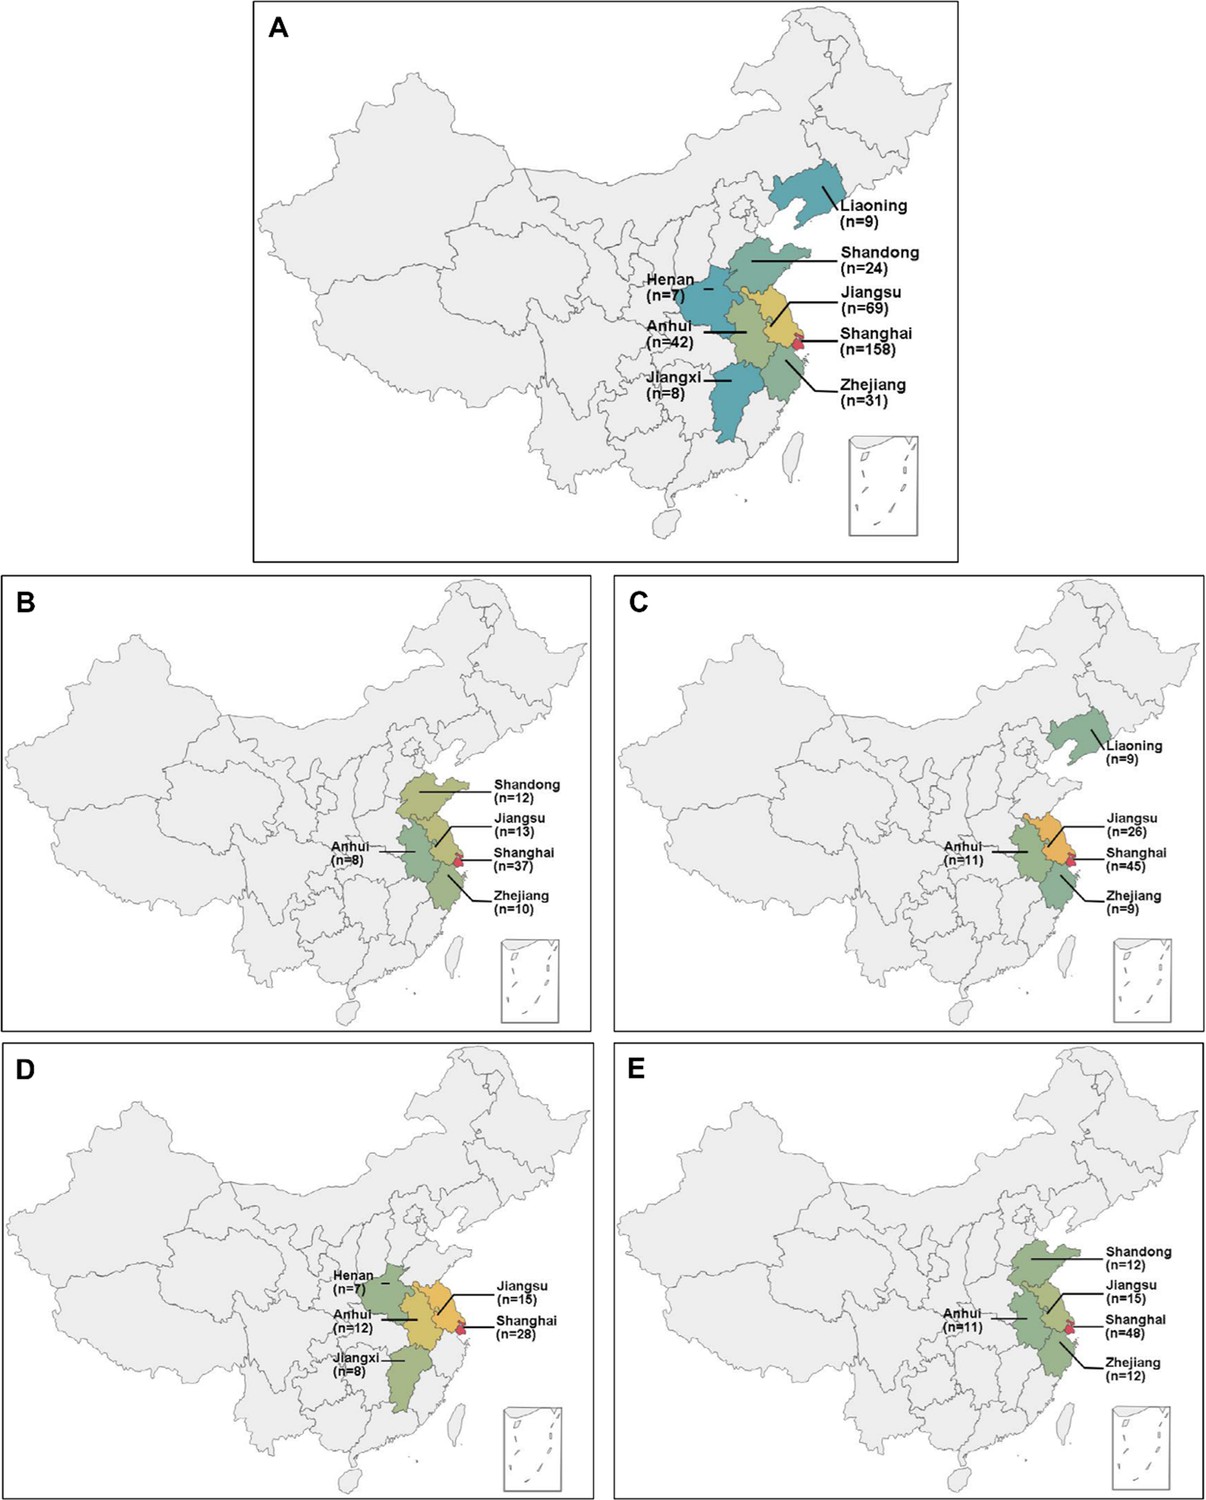
Locations of the eight districts in China.
(A) All the primary angle closure glaucoma (PACG) patients; (B) discovery set 1; (C) discovery set 2; (D) validation phase 1; (E) validation phase 2.
Figure 1—figure supplement 2

The workflow of mass spectrometry.
Figure 2
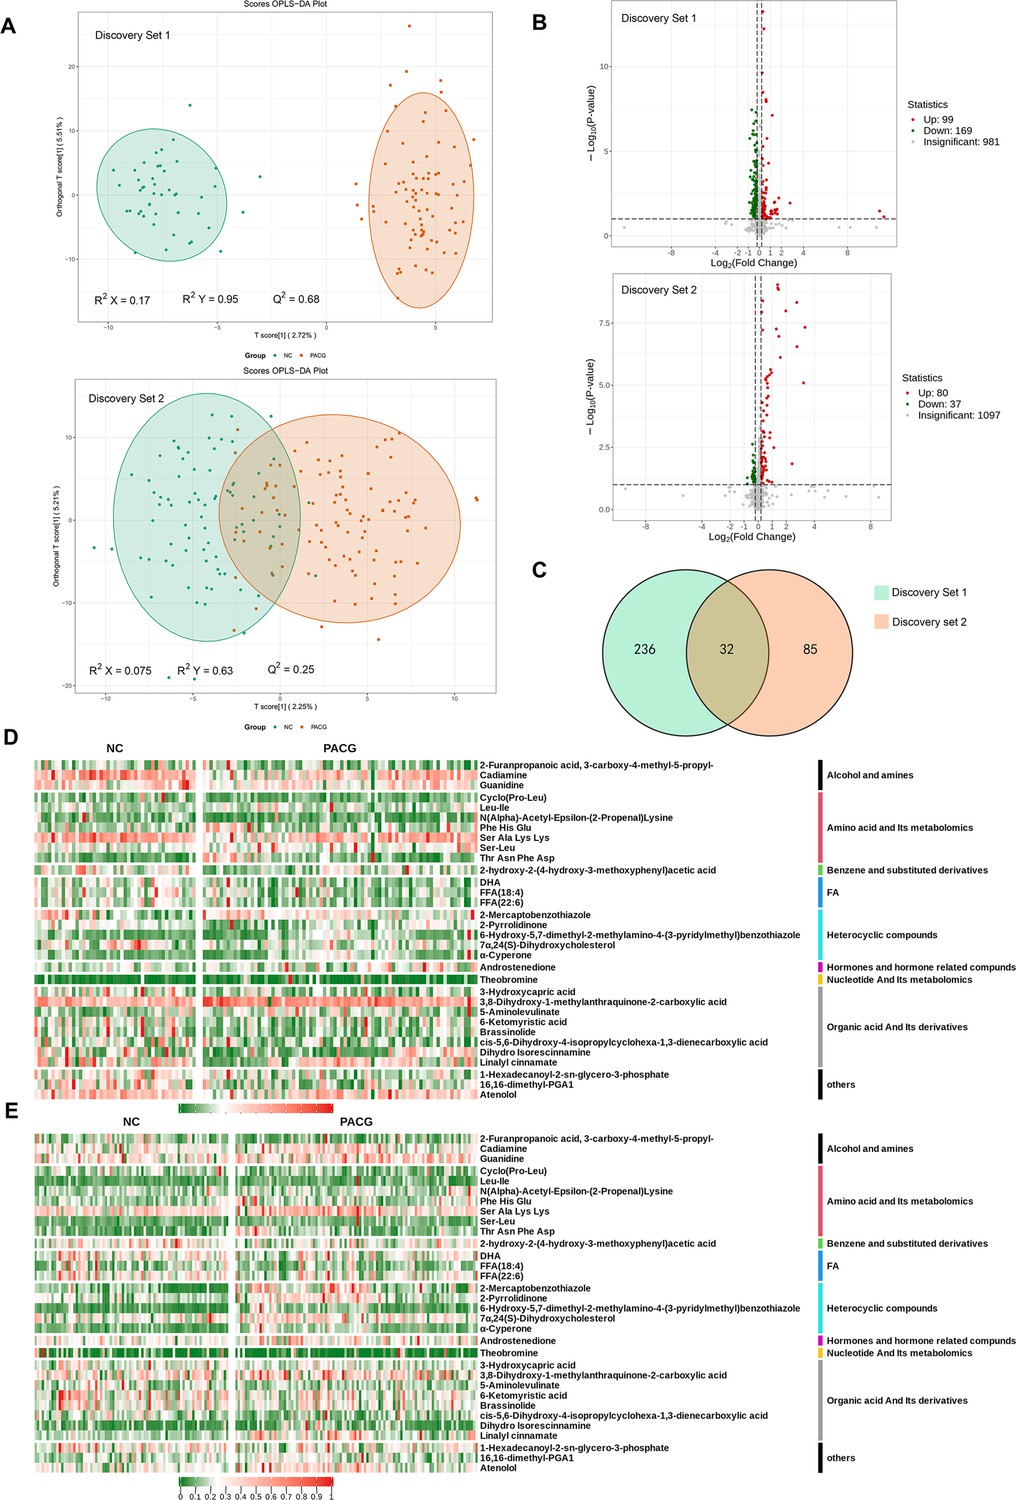
Metabolic profiles discriminate participants with primary angle closure glaucoma (PACG) from normal controls (NC).
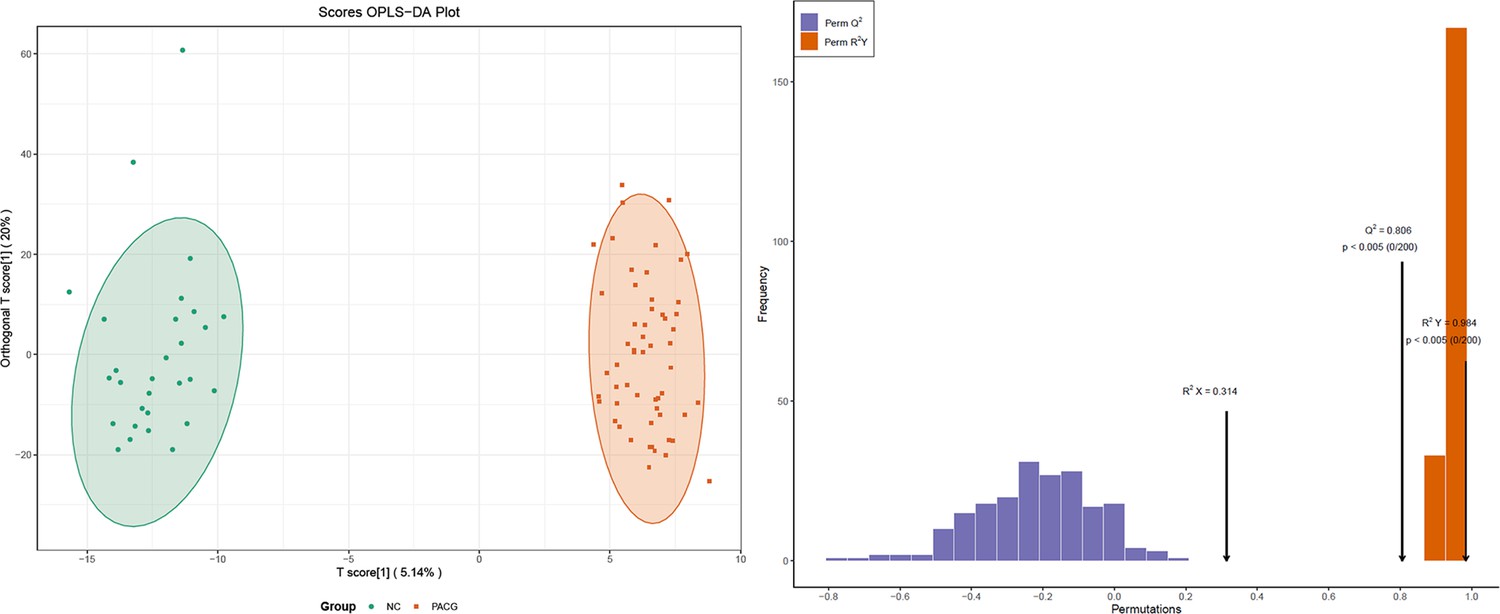
(A) Orthogonal projection to latent structure-discriminant analysis (OPLS-DA) score plot of the comparison between the PACG and NC groups in the discovery phase (discovery set 1 and discovery set 2). Samples in the encircled areas are within the 95% confidence interval. (B) Volcano plot of differential metabolites. Metabolites with a fold change of <0.85 and a false discovery rate (FDR) of <0.1 were considered significantly down-regulated. Metabolites with a fold change of >1.15 and an FDR of <0.1 were considered significantly up-regulated. Changes in other metabolites were not significant (insignificant). (C) Venn diagram displaying the 32 differential metabolites that were altered as biomarker candidates from the two comparisons in the discovery phase. (D) Heatmap of differential metabolites in the discovery set 1 (data were normalized to min-max). (E) Heatmap of differential metabolites in the discovery set 2 (data were normalized to min-max). FA: fatty acid.
Figure 3 with 2 supplements
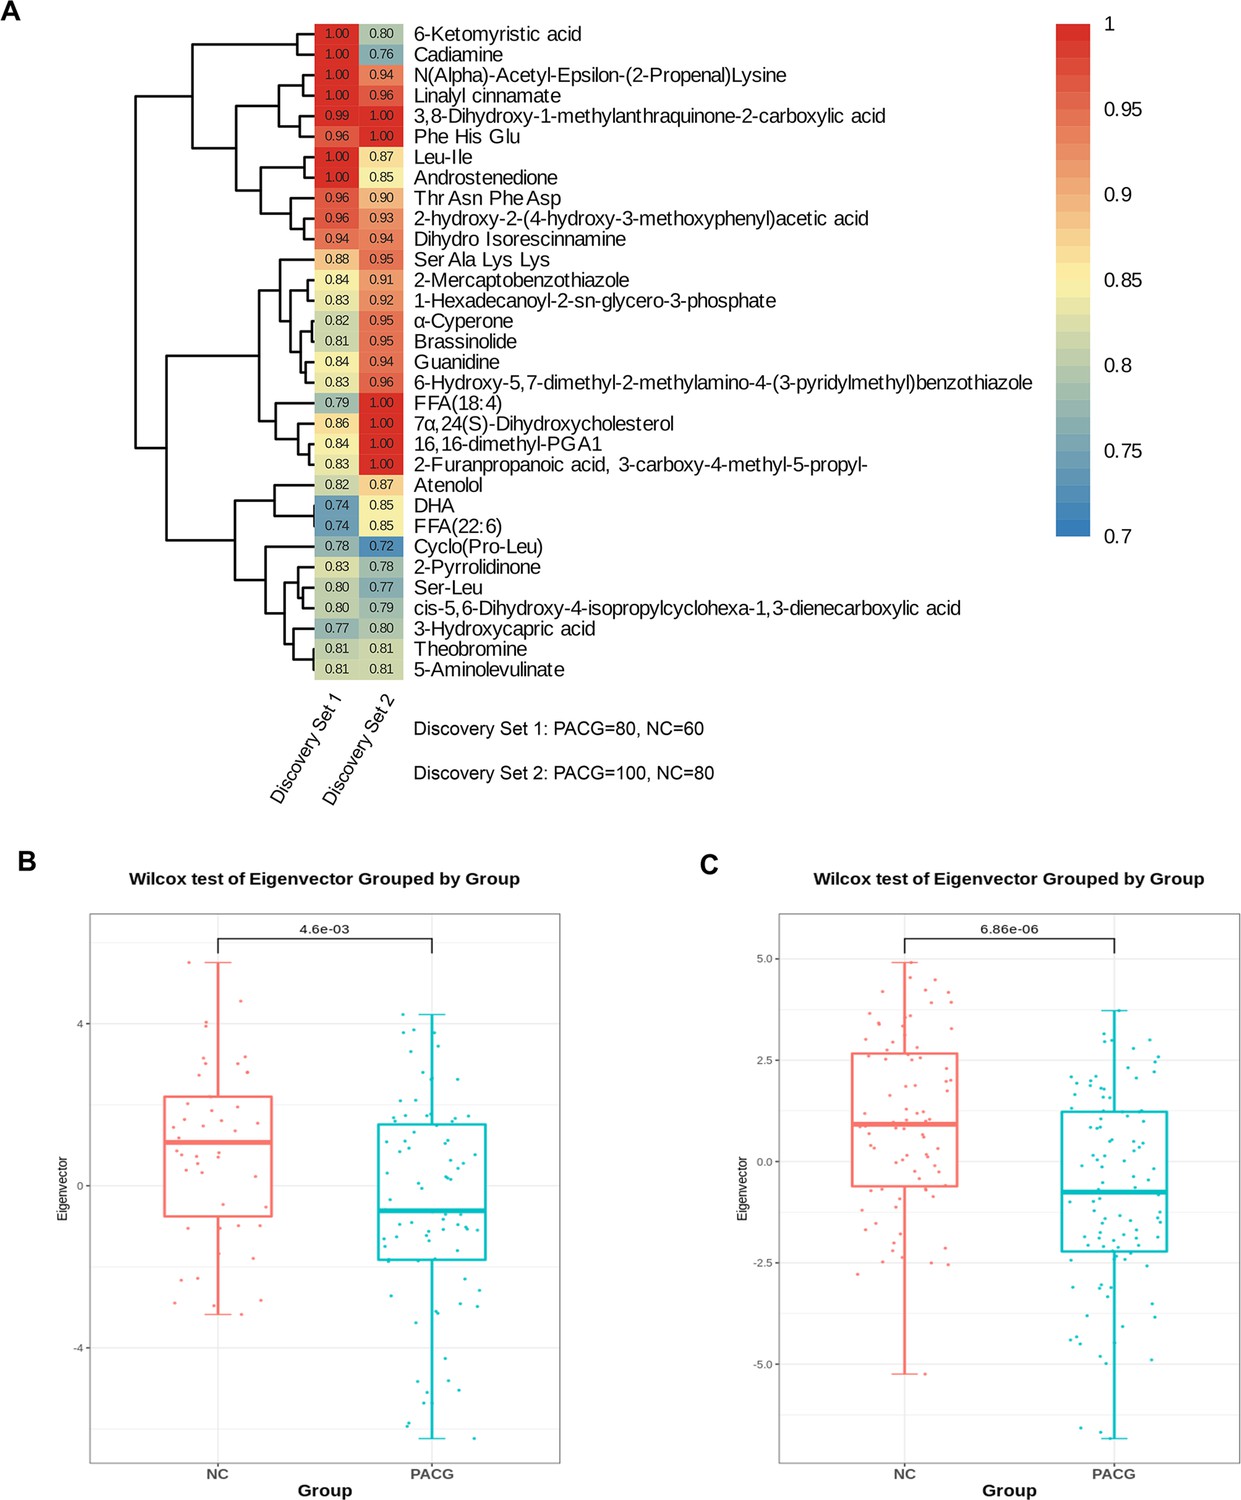
Identification of a unique primary angle closure glaucoma (PACG)-associated blood metabolite fingerprint and its behavior in the discovery phase.
(A) Heatmap of the area under the receiver operating characteristic curve assessing the discriminating accuracy of each of the 32 metabolites in differentiating PACG from normal control in the discovery set 1 and discovery set 2. (B) The eigenmetabolite of the 32-metabolite cluster between PACG and control patients in the discovery set 1. (C) The eigenmetabolite of the 32-metabolite cluster between PACG and control patients in the discovery set 2. Wilcox test was used.
Figure 3—figure supplement 1
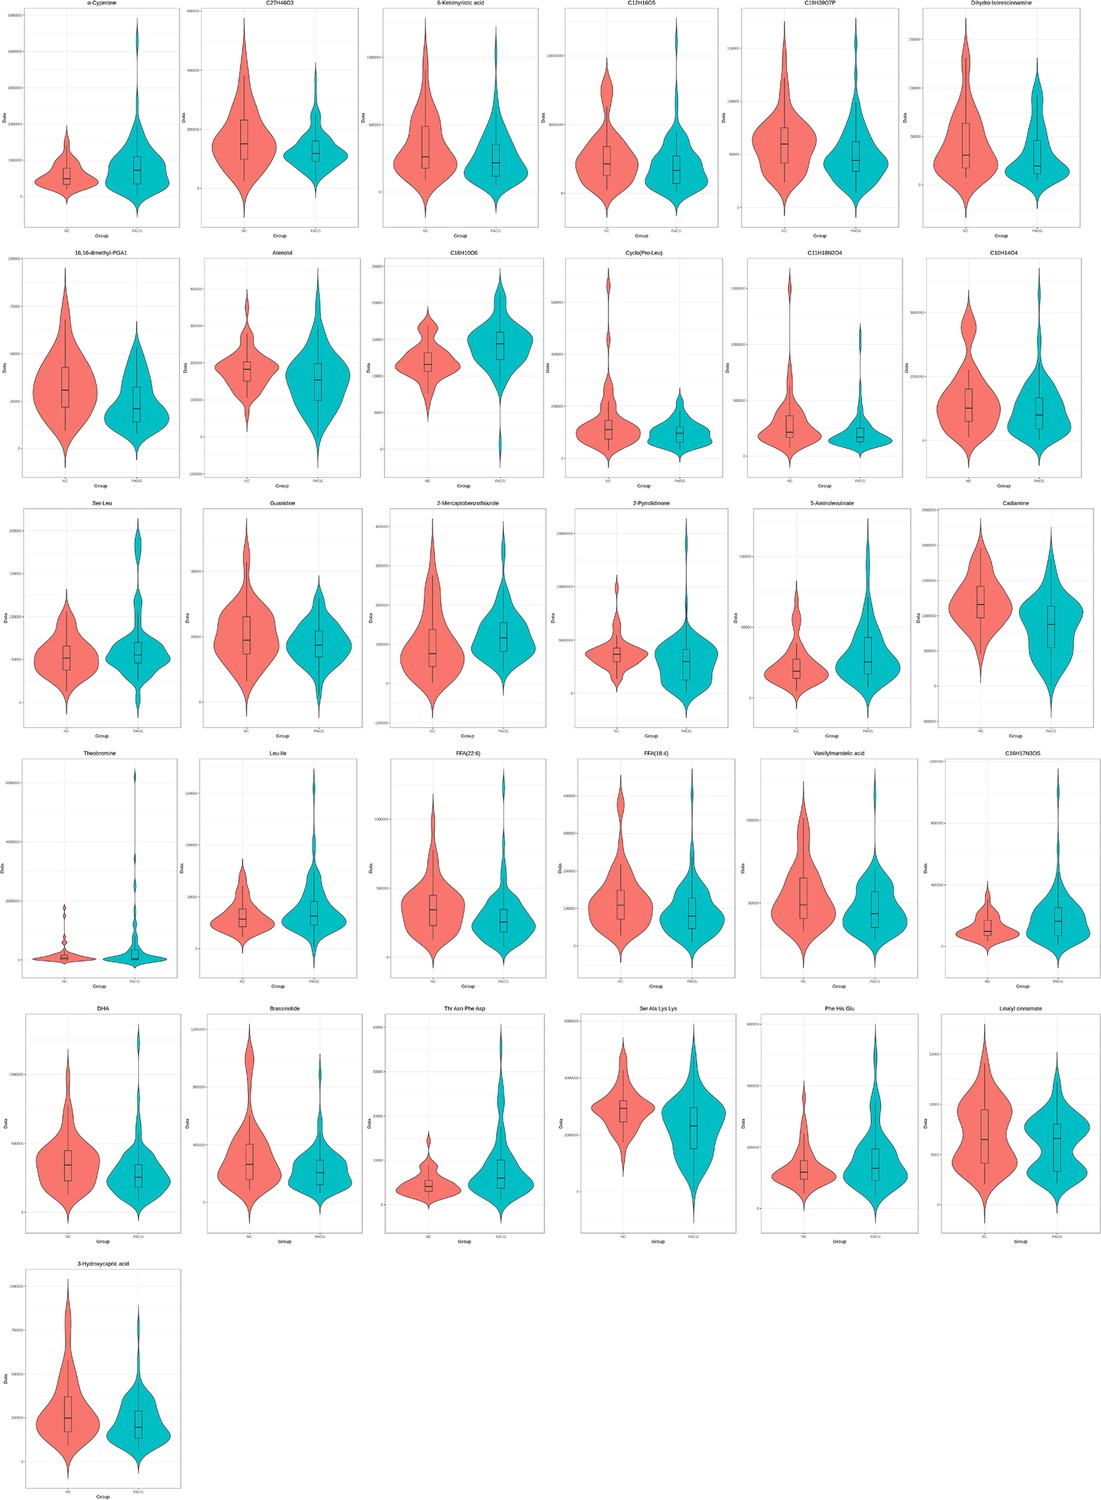
The level of the 31-metabolite cluster between primary angle closure glaucoma (PACG) and control patients in discovery set 1 (unit for y-axis is peak areas).
Figure 3—figure supplement 2
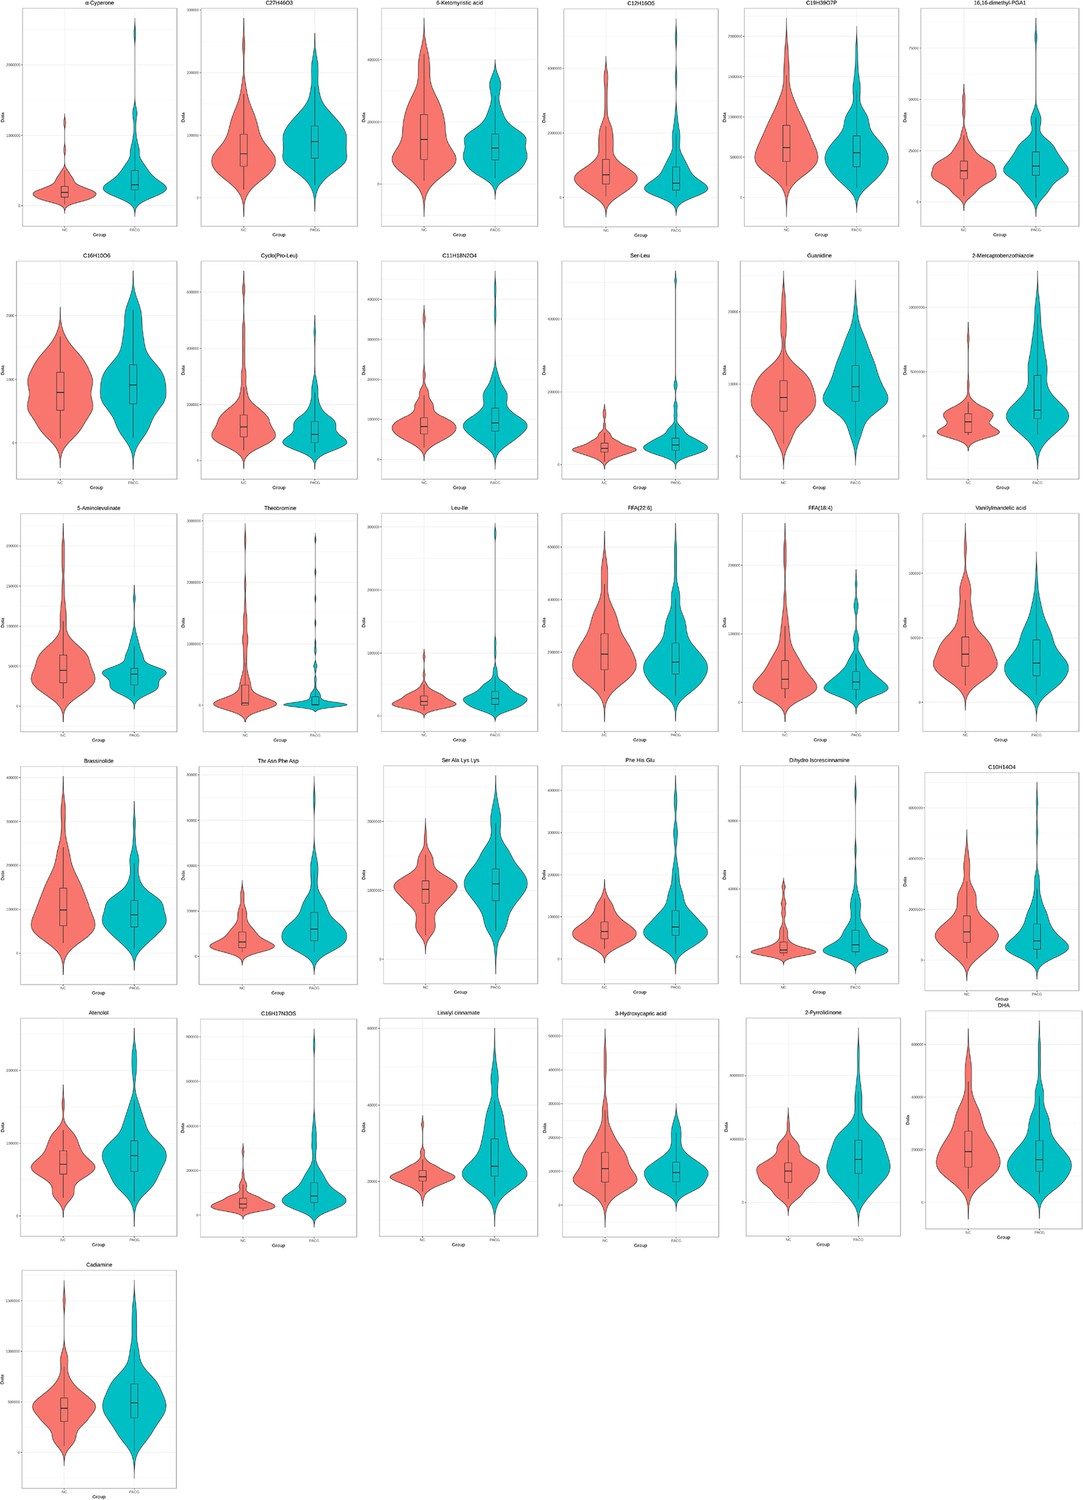
The level of the 31-metabolite cluster between primary angle closure glaucoma (PACG) and control patients in discovery set 2 (unit for y-axis is peak areas).
Figure 4 with 2 supplements

Biomarker discovery discriminates primary angle closure glaucoma (PACG) from normal in the discovery phase.
(A) A heatmap of correlation analysis between ocular clinical characteristics and 32 potential biomarkers in the discovery phase in PACG subjects. (B) The serum level of androstenedione between PACG (42,852±20,767) and normal (33,987±11,113) group in the discovery set 1 (unit for y-axis is peak areas). (C) The serum level of androstenedione between PACG and normal group in the discovery set 2 (unit for y-axis is peak areas). (D) Receiver operating characteristic curves of androstenedione to discriminate PACG from normal in the discovery set 1. (E) Receiver operating characteristic curves of androstenedione to discriminate PACG from normal in the discovery set 2. Independent Student’s t-test was used.
Figure 4—figure supplement 1
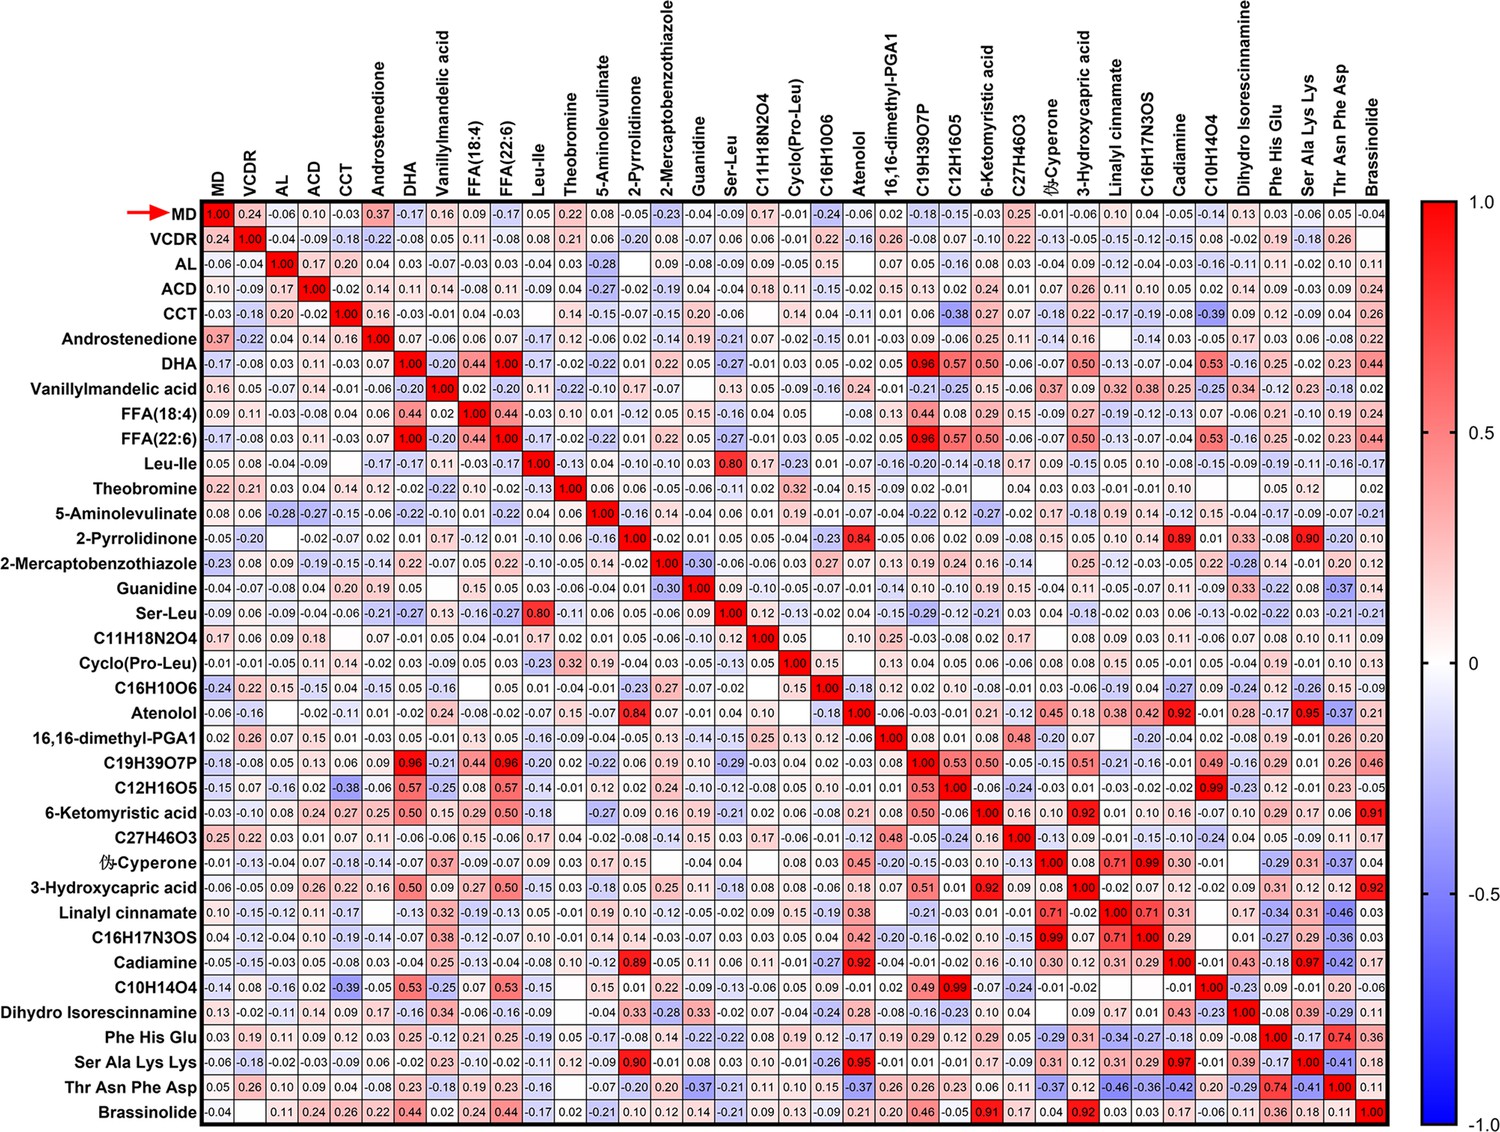
Heatmap of correlation analysis between ocular clinical characteristics and 32 potential biomarkers in discovery set 1 of primary angle closure glaucoma (PACG) subjects.
Figure 4—figure supplement 2
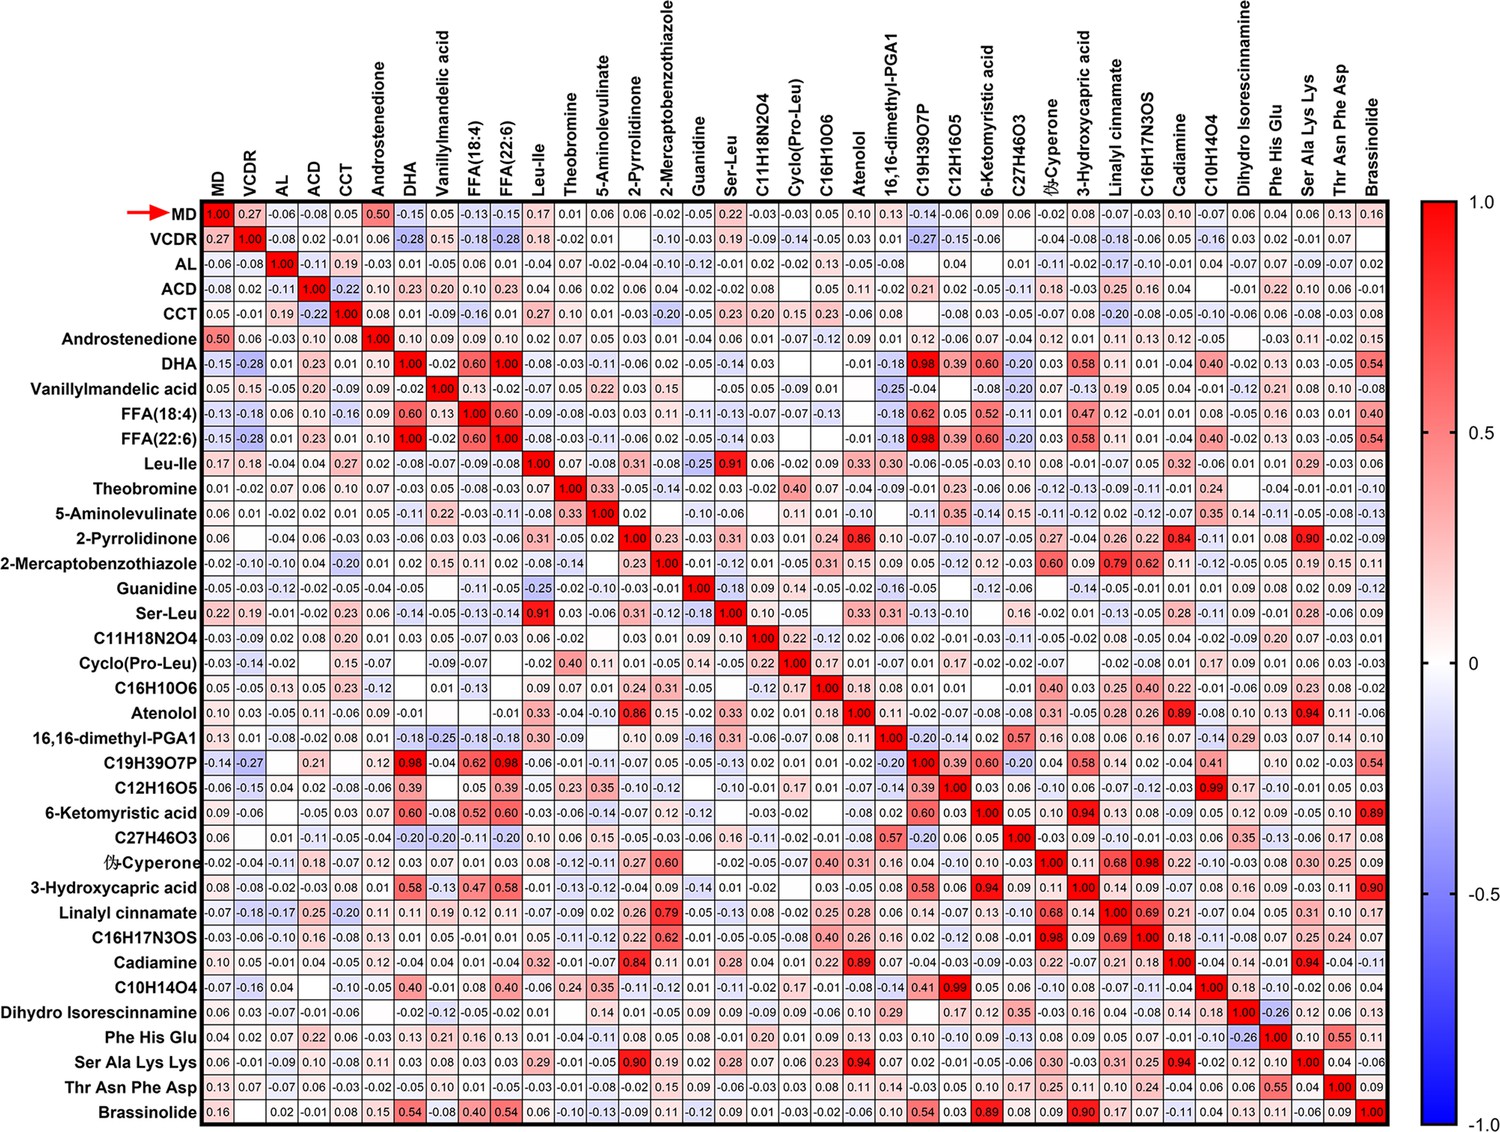
Heatmap of correlation analysis between ocular clinical characteristics and 32 potential biomarkers in discovery set 2 of primary angle closure glaucoma (PACG) subjects.
Figure 5 with 2 supplements

Biomarker validation in two independent validation phases to discriminate primary angle closure glaucoma (PACG) from normal.
(A) The serum level of androstenedione between PACG and normal group in validation phase 1 (unit for y-axis is peak areas). (B) The serum level of androstenedione between PACG and normal group in validation phase 2 (unit for y-axis is peak areas). (C) Receiver operating characteristic curves of androstenedione to discriminate PACG from normal in validation phase 1. (D) Receiver operating characteristic curves of androstenedione to discriminate PACG from normal in validation phase 2. Independent Student’s t-test was used.
Figure 5—figure supplement 1
Orthogonal projection to latent structure-discriminant analysis (OPLS-DA) score plot of the comparison between the primary angle closure glaucoma (PACG) and normal control (NC) groups in validation phase 1.
Figure 5—figure supplement 2
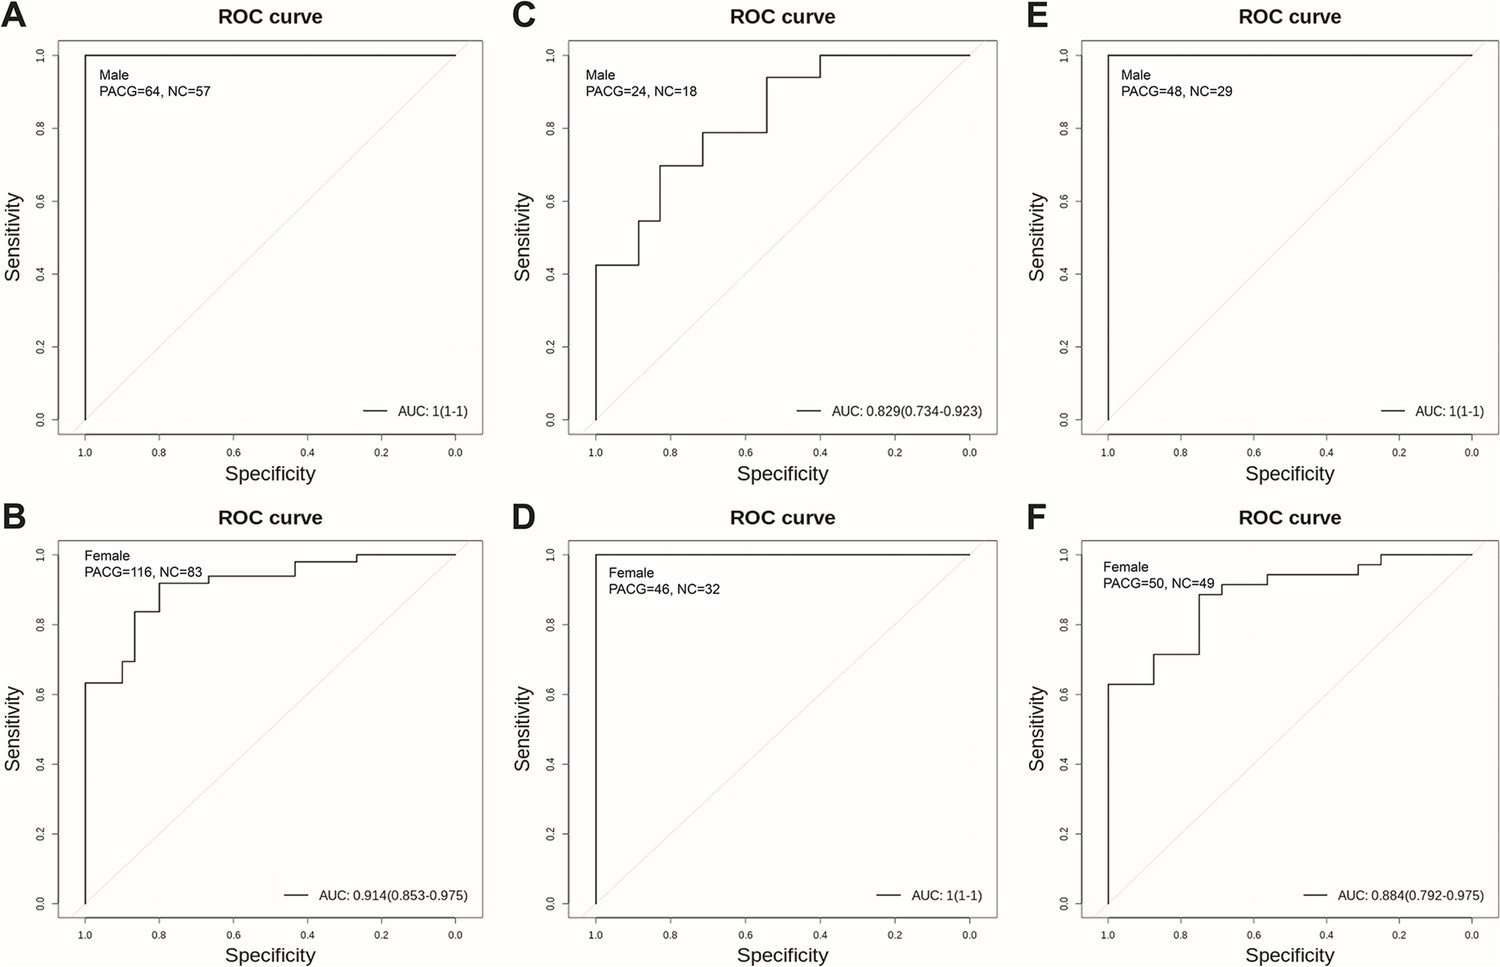
Biomarker validation in male and female subgroups.
(A) Androstenedione to discriminate primary angle closure glaucoma (PACG) from normal in the discovery set in male subjects. (B) Androstenedione to discriminate PACG from normal in the discovery set in female subjects. (C) Androstenedione to discriminate PACG from normal in the validation set 1 in male subjects. (D) Androstenedione to discriminate PACG from normal in the validation set 1 in female subjects. (E) Androstenedione to discriminate PACG from normal in the validation set 2 in male subjects. (F) Androstenedione to discriminate PACG from normal in the validation set 2 in female subjects.
Figure 6 with 1 supplement
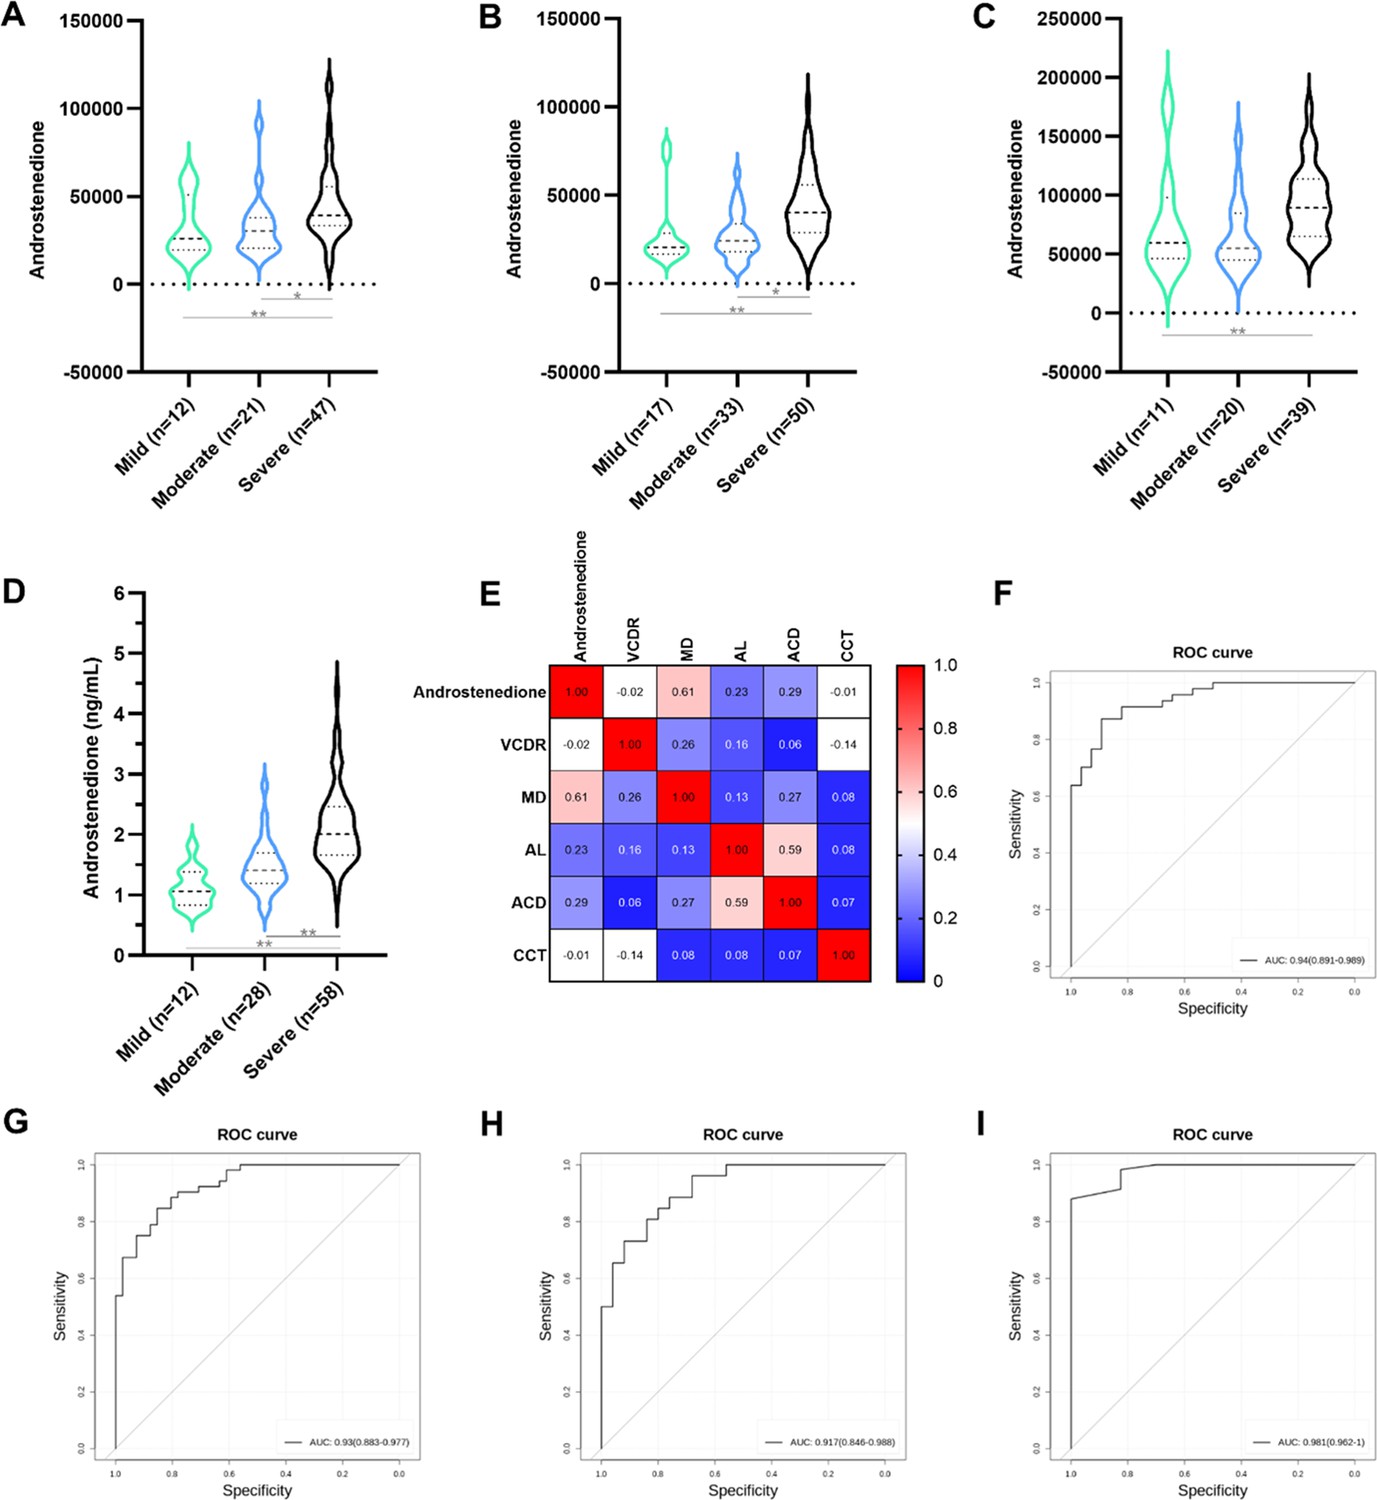
Androstenedione is associated with the severity of primary angle closure glaucoma (PACG).
(A) Comparison of mean serum levels of androstenedione between mild, moderate, and severe PACG in the discovery set 1 (unit for y-axis is peak areas). (B) Comparison mean serum levels of androstenedione between mild, moderate, and severe PACG in the discovery set 2 (unit for y-axis is peak areas). (C) Comparison of mean serum levels of androstenedione between mild, moderate, and severe PACG in validation phase 1 (unit for y-axis is peak areas). (D) Comparison of mean serum levels of androstenedione between mild, moderate, and severe PACG in validation phase 2 (unit for y-axis is peak areas). (E) Heatmap of correlation analysis between ocular clinical characteristics and androstenedione in validation phase 2. (F) Androstenedione to discriminate mild and moderate PACG from severe PACG in the discovery set 1. (G) Androstenedione to discriminate mild and moderate PACG from severe PACG in the discovery set 2. (H) Androstenedione to discriminate mild and moderate PACG from severe PACG in validation phase 1. (I) Androstenedione to discriminate mild and moderate PACG from severe PACG in validation phase 2. *: p<0.05. **: p<0.001.
Figure 6—figure supplement 1
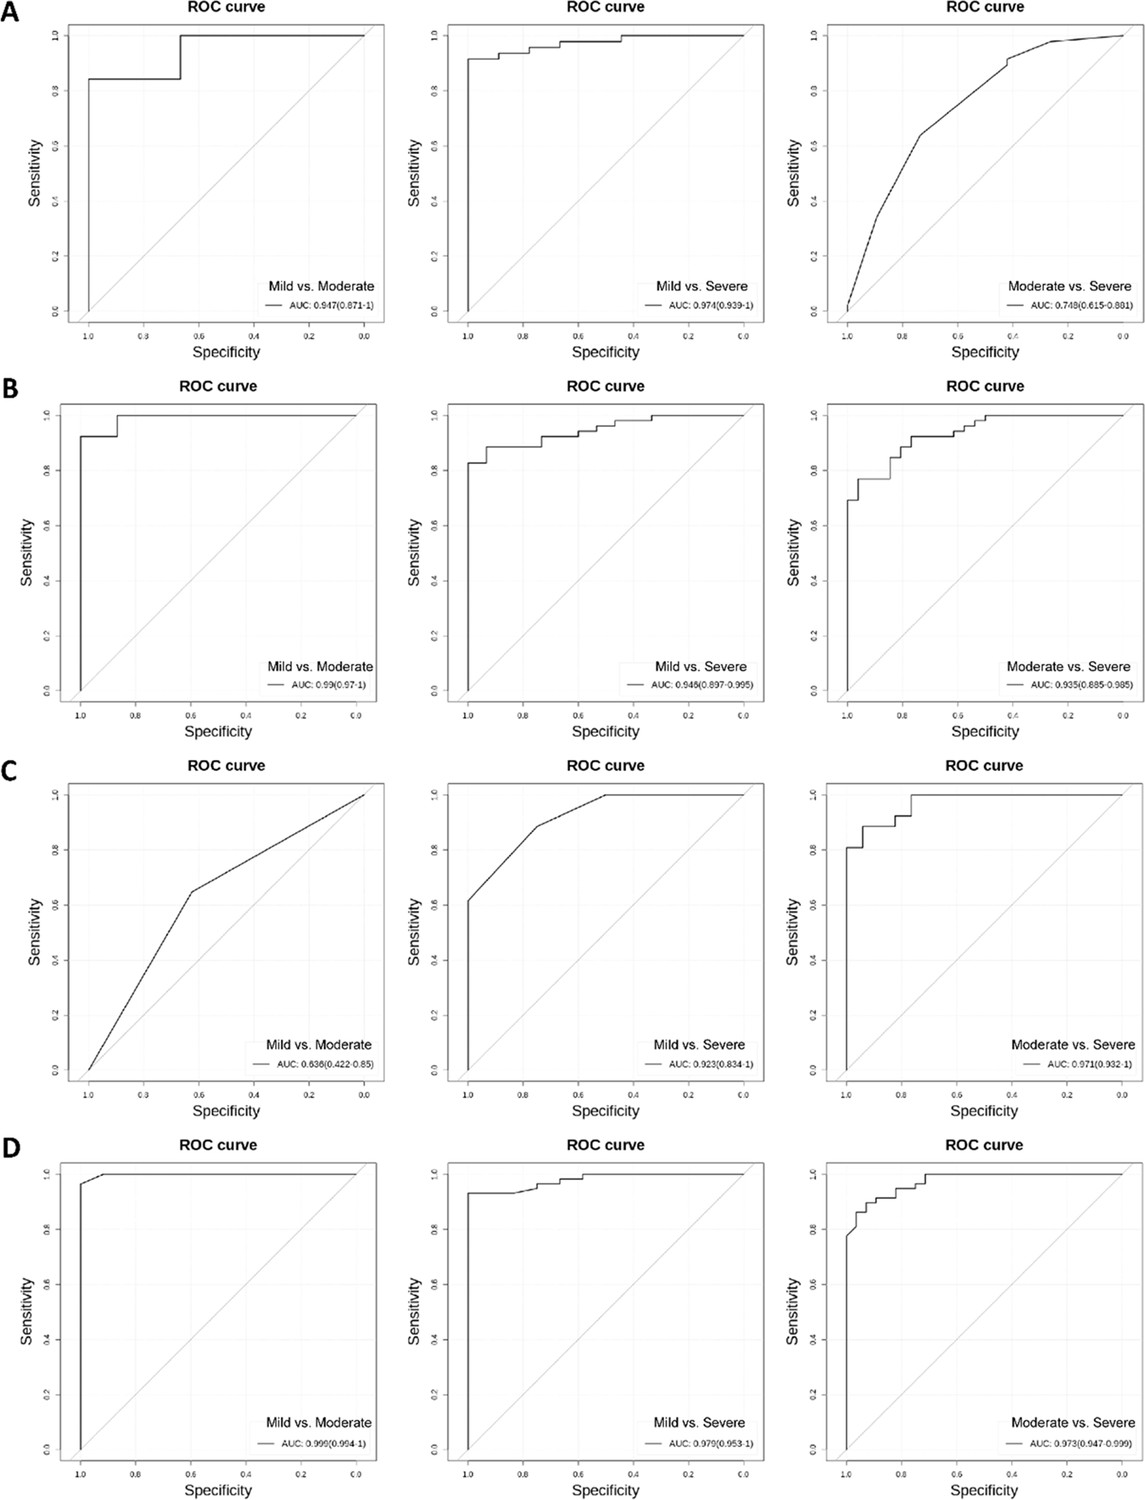
Receiver operating characteristic curves to discriminates mild, moderate, and severe primary angle closure glaucoma (PACG).
(A) Androstenedione to discriminates mild, moderate, and severe PACG in discovery set 1. (B) Androstenedione to discriminates mild, moderate, and severe PACG in discovery set 2. (C) Androstenedione to discriminates mild, moderate, and severe PACG in validation phase 1. (D) Androstenedione to discriminates mild, moderate, and severe PACG in validation phase 2.
Figure 7

Specificity of circulating androstenedione in patients with primary angle closure glaucoma (PACG) in supplemental phase.
(A) Sampling scheme and workflow to investigate the temporal changes in androstenedione levels. (B) Differential level of serum androstenedione between patients with PACG before and 3 months after treatment (unit for y-axis is peak areas). (C) Sampling scheme and workflow to determine whether aqueous humor levels of androstenedione were high in patients with PACG. (D) The aqueous humor level of androstenedione between PACG and cataract (unit for y-axis is peak areas). (E) Heatmap of correlation analysis between ocular clinical characteristics and aqueous humor level of androstenedione. (F) Comparison means aqueous humor levels of androstenedione between mild, moderate, and severe PACG (unit for y-axis is peak areas). (G) Seven paired serum-aqueous humor samples from the same PACG patients were included (unit for y- and x-axis is peak areas). A significant correlation between serum and aqueous humor levels of androstenedione was observed. Kruskal-Wallis test and one-way ANOVA was used. *: p<0.05; **: p<0.001.
Figure 8
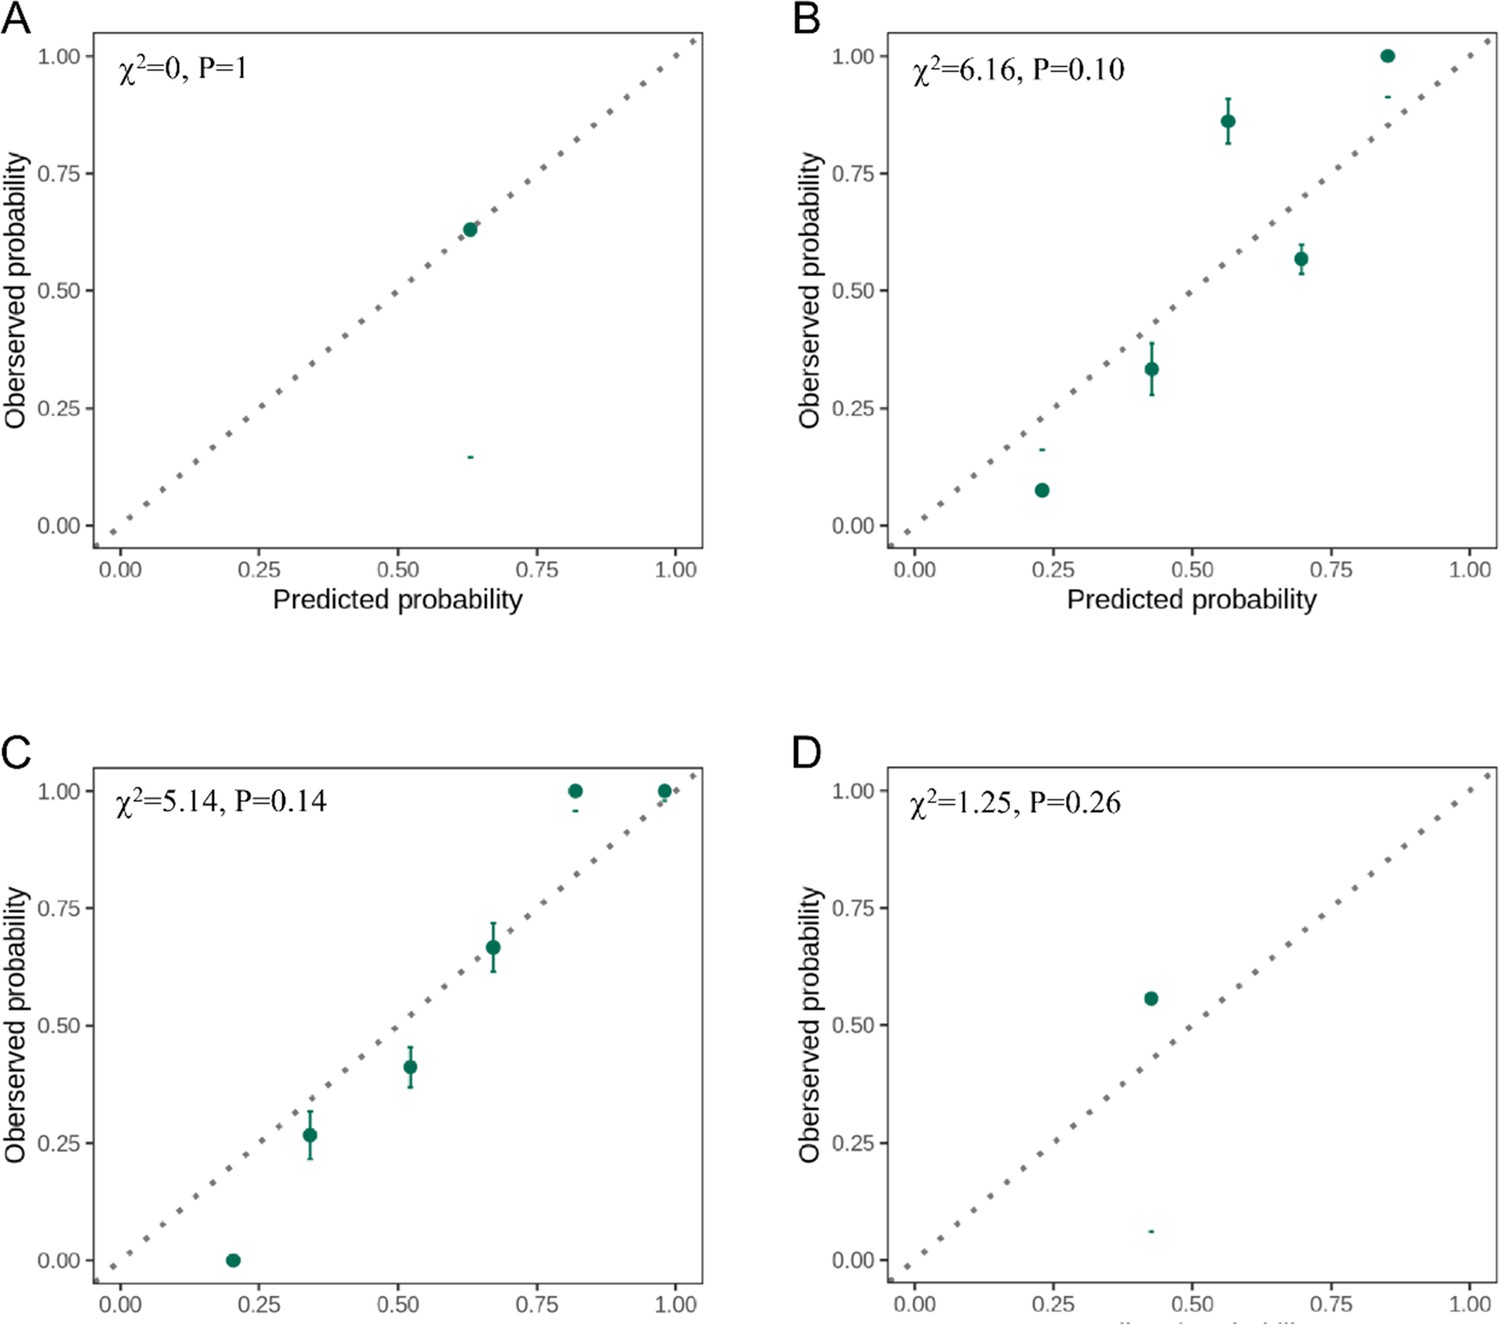
Calibration ability of androstenedione.
(A) Calibration curves in the discovery set 1. (B) Calibration curves in the discovery set 2. (C) Calibration curves in the validation phase 1. (D) Calibration curves in the validation phase 2. The predicted probability of primary angle closure glaucoma (x-axis) is compared to the observed frequency (y-axis). The plot is grouped by deciles and quintiles of the predicted risk (green circles) with 95% confidence intervals (green lines). Perfect predictions should lie on the reference (dashed).
Figure 9

Kaplan-Meier curves stratified by the men value in terms of androstenedione.
(A) Male+female; (B) female; (C) male. We categorized study participants into two groups based on their mean levels of androstenedione.
Figure 10 with 2 supplements

Potential mechanisms, androstenedione accumulation in patients with primary angle closure glaucoma (PACG).
(A) Steroid hormone biosynthesis related to androstenedione. (B) Aromatase function deficits may be the potential mechanism leading to androstenedione accumulation in patients with PACG. (C) Binding mode of androstenedione to aromatase by molecular docking.
Figure 10—figure supplement 1
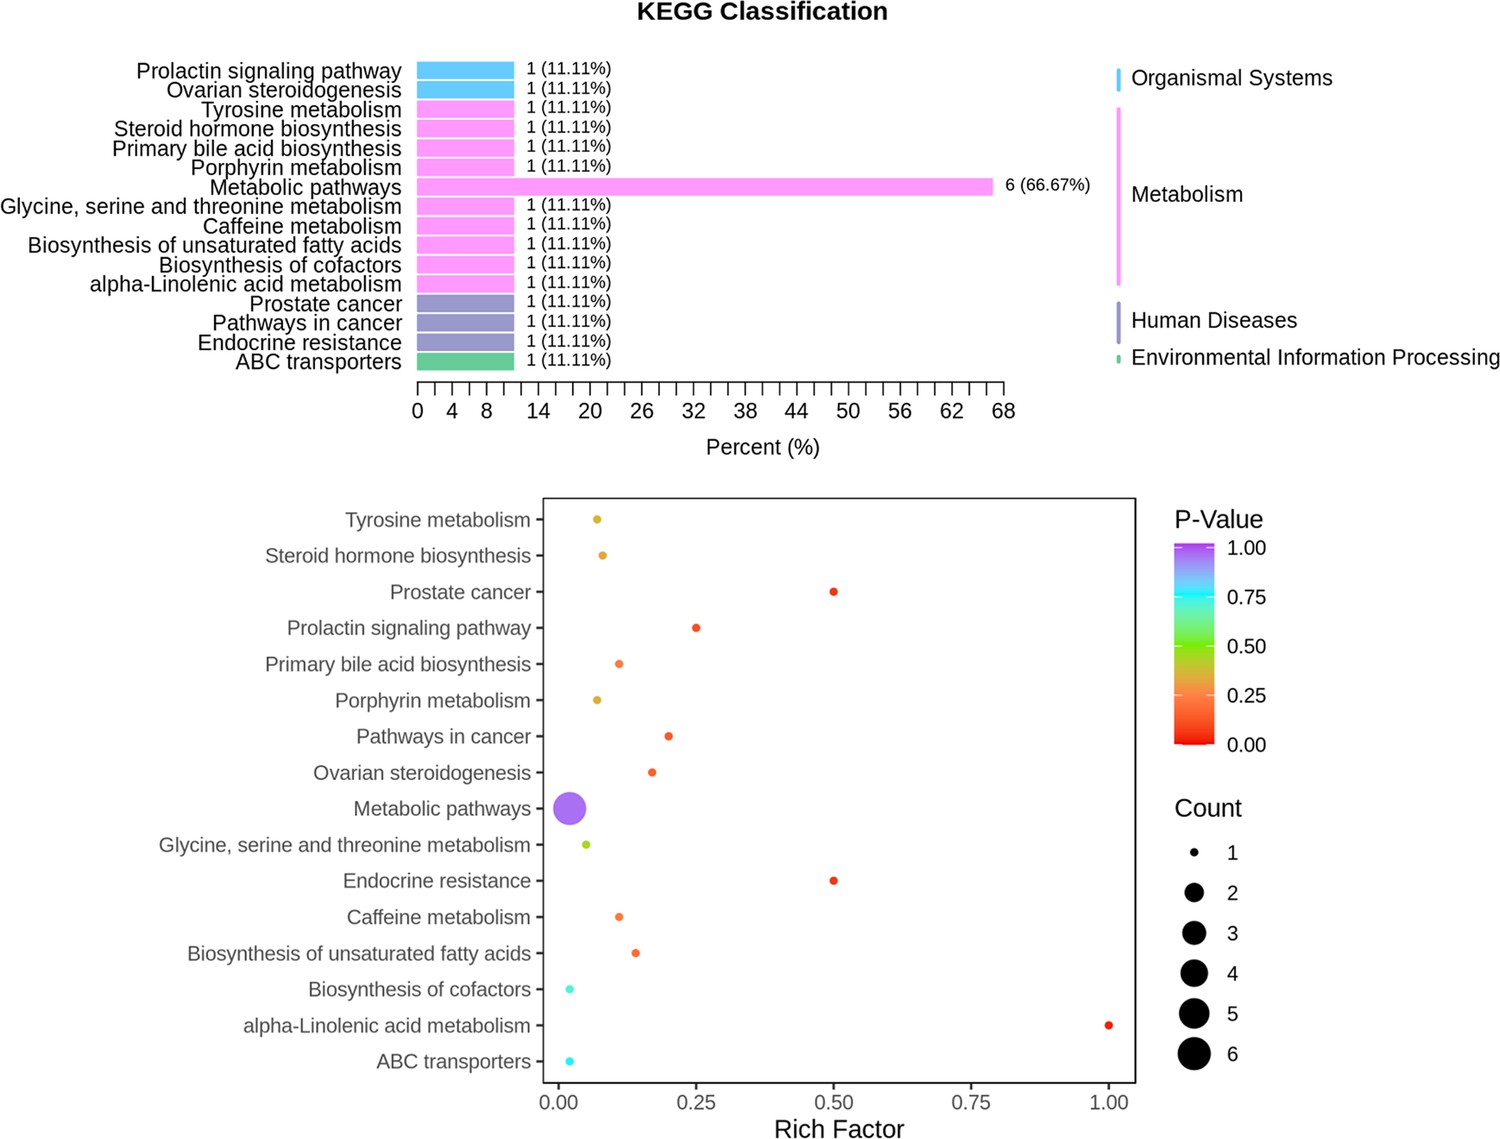
Pathway enrichment plot in discovery set 2.
Figure 10—figure supplement 2
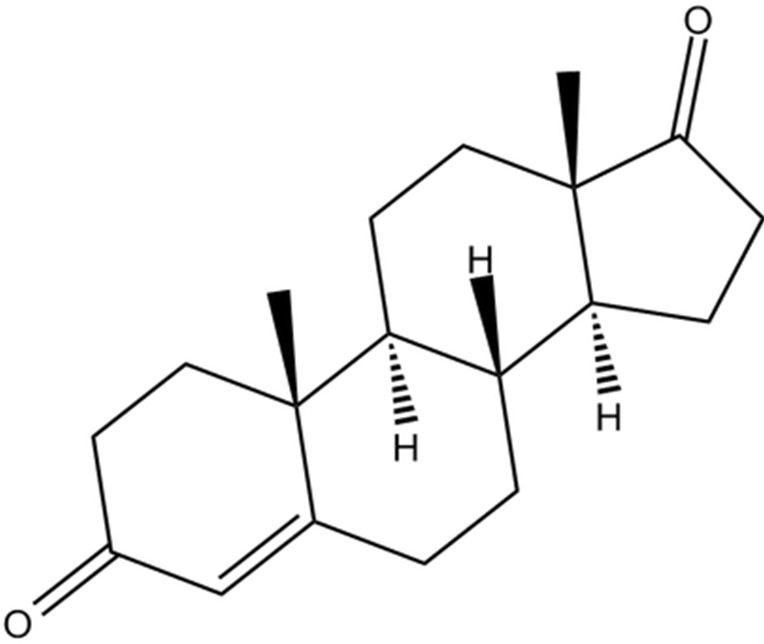
Molecular formula of androstenedione.
Tables
Table 1
The clinical and demographic characteristics of all subjects in the discovery and validation phases.
| Normal (n=268) | PACG (n=348) | t/χ2 | p | |
|---|---|---|---|---|
| Discovery phase | ||||
| Discovery set 1 | ||||
| Number (n) | 60 | 80 | ||
| Age (years) | 58.75±8.63 | 61.00±8.67 | 1.52 | 0.13 |
| Sex (male, %) | 24 (40.0) | 31 (38.8) | 0.02 | 0.88 |
| BMI (kg/m2) | 24.04±5.27 | 23.36±2.44 | 0.99 | 0.33 |
| Hypercholesterolemia (yes, %) | 6 (10) | 9 (11.3) | 0.06 | 0.81 |
| Hypertension (yes, %) | 16 (26.7) | 18 (22.8) | 0.32 | 0.60 |
| Diabetes (yes, %) | 1 (1.7) | 8 (10.1) | 3.96 | 0.10 |
| Smoking (yes, %) | 5 (8.3) | 11 (13.9) | 0.99 | 0.42 |
| Drinking (yes, %) | 7 (11.7) | 8 (10.1) | 0.1 | 0.76 |
| Duration (months) | 10.45±12.43 | |||
| IOP (mmHg) | 12.22±4.50 | 27.78±11.20 | 10.17 | <0.001 |
| VCDR | 0.25±0.18 | 0.64±0.23 | 10.87 | <0.001 |
| AL (mm) | 22.48±1.14 | |||
| ACD (mm) | 1.86±0.55 | |||
| CCT (µm) | 534.04±41.26 | |||
| MS (dB) | 12.46±8.75 | |||
| MD (dB) | 14.67±8.94 | |||
| Discovery set 2 | ||||
| Number (n) | 80 | 100 | ||
| Age (years) | 62.54±6.74 | 63.14±9.04 | 0.49 | 0.62 |
| Sex (male, %) | 35 (43.8) | 33 (33.0) | 2.19 | 0.14 |
| BMI (kg/m2) | 23.68±2.81 | 23.32±3.15 | 1.36 | 0.18 |
| Hypercholesterolemia (yes, %) | 12 (15) | 13 (13) | 0.15 | 0.70 |
| Hypertension (yes, %) | 26 (32.5) | 33 (33.0) | 0.01 | 0.94 |
| Diabetes (yes, %) | 7 (8.8) | 9 (9.0) | 0.003 | 0.95 |
| Smoking (yes, %) | 11 (13.8) | 15 (15.0) | 0.06 | 0.81 |
| Drinking (yes, %) | 19 (23.8) | 22 (22.0) | 0.08 | 0.78 |
| Duration (months) | 8.46±9.69 | |||
| IOP (mmHg) | 11.45±5.21 | 25.80±12.55 | 8.329 | <0.001 |
| VCDR | 0.27±0.14 | 0.61±0.22 | 10.48 | <0.001 |
| AL (mm) | 22.43±0.75 | |||
| ACD (mm) | 2.05±0.77 | |||
| CCT (µm) | 547.43±43.04 | |||
| MS (dB) | 12.34±8.55 | |||
| MD (dB) | 14.50±8.95 | |||
| Validation phase 1 | ||||
| Number (n) | 50 | 70 | ||
| Age (years) | 57.47±8.17 | 60.34±10.11 | 1.66 | 0.10 |
| Sex (male, %) | 18 (36.0) | 24 (34.3) | 0.04 | 0.85 |
| BMI (kg/m2) | 23.08±1.99 | 24.45±3.72 | 1.31 | 0.19 |
| Hypercholesterolemia (yes, %) | 4 (8) | 8 (11.4) | 0.38 | 0.54 |
| Hypertension (yes, %) | 17 (34.0) | 21 (30.0) | 0.22 | 0.64 |
| Diabetes (yes, %) | 5 (10.0) | 7 (10.0) | 0.0 | 1.0 |
| Smoking (yes, %) | 6 (12.0) | 10 (14.3) | 0.13 | 0.72 |
| Drinking (yes, %) | 10 (20.0) | 15 (21.4) | 0.04 | 0.85 |
| Duration (months) | 11.09±13.82 | |||
| IOP (mmHg) | 12.90±4.11 | 28.46±9.80 | 11.55 | <0.001 |
| VCDR | 0.24±0.17 | 0.60±0.21 | 10.87 | <0.001 |
| AL (mm) | 22.44±0.83 | |||
| ACD (mm) | 1.86±0.37 | |||
| CCT (µm) | 539.09±82.70 | |||
| MS (dB) | 13.78±8.58 | |||
| MD (dB) | 13.96±9.29 | |||
| Validation phase 2 | ||||
| Number (n) | 78 | 98 | ||
| Age (years) | 56.55±11.53 | 60.26±15.41 | 1.77 | 0.08 |
| Sex (male, %) | 29 (37.2) | 48 (49.0) | 2.46 | 0.12 |
| BMI (kg/m2) | 24.54±5.42 | 25.90±7.51 | 1.26 | 0.21 |
| Hypercholesterolemia (yes, %) | 11 (14.1) | 13 (13.3) | 0.03 | 0.87 |
| Hypertension (yes, %) | 19 (24.4) | 31 (31.6) | 0.26 | 0.61 |
| Diabetes (yes, %) | 6 (7.7) | 17 (17.3) | 3.6 | 0.06 |
| Smoking (yes, %) | 9 (11.5) | 22 (22.4) | 3.6 | 0.06 |
| Drinking (yes, %) | 12 (15.4) | 19 (19.4) | 0.48 | 0.49 |
| Duration (months) | 11.40±13.8 | |||
| IOP (mmHg) | 13.40±5.43 | 29.20±11.20 | 10.07 | <0.001 |
| VCDR | 0.30±0.19 | 0.68±0.23 | 10.41 | <0.001 |
| AL (mm) | 23.20±1.72 | |||
| ACD (mm) | 2.15±0.67 | |||
| CCT (µm) | 546.71±50.35 | |||
| MS (dB) | 11.07±8.54 | |||
| MD (dB) | 16.49±8.64 | |||
-
BMI = body mass index; IOP = intraocular pressure, VCDR = vertical cup-to-disc ratio, AL = axial length, CCT = central corneal thickness, ACD = anterior chamber depth, MD: visual field mean deviation, MS: visual field mean sensitivity, PACG = primary angle closure glaucoma.
Table 2
Cox proportional hazards regression analysis to assess the value of androstenedione associated with progression of PACG.
| Univariate | Multivariate* | |||
|---|---|---|---|---|
| p | HR (95% CI) | p | HR (95% CI) | |
| Age | 0.008 | 0.97 (0.95–0.99) | 0.22 | 0.98 (0.95–1.01) |
| Sex | 0.87 | 0.95 (0.53–1.72) | 0.73 | 1.15 (0.53–2.52) |
| IOP | 0.59 | 1.007 (0.98–1.04) | 0.75 | 0.99 (0.96–1.03) |
| VCDR | 0.17 | 0.40 (0.11–1.46) | 0.16 | 0.37 (0.092–1.46) |
| CCT | 0.77 | 1.001 (0.10–1.007) | 0.90 | 1.000 (0.99–1.007) |
| ACD | 0.03 | 1.63 (1.05–2.52) | 0.91 | 1.041 (0.51–2.13) |
| AL | 0.005 | 1.24 (1.07–1.44) | 0.35 | 1.12 (0.89–1.41) |
| MD | 0.13 | 1.04 (0.99–1.08) | 0.075 | 1.047 (0.10–1.10) |
| Androstenedione | <0.001 | 3.73 (1.84–7.57) | 0.017 | 2.71 (1.20–6.10) |
-
*
Adjusted for BMI, diabetes (yes = 1, no = 0), hypertension (yes = 1, no = 0), hypercholesterolemia (yes = 1, no = 0), smoking (yes = 1, no = 0), and drinking (yes = 1, no = 0). Bold values indicate positive results.
-
IOP =intraocular pressure, VCDR =vertical cup-to-disc ratio, AL =axial length, CCT =central corneal thickness, ACD =anterior chamber depth, MD =mean deviation, PACG =primary angle closure glaucoma.
Additional files
-
Supplementary file 1
List of statistical approach and packages.
- https://cdn.elifesciences.org/articles/91407/elife-91407-supp1-v1.docx
-
Supplementary file 2
The clinical and demographic characteristics of primary angle closure glaucoma (PACG) and cataract subjects in the supplemental phase.
- https://cdn.elifesciences.org/articles/91407/elife-91407-supp2-v1.docx
-
Supplementary file 3
The clinical and demographic characteristics of same primary angle closure glaucoma (PACG) patients between pre-treatment and post-treatment.
- https://cdn.elifesciences.org/articles/91407/elife-91407-supp3-v1.docx
-
Supplementary file 4
The differential metabolites associated with primary angle closure glaucoma (PACG) and their fold changes in discovery set 1.
- https://cdn.elifesciences.org/articles/91407/elife-91407-supp4-v1.docx
-
Supplementary file 5
The differential metabolites associated with primary angle closure glaucoma (PACG) and their fold changes in discovery set 2.
- https://cdn.elifesciences.org/articles/91407/elife-91407-supp5-v1.docx
-
Supplementary file 6
The detecting parameters of 32 differential metabolites.
- https://cdn.elifesciences.org/articles/91407/elife-91407-supp6-v1.docx
-
Supplementary file 7
The relationship between androstenedione and risk of primary angle closure glaucoma (PACG).
- https://cdn.elifesciences.org/articles/91407/elife-91407-supp7-v1.docx
-
Supplementary file 8
The results of receiver operating characteristic (ROC) curve.
- https://cdn.elifesciences.org/articles/91407/elife-91407-supp8-v1.docx
-
Supplementary file 9
Comparison of characteristics of no progression and progression group in primary angle closure glaucoma (PACG) patients.
- https://cdn.elifesciences.org/articles/91407/elife-91407-supp9-v1.docx
-
Supplementary file 10
Comparison of areas under the receiver operating characteristic curve (AUCs) value among docosahexaenoic acid (DHA), free fatty acid (FFA) (22:6), free fatty acid (FFA) (18:4), and androstenedione.
- https://cdn.elifesciences.org/articles/91407/elife-91407-supp10-v1.docx
-
MDAR checklist
- https://cdn.elifesciences.org/articles/91407/elife-91407-mdarchecklist1-v1.docx
Download links
A two-part list of links to download the article, or parts of the article, in various formats.
Downloads (link to download the article as PDF)
Open citations (links to open the citations from this article in various online reference manager services)
Cite this article (links to download the citations from this article in formats compatible with various reference manager tools)
Metabolomics identifies and validates serum androstenedione as novel biomarker for diagnosing primary angle closure glaucoma and predicting the visual field progression
eLife 12:RP91407.
https://doi.org/10.7554/eLife.91407.3


