Guanidine production by plant homoarginine-6-hydroxylases
- Department of Chemistry, University of Konstanz, Germany
- Department of Life Science and Biotechnology, University of Ferrara, Italy
Figures
Figure 1 with 3 supplements
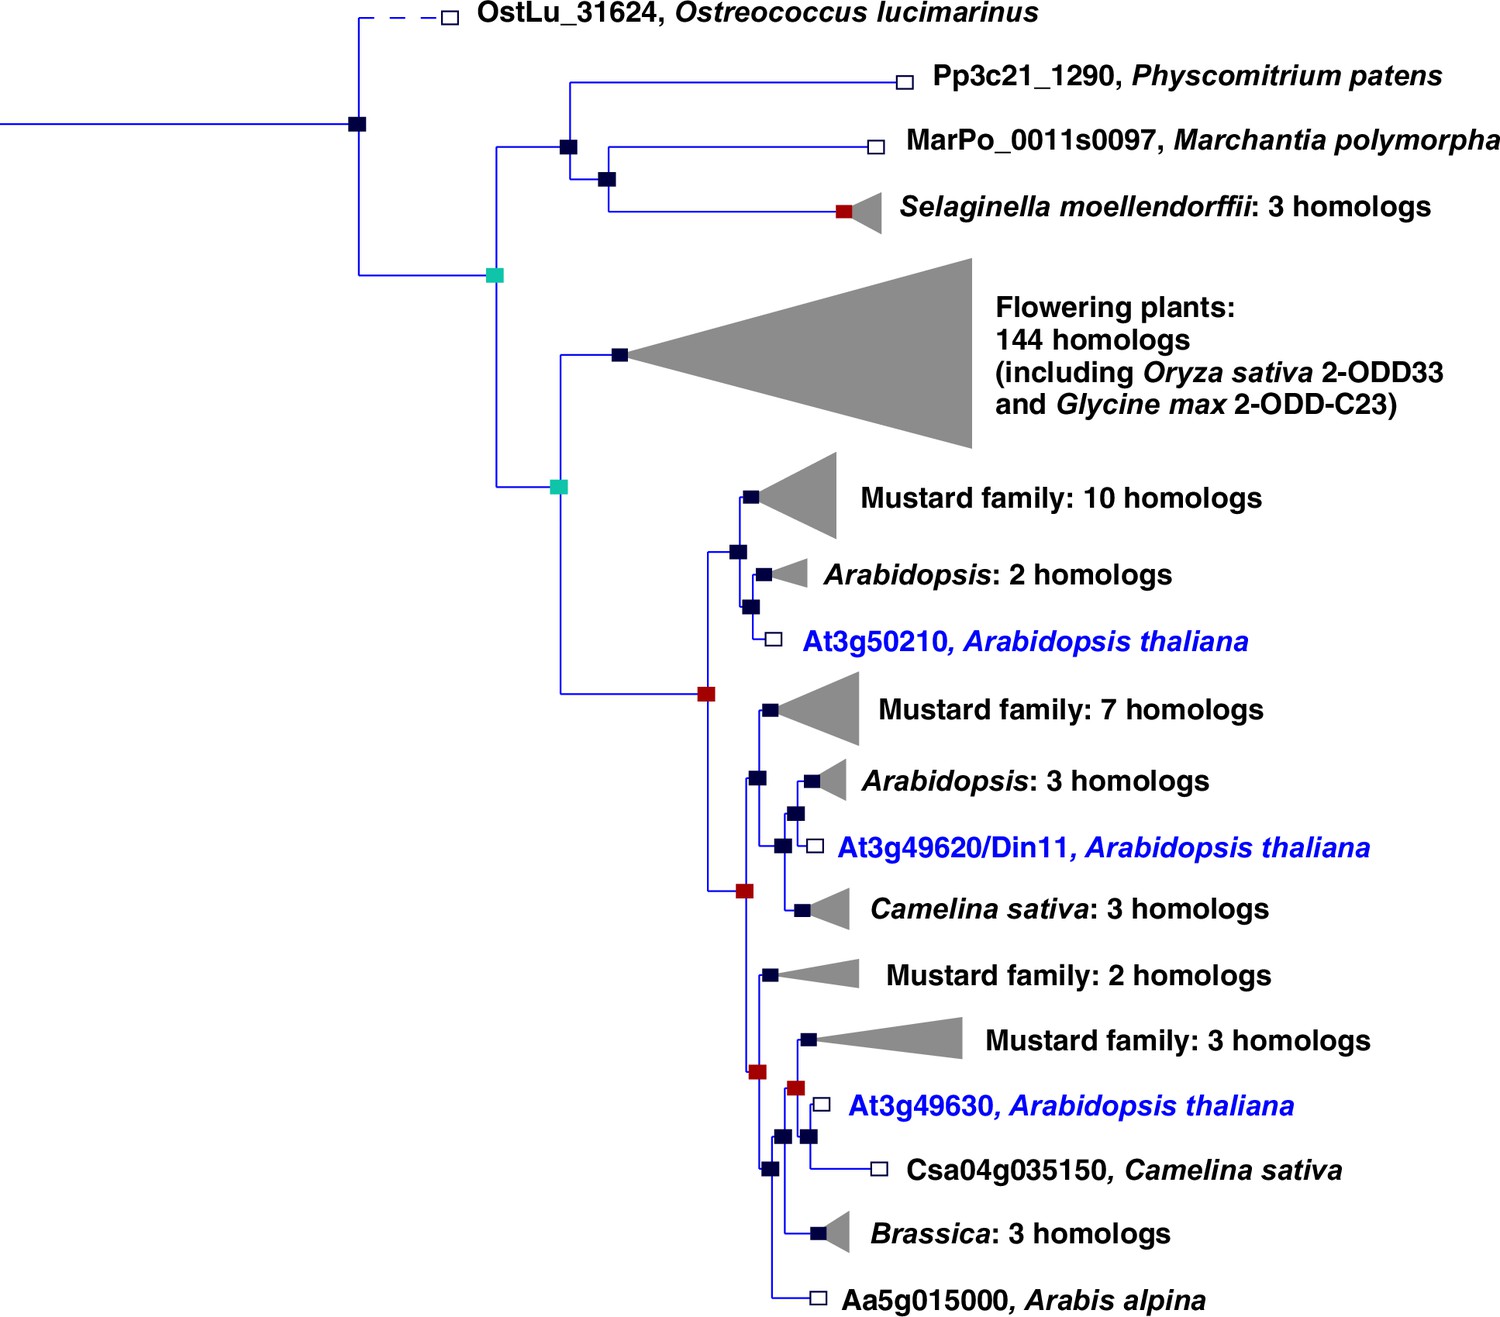
Phylogeny of the 2-ODD clade C23.
Excerpt of the gene tree for Din11 from EnsemblPlants (https://plants.ensembl.org, accessed Feb. 2023). The length of the horizontal blue lines is proportional to the number of amino acid exchanges except the dashed line, which is shortened by a factor of 10. Blue squares indicate speciation nodes, red squares indicate duplication nodes, green squares indicate ambiguous nodes, and open squares indicate species nodes. Grey triangles indicate collapsed branches. The three 2-ODD-C23 paralogues from Arabidopsis thaliana are highlighted by blue lettering.
Figure 1—figure supplement 1
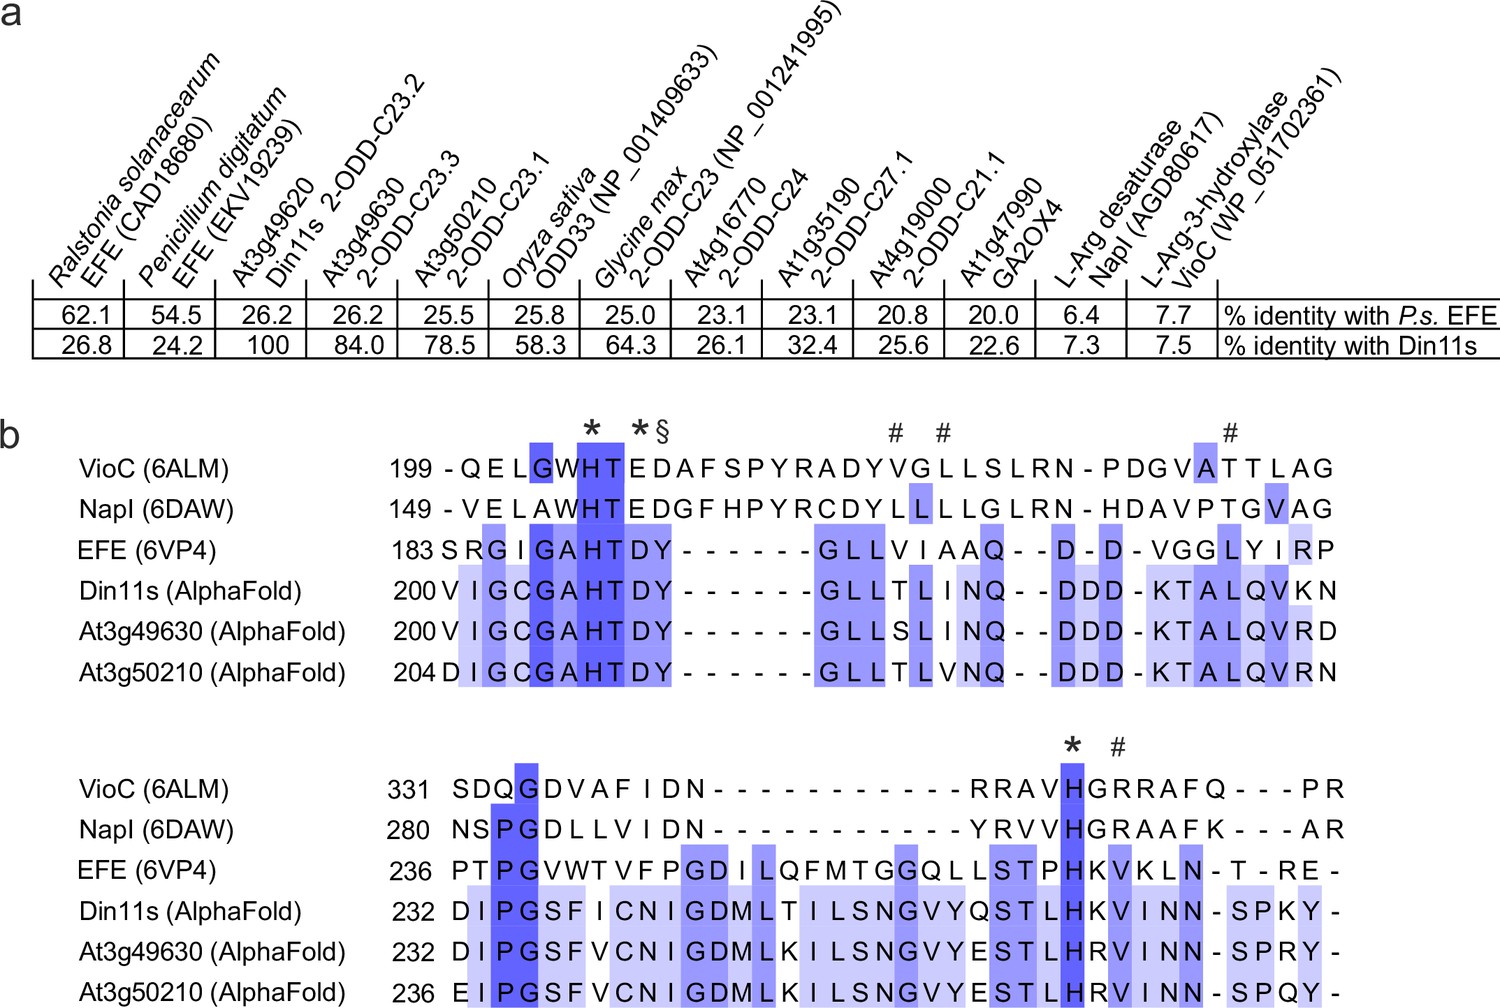
Sequence comparison of structurally or functionally related 2-ODD proteins.
(a) Sequence identity between Pseudomonas savastanoi EFE (P.s. EFE), Din11s and selected other members of the 2-ODD superfamily derived from a multiple sequence alignment containing further plant and bacterial sequences. BLAST searches with NapI or VioC do not produce significant hits in Arabidopsis. Gibberellin 2-oxidase 4 (GA2OX4) has the highest degree of similarity with P.s. EFE among the functionally characterised Arabidopsis 2-ODDs. NCBI protein accession numbers are given in brackets. (b) Excerpt of a sequence alignment derived from a structural superposition of P.s. EFE with the structures other 2-ODDs acting on arginine or homoarginine as substrate. The structural alignment was generated in Chimera1.15 and was based only on the residues surrounding the active site, because an overall alignment was not possible. Residues contributing to Fe2+-coordination in the active site are marked with *. Residues contributing to 2-oxoglutarate binding in P.s. EFE are marked with #. A tyrosine residue that is structurally and functionally important for arginine binding in P.s. EFE is marked with §. This tyrosine residue is present in 2-ODD-C23 enzymes but not in any other Arabidopsis 2-ODD sequences.
Figure 1—figure supplement 2

3′-UTR of Din11.
Alignment of RNAseq reads (pink or purple lines) from two independent experiments with the genomic sequence (four-colored line) of Arabidopsis around the transcription start site of Din11. The 5′-end of the annotated Din11 transcript At3g49620.1/Din11L is hardly covered by RNAseq reads, which are much more frequent several basepairs downstream of the annotated start codon. The graphical representation of the RNAseq reads was modified from the Arabidopsis RNAseq database (Zhang et al., 2020).
Figure 1—figure supplement 3
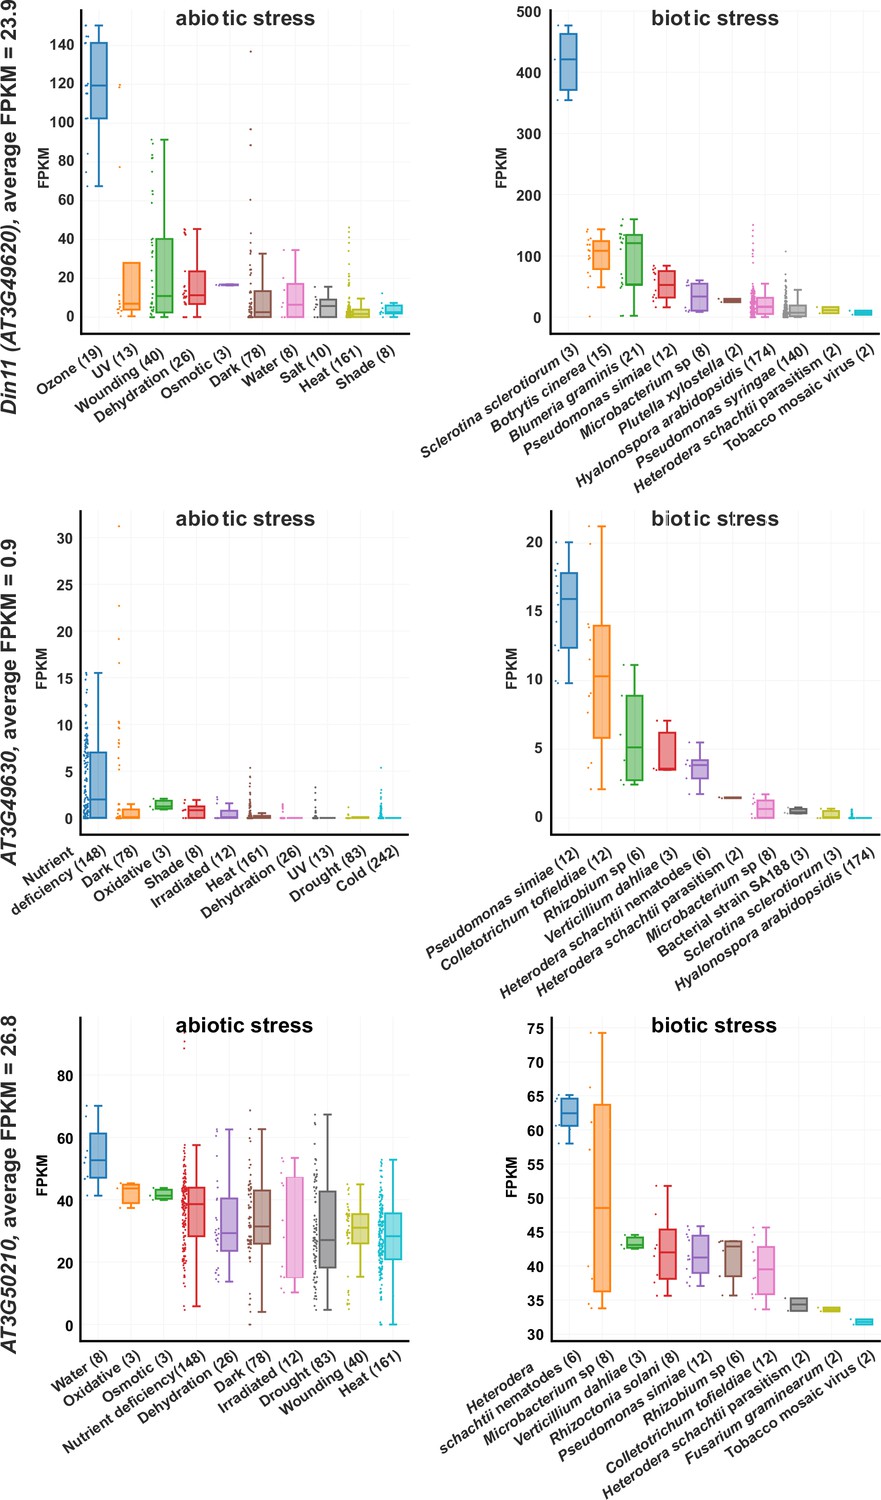
Expression levels of 2-ODD-C23s under stress.
RNAseq coverage of the three Arabidopsis 2-ODD-C23 isoforms under various abiotic and biotic stress conditions. The data plots were modified from the Arabidopsis RNAseq database (Zhang et al., 2020). Numbers in brackets are the number of samples per treatment. FPKM, Fragments per kilobase of transcript per million mapped reads.
Figure 2 with 2 supplements
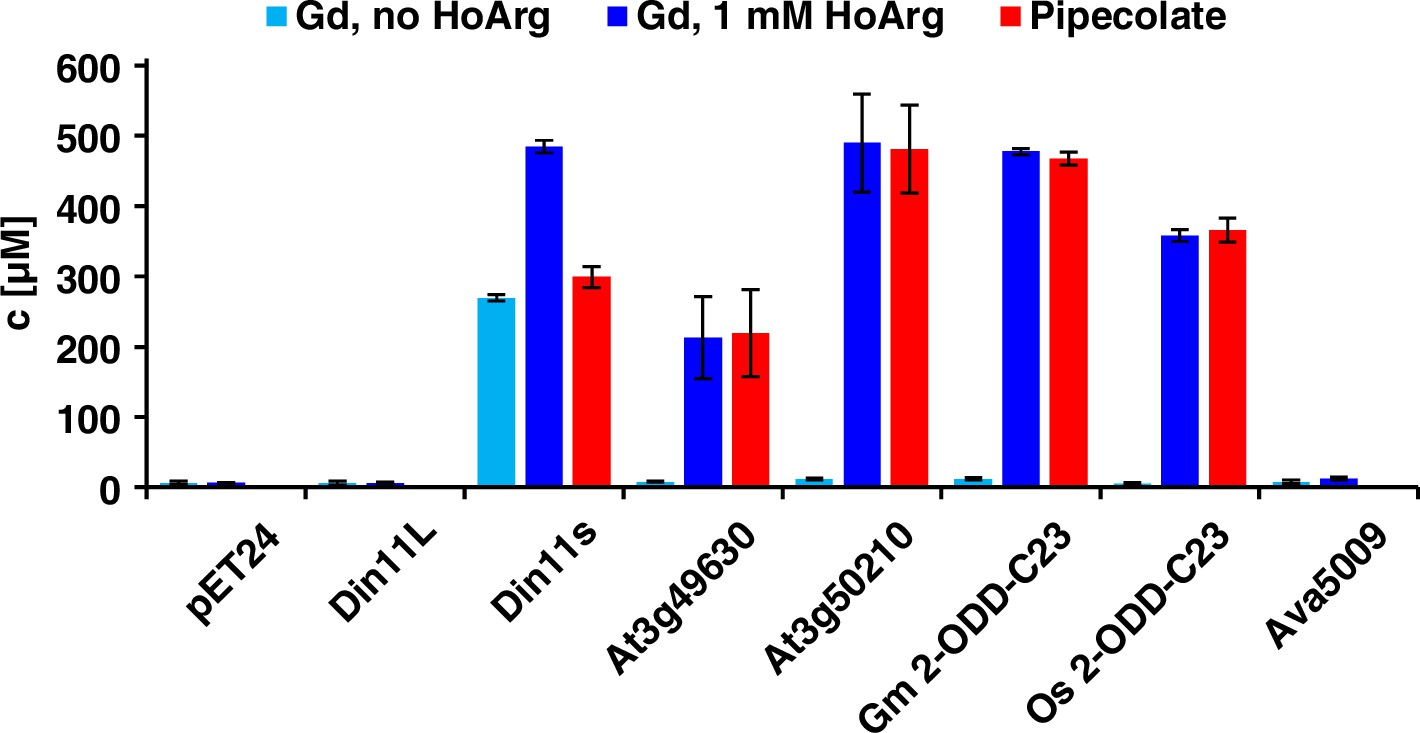
Expression of 2-ODD-C23 isoforms induces guanidine (Gd) accumulation in E. coli.
The cDNAs of various 2-ODD-C23 isoforms from plants and Ava5009 from Anabaena variabilis were cloned in pET24 for overproduction of the respective proteins in E. coli. Expression was induced over night at 18 °C in LB medium supplemented with 0.2% (w/v) glucose and 10 µM Fe2+. One aliquot of each culture was additionally supplemented with 1 mM homoarginine (HoArg). All cultures reached an OD around 10. For guanidine and pipecolate quantification by LC-MS, aliquots of the cultures were diluted in a 20-fold excess of methanol with 10 µM 13C15N-labeled guanidine as analytical standard. Pipecolate was exclusively detected in the cultures supplemented with homoarginine. Columns are the average ± SD of samples from three independent cultures.
Figure 2—figure supplement 1
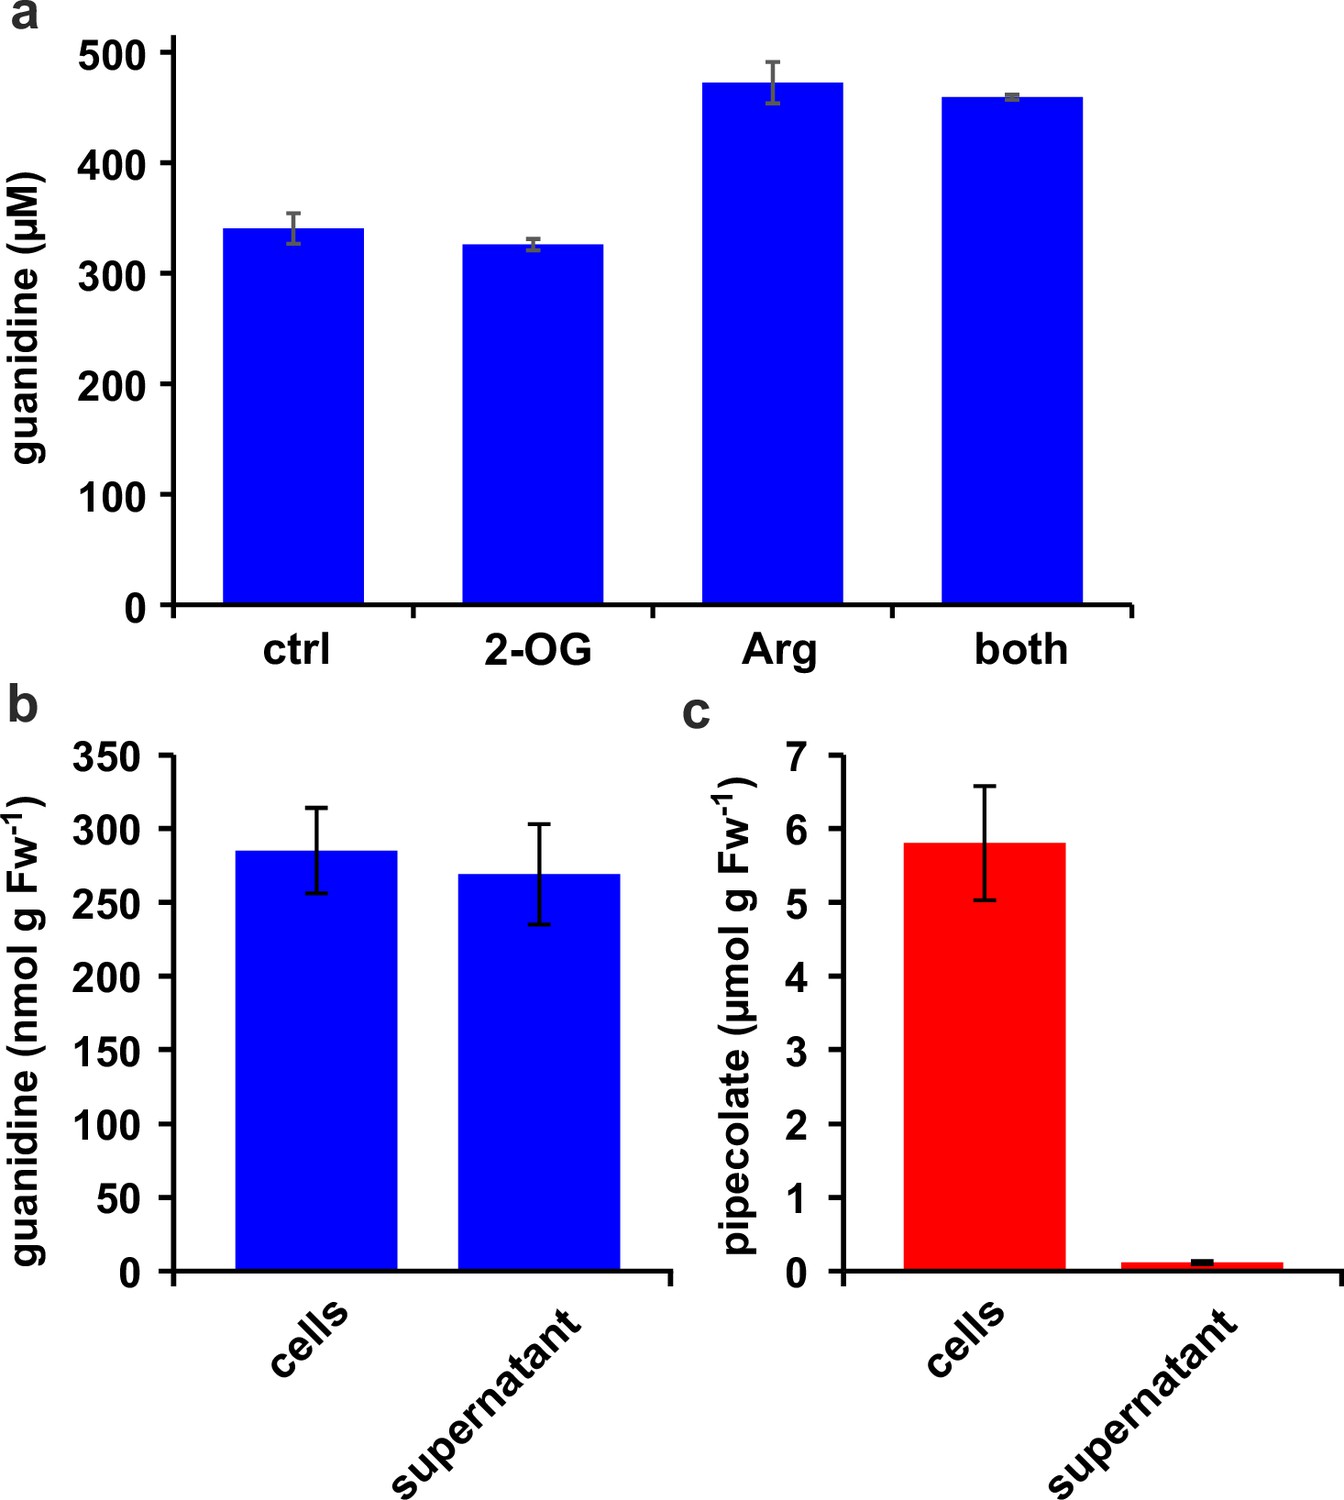
Distribution of metabolites in E. coli cultures.
(a) E. coli cells expressing Din11s were cultivated over night at 18 °C in medium supplemented with either 5 mM 2-oxoglutarate (2-OG), 5 mM arginine (Arg), or a combination of both. The cultures were diluted with a 20-fold excess of methanol containing 10 µM 13C15N-labeled guanidine as analytical standard. (b), (c) E. coli cells expressing soybean 2-ODD-C23 were grown over night at 18 °C in the presence of 1 mM homoarginine. The cells were harvested by centrifugation and lysed in 20 µl (mg Fw)–1 methanol containing 10 µM labeled guanidine. The supernatant was also mixed with a 20-fold excess of methanol with 10 µM labeled guanidine. Guanidine and pipecolate were quantified by LC-MS. The columns are the average ± SD of samples from three independent cultures. The experiments were repeated with consistent results.
-
Figure 2—figure supplement 1—source data 1
- https://cdn.elifesciences.org/articles/91458/elife-91458-fig2-figsupp1-data1-v1.xlsx
Figure 2—figure supplement 2
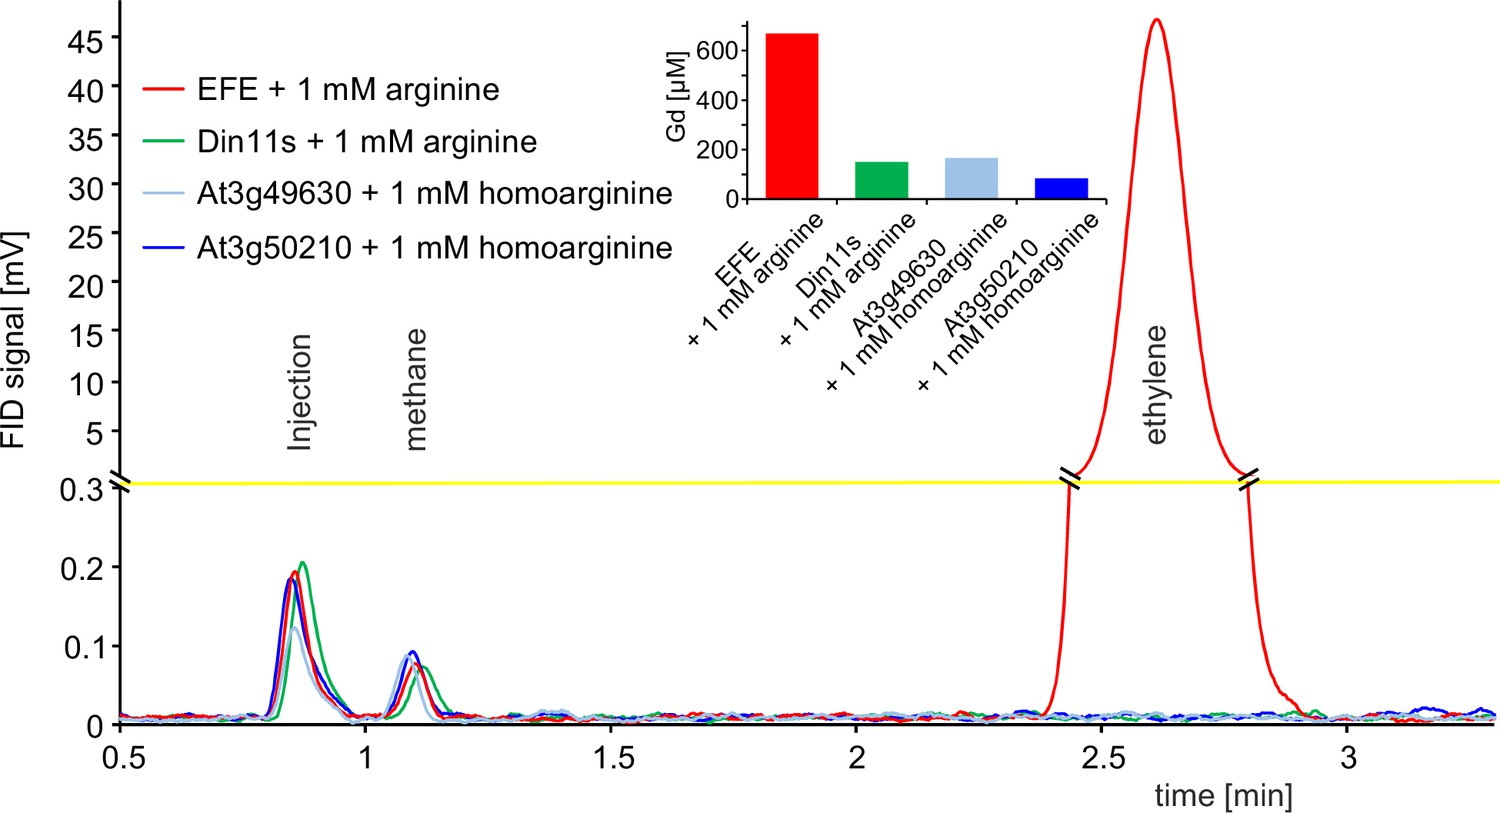
2-ODD C23 isoforms do not produce ethylene.
Flame ionization detector (FID) traces of samples from the headspace of E. coli cultures overexpressing Pseudomonas savastanoi EFE, Din11s, At3g49630, or At3g50210 and supplemented with 1 mM arginine or homoarginine as indicated in the figure. One ml of culture headspace was injected into a gas chromatograph (SGI 8610 C, SRI Instruments, Los Angeles, CA, United States) equipped with a 3 m HayeSep-D column (80 °C, carrier gas N2). Methane from the ambient air and ethylene produced by the bacteria were detected with a flame ionization detector. The software PeakSimple v4.44 was used to record the chromatograms. The detector output was smoothed by averaging 9 measurements recorded at 3 Hz. Inset: Quantification of guanidine in the cultures by LC-MS was used to confirm that the enzymes had been active. All data are from single measurements and consistent results were obtained in independent replicates.
Figure 3 with 1 supplement
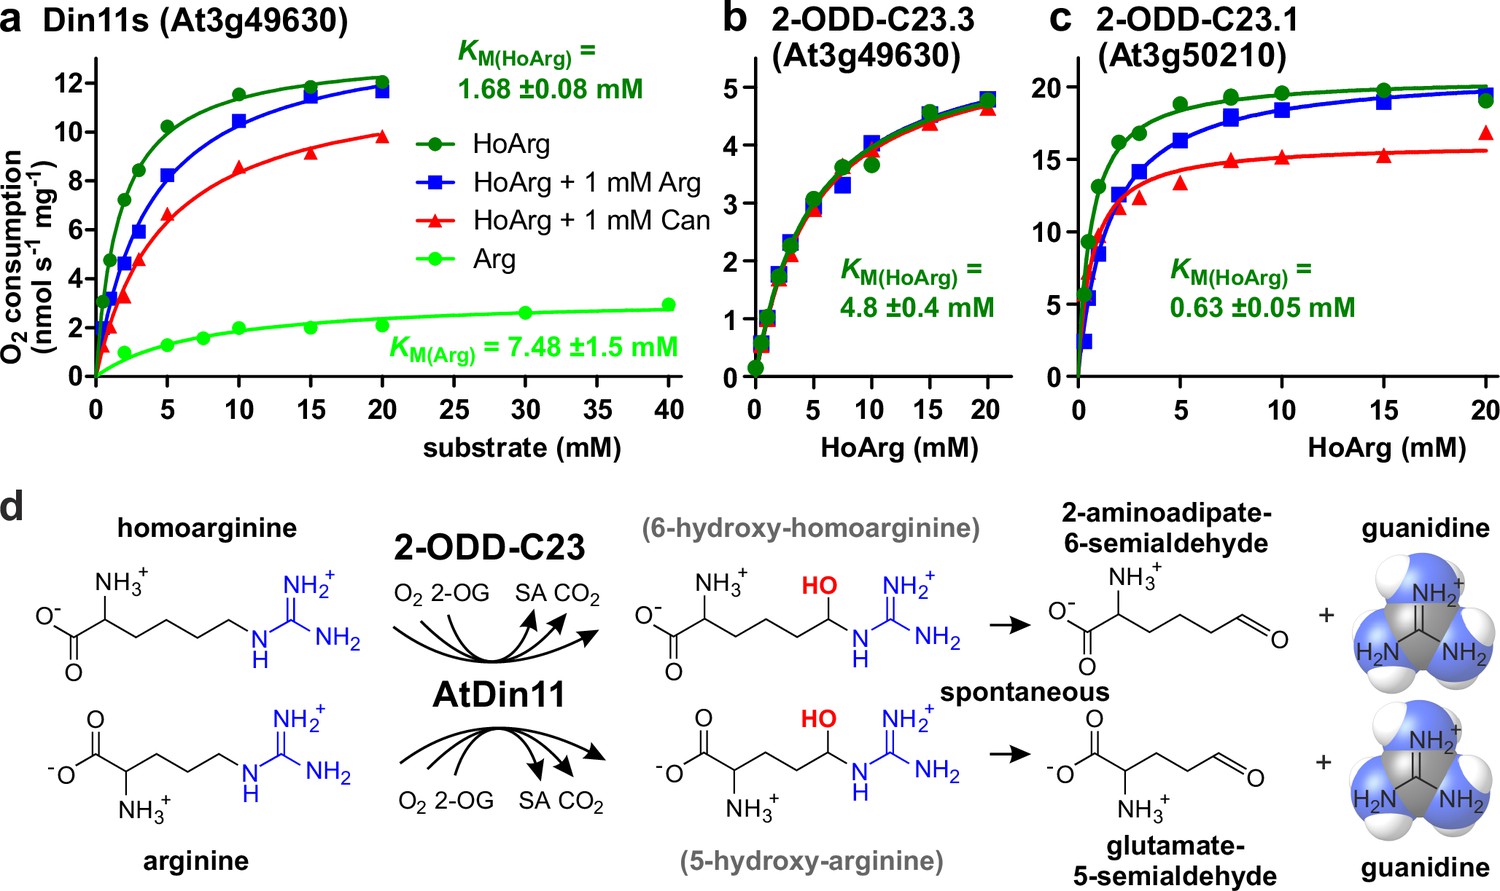
Kinetic analysis of purified recombinant 2-ODD-C23 isoforms.
(a)-(c) Specific activities of oxygen consumption at various substrate and inhibitor concentrations were analyzed with a Clark-type electrode. The concentration of the co-substrate 2-oxoglutarate was fixed at 0.5 mM. Only Din11s showed oxygen consumption with both homoarginine (HoArg) or arginine (Arg). The reaction of Din11s and At3g50210 with homoarginine was inhibited in the presence of 1 mM arginine (blue lines) or canavanine (red lines). Specific activities were calculated from the slope of the initial linear reaction rate. KM and Amax were determined by non-linear regression (see also Supplementary file 1). Data points represent single measurements, consistent results were obtained with independent enzyme preparations. (d) Reactions catalyzed by 2-ODD-C23 isoforms with subsequent spontaneous decay of the reaction products. The hydroxylated intermediates are too unstable to be detected.
Figure 3—figure supplement 1
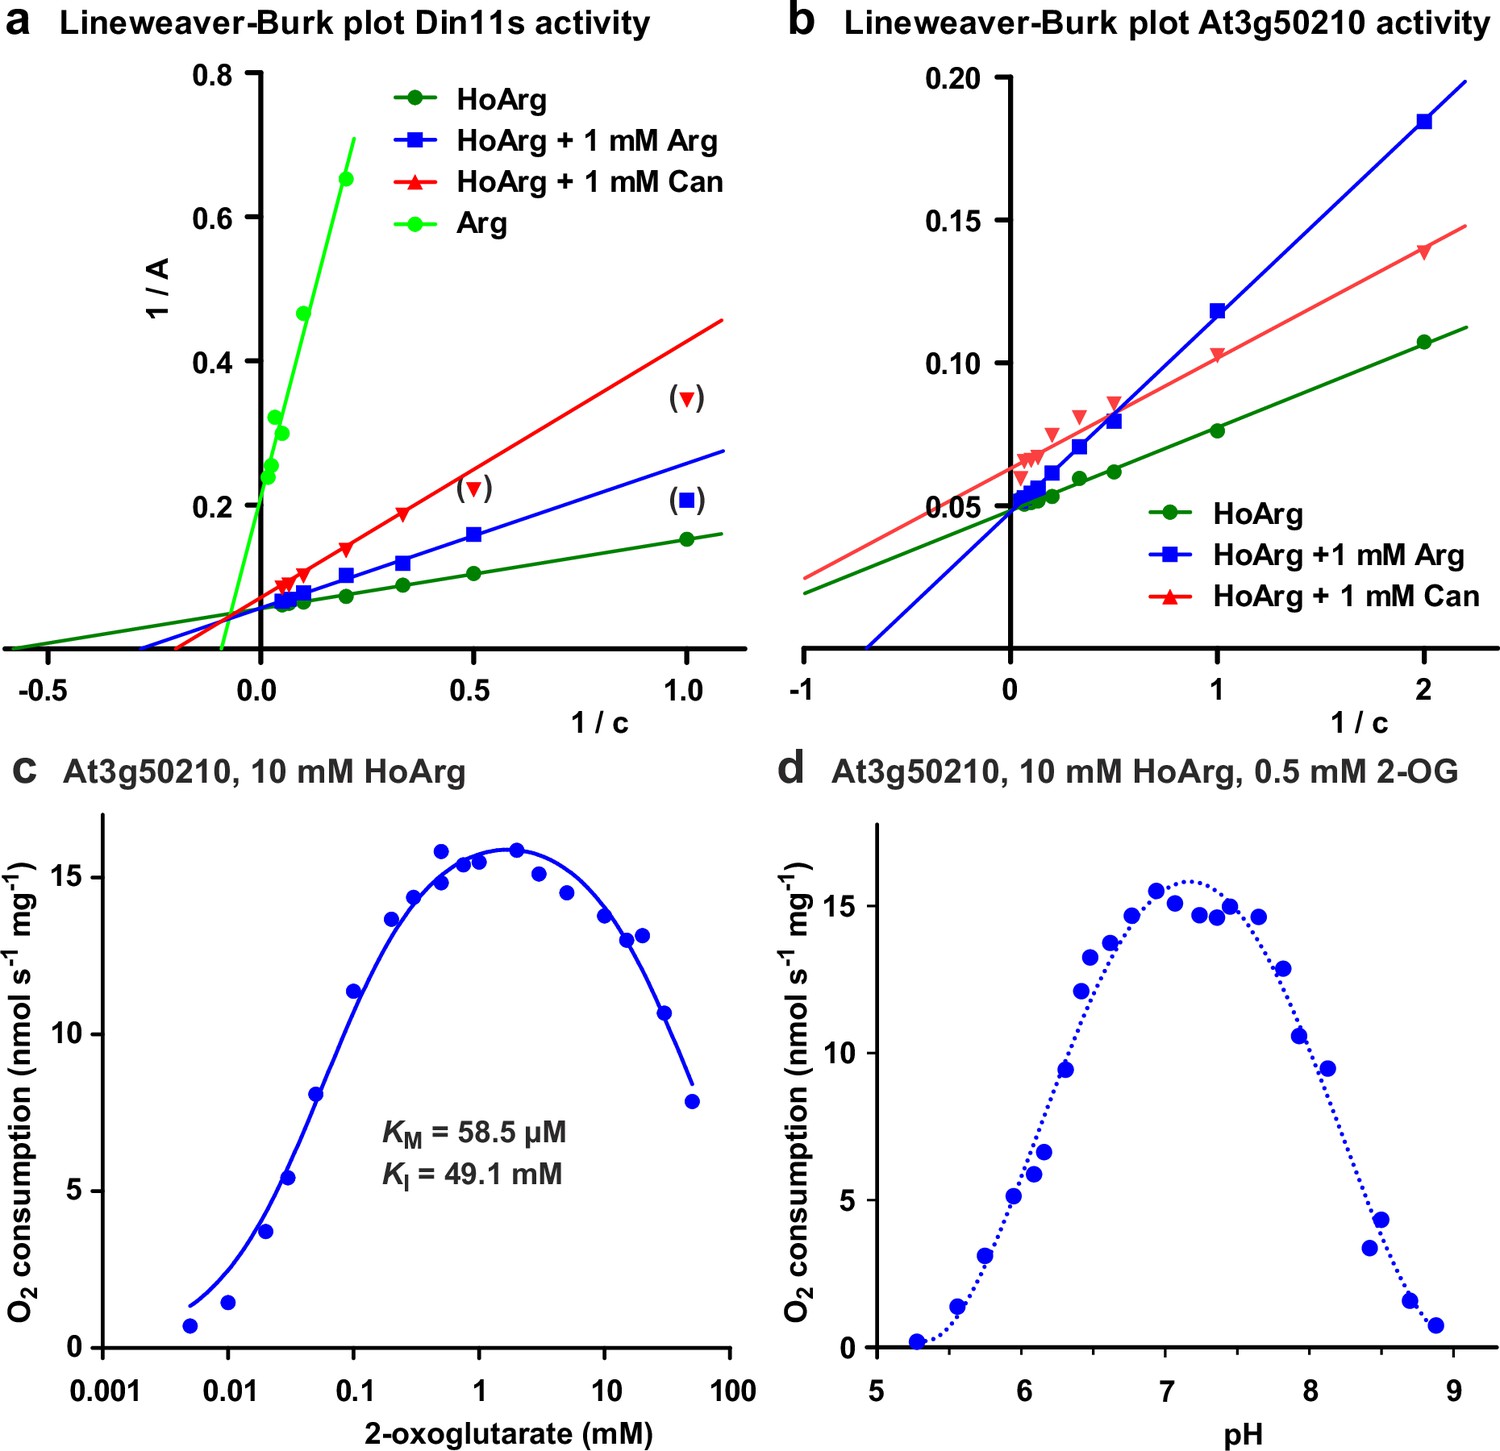
Biochemical characterization of 2-ODD-C23 isoforms.
(a) Lineweaver-Burk plot of the activity data for Din11s from Figure 3a. Values in brackets are very low activities at low concentrations of homoarginine (HoArg) in presence of 1 mM arginine (Arg) or canavanine (Can) that were excluded from the linear regression. (b), Lineweaver-Burk plot of the activity data for At3g50210 from Figure 3c. Regression lines intersecting on or very near the Y-axis indicate competitive inhibition. (c) Specific activity of At3g50210 in dependence on the concentration of the co-substrate 2-oxoglutarate was determined at 30 °C. Homoarginine concentration was fixed at 10 mM. The blue line represents the least square fit to the Michaelis-Menten equation with an additional term for substrate inhibition. (d) pH-dependence of the specific activity of At3g50210 in a mixed buffer system with MES, HEPES and CHES. Homoarginine and 2-oxoglutarate (2-OG) concentrations were fixed at 10 mM and 0.5 mM, respectively. The dashed blue line is a polynomic fit with a 4th-order polynomial. Dots represent single measurements and independent enzyme preparations gave consistent results.
Figure 4 with 1 supplement
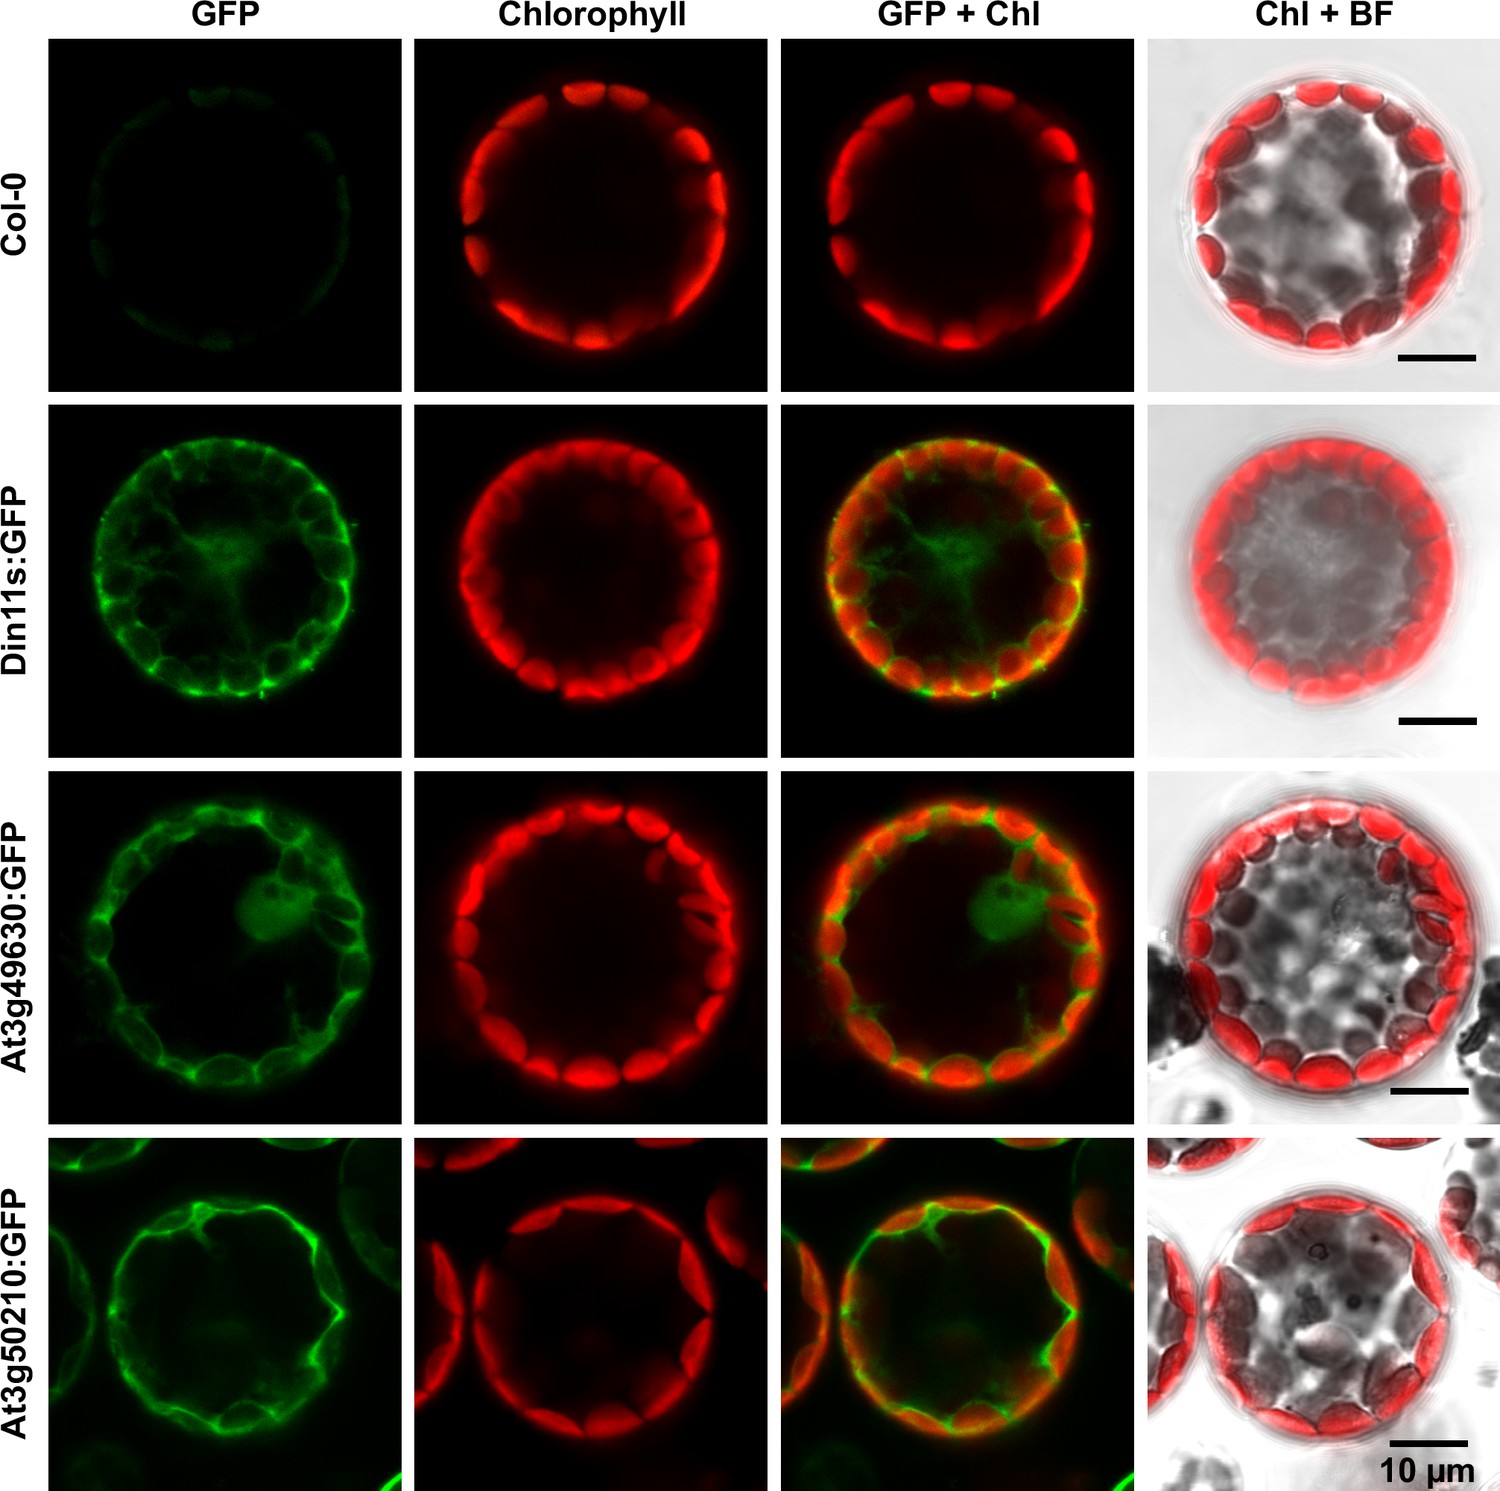
Subcellular localization of 2-ODD-C23 isoforms.
Protoplasts were isolated from plants expressing 2-ODD-C23:GFP fusions under control of the constitutive UBQ10-promoter. Spectrally resolved confocal fluorescence images were used to separate GFP fluorescence (depicted in green) from chlorophyll autofluorescence (Chl, depicted in red). BF, brightfield image.
Figure 4—figure supplement 1
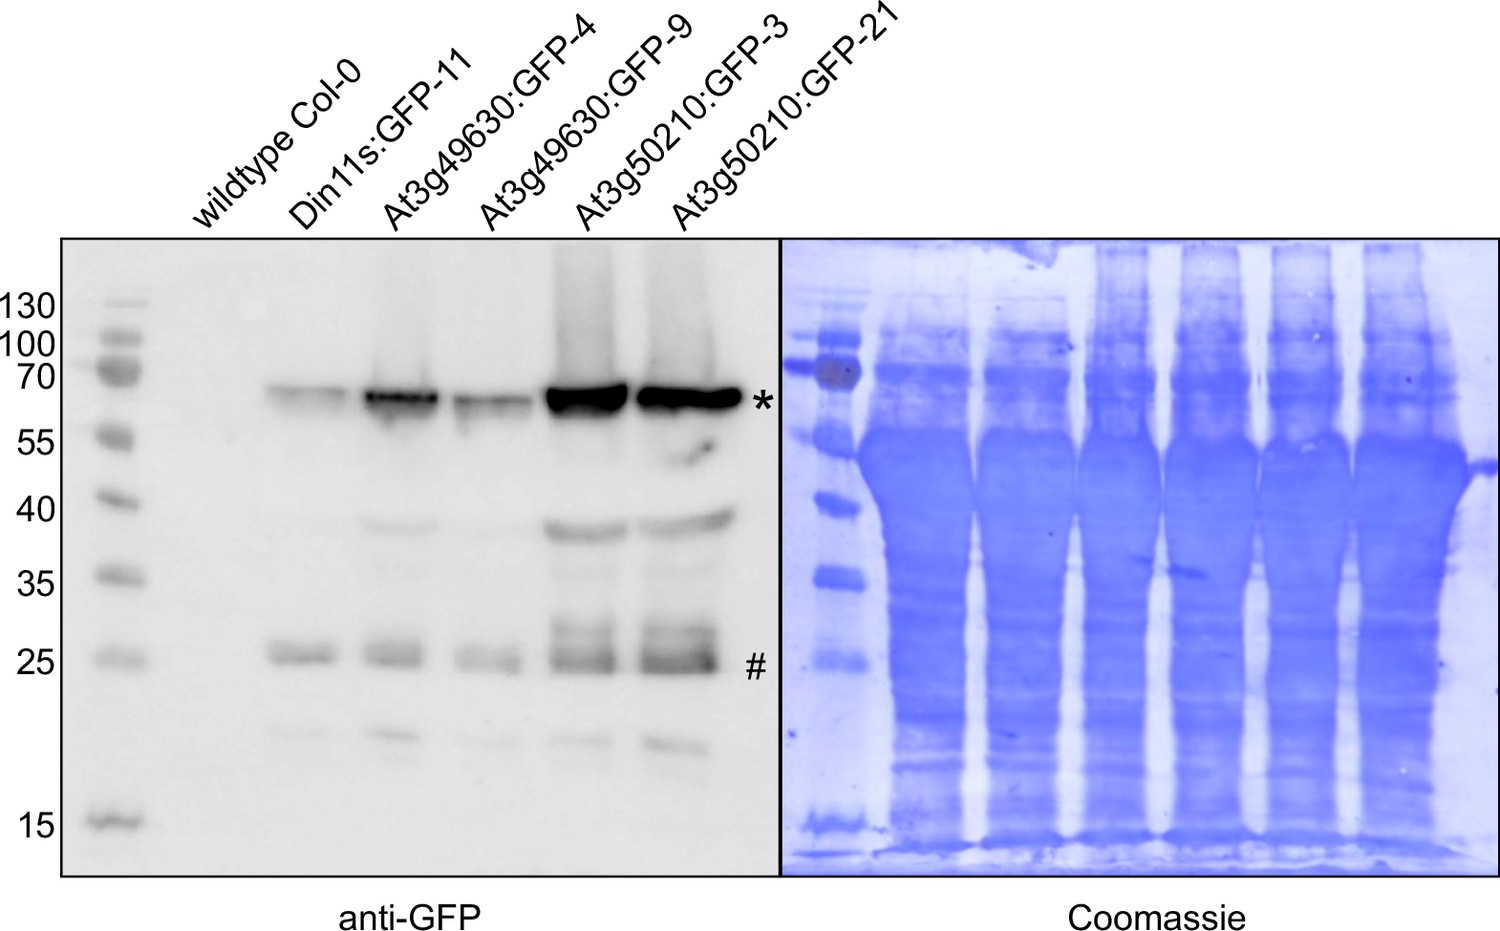
Detection of GFP fusion proteins by Western blot.
In soluble protein extracts of rosettes from all transgenic lines expressing 2-ODD-C23:GFP fusion proteins, an anti-GFP antibody detected proteins of the expected size (calculated MW: 68 kDa; *). Minor signals at 27 kDa (#) may represent free GFP generated by partial proteolysis. Staining of the membrane with coomassie brilliant blue was used as loading control.
-
Figure 4—figure supplement 1—source data 1
- https://cdn.elifesciences.org/articles/91458/elife-91458-fig4-figsupp1-data1-v1.zip
-
Figure 4—figure supplement 1—source data 2
- https://cdn.elifesciences.org/articles/91458/elife-91458-fig4-figsupp1-data2-v1.pdf
Figure 5 with 3 supplements
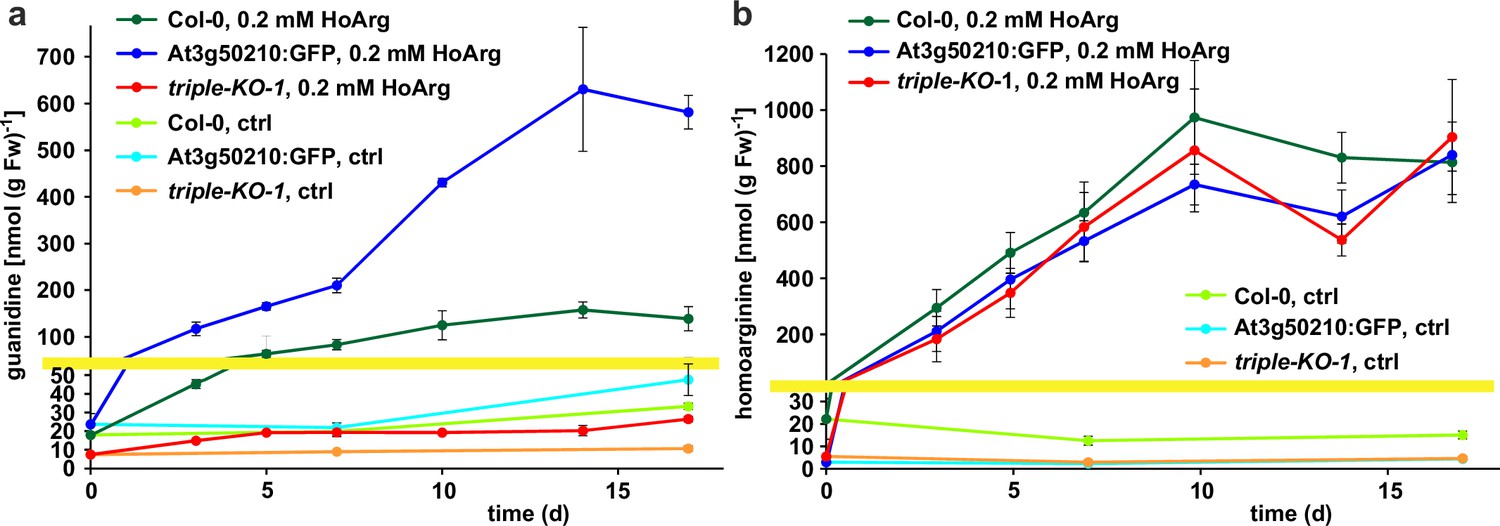
Guanidine and homoarginine contents in leaves of Arabidopsis plants.
Plants were grown for two weeks in sterile culture and transferred to fresh plates with 0.2 mM or without (ctrl) homoarginine. Guanidine (a) and homoarginine (b) were extracted from rosettes in 80% (v/v) methanol containing 13C15N-labeled guanidine as analytical standard and quantified by LC-MS. Col-0, wildtype; At3g50210:GFP, At3g50210:GFP overexpressing plants, triple-KO, 2-ODD-C23 triple mutant. The yellow line marks a change in the scale of the Y-axis. Error bars indicate SD from four plant samples. The entire experiment was repeated with consistent results. Continued experiments during the revision of this paper revealed that our LC-MS protocol did not separate homoarginine from methylarginine. Therefore, the identity of the compound with a m/z ratio of 189 detected in plants that were grown in the absence of homoarginine is at present ambiguous.
Figure 5—figure supplement 1
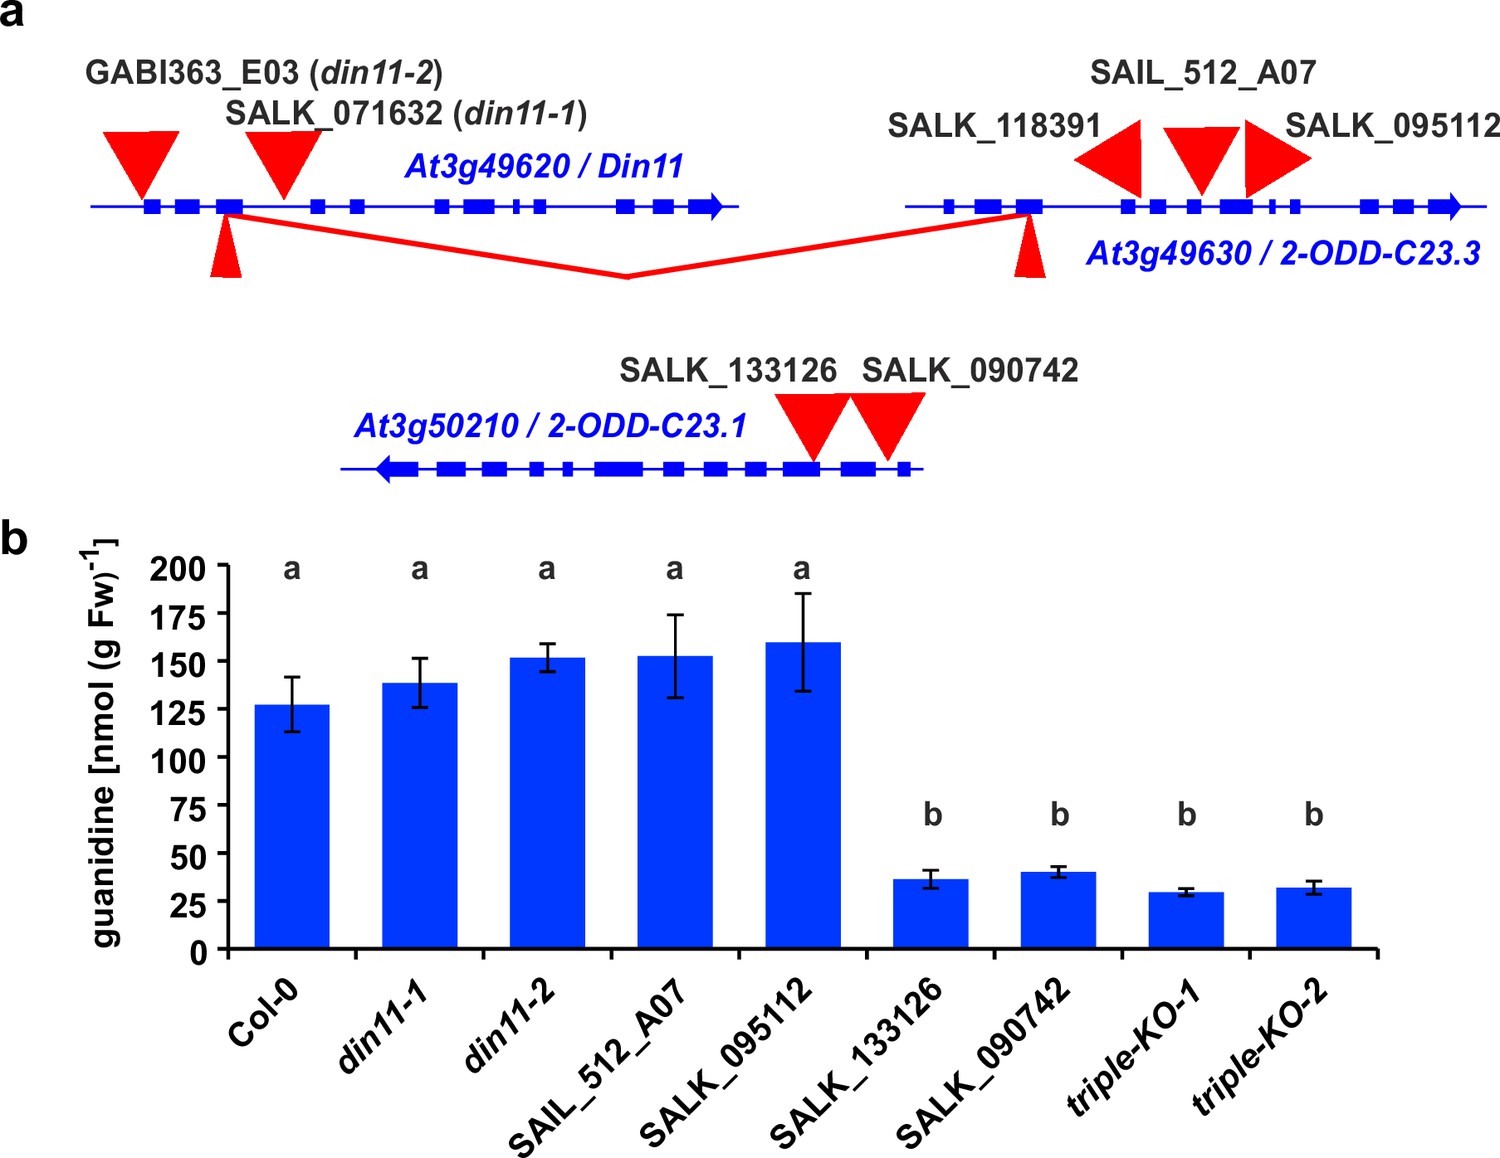
2-ODD-C23 mutants in Arabidopsis.
(a) Schematic representation of the three genes for 2-ODD-C23 isoforms in Arabidopsis. Thick blue lines represent exons, wide red triangles represent T-DNA insertions, narrow red triangles represent CRISPR/Cas9 target sites. The red lines indicate a fusion event between Din11 and At3g49630, in which the DNA fragment between the two CRISPR/CAs9 target sites was lost. (b) Guanidine content in rosettes of single and triple mutant seedlings cultivated under axenic conditions. The seedlings were cultivated for 9 days under long day conditions on half-strength MS medium supplemented with 2% sucrose. Subsequently, they were transferred for one week to plates supplemented additionally with 0.2 mM homoarginine. Columns represent the average ± SD of N=4 independent samples. Different letters above the columns indicate significant differences (p<0.05) by one-way ANOVA with Bonnferroni correction for multiple testing.
-
Figure 5—figure supplement 1—source data 1
- https://cdn.elifesciences.org/articles/91458/elife-91458-fig5-figsupp1-data1-v1.xlsx
Figure 5—figure supplement 2
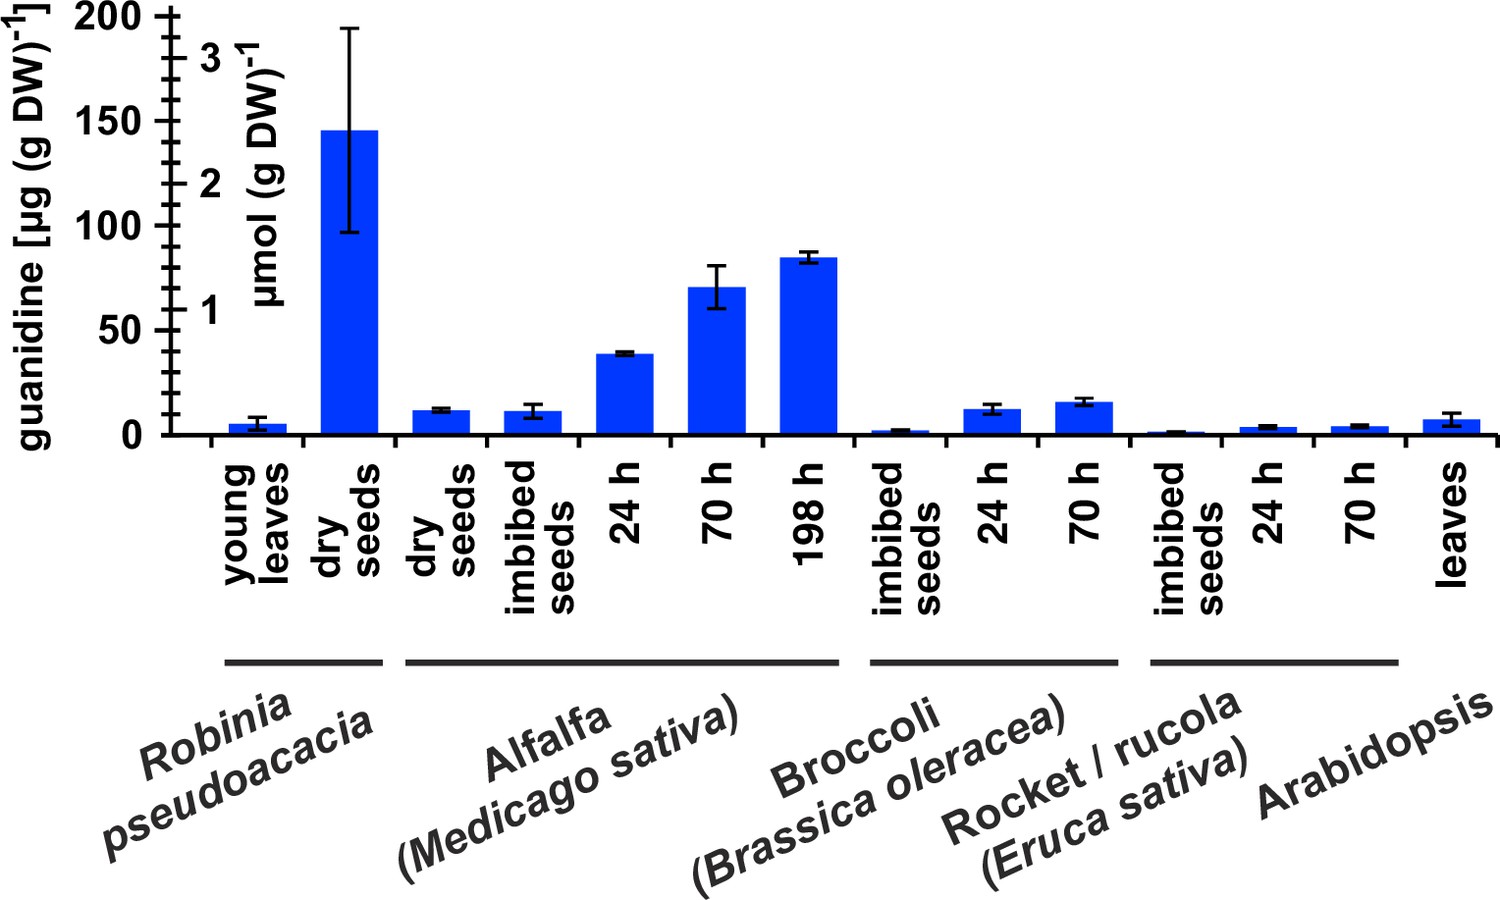
Guanidine content in various plants.
Black locust (Robinia pseudoacacia) and Arabidopsis samples were from soil-grown plants. For the other species, seeds were surface-sterilised and germinated on filter paper soaked with ddH2O for the indicated times. Guanidine was extracted in 80% (v/v) methanol with 10 µM 13C15N-labeled guanidine as analytical standard and quantified by LC-MS. Columns represent the average ± SD of N=3 independent samples.
-
Figure 5—figure supplement 2—source data 1
- https://cdn.elifesciences.org/articles/91458/elife-91458-fig5-figsupp2-data1-v1.xlsx
Figure 5—figure supplement 3
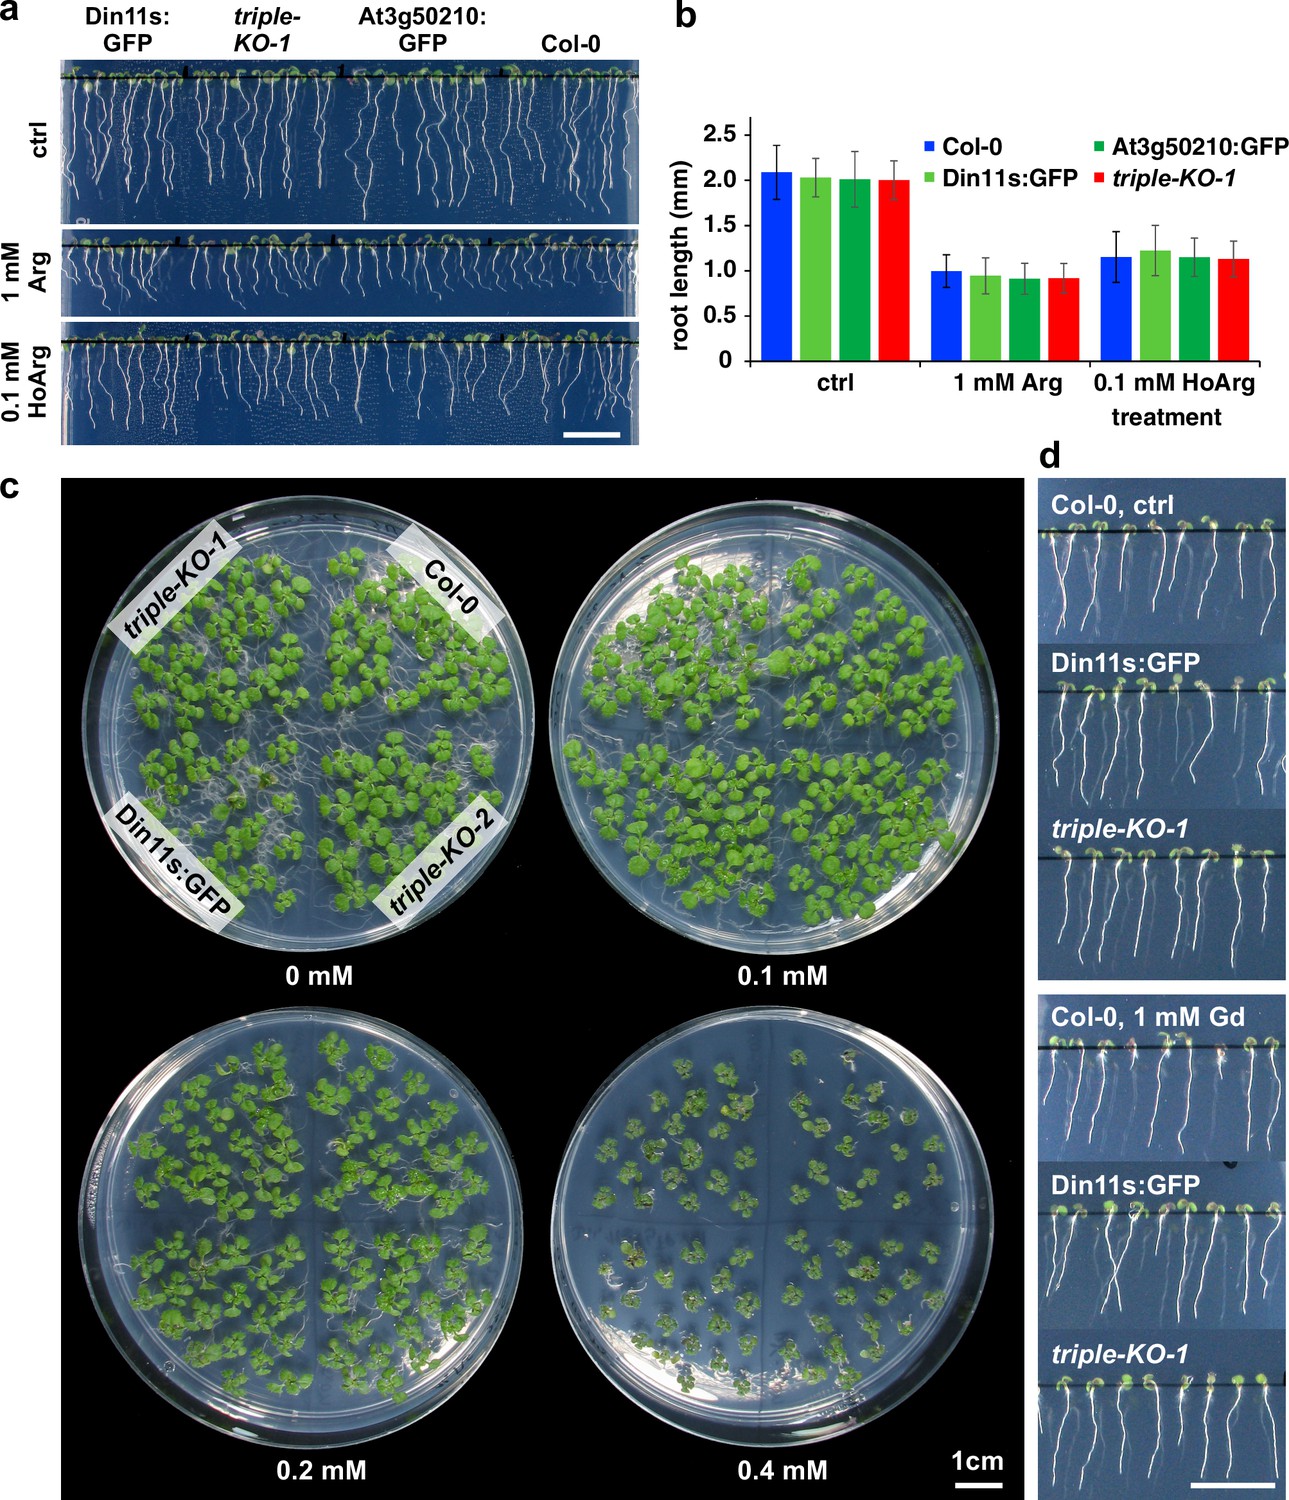
Growth inhibition by homoarginine.
(a), (b) Seedlings of WT Arabidopsis plants (Col-0) and 2-ODD-C23 overexpressors or triple mutants were grown for 6 days under long-day conditions on vertical plates containing half-strength MS medium, supplemented with 2% (w/v) sucrose and either arginine (Arg) or homoarginine (HoArg). Columns in (b) represent the average ± SD of N=40 seedlings. (c) Two-week-old seedlings grown on half-strength MS medium with 2% (w/v) sucrose and the indicated concentration of homoarginine. The positioning of the genotypes is identical on each plate. (d) Seven-day-old seedlings grown on vertical plates without or with 1 mM guanidine (Gd). Scale bars in (a), (c) and (d) are 1 cm.
-
Figure 5—figure supplement 3—source data 1
- https://cdn.elifesciences.org/articles/91458/elife-91458-fig5-figsupp3-data1-v1.xlsx
Figure 6 with 1 supplement
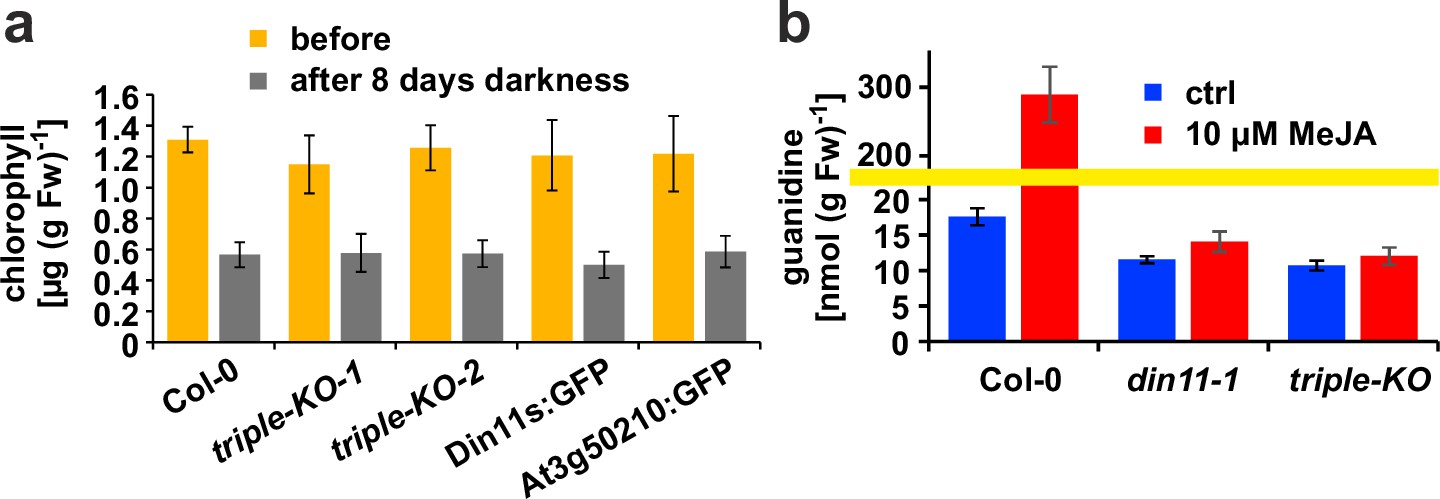
Effect of darkness and methyljasmonate (MeJA) on 2-ODD-C23 mutants.
(a) Eight-day-old seedlings grown under short-day conditions were placed for 8 days in permanent darkness. Chlorophyll was extracted before and after the dark treatment and quantified spectrometrically. Col 0, wildtype; triple-KO-1 and 2, independently generated 2-ODD-C23 triple mutants; Din11s:GFP, At3g50210:GFP, plants overexpressing 2-ODD-C23:GFP fusion proteins. Error bars indicate SD of N=8 independent plant samples. (b) Three-week-old plants were treated for one week with approximately 50 µM MeJA by applying a stock solution in 50% (v/v) ethanol to the lid of the Petri dishes. Guanidine was extracted from rosettes in 80% (v/v) methanol containing 13C15N-labeled guanidine as analytical standard and quantified by LC-MS. din11-1, single T-DNA insertion mutant of Din11. The yellow line marks a change in the scale of the Y-axis. Error bars indicate SD of four independent plant samples. The din11-2 mutant line and the independently generated second triple mutant gave consistent results.
Figure 6—figure supplement 1
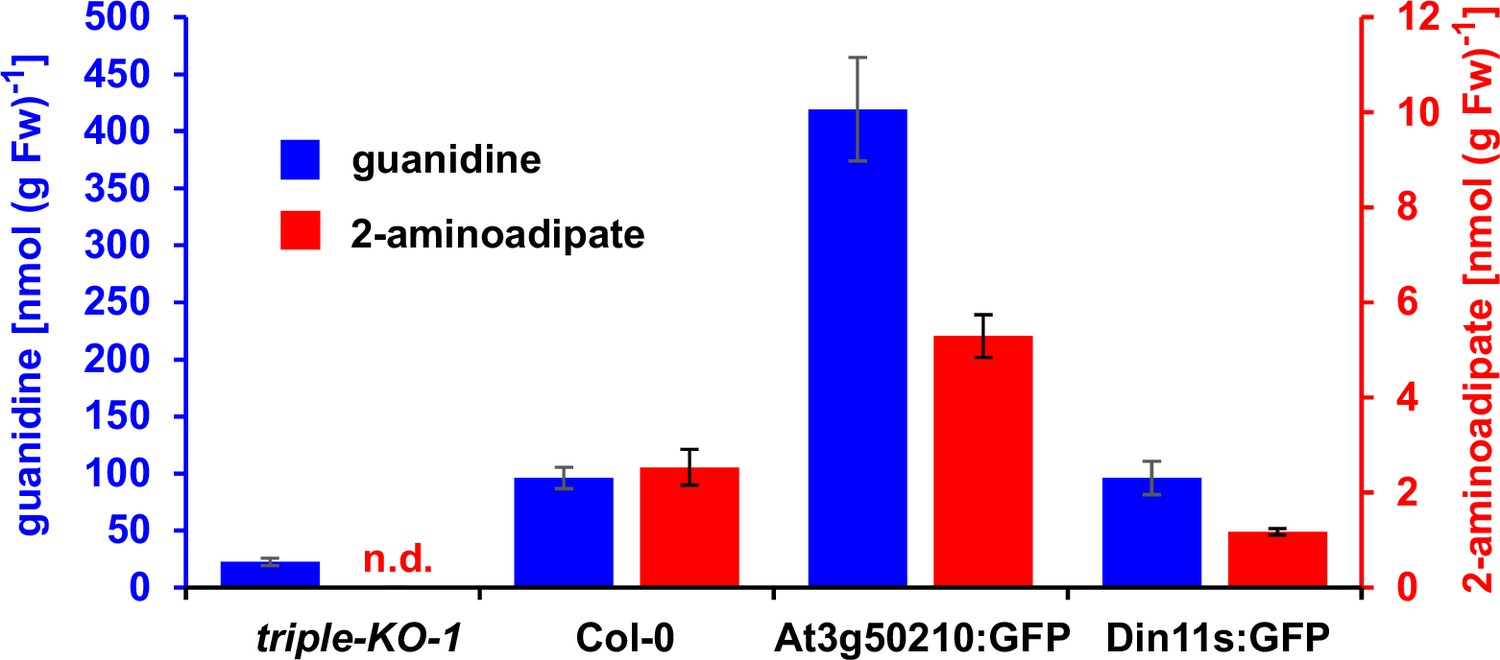
2-Aminoadipate content after homoarginine feeding.
Arabidopsis seedlings were grown for 10 days under long-day conditions on half-strength MS medium supplemented with 2% (w/v) sucrose and 5 mM MES-KOH, pH 5.8 before they were transferred for 4 days to plates additionally containing 0.2 mM homoarginine. Guanidine and 2-aminoadipate were extracted in 80% (v/v) methanol containing 10 µM 13C15N-labeled guanidine as analytical standard and quantified by LC-MS. Columns represent the average ± SD of N=4 independent samples. n.d., not detected. The experiment was repeated with consistent results.
Figure 7 with 1 supplement
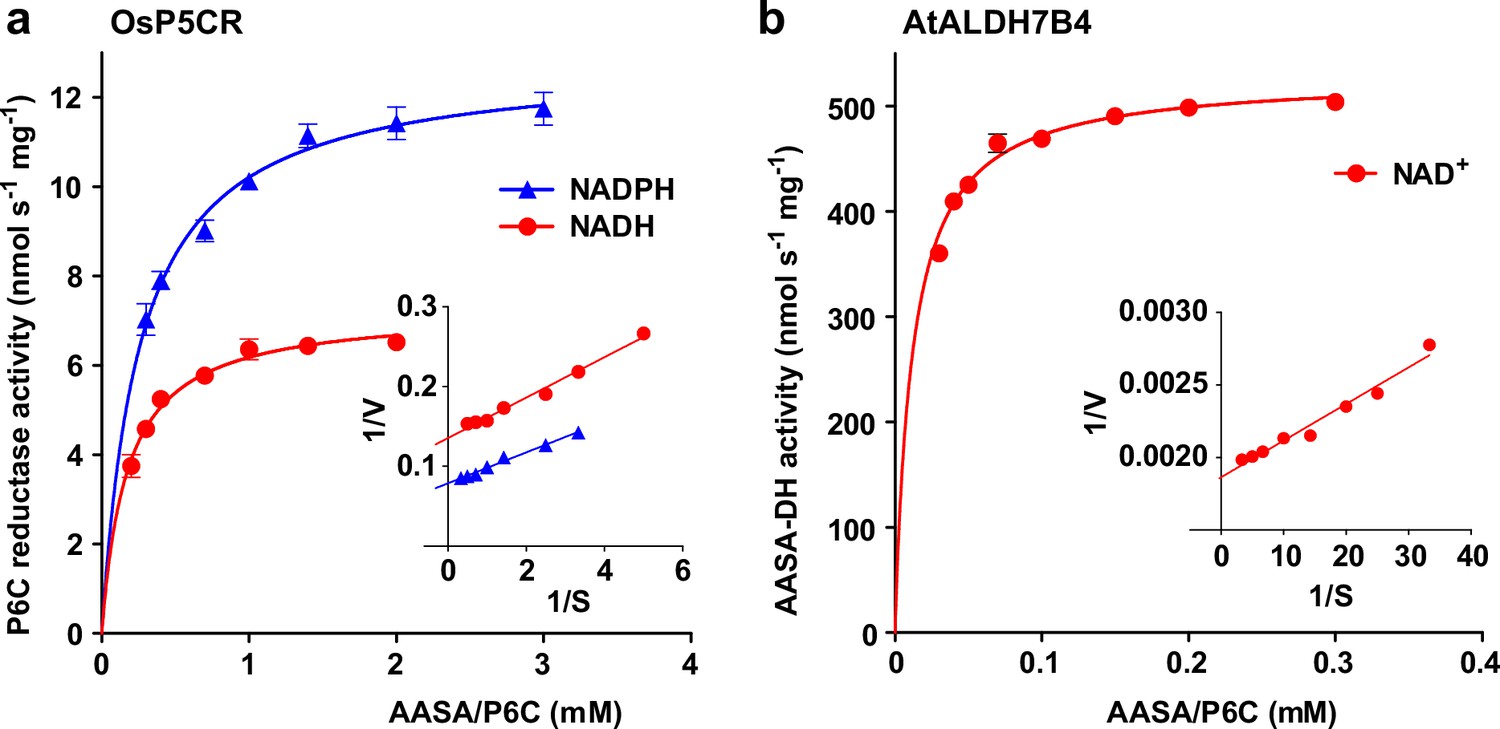
Reduction and oxidation of AASA/P6C by plant enzymes.
Recombinant purified enzymes were used to compare the reduction of P6C to pipecolate by pyrroline-5-carboxylate reductase from rice (OsP5CR; a) with the oxidation of AASA by Arabidopsis aldehyde dehydrogenase 7B4 (ALDH7B4; b) at 35 °C with a fixed cofactor concentration of 1 mM. OsP5CR used either NADH or NADPH as electron donor for the conversion of P6C to pipecolate. ALDH7B4 had a much higher specific activity and a lower KM, but efficiently catalyzed the reaction of AASA to aminoadipate only with NAD+ as electron acceptor. Data points are the average ± SD of technical triplicates. Colored lines represent the fit of the experimental data to the Michaelis-Menten equation. The insets show the Lineweaver-Burk plots of the same data. All experiments were repeated with an independent enzyme preparation and showed consistent results.
Figure 7—figure supplement 1
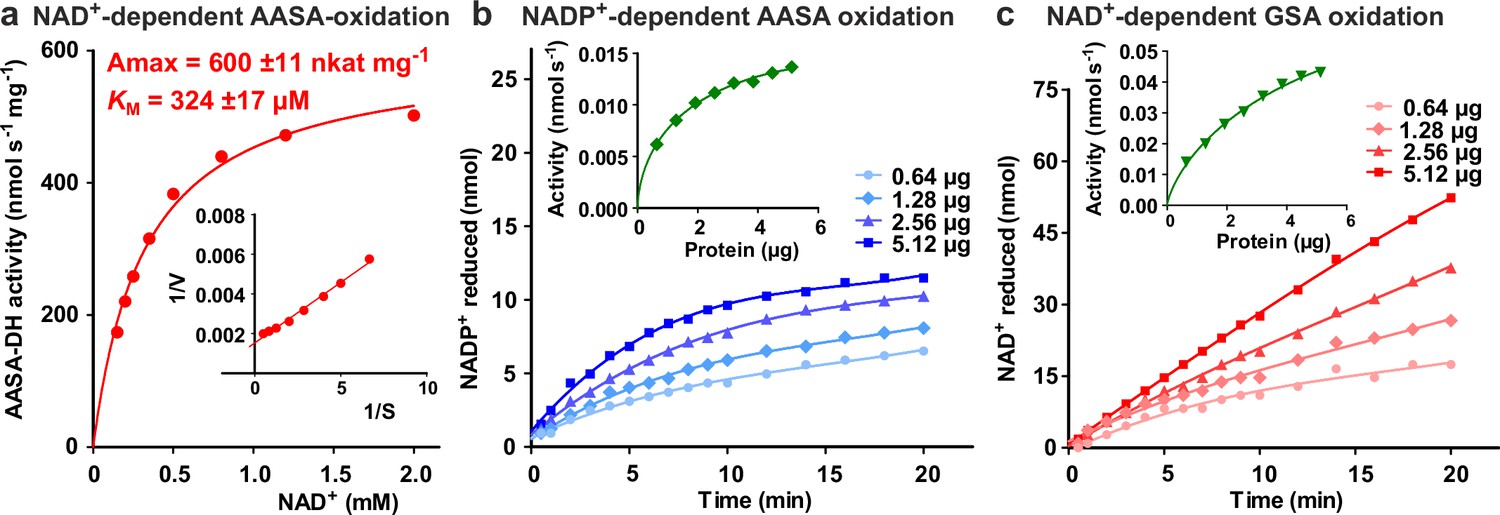
Characterization of ALDH7B4 (At1g54100).
(a) Activity of purified recombinant ALDH7B4 with different concentrations of NAD+ at 35 °C. AASA/P6C concentration was fixed at 1 mM. KM and Amax values were obtained by nonlinear regression to the Michaelis-Menten equation (red line). The inset shows the Lineweaver-Burk plot of the same data. (b) AASA/P6C-dependent reduction of NADP+ by different amounts of ALDH7B4. Concentrations of both NADP+ and AASA/P6C were 1 mM. (c) GSA/P5C-dependent reduction of NAD+ by different amounts of ALDH7B4. NAD+ concentration was 1 mM and DL-GSA/P5C concentration was 2 mM. In b and c, the insets show the initial velocity as a function of the amount of protein in the assay. Data points are the average ± SD of technical triplicates. All experiments were repeated with an independent enzyme preparation.
-
Figure 7—figure supplement 1—source data 1
- https://cdn.elifesciences.org/articles/91458/elife-91458-fig7-figsupp1-data1-v1.xlsx
Tables
Key resources table
| Reagent type (species) or resource | Designation | Source or reference | Identifiers | Additional information |
|---|---|---|---|---|
| Gene (Arabidopsis thaliana) | Din11 (At3g49620); At3g49630; At3g50210; P5CR (AT5G14800); ALDH7B4 (AT1G54100) | TAIR | dito | |
| Gene (Oryza sativa) | ODD33 (Os09g07020) | GenBank | NM_001422704 | |
| Gene (Glycine max) | LOC100789278 | GenBank | NM_001255066 | |
| Gene (Anabaena variabilis) | Ava5009 | Genbank | CP000117 | |
| Strain/background (Arabidopsis thaliana) | Col-0 wildtype | NASC | N60000 | |
| Strain/background (E. coli) | SoluBL21 | Amsbio (Genlantis) | AMS.C700200 | |
| Genetic reagent (A. thaliana T-DNA insertion lines) | see Supplementary file 2 | NASC | see Supplementary file 2 | |
| Antibody | Anti-GFP, (rat, monoclonal) | ChromoTek | 3H9, RRID: AB_10773374 | (1:1000) |
| Antibody | Anti-rat HRP (goat, polyclonal) | Roche | A9037 | (1:80,000) |
| Recombinant DNA reagent | pET24a | Novagen (Merck) | 69749 | |
| Recombinant DNA reagent | pET24-HisTEV | this study | Data Source data 2 | |
| Recombinant DNA reagent | pENTRa1 | Invitrogen (ThermoFisher) | A10462 | |
| Recombinant DNA reagent | pUBC-GFP-Dest | Grefen et al., 2010; doi:10.1111 /j.1365–313X.2010.04322.x | ||
| Recombinant DNA reagent | pHEE401E | Wang et al., 2015; doi: 10.1186/s13059-015-0715-0 | ||
| Sequence-based reagent | custom DNA oligos | Sigma-Aldrich (Merck) | see Supplementary file 3 | |
| Peptide, recombinant protein | see ‘genes‘ above | This study | see ‘Materials and methods’ | |
| Commercial assay or kit | NEBuilder HiFi | NEB | E2621L | |
| Chemical compound, drug | D,L-P5C, L-P6C | This study | see ‘Materials and methods’ | |
| Software, algorithm | Prism V.5 | GraphPad | ||
| Software, algorithm | Excel 2016 | Microsoft | ||
| Software, algorithm | ZEN | Carl Zeiss Microscopy | ||
| Software, algorithm | Fiji/ImageJ | Fiji/NIH | ||
| Software, algorithm | OxyTrace+ | Hansatech | ||
| Software, algorithm | LabSolutions LC/GC, V5.93 | Shimadzu |
Additional files
-
Supplementary file 1
Kinetic constants of Arabidopsis 2-ODD-C23 enzymes.
- https://cdn.elifesciences.org/articles/91458/elife-91458-supp1-v1.docx
-
Supplementary file 2
27Arabidopsis T-DNA insertion lines used in this study.
- https://cdn.elifesciences.org/articles/91458/elife-91458-supp2-v1.docx
-
Supplementary file 3
Sequences of primers used in this study.
Supplementary file 3 references: Alonso et al., 2003Kleinboelting et al., 2012Sessions et al., 2002
- https://cdn.elifesciences.org/articles/91458/elife-91458-supp3-v1.docx
-
MDAR checklist
- https://cdn.elifesciences.org/articles/91458/elife-91458-mdarchecklist1-v1.docx
-
Source data 1
Source data relating to Supplementary file 1.
- https://cdn.elifesciences.org/articles/91458/elife-91458-data1-v1.xlsx
-
Source data 2
Annotated sequence of modified pET24a vector.
- https://cdn.elifesciences.org/articles/91458/elife-91458-data2-v1.txt
Download links
A two-part list of links to download the article, or parts of the article, in various formats.
Downloads (link to download the article as PDF)
Open citations (links to open the citations from this article in various online reference manager services)
Cite this article (links to download the citations from this article in formats compatible with various reference manager tools)
Guanidine production by plant homoarginine-6-hydroxylases
eLife 12:RP91458.
https://doi.org/10.7554/eLife.91458.3


