The molecular basis of Abelson kinase regulation by its αI-helix
- Structural Biology and Biophysics, Biozentrum, University of Basel, Switzerland
Figures
Figure 1
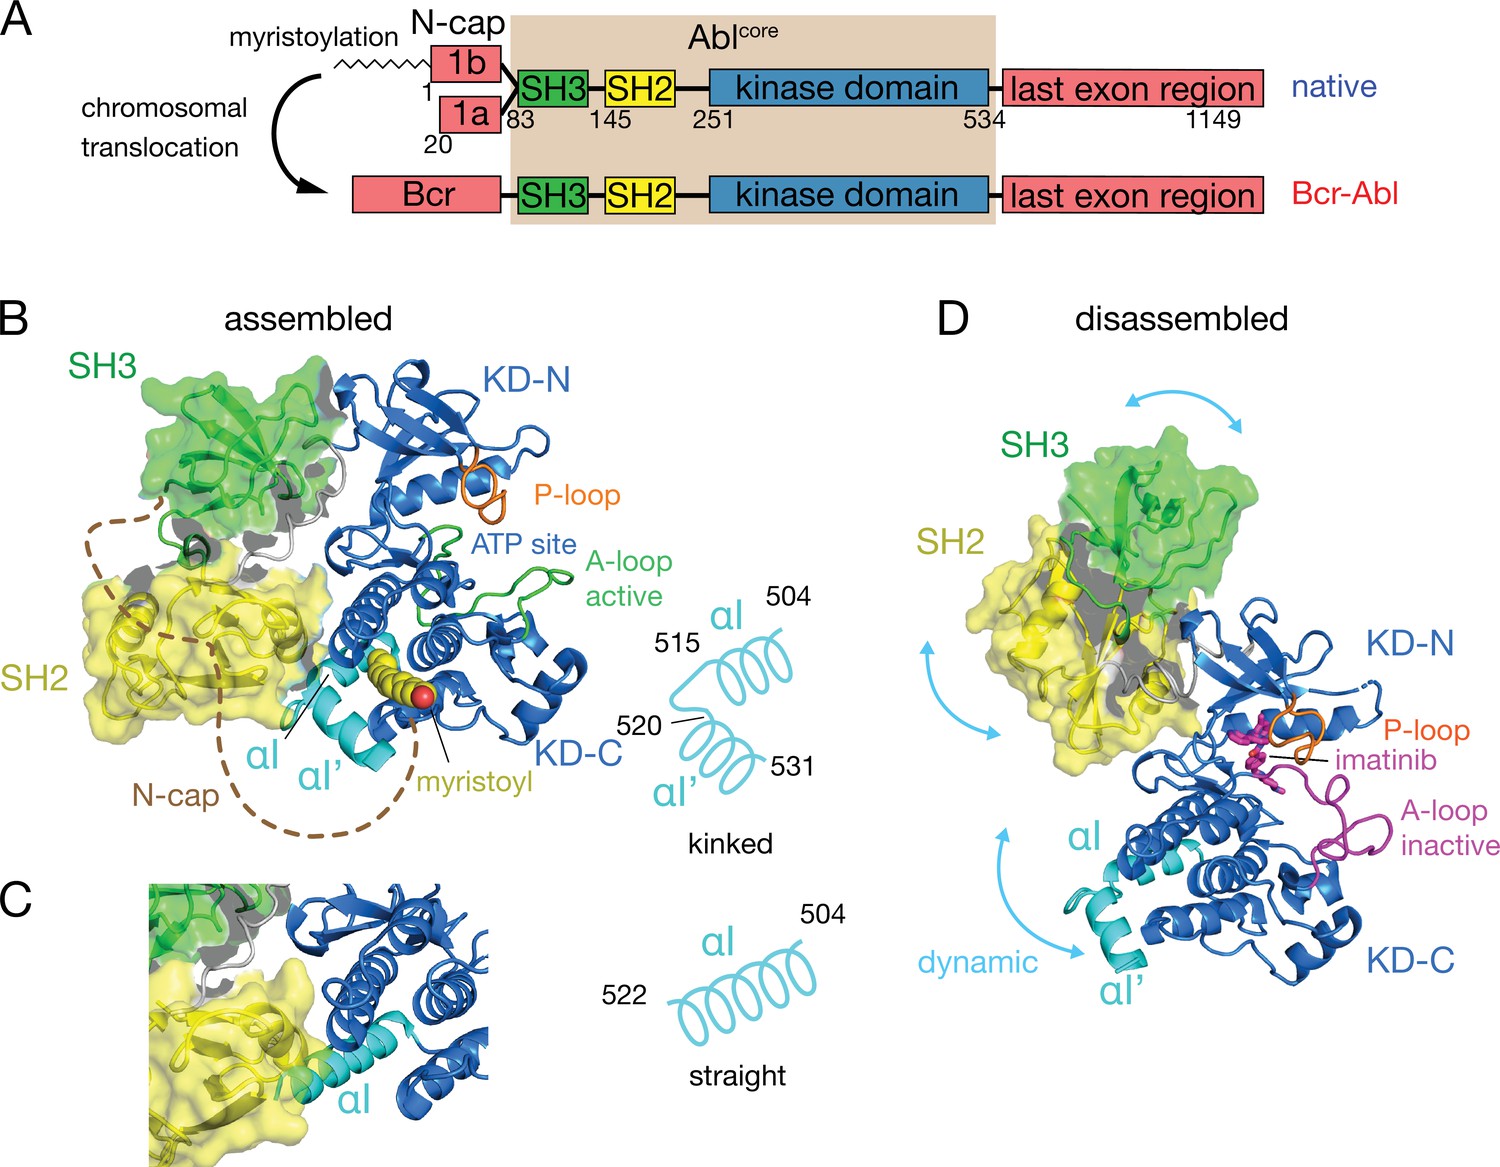
Domain organization of Abl and ligand-induced conformations of the Abl core.
(A) Domain organization of Abl isoforms 1a,b and of the chronic myeloid leukemia (CML)-inducing fusion protein Bcr-Abl. (B) Crystal structure of the N-terminally myristoylated Abl 1b isoform (residues 2–531, PDB 2FO0). SH3 domain (green), SH2 domain (yellow), KD-SH2 linker (grey), kinase domain (KD) N- and C-lobes (KD-N and KD-C, respectively, blue), activation loop (A-loop, green), and αI-helix (cyan) are shown in cartoon representation. The myristoyl is shown as yellow spheres. The N-cap (aa 2–82), which is largely not observed in the crystal, is indicated as a dashed brown line. A schematic representation on the right indicates the position of the kink in the αI-αI’ helix. (C) Alignment of the crystal structure of a KD-only construct with unliganded myristoyl pocket (blue, PDB 1M52) with the assembled Abl core structure (PDB 2FO0). The SH3 and SH2 domains of the latter are displayed as in panel B. (D) Model of a single conformation of the dynamical imatinib-bound, disassembled Abl core as derived by NMR and SAXS (Skora et al., 2013). The coloring follows panel B with the exception of the activation loop (magenta). Imatinib is shown as magenta sticks. Blue arrows indicate relative motions of the SH3, SH2, and KD domains.
Figure 2
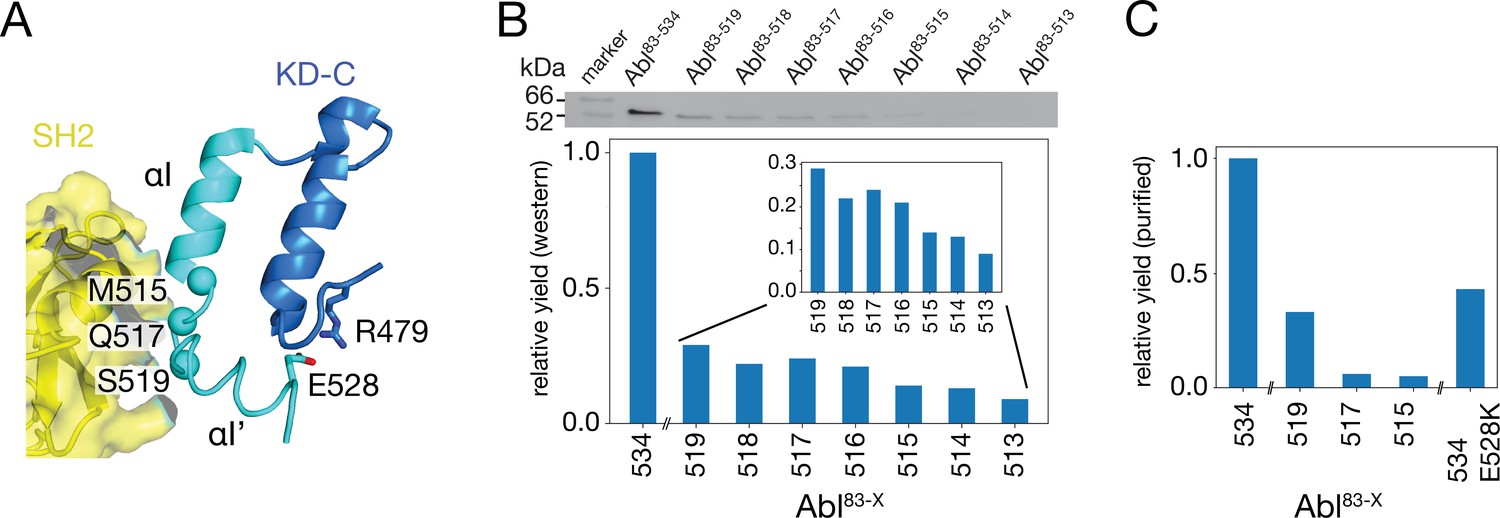
Production of C-terminally truncated Abl regulatory core constructs.
(A) Detailed view of the interaction site between the SH2 domain (yellow) and the C-terminus of the Abl KD with its αH- (dark blue) and αI- (cyan) helices from the crystal structure of the assembled Abl core (PDB 2FO0). The Cα-atoms of M515, Q517, and S519 are shown as cyan spheres (B) Top: western blot of E. coli-expressed, soluble truncated Abl constructs in the supernatant after cell lysis. Bottom: expression yields of the corresponding Abl constructs as quantified from the gel bands. The numbers on the horizontal axis denote the last amino acid of the respective construct Abl83-X. (C) Relative yields of the purified truncated Abl constructs and Abl83-534,E528K as quantified by OD280.
-
Figure 2—source data 1
Uncropped original image file of western blot in Figure 2B.
- https://cdn.elifesciences.org/articles/92324/elife-92324-fig2-data1-v1.zip
-
Figure 2—source data 2
Uncropped western blot of Figure 2B with annotation of relevant bands.
- https://cdn.elifesciences.org/articles/92324/elife-92324-fig2-data2-v1.zip
Figure 3
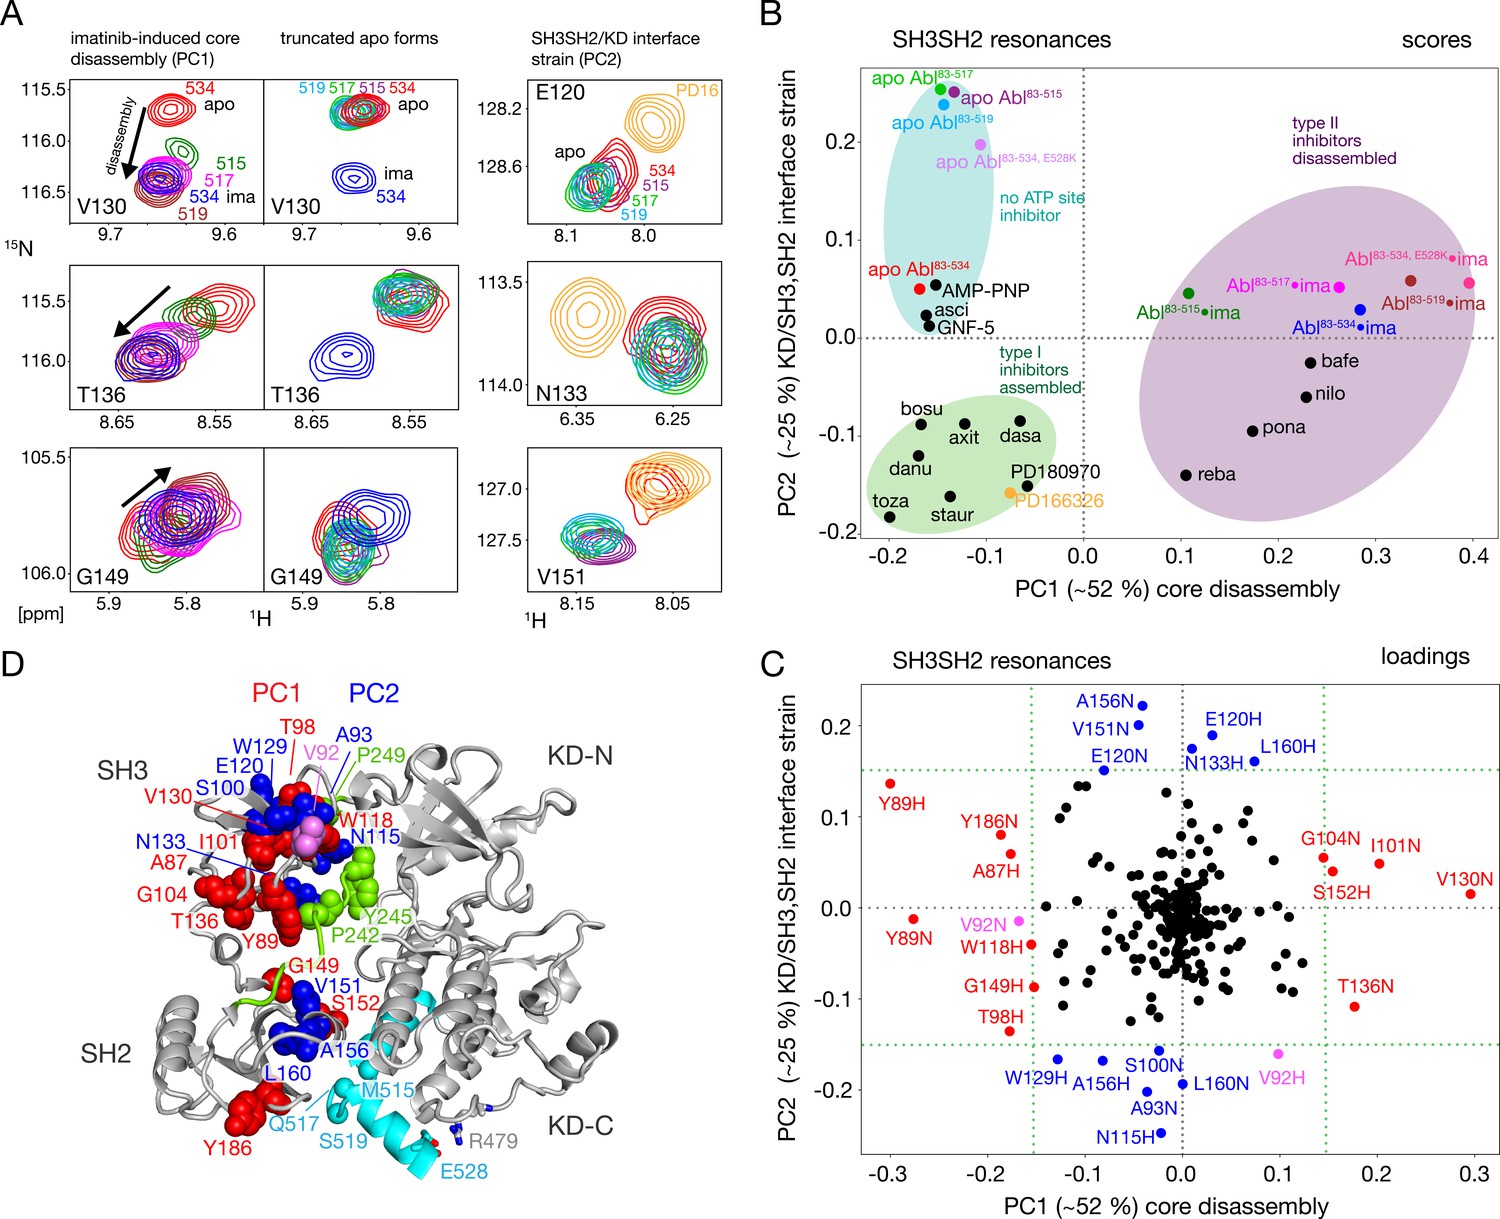
NMR evidence for reduced imatinib-induced core disassembly in truncated Abl constructs.
(A) Selected 1H-15N TROSY resonances that report on the imatinib-induced disassembly (left and middle panels) and the SH3SH2/KD interface (right panel). The label indicates the last amino acid of the respective Abl83-X construct. Abbreviations: ima:imatinib, PD16:PD166326.(B) Scores plot of the PCA of the SH3 and SH2 domain chemical shifts of various Abl core complexes and apo forms. Abbreviations: asci:asciminib, bosu:bosutinib, axi:axitinib, dasa:dasatinib, danu:danusertib, toza:tozasertib, staur:staurosporine, reba:rebastinib, pona:ponatinib, nilo:nilotinib, bafe:bafetinib. (C) Loadings plot of the PCA shown in panel B indicating contributions of individual 1HN and 15N chemical shifts to the first two PCs. Resonances with absolute PC1 or PC2 loadings larger than 0.15 are highlighted in red and blue, respectively. V92 has large loadings for both PCs and is shown in pink. (D) Residues with large PC1 or PC2 loadings according to panel C indicated as spheres within the assembled Abl core structure (PDB 2FO0). The color coding follows panel C.
Figure 4 with 1 supplement
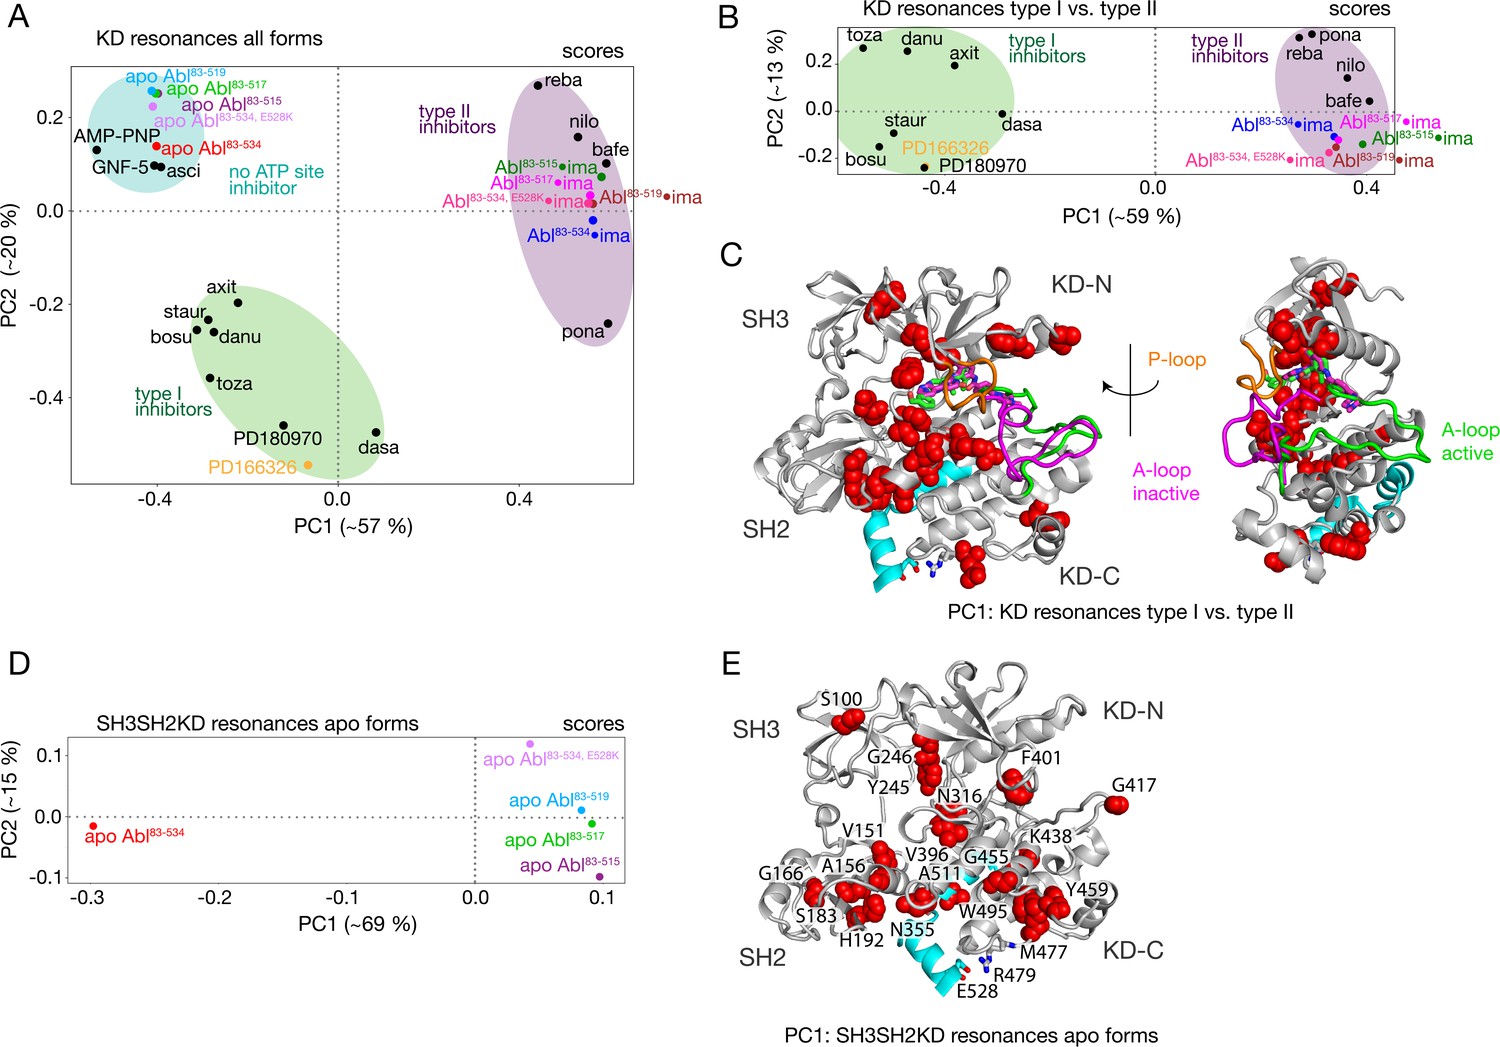
PCAs of resonances comprising the KD or entire Abl core.
(A) PCA scores of the KD resonances of all complexes shown in Figure 3B. (B) PCA scores of the KD resonances of only type I and type II inhibitor complexes. The respective loadings are shown in Figure 4—figure supplement 1. (C) Residues with absolute PC1 loadings larger than 0.15 for the analysis in panel B are shown as red spheres in the assembled core structure (PDB 2FO0). The P-loop is shown in orange and the A-loop in its active (green, PDB 2FO0) as well as inactive (magenta, PDB 2HYY Cowan-Jacob et al., 2007) conformation. (D) PCA scores of the resonances of the entire Abl core for the apo forms of all αI-helix variants. The respective loadings are shown in Figure 4—figure supplement 1. (E) Residues with absolute PC1 loadings larger than 0.1 of the analysis in panel D are shown as red spheres in the assembled core structure (PDB 2FO0).
Figure 4—figure supplement 1
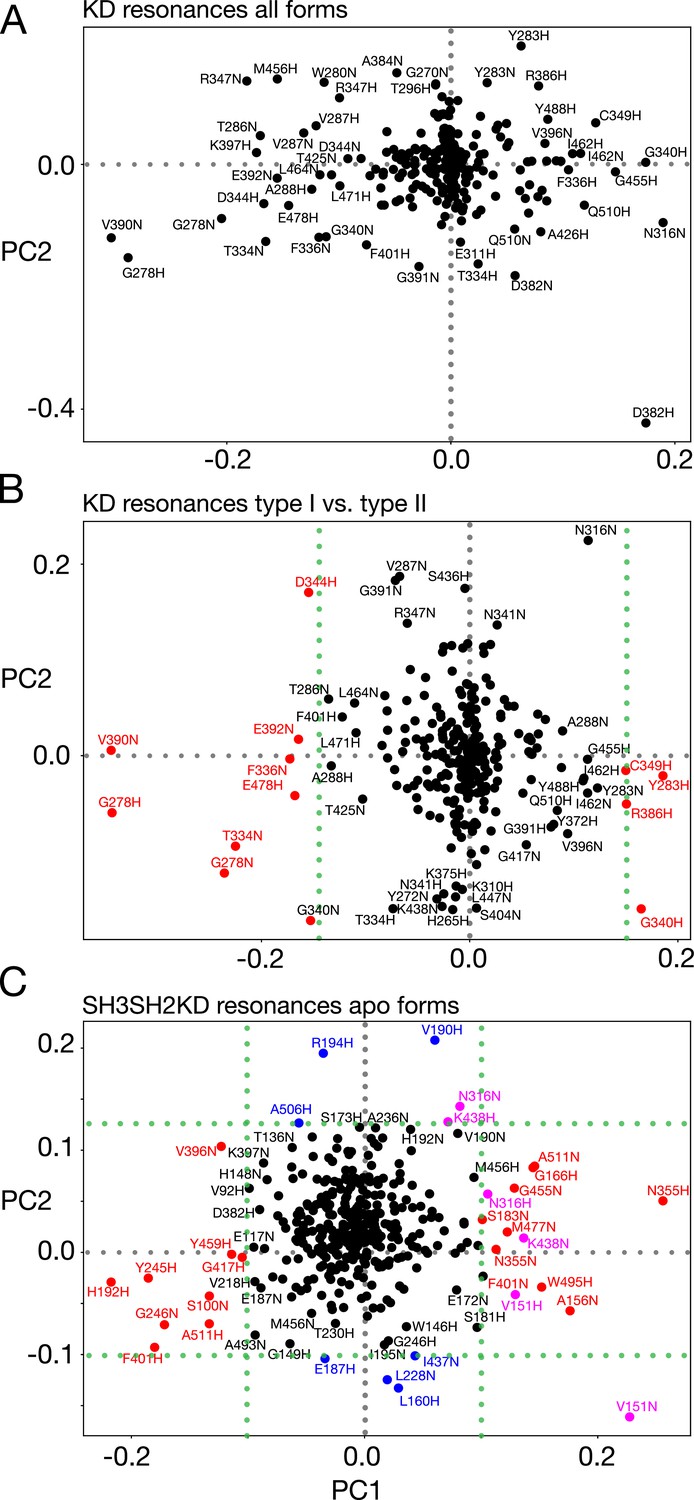
PCA loadings showing the contributions of the 1H and 15N chemical shifts of individual residues to PC1 and PC2.
(A) PCA of all KD chemical shifts of all investigated complexes corresponding to Figure 4A. (B) PCA of KD chemical shifts for type I and type II inhibitor complexes (Figure 4B and C). Residues with absolute PC1 values larger than 0.15 are indicated in red. (C) PCA of all SH3SH2KD shifts of all apo forms (Figure 4D and E). Residues with sizeable absolute PC1 values larger than 0.1 or sizeable PC2 (< -0.1 or > 0.125) are indicated in red and blue, respectively. V151, N316, and K438 have both sizeable PC1 and PC2 and is shown in magenta.
Figure 5
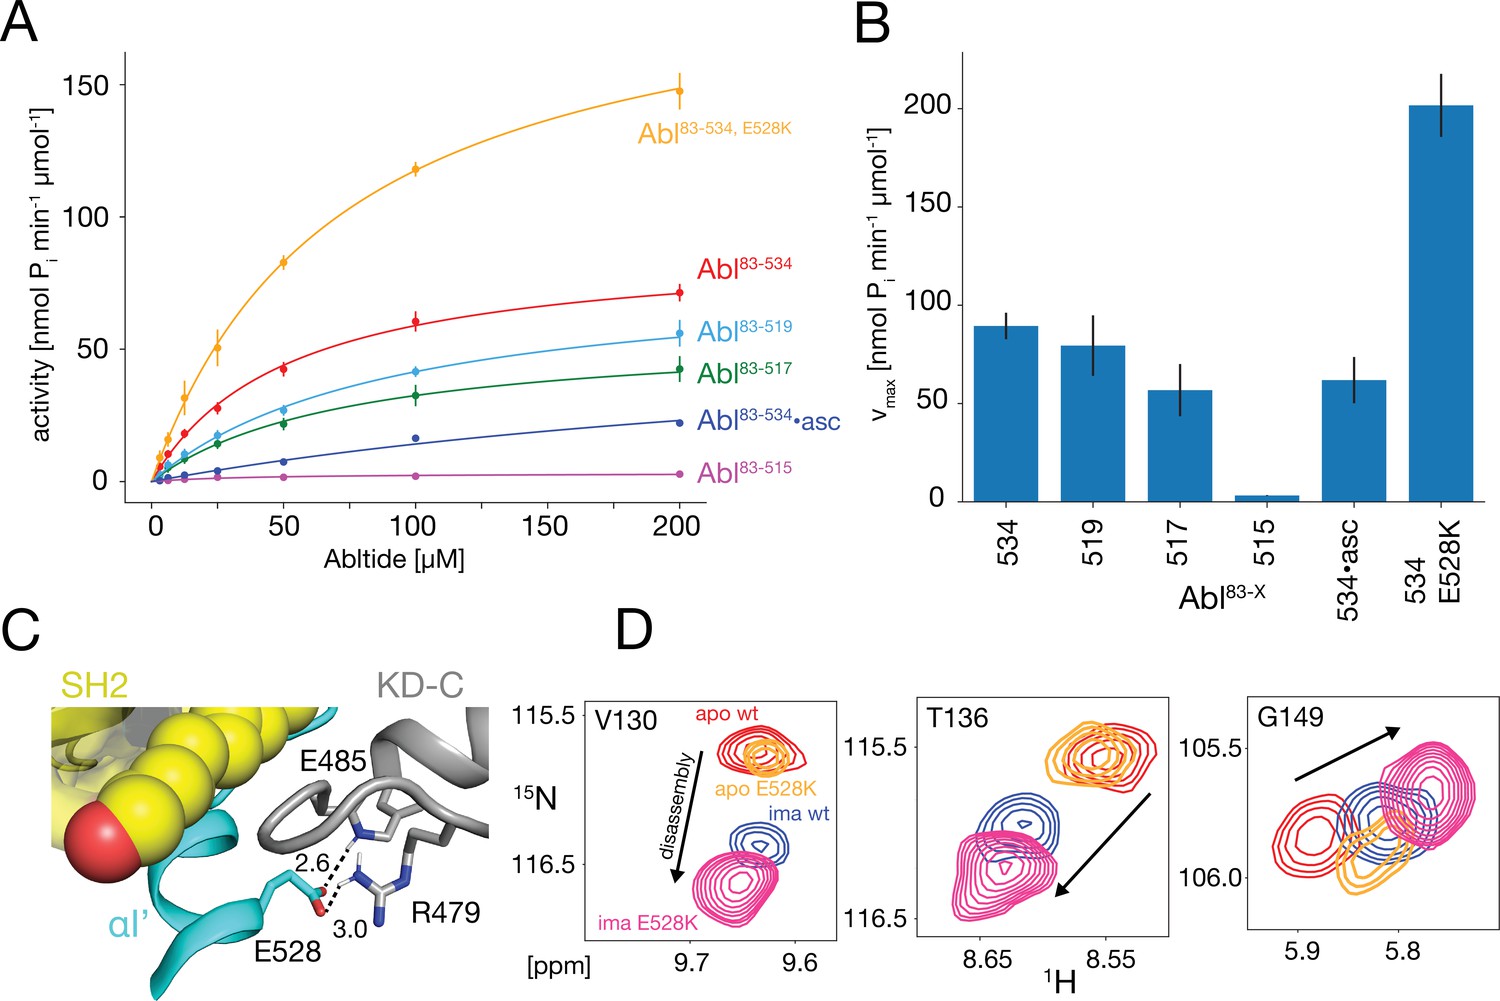
In vitro kinase activity assays and effect of the E528K mutation.
(A) Specific kinase activity of Abl83-534, E528K (orange), Abl83-534 (red), Abl83-519 (light blue), Abl83-517 (green), Abl83-515 (magenta), and Abl83-534•asciminib (asc, blue). Sample sizes and statistical information are given in Table 1. (B) Bar plot of fitted Michaelis-Menten vmax values derived from the kinase assays in panel A. Numerical values are given in Table 1. (C) Detailed view of the E528-R479 salt bridge in the structure of the assembled Abl core (PDB 2FO0). Distances between the E528 carboxylate oxygens and the guanidinium sidechain hydrogen of R479 as well as the backbone amide hydrogen of E485 are displayed as dashed lines and indicated in Angstrom. (D) Superpositions of the 1H-15N TROSY resonances of V130, T136, and G149 for apo Abl83-534,wt (red), apo Abl83-534,E528K (orange), Abl83-534,wt•imatinib (blue), and Abl83-534,E528K•imatinib (magenta) showing the increased imatinib-induced core disassembly of the Abl83-534,E528K mutant.
Figure 6
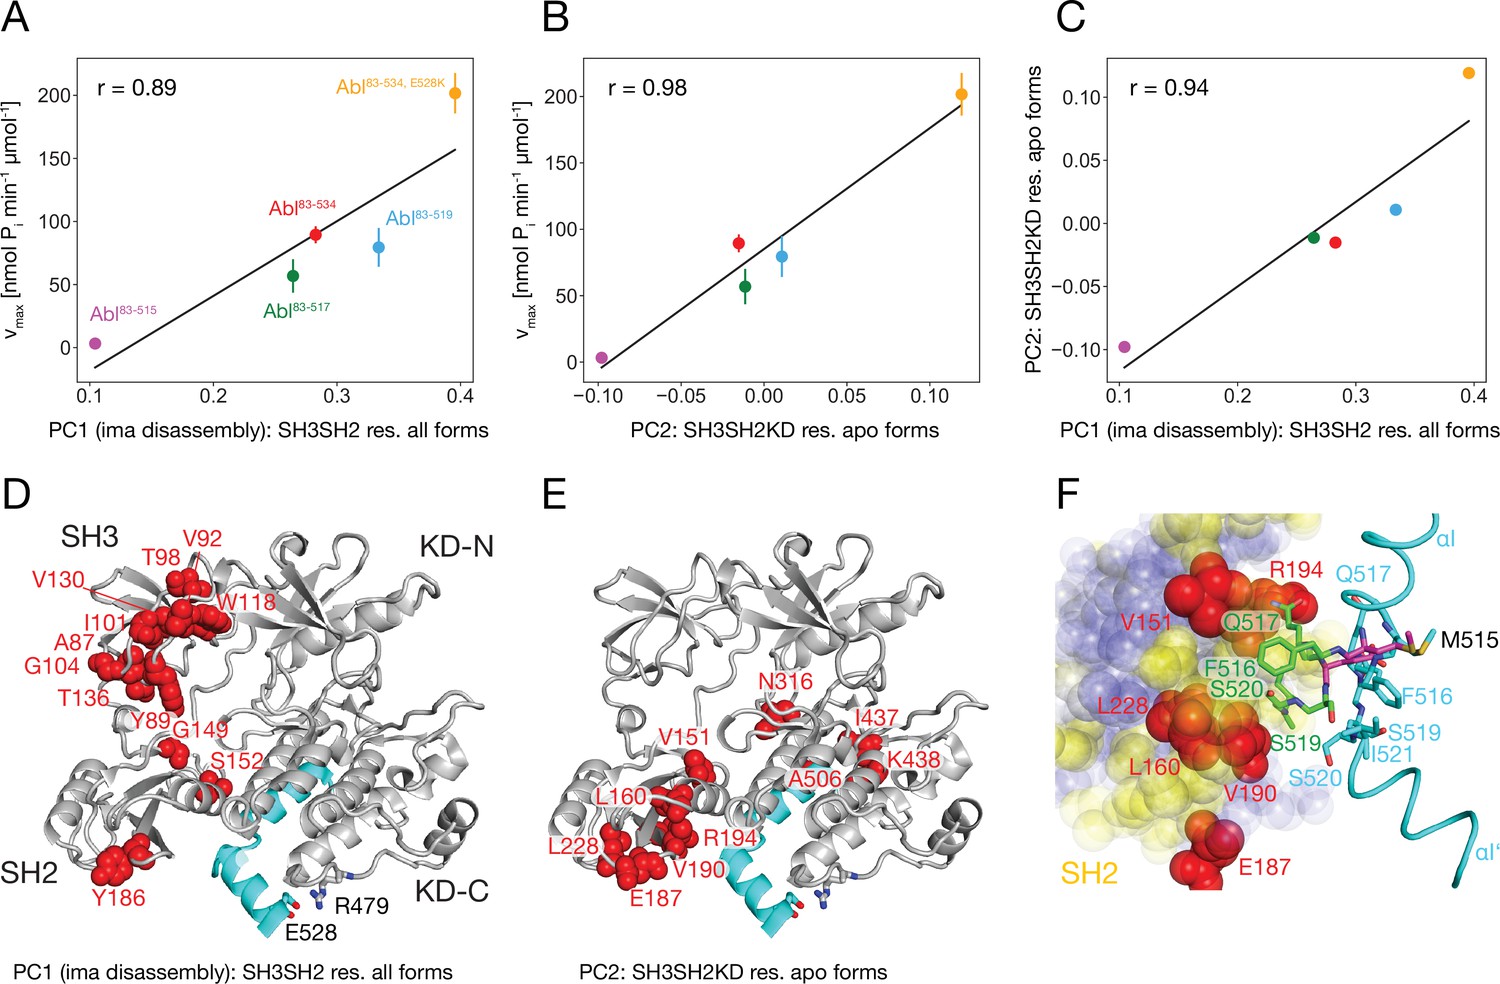
Correlation between Abl kinase activity, imatinib-induced Abl core disassembly, and αI-helix mutations.
(A) Correlation between the PC1 scores of the SH3SH2 resonances (PCA in Figure 3B) of all imatinib complexes and the respective kinase activity (Figure 5B). (B) Correlation between the PC2 scores of the SH3SH2KD resonances of all apo forms (PCA in Figure 4D) and the respective kinase activity (Figure 5B). The color code for the Abl constructs follows panel A. (C) Correlation between the PC1 scores of the SH3SH2 resonances of all imatinib complexes (Figure 3B) and the PC2 scores of the SH3SH2KD resonances of all apo forms (Figure 4D). The color code for the Abl constructs follows panel A. (D) Residues with absolute PC1 loadings larger than 0.15 from the PCA of the SH3SH2 resonances of all imatinib complexes (Figure 3C) indicated as red spheres within the structure of the assembled Abl core (PDB 2FO0). (E) Residues with absolute PC2 loadings larger than 0.1 from the PCA of the SH3SH2KD resonances of all apo forms (Figure 4D, Figure 4—figure supplement 1) indicated as red spheres within the structure of the assembled Abl core. (F) Interface between the αI-helix and the SH2 domain. The bent αI-helix of the assembled core structure is shown in cyan. The straight αI-helix of the isolated Abl kinase domain (PDB 1M52) is shown in magenta stick representation, while residues that clash with the SH2 domain of the assembled Abl core being shown in green stick representation. SH2 residues are displayed as colored spheres. Red: residues with absolute PC2 loadings >0.1 as in panel E, blue: residues with absolute PC2 loadings smaller than 0.1, yellow: residues with unresolved resonances in NMR spectrum.
Figure 7
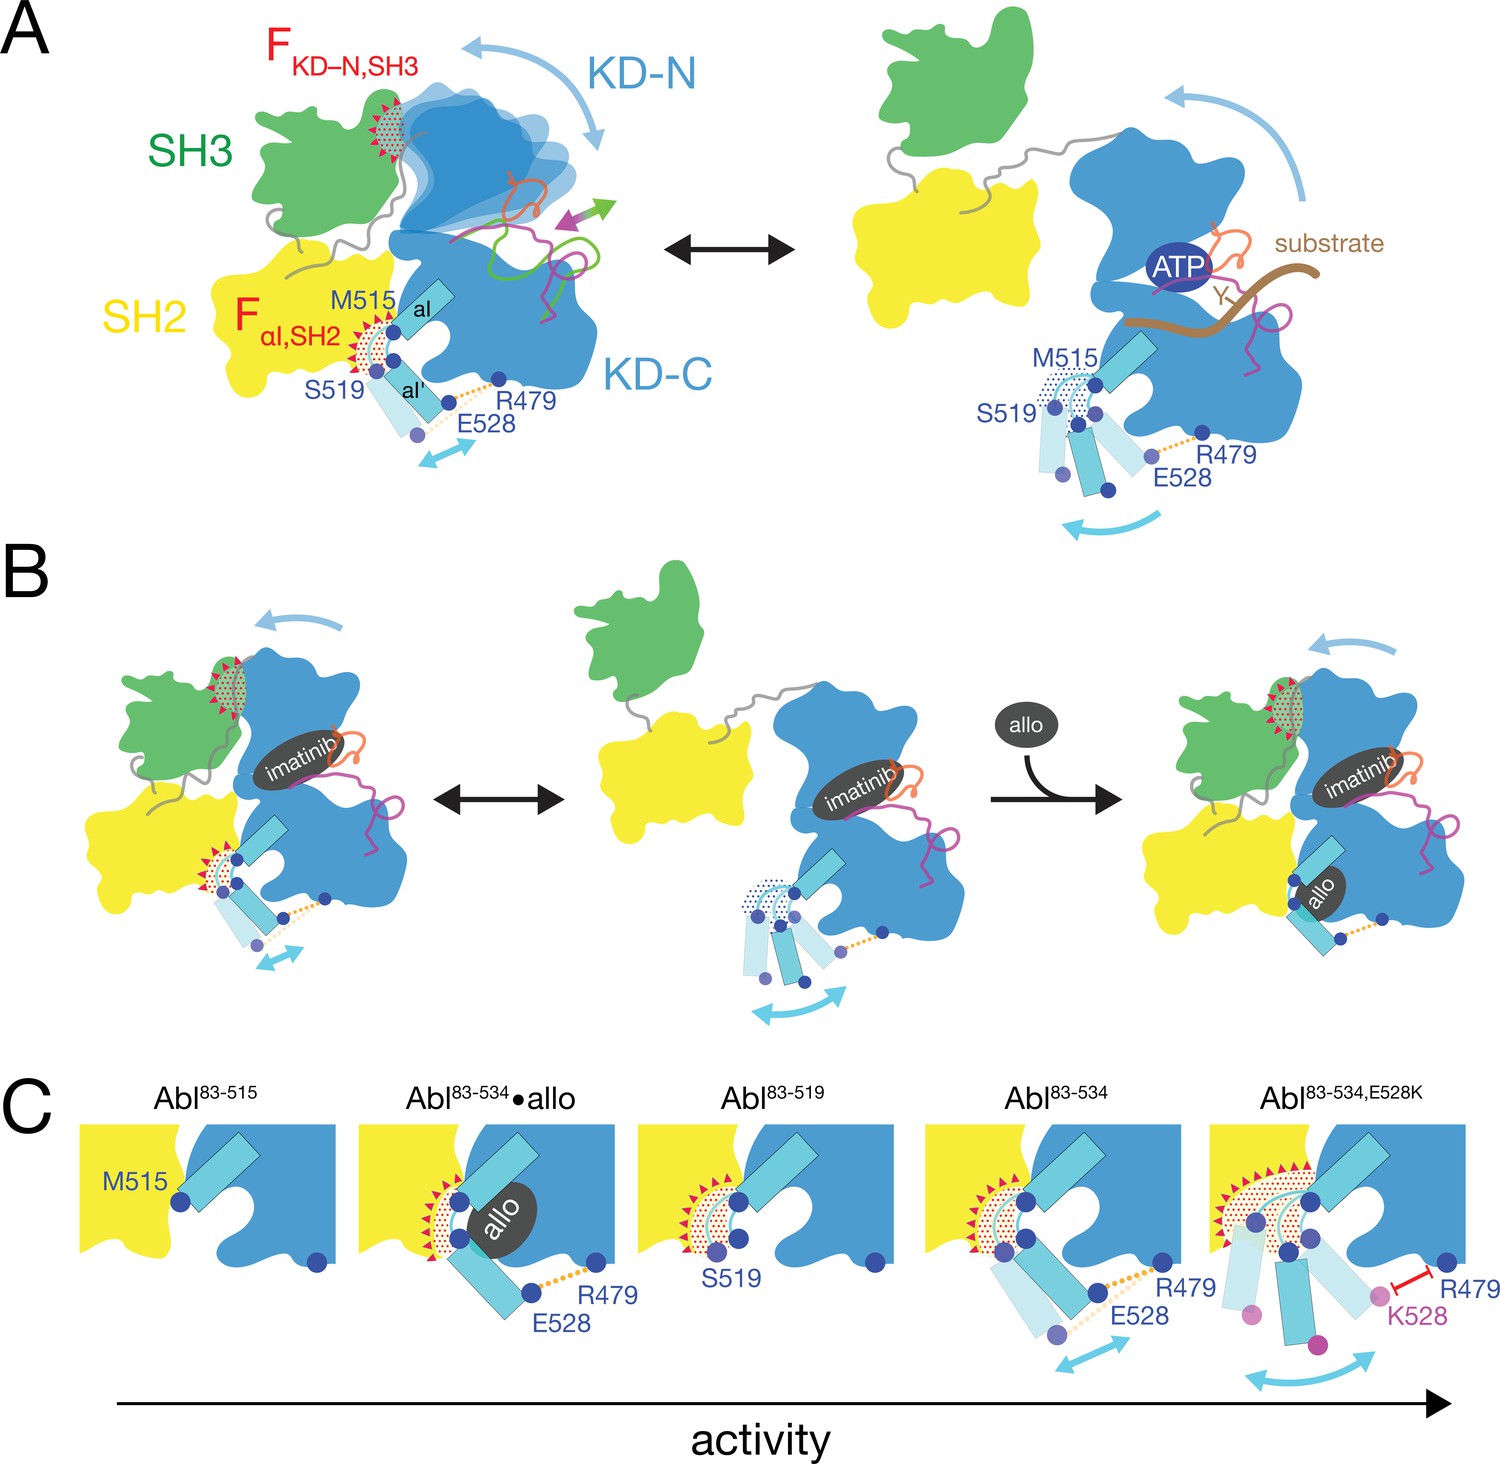
Mechanical model of Abl allosteric regulation.
(A) Transition between closed (left) and open (right) conformation of Abl’s regulatory core during activation. Arrows indicate mobility of the KD N-lobe and the αI-helix. Clashes between SH3 and KD-N and between SH2 and αI-helix resulting from this mobility are shown by red dots, the related clash-induced forces FKD-N,SH3 and FαI,SH2 by red triangles. Color coding: SH3 (green), SH2 (yellow), KD (blue), αI-helix (cyan), A-loop (inactive: magenta, active: green), P-loop (orange), tyrosine substrate (brown), R479-E528 salt bridge (orange). (B) Model of imatinib-induced Abl core disassembly. The color code follows panel A. Allo: allosteric inhibitor. (C) Detailed model of the interaction between the αI-helix and the SH2 domain for the various investigated Abl αI-helix constructs and inhibitor-bound conformations. The observed, respective Abl activity increases in the direction of the arrow at the bottom. The color code follows panel A.
Tables
Table 1
Michaelis-Menten parameters* for the various Abl helix constructs.
| Abl83-534 | Abl83-519 | Abl83-517 | Abl83-515 | Abl83-534•asciminib | Abl83-534,E528K | |
|---|---|---|---|---|---|---|
| vmax† | 89.4±6.7 | 79.5±15.4 | 56.8±13.3 | 3.2±0.2 | 61.9±11.8 | 201.7±16.0 |
| KM‡ | 51.8±8.8 | 91.4±30.9 | 74.8±35.7 | 39.5±9.0 | 336.7±80.3 | 71.6±12.3 |
| N§ | 8 | 3 | 3 | 3 | 3 | 2 |
-
*
the Michaelis-Menten parameters and their errors were obtained by Monte Carlo fitting using the sample mean and standard error of the mean of the measured kinase activities shown in Figure 5A.
-
†
in nmol Pi min–1μmol–1, where Pi is the transferred phosphate.
-
‡
in μM.
-
§
total number of activity assay experiments.
Key resources table
| Reagent type (species) or resource | Designation | Source or reference | Identifiers | Additional information |
|---|---|---|---|---|
| Gene (Human) | Abl | Uniprot | P00519-2 | |
| Gene (Escherichia phage lambda) | Lambda phosphatase; LPP | Uniprot | P03772 | |
| Strain, strain background (Escherichia coli) | BL21(DE3) | Sigma-Aldrich | CMC0014 | Chemical competent cells |
| Recombinant DNA reagent | Plasmid containing human Abl83-534 | Skora et al., 2013 DOI:10.1073/pnas.1314712110 | ||
| Recombinant DNA reagent | Plasmid containing Lambda phosphatase | Sonti et al., 2018 DOI:10.1021/jacs.7b12430 | ||
| Antibody | Conjugated poly-histidine antibody | Sigma-Aldrich | Cat.# A7058 | Mouse monoclonal (1:10000); peroxidase conjugate |
| Peptide, recombinant protein | Abltide | ProteoGenix | biotin-GGEAIYAAPFKK | |
| Commercial assay or kit | SAM2 Biotin Capture Membrane | Promega | Cat.# V2861 | |
| Chemical compound, drug | Asciminib; asci | Selleck Chemicals | Cat.# S8555 | |
| Chemical compound, drug | GNF-5 | Selleck Chemicals | Cat.# S7526 | |
| Chemical compound, drug | AMP-PNP | Roche | Cat.# 10102547001 | |
| Chemical compound, drug | Bosutinib; bosu | Selleck Chemicals | Cat.# S1014 | |
| Chemical compound, drug | Axitinib; axit | Selleck Chemicals | Cat.# S1005 | |
| Chemical compound, drug | Dasatinib; dasa | Selleck Chemicals | Cat.# S1021 | |
| Chemical compound, drug | Danusertib; danu | Selleck Chemicals | Cat.# S1107 | |
| Chemical compound, drug | Tozasertib; toza | Selleck Chemicals | Cat.# S1048 | |
| Chemical compound, drug | Staurosporine; staur | Selleck Chemicals | Cat.# S1421 | |
| Chemical compound, drug | PD180970 | Sigma-Aldrich | Cat.# PZ0142 | |
| Chemical compound, drug | PD166326 | Sigma-Aldrich | Cat.# PZ0366 | |
| Chemical compound, drug | Rebastinib; reba | Selleck Chemicals | Cat.# S2634 | |
| Chemical compound, drug | Ponatinib; pona | Selleck Chemicals | Cat.# S1490 | |
| Chemical compound, drug | Nilotinib; nilo | Selleck Chemicals | Cat.# S1033 | |
| Chemical compound, drug | Bafetinib; bafe | Selleck Chemicals | Cat.# S1369 | |
| Chemical compound, drug | Imatinib; ima | Selleck Chemicals | Cat.# S2475 | |
| Software, algorithm | NMRPipe | Delaglio et al., 1995 DOI:10.1007/bf00197809 | ||
| Software, algorithm | SPARKY | Lee et al., 2015 DOI:10.1093/bioinformatics/btu830 | ||
| Software, algorithm | NumPy | Harris et al., 2020 DOI:10.1038/s41586-020-2649-2 |
Additional files
Download links
A two-part list of links to download the article, or parts of the article, in various formats.
Downloads (link to download the article as PDF)
Open citations (links to open the citations from this article in various online reference manager services)
Cite this article (links to download the citations from this article in formats compatible with various reference manager tools)
The molecular basis of Abelson kinase regulation by its αI-helix
eLife 12:RP92324.
https://doi.org/10.7554/eLife.92324.3


