Structural basis for the phase separation of the chromosome passenger complex
- Department of Biochemistry and Biophysics, Perelman School of Medicine, University of Pennsylvania, United States
- Graduate Program in Biochemistry and Molecular Biophysics, University of Pennsylvania, United States
- Department of Biochemistry and Molecular Genetics, University of Virginia, United States
- Penn Center for Genome Integrity, Perelman School of Medicine, University of Pennsylvania, United States
- Epigenetics Institute, Perelman School of Medicine, University of Pennsylvania, United States
Figures
Figure 1 with 1 supplement
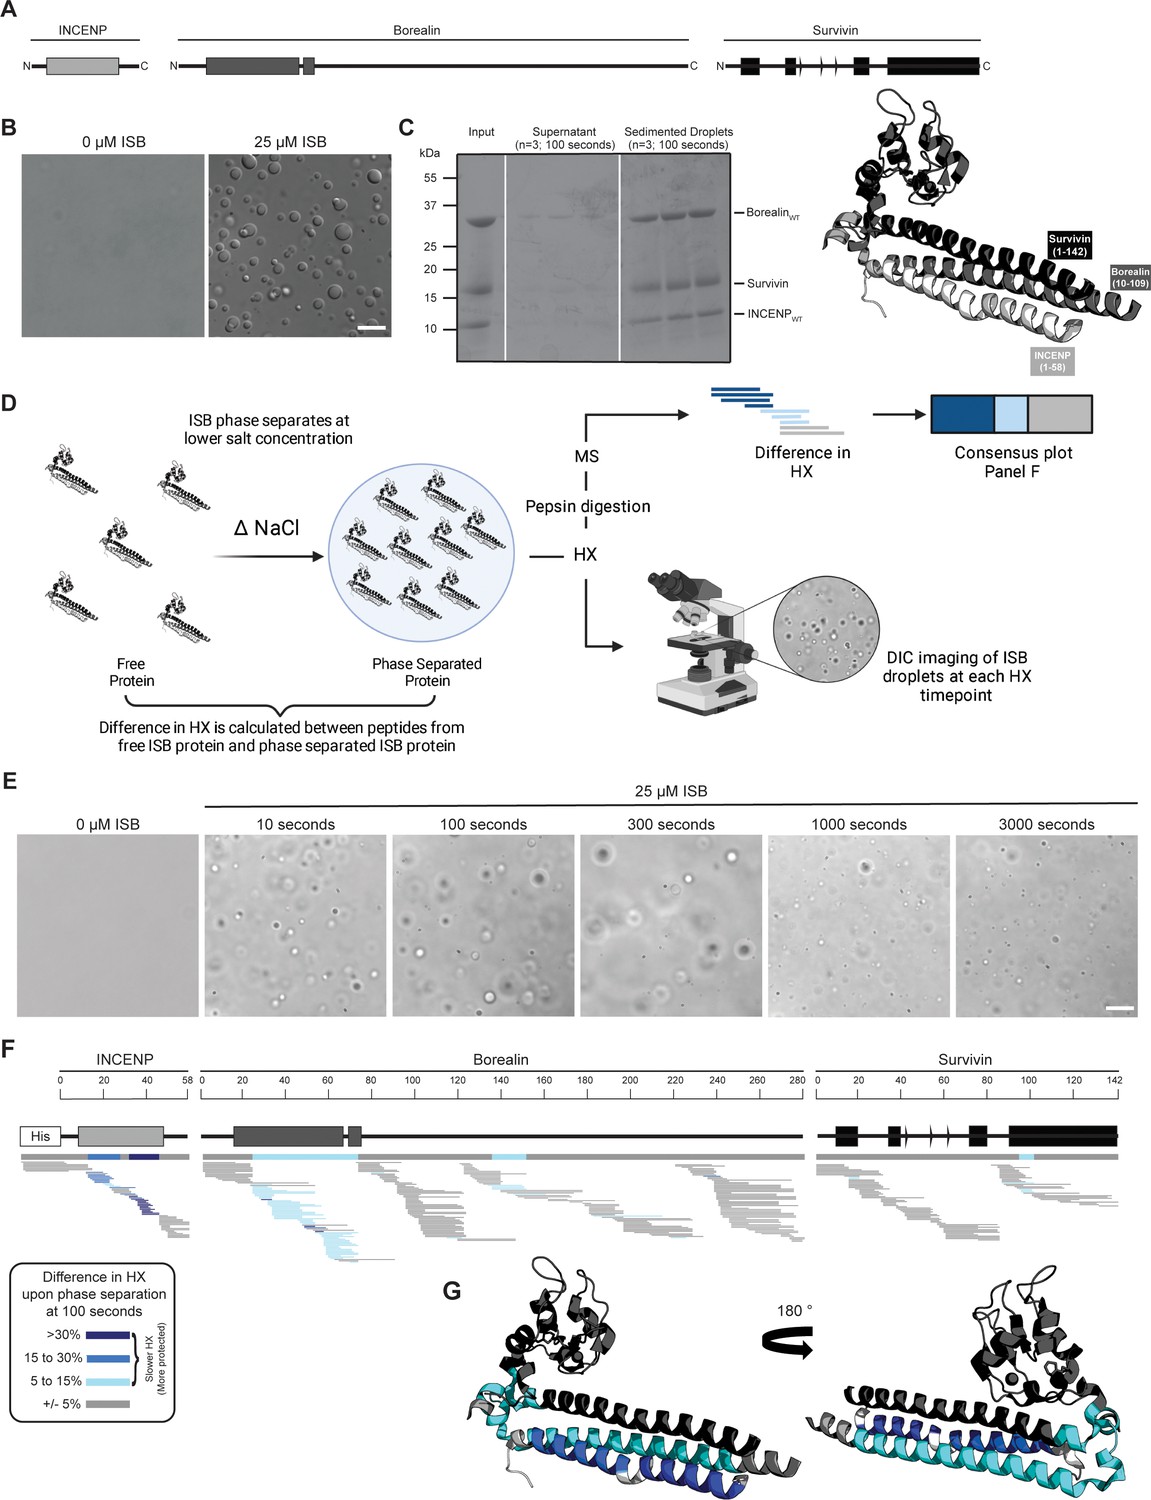
Phase separation leads to decreases in hydrogen/deuterium exchange (HX) within the three-helix bundle structure of ISB.
(A) Schematic of the ISB showing various structural domains within the subunits. Structural information was extracted from crystal structure of three-helix bundle structure of the ISB (PDB# 2QFA) (Jeyaprakash et al., 2007). Each protein is color-coded in a various shade of gray: INCENP = light gray, Borealin = mid-gray, Survivin = dark gray. (B) DIC micrographs of the ISB droplets under indicated conditions (25 µM ISB, 75 mM NaCl). Droplets were allowed to settle onto coverslip before imaging (~5 min). Scale bar = 10 µm. (C) Sedimentation of pre-formed ISB droplets at phase separation conditions in Panel B (n=3). The time shown indicates the incubation period prior to sedimentation. (D) Schematic of hydrogen/deuterium exchange mass spectrometry (HXMS) experiments between free ISB protein and droplet ISB protein. HX samples either underwent pepsin digestion and analysis by MS or DIC imaging at each HX timepoint. (E) DIC micrographs of the ISB droplets at each HX timepoint (10, 100, 300, 1000, and 3000 s). Droplets were not allowed to settle onto coverslip to allow for accurate timing of images. Scale bar = 10 µm. (F) Percent difference in HX is calculated for each peptide (represented by horizontal bars) at the 100 s timepoint and plotted using the corresponding color key. The consensus behavior at each ISB residue is displayed in the horizontal bar below the secondary structure annotation taken from Panel A. These peptides were identified in a single experiment. When available, we present the data for all measurable charge states of the unique peptides within the experiment. (G) Consensus HXMS data from Panel F is mapped onto the three-helix bundle structure of the ISB, along with corresponding color key. Two views are shown, rotated by 180°.
© 2024, BioRender Inc. Figure 1D was created using BioRender, and is published under a CC BY-NC-ND license. Further reproductions must adhere to the terms of this license.
-
Figure 1—source code 1
MATLAB script to produce difference plots between two hydrogen/deuterium exchange mass spectrometry (HXMS) datasets.
- https://cdn.elifesciences.org/articles/92709/elife-92709-fig1-code1-v2.zip
-
Figure 1—source data 1
Data used to generate Figure 1.
- https://cdn.elifesciences.org/articles/92709/elife-92709-fig1-data1-v2.zip
Figure 1—figure supplement 1
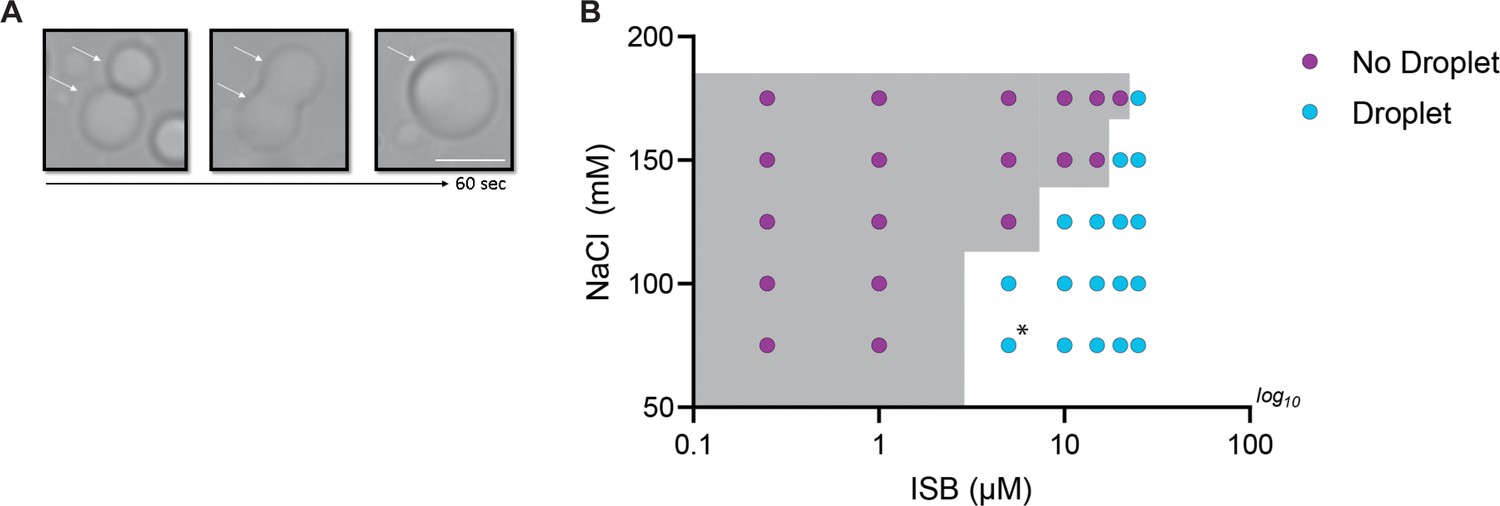
Phase properties of WT-ISB in absence of crowder.
(A) Fusion of WT-ISB droplets as visualized by time-lapse imaging in the absence of crowding agent. (B) Phase diagram of WT-ISB phase separation as a function of the concentration of NaCl and ISB in the absence of crowding agent. The presence (cyan) or absence (magenta) of WT-ISB droplets. The gray area indicates the phase boundary. Conditions on either side of the phase boundary were repeated three times. For the condition [ISB]=5 µM and [NaCl]=75 mM, circle is highlighted with asterisk because two replicates displayed droplet formation, but one condition did not.
Figure 2 with 3 supplements
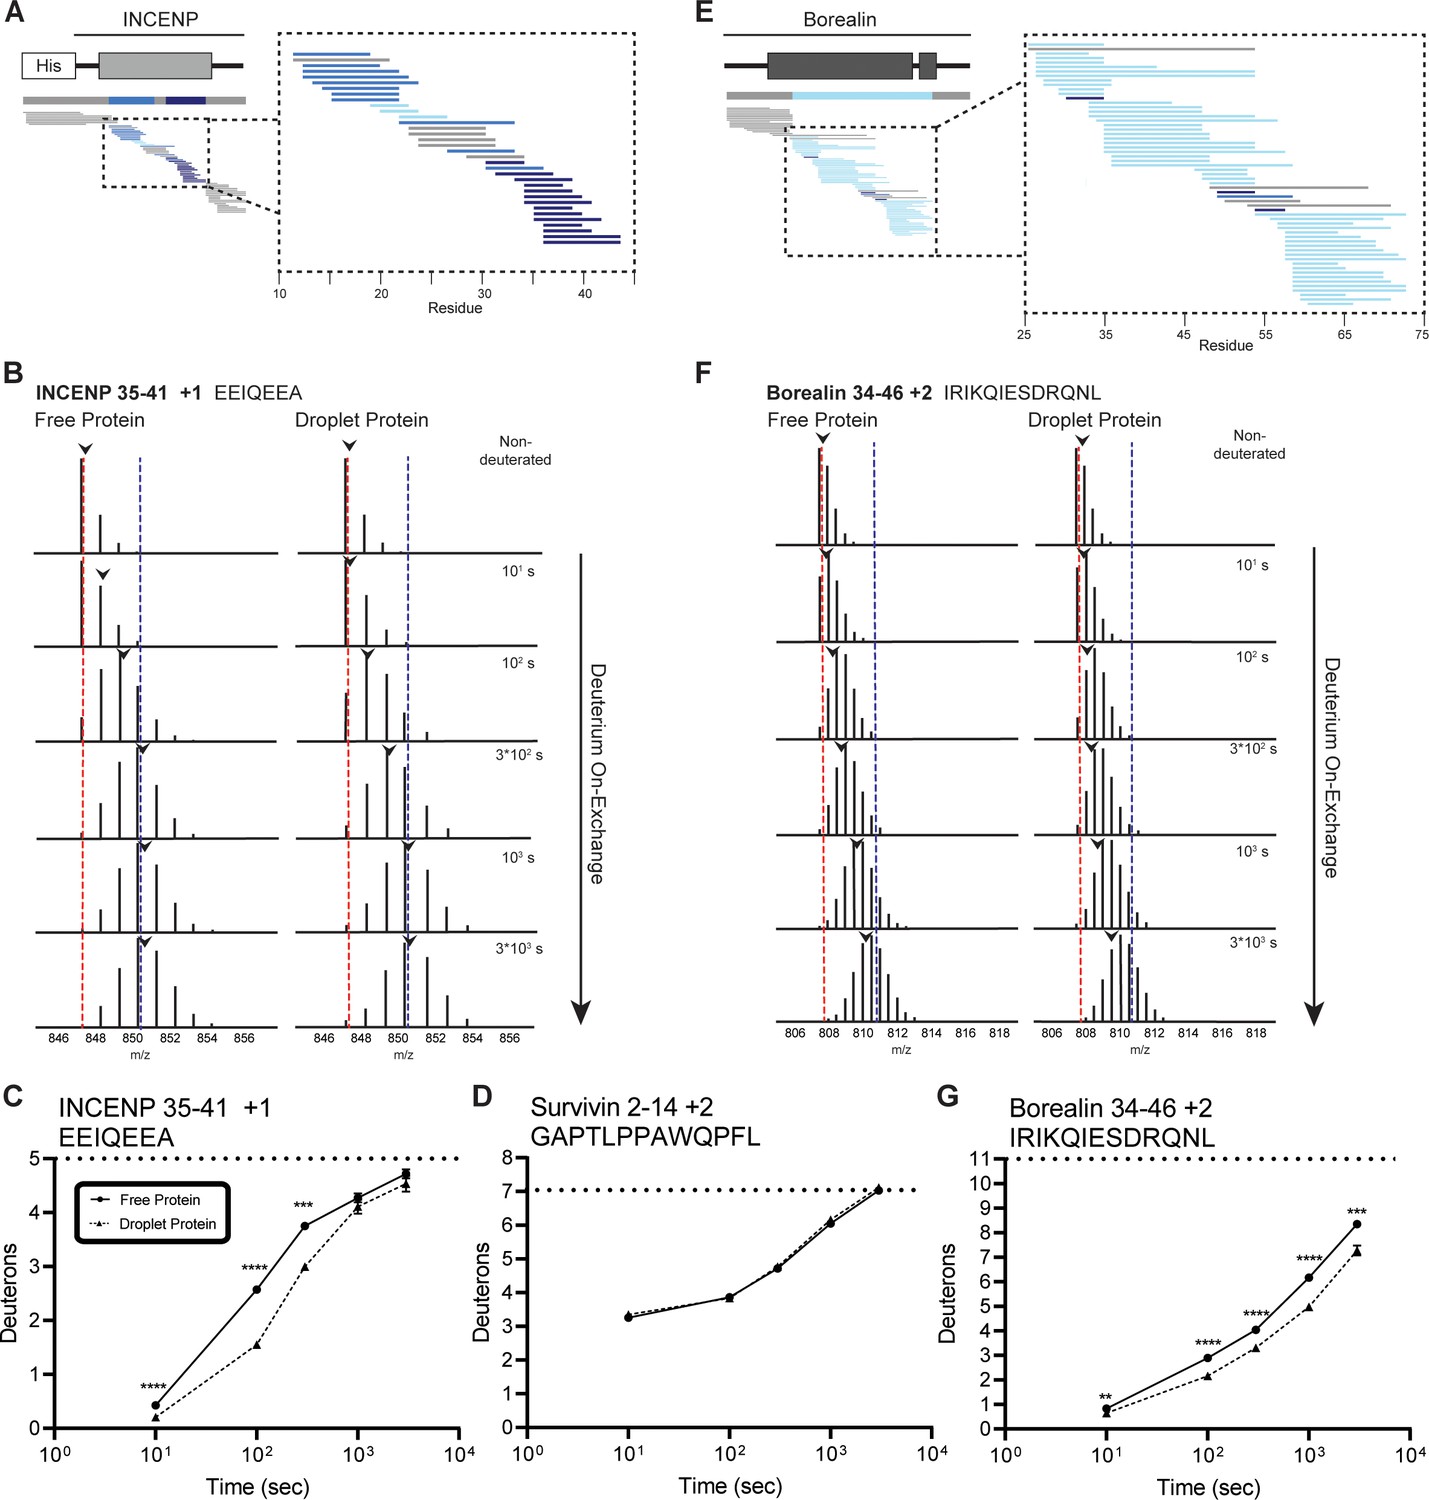
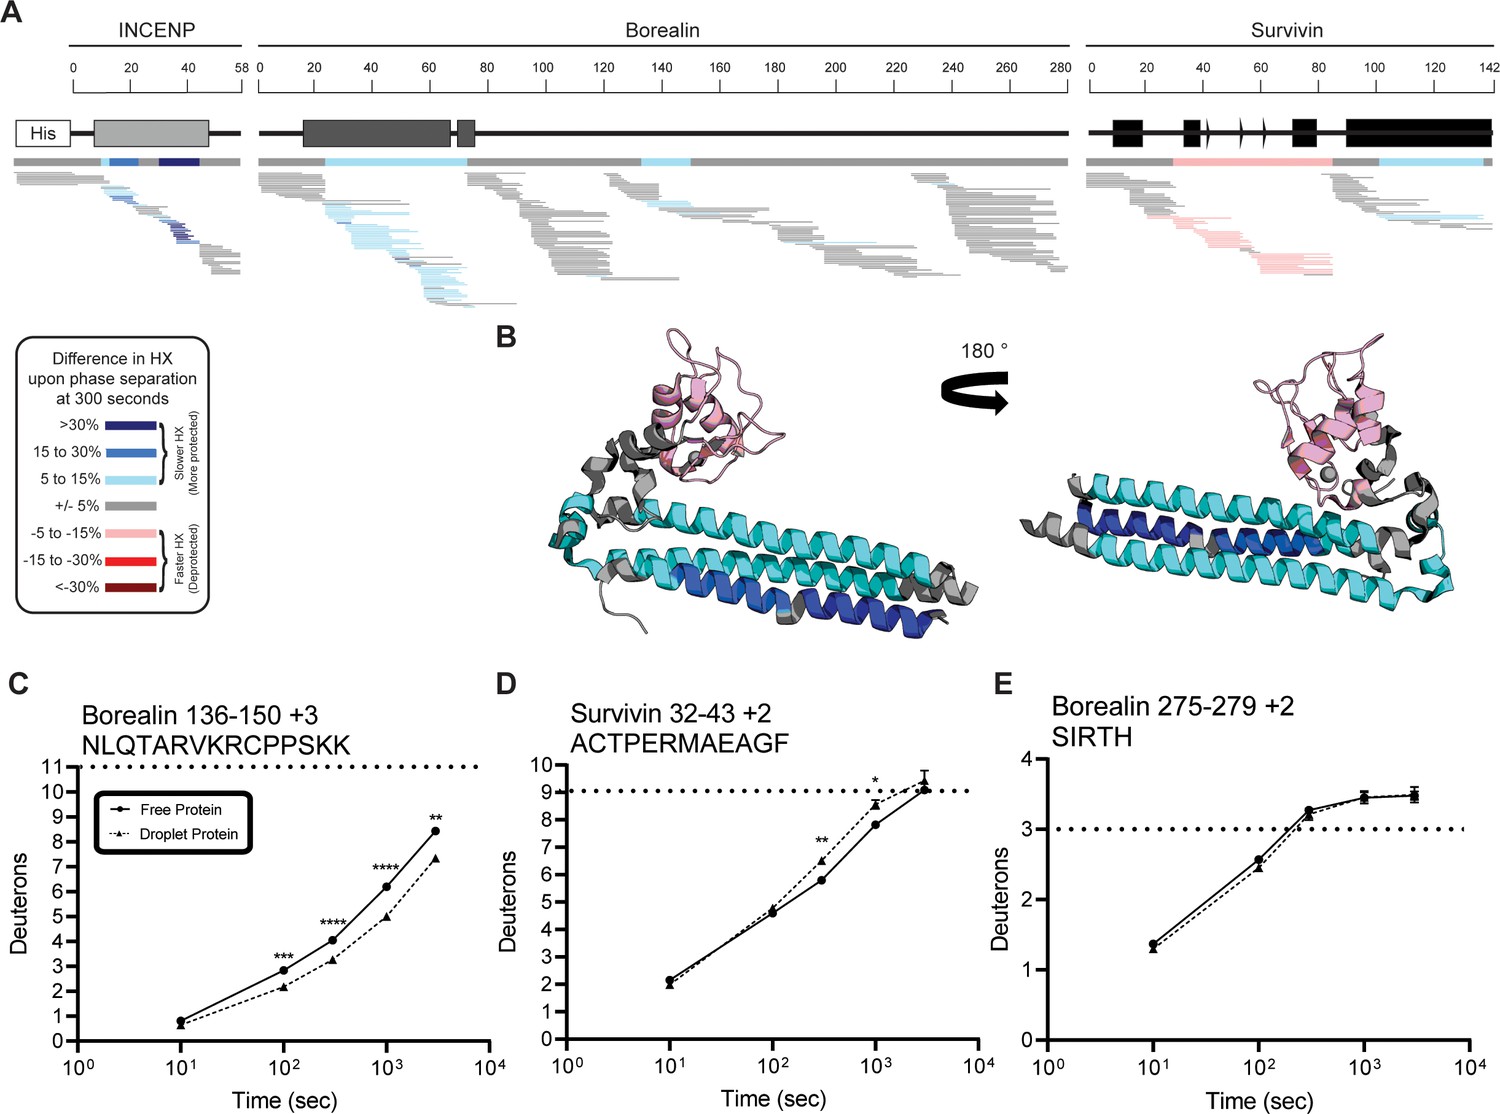
Regions of the three-helix bundle structure of INCENP and Borealin become protected from hydrogen/deuterium exchange (HX) upon phase separation.
(A) Percent difference in HX upon phase separation at 100 s in the indicated region of INCENP. (B) Raw MS data of a representative peptide from indicated region of INCENP. Centroid values are indicated with an arrowhead. Red and blue dotted lines serve as guides for visualizing differences. The red line lies on mono-isotopic peak whereas the blue line lies on the centroid value for the largest timepoint (3000 s) within the free protein sample. (C) Hydrogen/deuterium exchange mass spectrometry (HXMS) of representative peptide from Panel B. The measured maximum number of exchangeable deuterons (maxD) when corrected with the average back exchange level (Figure 2—figure supplement 2B) is indicated. Data are represented as mean ± s.e.m.; note: the error is too small to visualize outside of readable data points except in one instance. Statistical analysis was performed using multiple unpaired t-tests. ****p<0.0001; ***0.0001<p<0.001; **0.001<p<0.01. (D) HXMS of a peptide from the indicated region within Survivin and displayed, as described in Panel C. This peptide shows the representative behavior of regions with the ISB that do not undergo changes in HX upon phase separation. Data are represented as mean ± s.e.m.; note: the error is too small to visualize outside of readable data points. (E) Percent difference in HX upon phase separation at 100 s in the indicated region of Borealin. (F) Raw MS data of a representative peptide from indicated region of Borealin. Centroid values are indicated with an arrowhead. Red and blue dotted lines serve as guides for visualizing differences, as explained in Panel B. (G) HXMS of representative peptide from Panel F and displayed as described in Panel C. Note: the error is too small to visualize outside of readable data points except in one instance.
-
Figure 2—source code 1
R script to produce ribbon diagrams for each hydrogen/deuterium exchange mass spectrometry (HXMS) dataset.
- https://cdn.elifesciences.org/articles/92709/elife-92709-fig2-code1-v2.zip
-
Figure 2—source data 1
Data used to generate Figure 2.
- https://cdn.elifesciences.org/articles/92709/elife-92709-fig2-data1-v2.zip
Figure 2—figure supplement 1
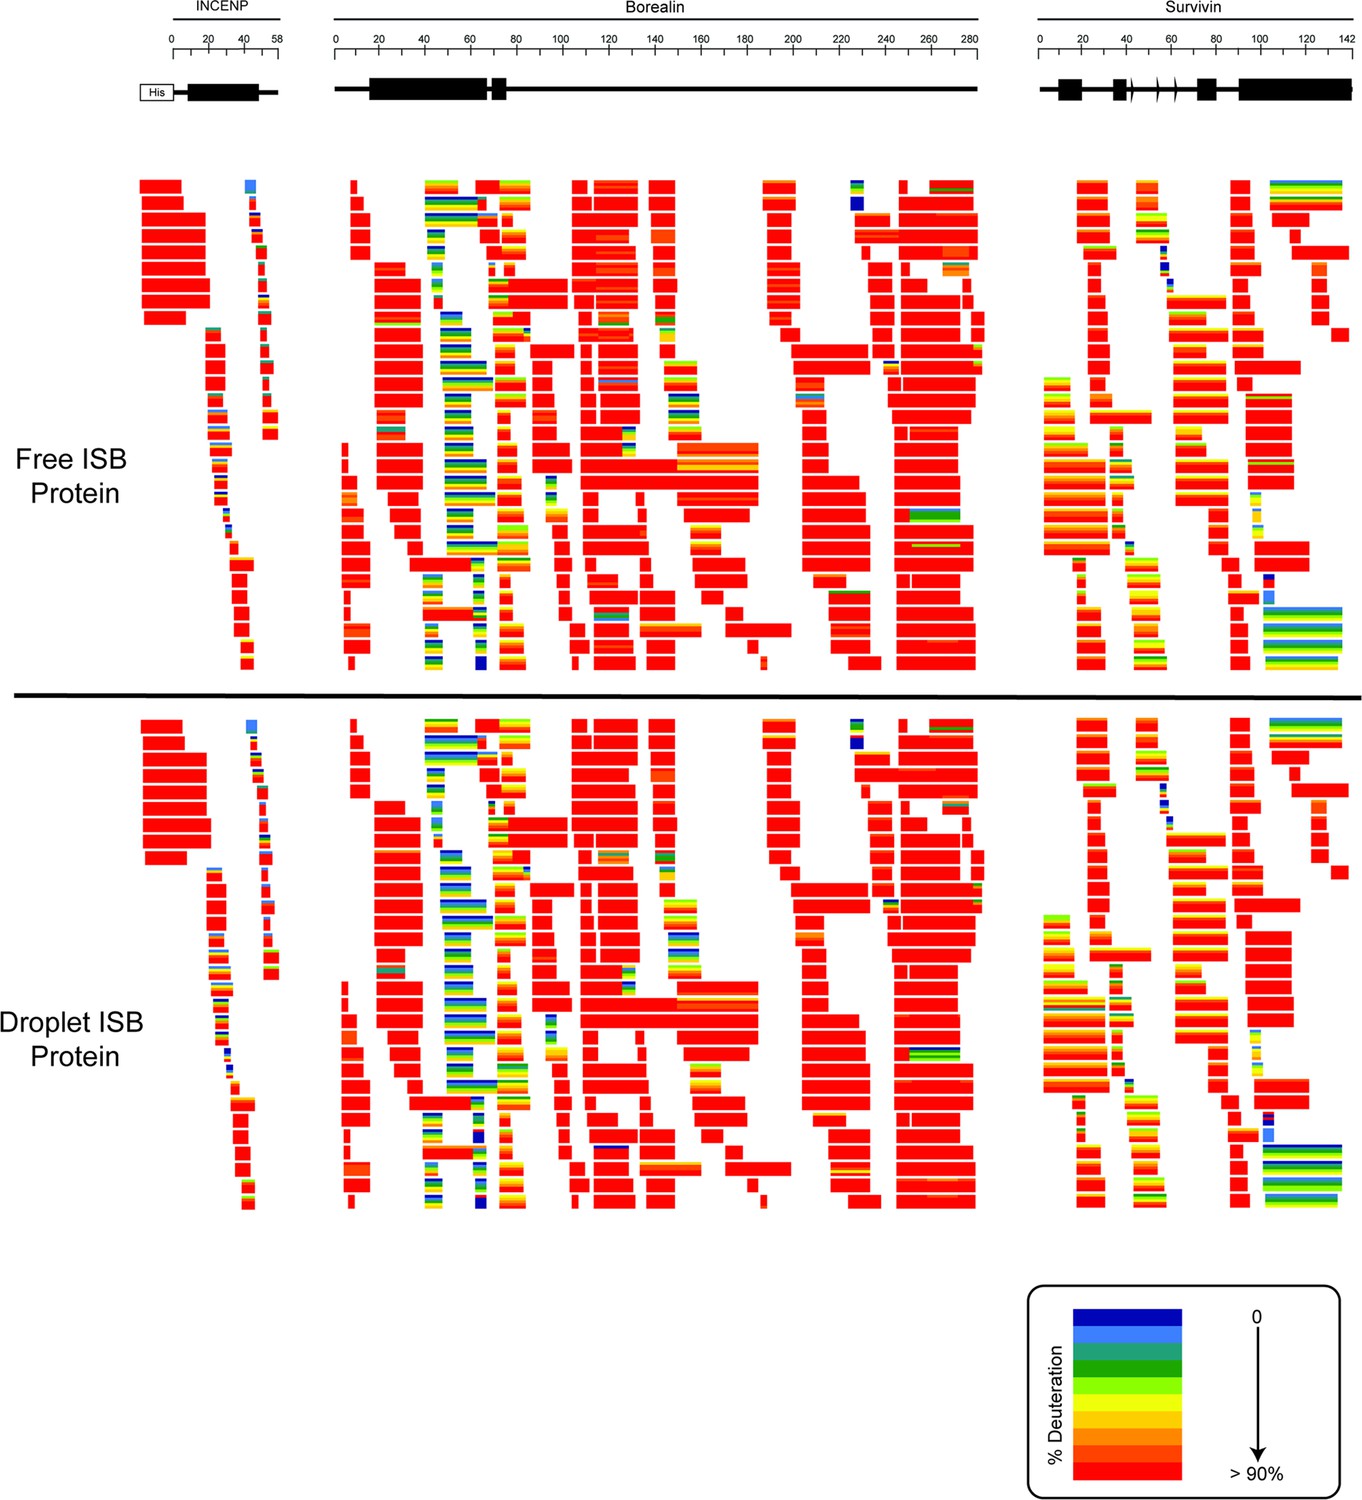
Ribbon plots for free and droplet ISB protein.
Hydrogen/deuterium exchange mass spectrometry (HXMS) data for free ISB protein and droplet ISB protein. Each horizontal bar represents an individual peptide, and the five stripes within each bar are colored according to the percentage deuteration at each of the five timepoints (10, 100, 300, 1000, 3000 s).
Figure 2—figure supplement 2
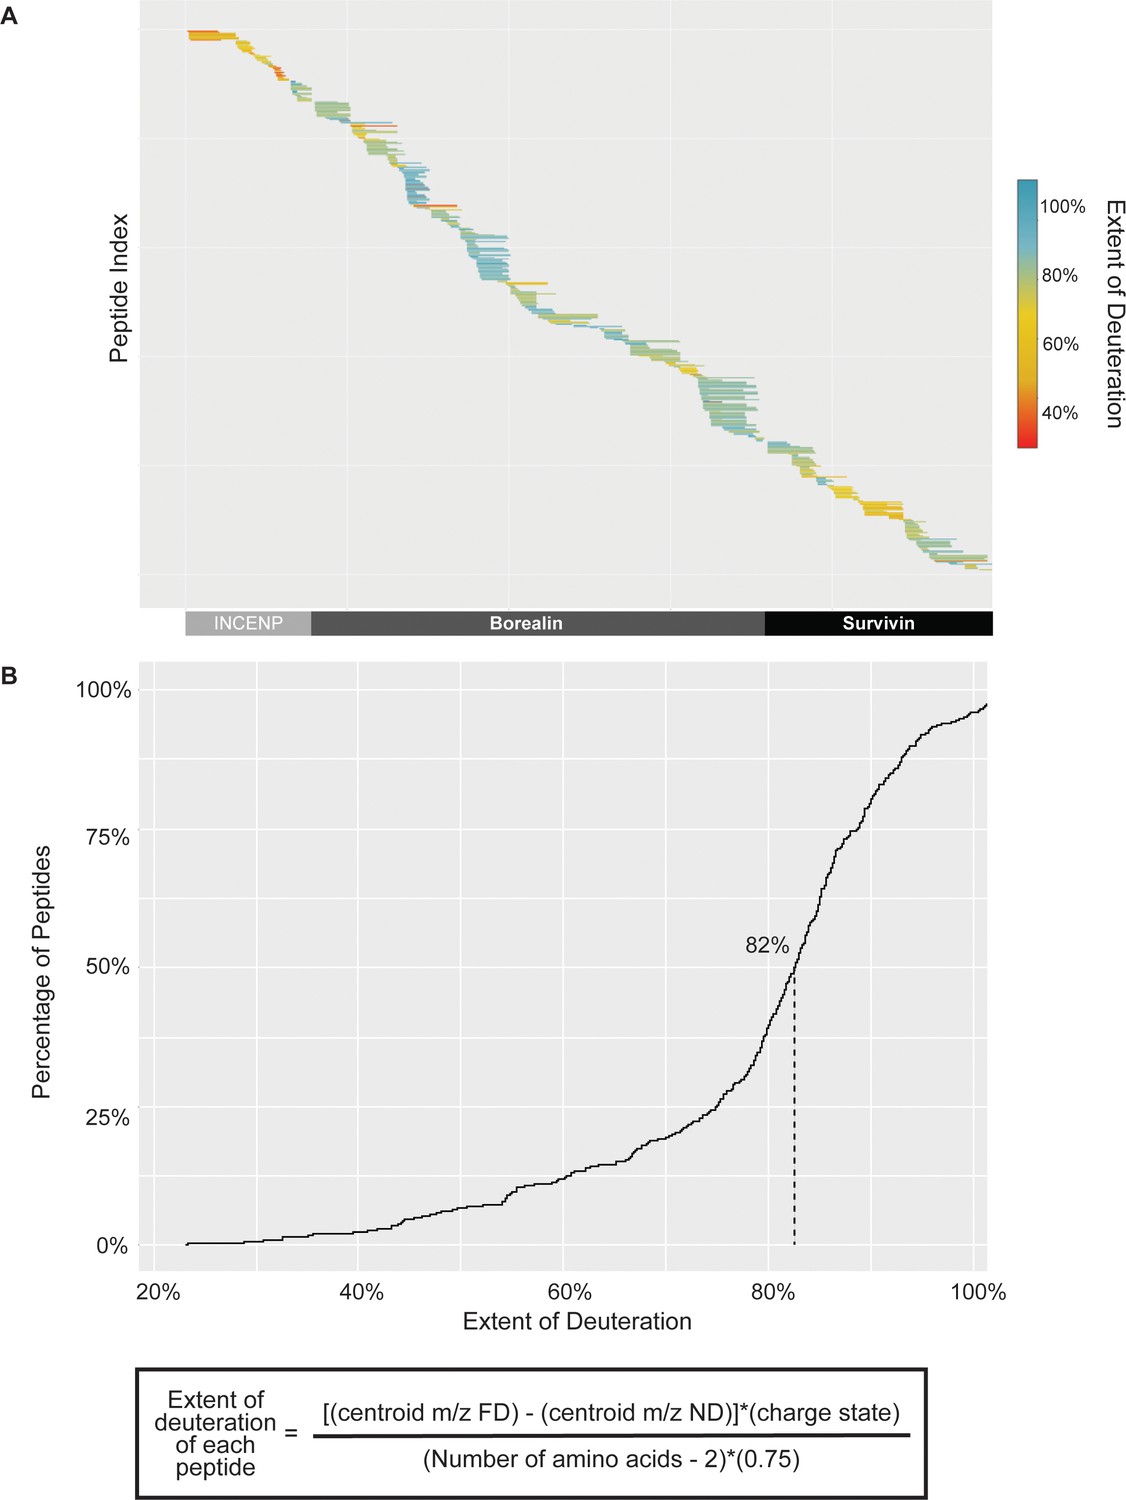
Extent of deuteration within fully deuterated (FD) hydrogen/deuterium exchange mass spectrometry (HXMS) control samples.
(A) Extent of peptide deuteration across INCENP, Borealin, and Survivin sequence within a representative FD HXMS control samples. (B) Cumulative distribution curve of a representative FD sample, showing the extent of deuteration of all peptides compared to the theoretical maximum amount of deuteration of each peptide. The median deuteration was ~82% for the FD sample, therefore the back exchange after quench step was only ~18%, which is well within an optimal range.
Figure 2—figure supplement 3
Percent difference in hydrogen/deuterium exchange (HX) calculated for each peptide at 300 s.
(A) Percent difference in HX is calculated for each peptide (represented by horizontal bars) at the 300 s timepoint and plotted using the corresponding color key. The consensus behavior at each ISB residue is displayed in the horizontal bar below the secondary structure annotation taken from Figure 1, Panel A. These peptides were identified in a single experiment. When available, we present the data for all measurable charge states of the unique peptides within the experiment. (B) Consensus HXMS data from (A) is mapped onto the three-helix bundle structure of the ISB. Two views are shown, rotated by 180°. (C) HXMS of representative peptide from indicated region of Borealin. Data are represented as mean ± s.e.m.; note: the error is too small to visualize outside of readable data points. Statistical analysis was performed using multiple unpaired t-tests. ****p<0.0001; ***0.0001<p<0.001; **0.001<p<0.01. (D) HXMS of representative peptide from indicated region of Survivin and displayed as described in Panel C. Data are represented as mean ± s.e.m.; note: the error is too small to visualize outside of readable data points except in two instances. Statistical analysis was performed using multiple unpaired t-tests. **0.001<p<0.01; * 0.01<p<0.05. (E) HXMS of representative peptide from a region within Borealin and displayed as described in Panel C. This peptide shows the representative behavior of regions with the ISB that do not undergo changes in HX upon phase separation. Data are represented as mean ± s.e.m.; note: the error is too small to visualize outside of readable data points except in one instance. The apparent overcorrection, deuteration above the maxD level, is likely due to retained deuterium at position 2 due to the slowing effect of the Ile side chain (Bai et al., 1993).
-
Figure 2—figure supplement 3—source data 1
Data used to generate Figure 2—figure supplement 3.
- https://cdn.elifesciences.org/articles/92709/elife-92709-fig2-figsupp3-data1-v2.zip
Figure 3
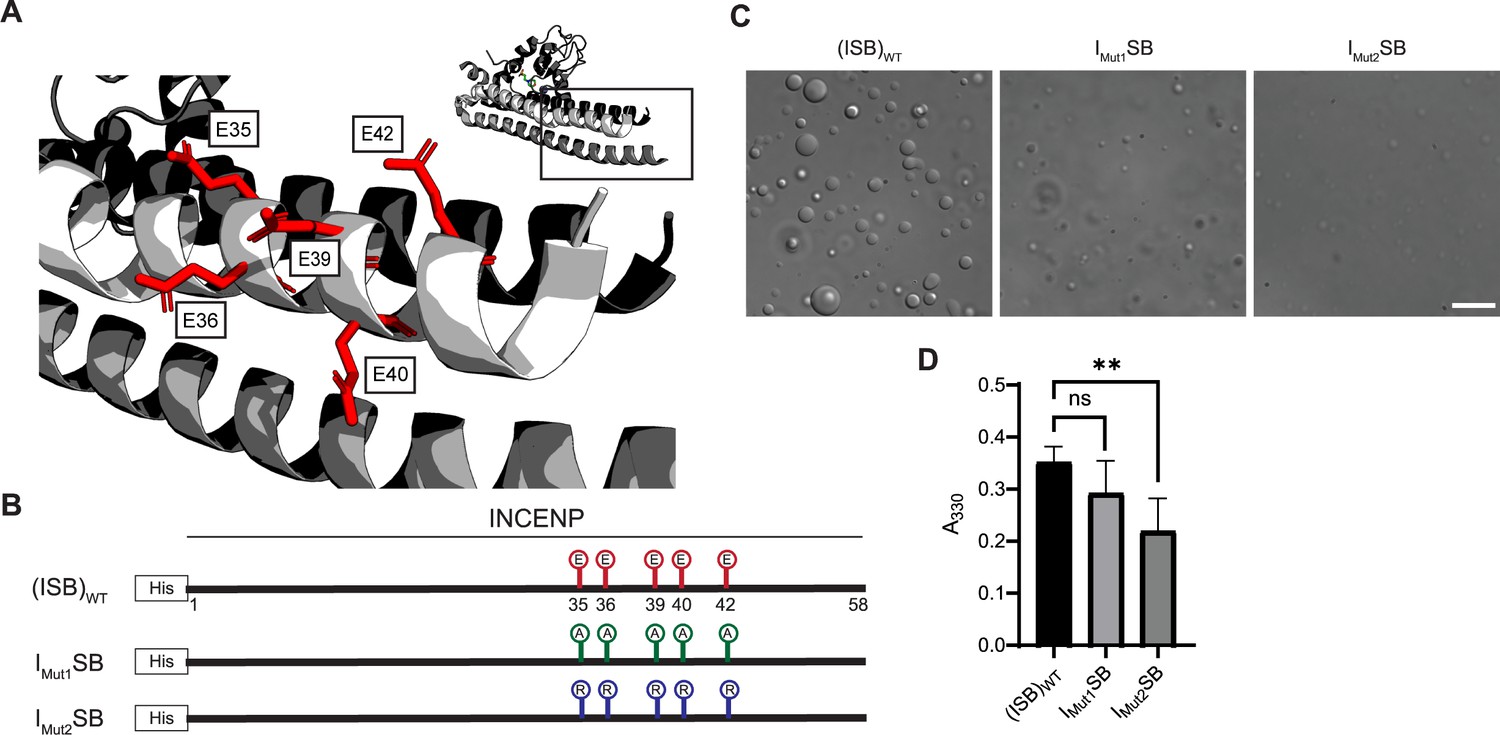
Acidic patch within INCENP coiled-coiled region contributes to electrostatic interaction within droplets.
(A) Location of indicated acidic residues (E35/36/39/40/42) within INCENP at the surface of the coiled-coiled structure. Side chains are colored in red to indicate acidic charge. (B) Summary of a first round of mutations made to acidic residues within INCENP. Lolli-pop sticks represent each of the five residues in question. For (ISB)WT, red color indicates acidic charge. For IMut1SB, green color indicates neutral charge. For IMut2SB, blue color represents basic charge. (C) DIC micrographs of the ISB droplets for IMut1SB and IMut2SB. The micrograph for (ISB)WT is from the same sample used in Figure 1B. Scale bar = 10 µm. (D) Turbidity calculations of IMut1SB and IMut2SB measured as absorbance at 330 nm; n=6 for (ISB)WT, IMut1SB, and IMut2SB. Statistical analysis was performed using a Brown-Forsythe and Welch ANOVA test. **0.001<p<0.01.
-
Figure 3—source data 1
Data used to generate Figure 3.
- https://cdn.elifesciences.org/articles/92709/elife-92709-fig3-data1-v2.zip
Figure 4 with 1 supplement
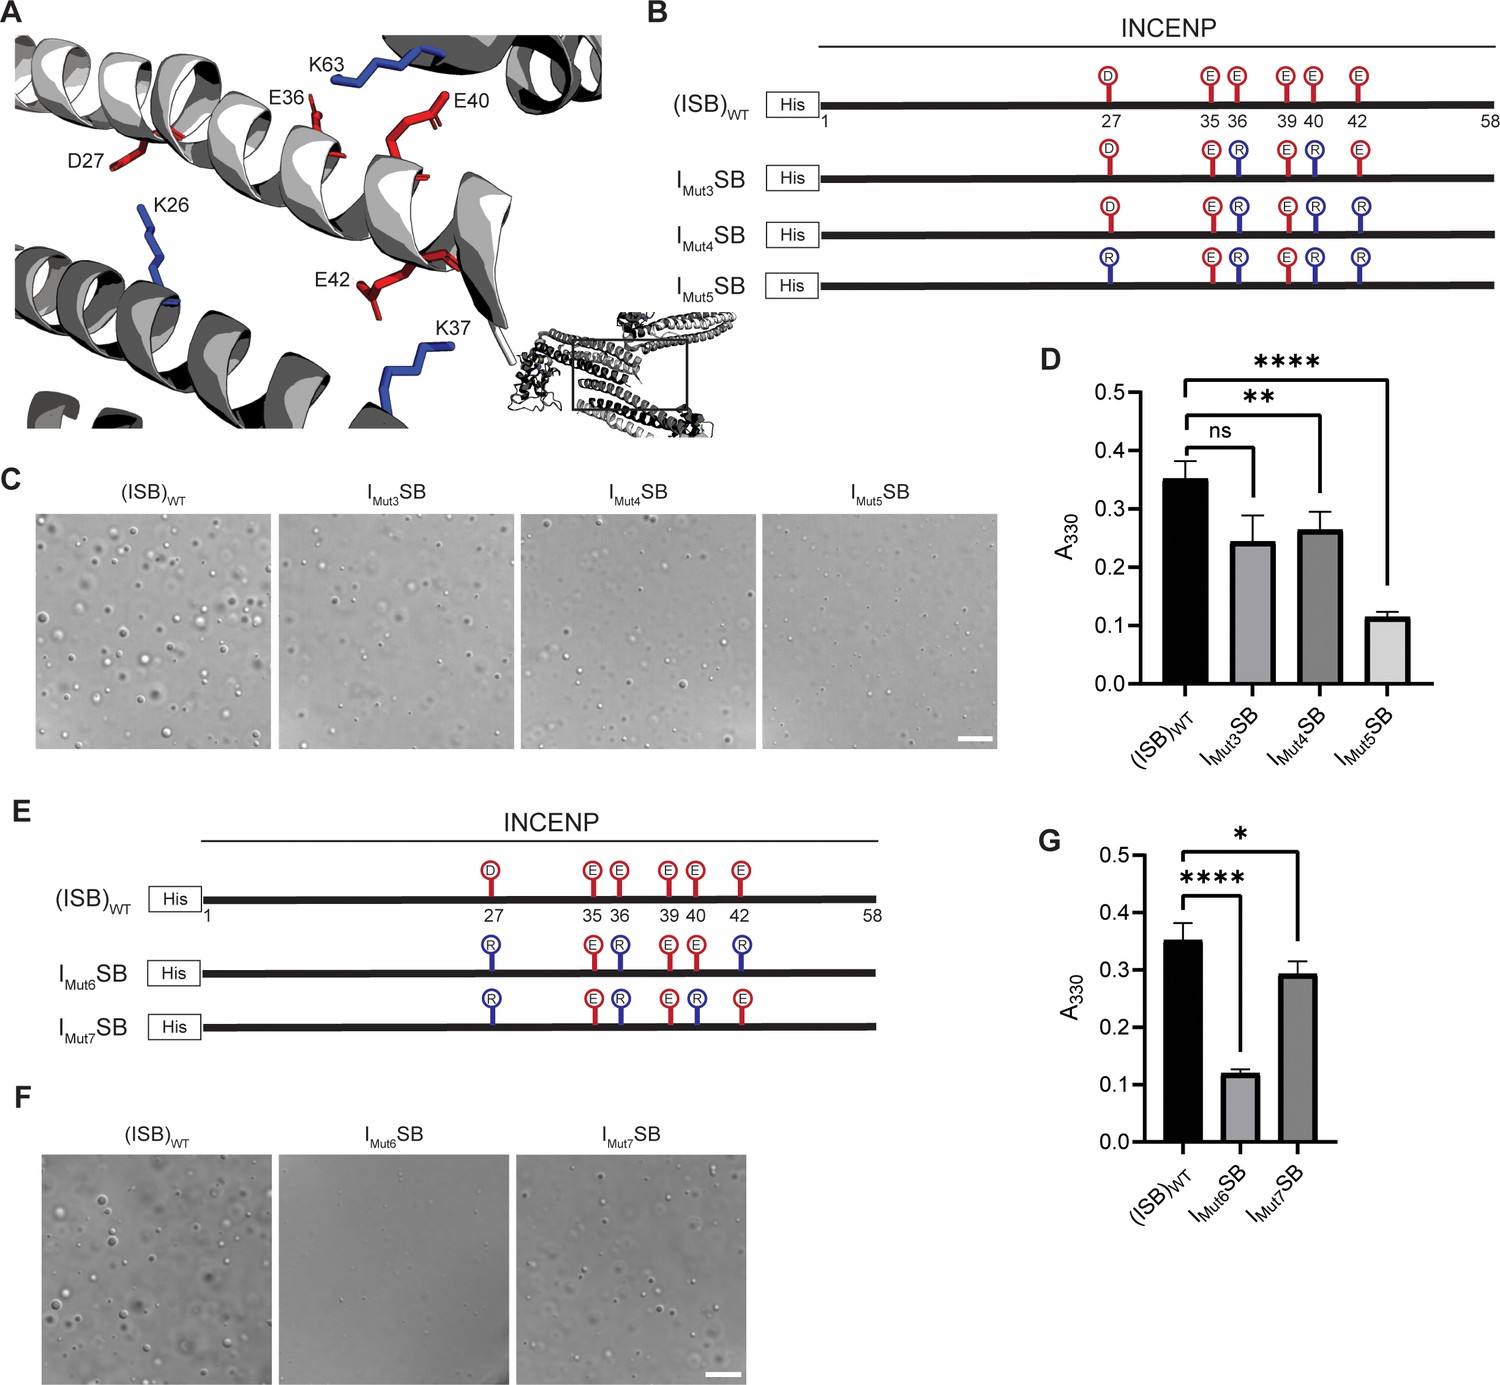
Crystal packing of ISB three-helix bundle structure highlights possible salt-bridges between multiple complexes.
(A) Location of acidic and basic residues within crystal packing of ISB between INCENP1 and Borealin2/Borealin3. Side chains are colored in red to indicate acidic charge and blue to indicate basic charge. (B) Summary of a second round of mutations made to acidic residues within INCENP. Lolli-pop sticks represent each of the indicated residues in question. (C) DIC micrographs of the ISB droplets for IMut3SB, IMut4SB, and IMut5SB. Scale bar = 10 µm. (D) Turbidity calculations of IMut3SB, IMut4SB, and IMut5SB measured as absorbance at 330 nm; n=6 for (ISB)WT, IMut4SB, and IMut5SB. n=3 for IMut3SB. Statistical analysis was performed using a Brown-Forsythe and Welch ANOVA test. ****p<0.0001; **0.001<p<0.01. (E) Summary of a third round of mutations made to acidic residues within INCENP. Lolli-pop sticks represent each of the indicated residues in question. (F) DIC micrographs of the ISB droplets for IMut6SB and IMut7SB. Scale bar = 10 µm. (G) Turbidity calculations of IMut6SB and IMut7SB measured as absorbance at 330 nm; n=6 for (ISB)WT. n=3 for IMut6SB and IMut7SB. Statistical analysis was performed using a Brown-Forsythe and Welch ANOVA test. ****p<0.0001; *0.01<p<0.05.
-
Figure 4—source data 1
Data used to generate Figure 4.
- https://cdn.elifesciences.org/articles/92709/elife-92709-fig4-data1-v2.zip
Figure 4—figure supplement 1
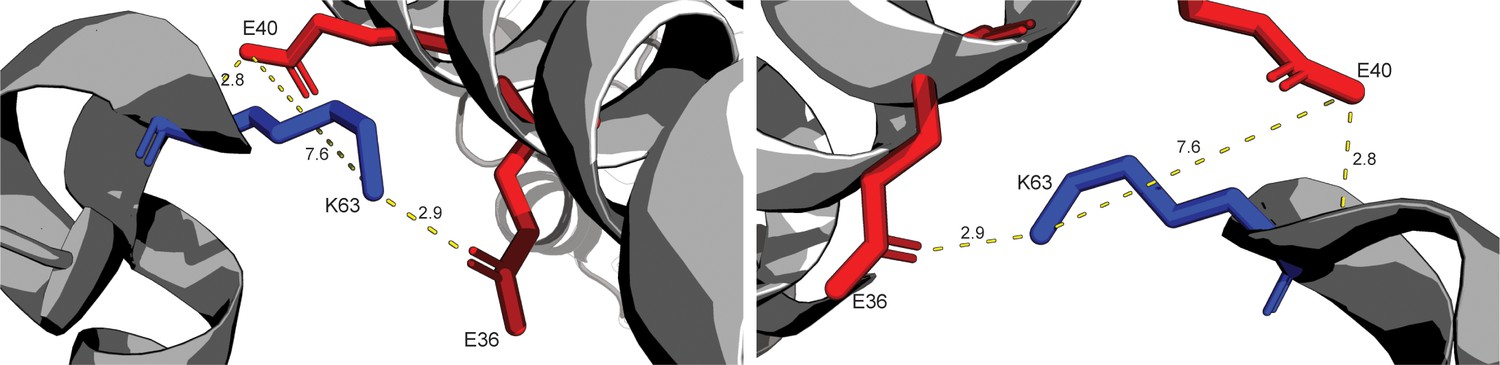
Highlighting structure of conflicting salt-bridge between INCENP and Borealin.
Highlighting crystal structure between INCENP1 and Borealin2. Side chains E36 and E40 of INCENP1 have the potential to form a salt-bridge with K63 of Borealin2. Potential polar contacts and distances between side chains are labeled.
Figure 5 with 2 supplements
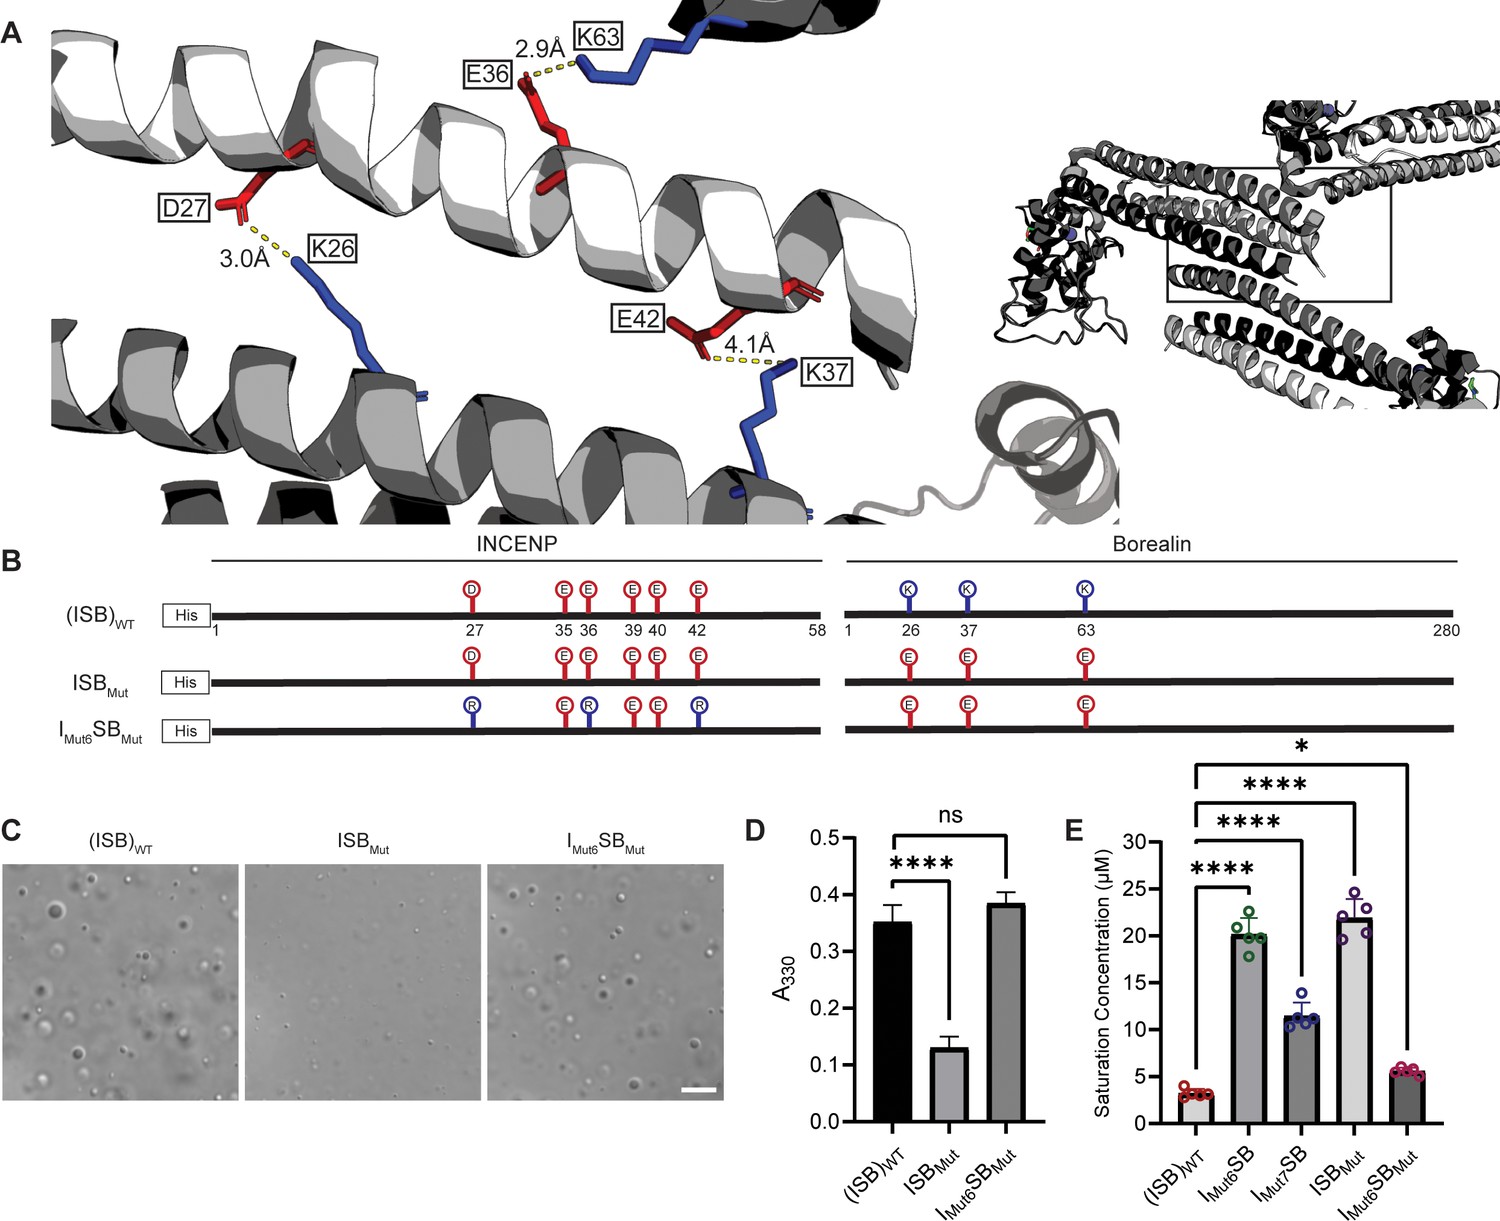
Salt-bridges between multiple ISB complexes provide multivalency required for phase separation.
(A) Location of key salt-bridges within crystal packing of ISB between INCENP1 and Borealin2/Borealin3. Side chains are colored in red to indicate acidic charge and blue to indicate basic charge. Distances between side chains are indicated. (B) Summary of a fourth round of mutations made to acidic residues within INCENP and basic residues within Borealin. Lolli-pop sticks represent each of the indicated residues in question. (C) DIC micrographs of the ISB droplets for ISBMut and IMut6SBMut. Scale bar = 10 µm. (D) Turbidity calculations of ISBMut and IMut6SBMut measured as absorbance at 330 nm; n=6 for (ISB)WT. n=3 for ISBMut and IMut6SBMut. Statistical analysis was performed using a Brown-Forsythe and Welch ANOVA test. ****p<0.0001. (E) Saturation concentration of (ISB)WT, IMut6SB, IMut7SB, ISBMut, and IMut6SBMut in buffer containing 75 mM NaCl measured using sedimentation. n=5 for (ISB)WT, IMut6SB, IMut7SB, ISBMut, and IMut6SBMut. Statistical analysis was performed using a one-way ANOVA test with Dunnett’s multiple comparisons test. ****p<0.0001; *0.01<p<0.05.
-
Figure 5—source data 1
Data used to generate Figure 5.
- https://cdn.elifesciences.org/articles/92709/elife-92709-fig5-data1-v2.zip
Figure 5—figure supplement 1
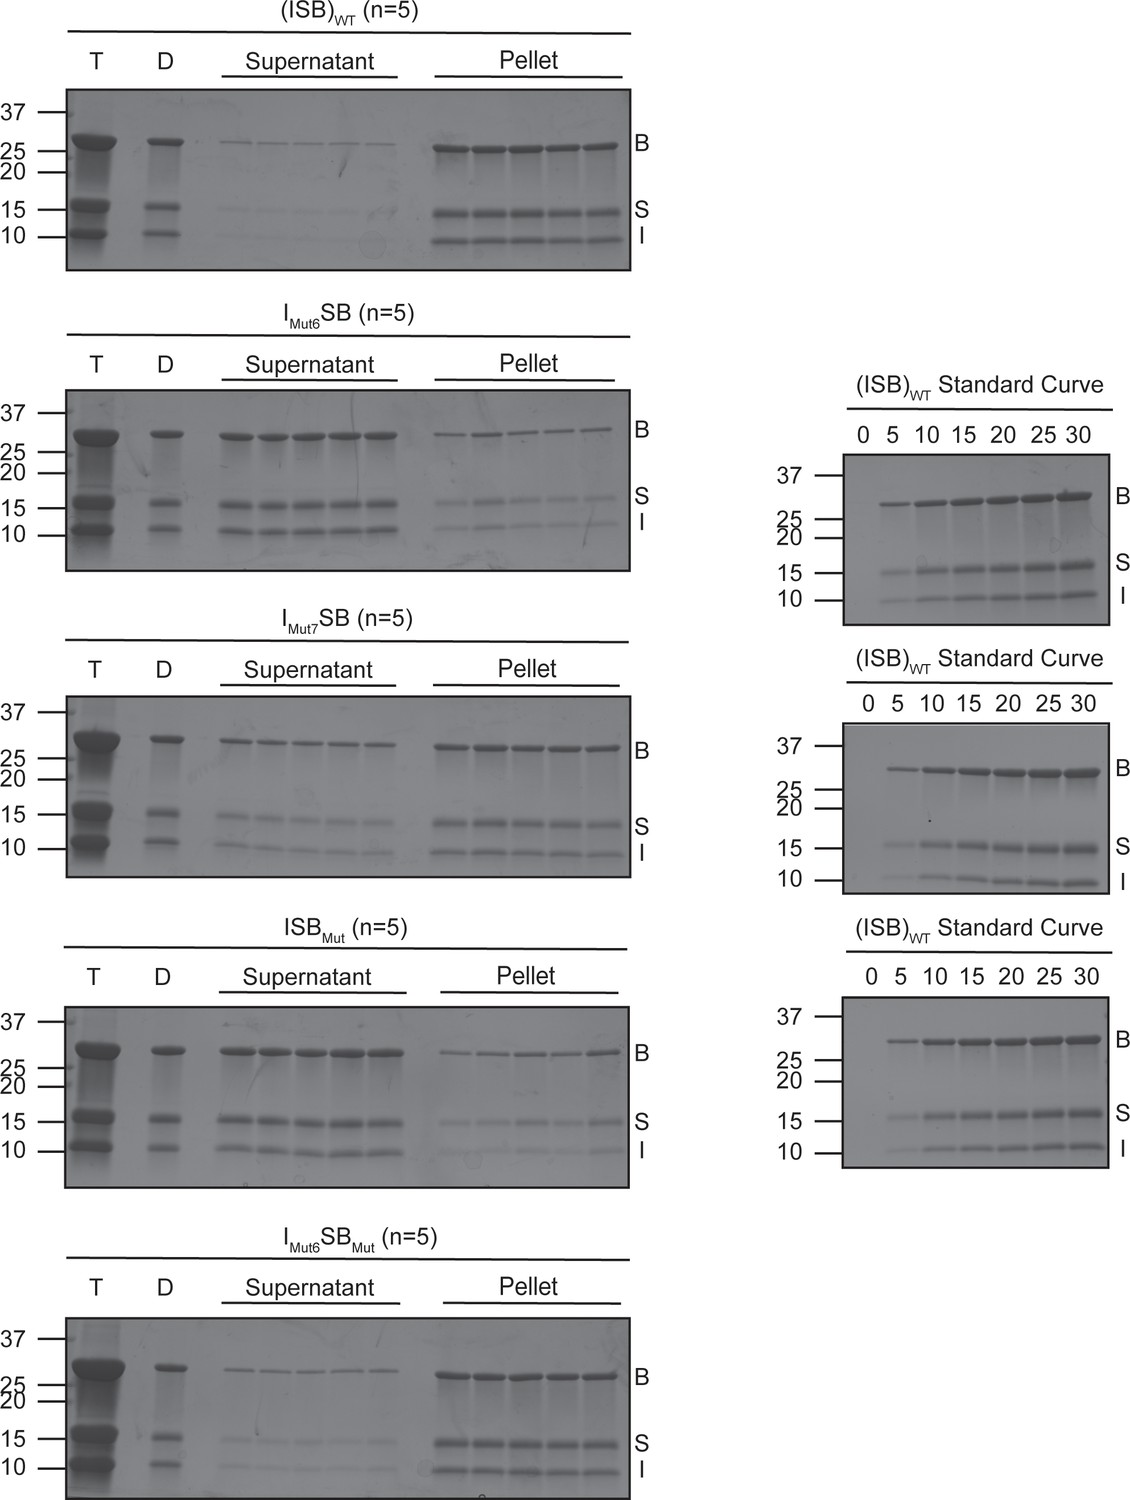
SDS-PAGE gels from saturation concentration experiment.
SDS-PAGE gels measuring saturation concentration of (ISB)WT, IMut6SB, IMut7SB, ISBMut, and IMut6SBMut in buffer containing 75 mM NaCl measured using spin-down method. N=5 for all samples. Bands were quantified via GelQuantNET. T=protein after thawing, D=phase-separated sample at 25 µM protein and 75 mM NaCl, B=Borealin, S=Survivin, I=INCENP.
-
Figure 5—figure supplement 1—source data 1
Data used to generate Figure 5—figure supplement 1.
- https://cdn.elifesciences.org/articles/92709/elife-92709-fig5-figsupp1-data1-v2.zip
Figure 5—figure supplement 2
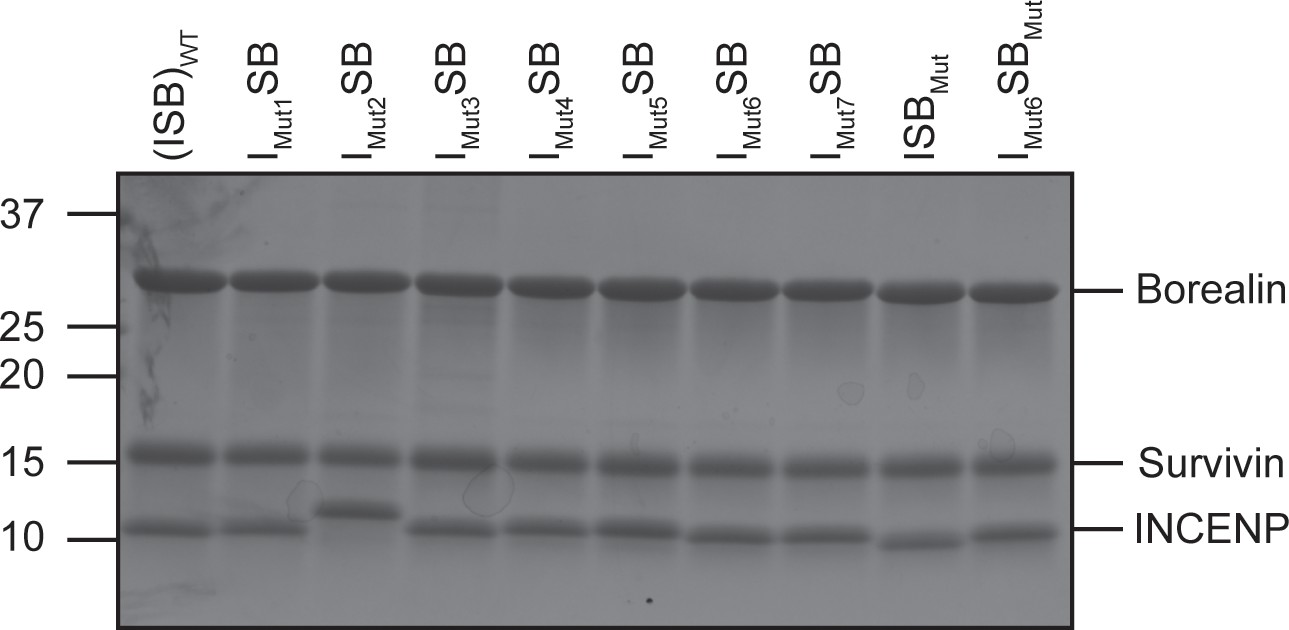
ISB-WT and mutant protein complexes (SDS-PAGE).
SDS-PAGE gel of WT and mutant protein complexes at 1.5 mg/mL.
-
Figure 5—figure supplement 2—source data 1
Data used to generate Figure 5—figure supplement 2.
- https://cdn.elifesciences.org/articles/92709/elife-92709-fig5-figsupp2-data1-v2.zip
Figure 6 with 2 supplements
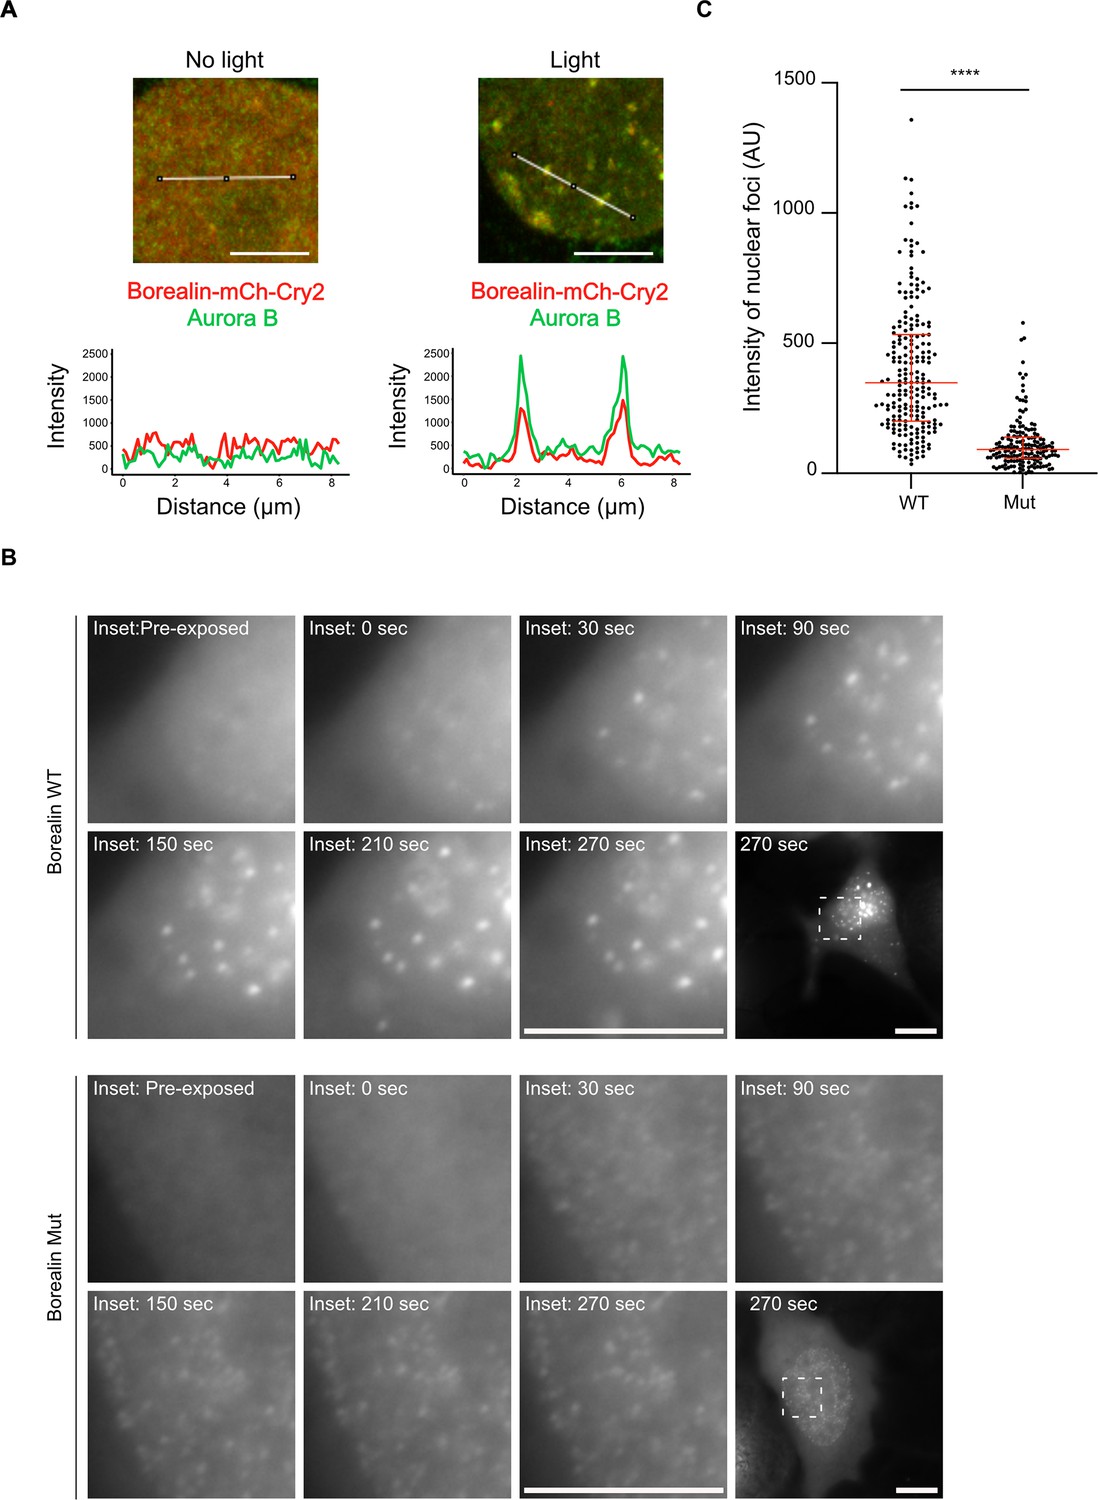
Disrupting salt-bridge residues in Borealin diminishes phase separation in cells.
(A) Endogenous Aurora B is recruited to nuclear Borealin foci upon exposure to 488 nm light. Images within the nucleus are shown (see Figure 6—figure supplement 1 for images of the entire cell for each of these enlarged views). The positions of the line scans (below) are indicated in the images by a white line. Scale bar = 5 μm. (B) Fluorescent detection of BorealinWT or BorealinMut, each fused to mCherry-Cry2 in an optoDroplet assay. Images were collected before and after (at the indicated timepoints) exposure to 488 nm light to induce Cry2 dimerization (note that the images were acquired with the same imaging conditions and scaled in the same manner for display). Scale bar = 10 μm. (C) Quantification of the intensity of foci. n=2 experiments, and 18 (WT) and 16 (Mut) cells. The results of an unpaired, non-parametric t-test, Mann-Whitney test is shown, wherein **** equates to a p-value <0.0001. The lines represent the median and the interquartile range.
Figure 6—figure supplement 1
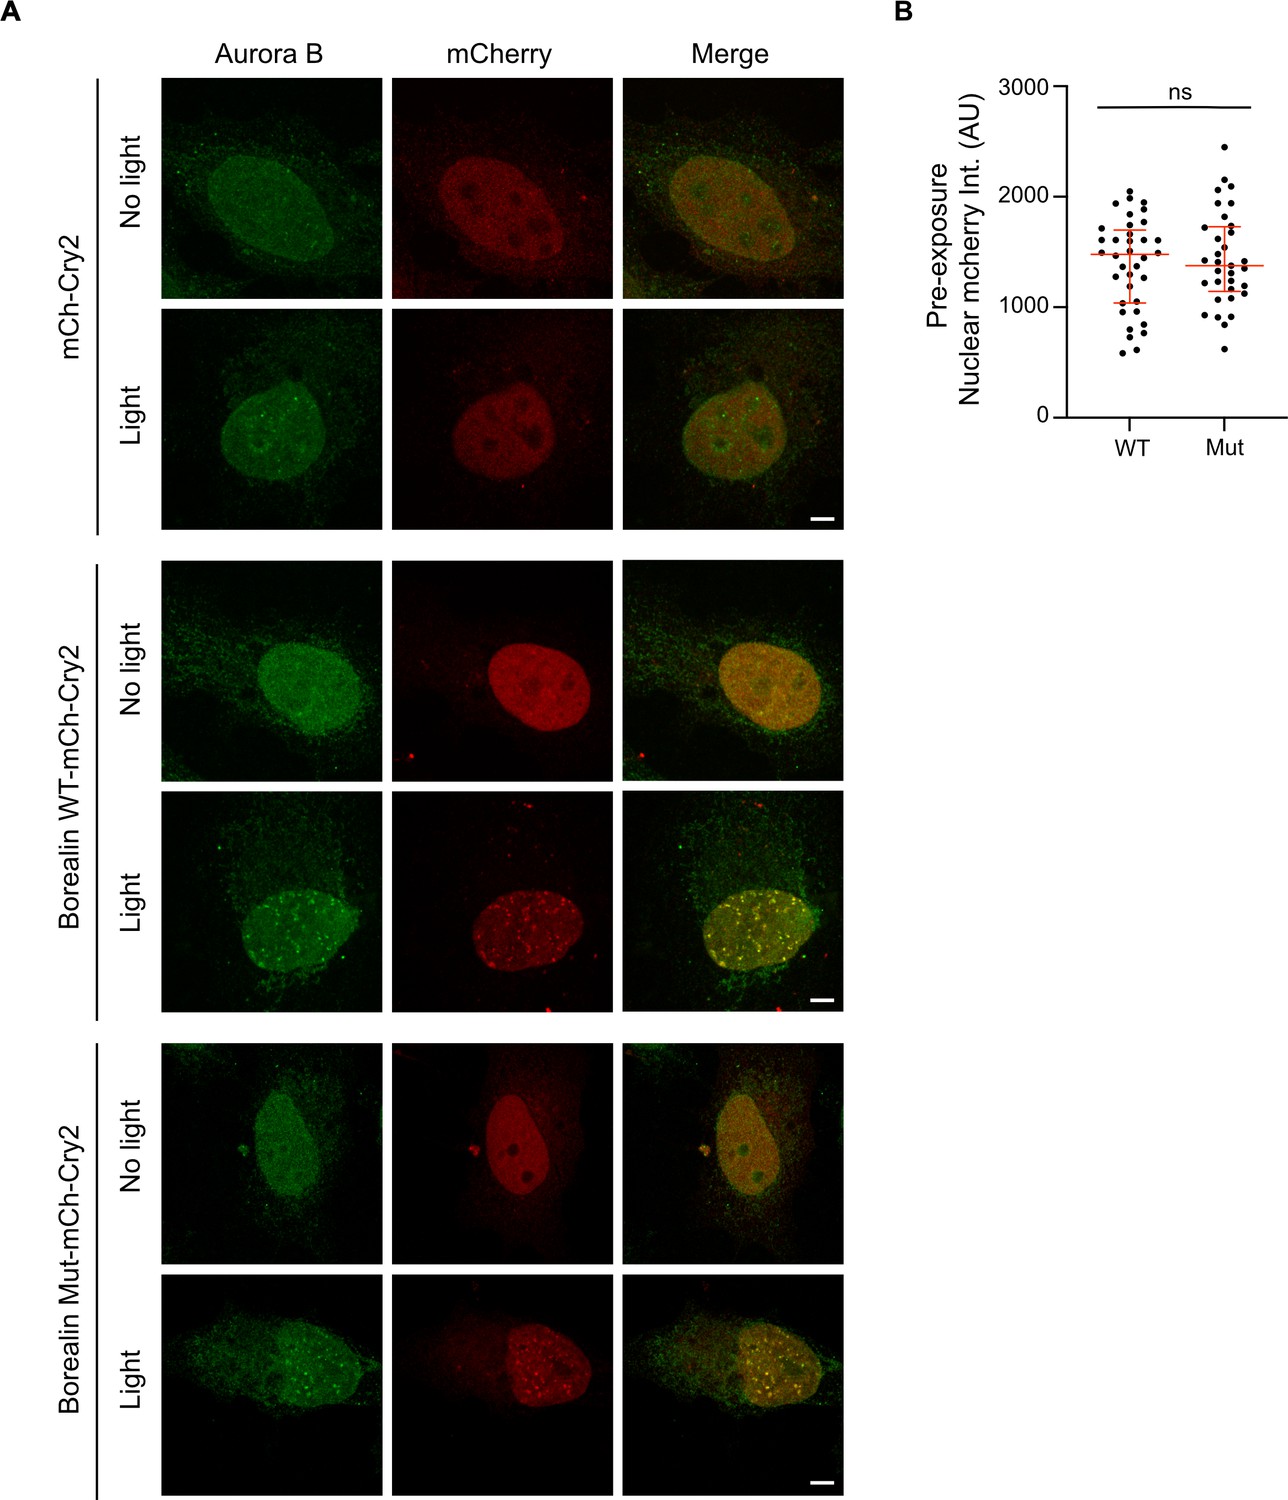
Endogenous Aurora B is recruited to Borealin-mCherry-Cry2 droplets in the nucleus upon exposure to white light.
(A) Cells expressing the indicated construct with and without exposure to white light were fixed and assessed for Aurora B and mCherry localization. Note that to expose the entire coverslip, the light in this experiment is performed on a light box for 10 min, which explains why the difference in intensity between wild-type and mutant versions is not as clear as in Figure 6 where a microscope was used to excite Cry2 in a controlled manner. Scale bar = 5 μm. (B) The intensities of BorealinWT-mCherry-Cry2 and BorealinMut-mCherry-Cry2-expressing cells were similar before exposure to light. Intensity measurements of mCherry channel in the nucleus of all cells measured in Figure 6B before light exposure as a control to show that the differences in intensity of the resulting foci were not a function of the amount of starting Borealin expression. Note the images were acquired with the same imaging conditions. Nuclear mCherry intensity per cell was quantified using ImageJ software, and plotted as a scatter plot. Nucleus: n=2 experiments, m=18 (WT) and m=16 (Mut) cells. The statistical significance was calculated using unpaired, non-parametric t-test, Mann-Whitney test, p-value 0.9192, ns. The lines represent the median and the interquartile range.
Figure 6—figure supplement 2
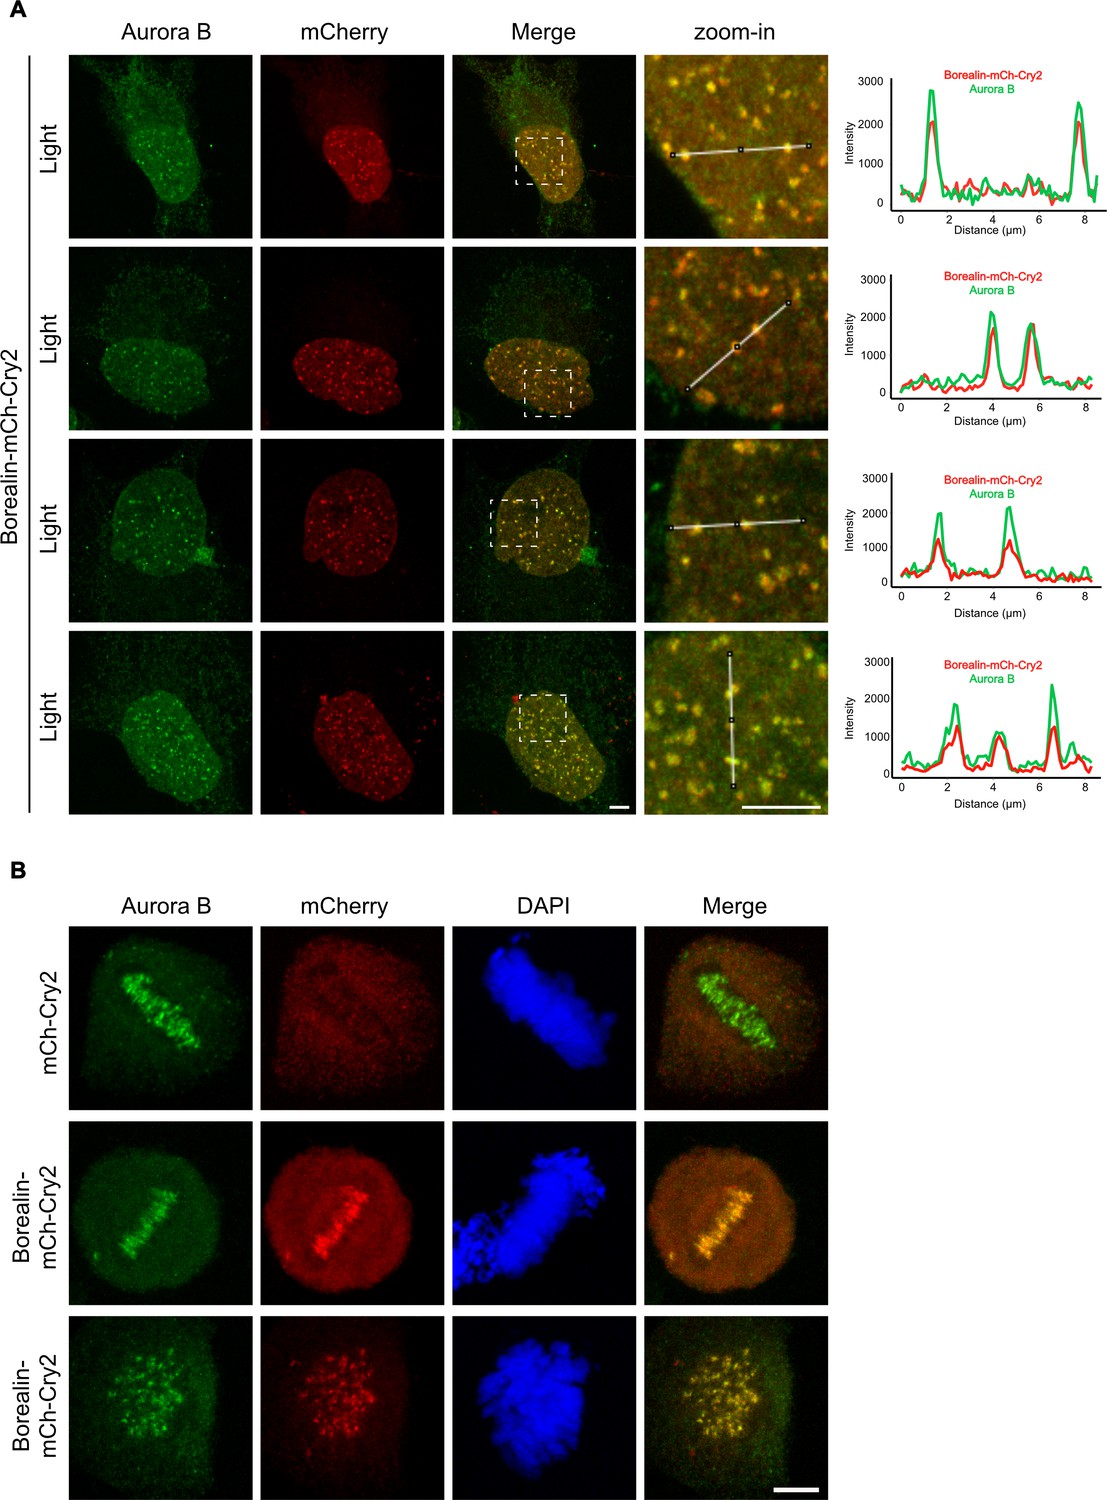
Evidence supporting the engagement of the Borealin-mCherry-Cry2 with the endogenous chromosome passenger complex (CPC).
(A) Borealin-mCherry-Cry2-expressing cells were exposed to white light analyzed as in Figure 6A and Figure 6—figure supplement 1. Scale bar = 5 μm. (B) Mitotic cells expressing the indicated constructs were fixed without exposure to white light and assessed for Aurora B and mCherry localization. Co-localization at the inner centromere was observed with Borealin-mCherry-Cry2 but not with mCherry-Cry2. Scale bar = 5 μm.
Figure 7
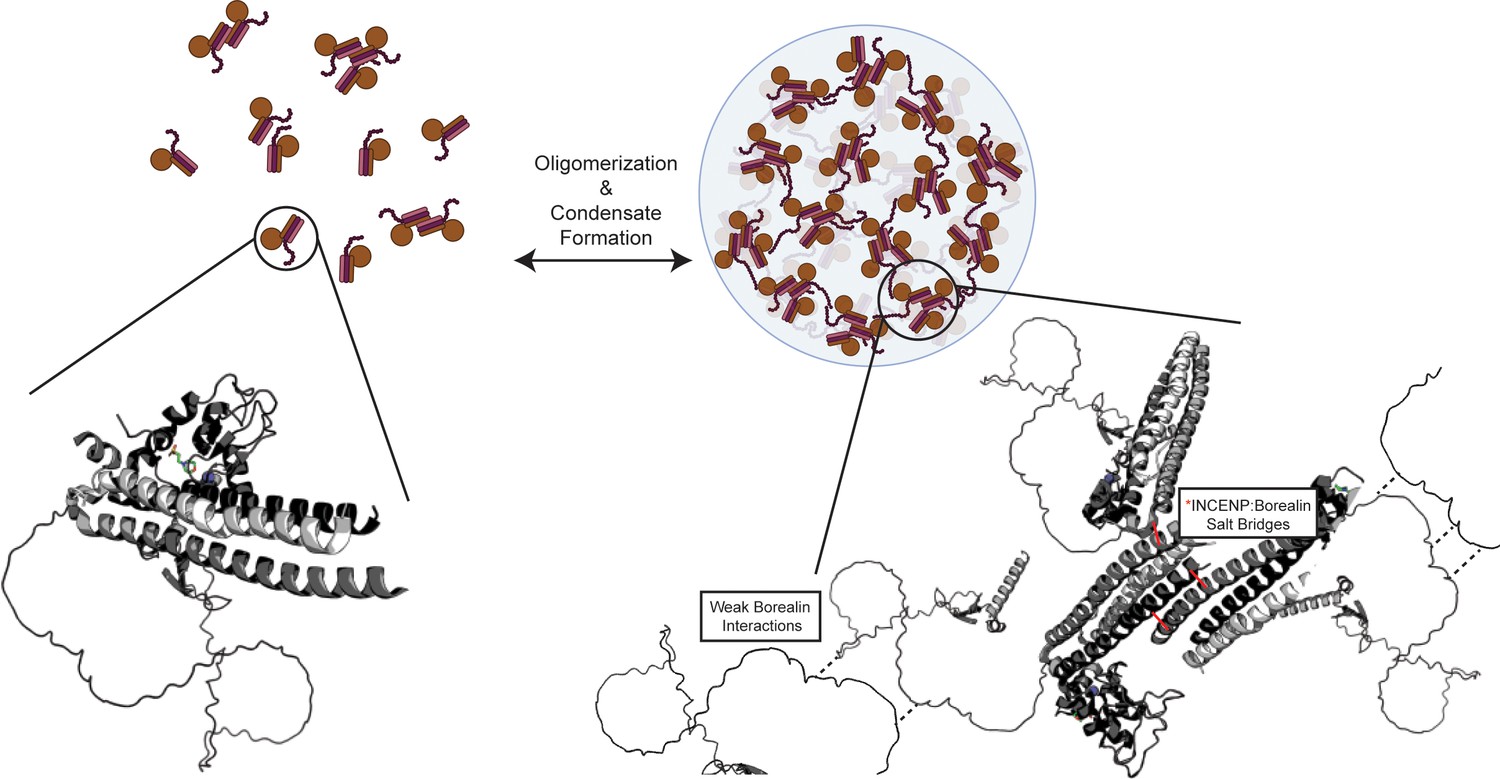
Summary model highlighting functionality of chromosome passenger complex (CPC) phase separation in cells.
Stabilized interactions defined by hydrogen/deuterium exchange mass spectrometry (HXMS) findings are indicated in solid black lines, while proposed weak interactions via Borealin loop are defined by dashed line. This model utilizes an AlphaFold prediction for the unstructured region of Borealin (Jumper et al., 2021; Varadi et al., 2022).
© 2024, BioRender Inc. Figure 7 was created using BioRender, and is published under a CC BY-NC-ND license. Further reproductions must adhere to the terms of this license.
Tables
Key resources table
| Reagent type (species) or resource | Designation | Source or reference | Identifiers | Additional information |
|---|---|---|---|---|
| Sequence-based reagent | WTISB_F | This Paper | PCR primer | 3’ - TGAGATCCGAATTCGAGCTCTAATTTTG - 5’ |
| Sequence-based reagent | WTISB_R | This paper | PCR primer | 3’ - GCTGTGATGATGATGATGATGGCTGCTG - 5’ |
| Sequence-based reagent | ISBMut6_F | This paper | PCR primer | 3’ - CTTGAGCGTATCCAAGAGGAGGCCCGACGCATGTTCACC - 5’ |
| Sequence-based reagent | ISBMut6_R | This paper | PCR primer | 3’ - GGTGAACATGCGTCGGGCCTCCTCTTGGATACGCTCAAG - 5’ |
| Sequence-based reagent | ISBMut7_F | This paper | PCR primer | 3’ - CGTATCCAAGAGCGAGCCGAGCGCATGTTCACCAGAGAA - 5’ |
| Sequence-based reagent | ISBMut7_R | This paper | PCR primer | 3’ - TTCTCTGGTGAACATGCGCTCGGCTCGCTCTTGGATACG - 5’ |
| Sequence-based reagent | WTISB_F_2 | This paper | PCR primer | 3’ - CCGTCTCGCCCAAATCTGCA - 5’ |
| Sequence-based reagent | WTISB_R_2 | This paper | PCR primer | 3’ - GCTGTGATGATGATGATGATGGCTGCTG - 5’ |
| Sequence-based reagent | IMut1SB_G_Block | This paper | Oligonucleotide | See Supplementary file 2 |
| Sequence-based reagent | IMut2SB_G_Block | This paper | Oligonucleotide | See Supplementary file 2 |
| Sequence-based reagent | IMut3SB_G_Block | This paper | Oligonucleotide | See Supplementary file 2 |
| Sequence-based reagent | IMut4SB_G_Block | This paper | Oligonucleotide | See Supplementary file 2 |
| Sequence-based reagent | IMut5SB_G _Block | This paper | Oligonucleotide | See Supplementary file 2 |
| Sequence-based reagent | ISBMut_G_Block | This paper | Oligonucleotide | See Supplementary file 2 |
| Sequence-based reagent | IMut6SBMut_G_Block | This paper | Oligonucleotide | See Supplementary file 2 |
| Strain, strain background (Escherichia coli) | Rosetta 2 (DE3) plysS | Novagen | 71403 | Electrocompetent cells |
| Cell line (Homo sapiens) | T-Rex HeLa Cell Line | Thermo Fisher Scientific | R71407 | |
| Recombinant DNA reagent | pET28a_ISB | Trivedi et al., 2019 | 6xHis-INCENP1-58, FL Survivin and FL Borealin | |
| Commercial assay, kit | NEB Hifi DNA Assembly Kit | New England Biolabs | E5520S | For molecular cloning |
| Other | HisTrap HP Column | Cytiva/GE Life Sciences | 17524801 | For protein purification |
| Other | Hi-Load 16/60 Superdex-200 pg | Cytiva/GE Life Sciences | 28989335 | For protein purification |
| Other | C18 HPLC Column, 0.3×75 mm2 | Agilent | For HXMS experimentation | |
| Other | TARGA C8 5 µM Piccolo HPLC column | Higgins Analytical | For HXMS experimentation | |
| Other | Leica DMI6000 B | Leica Microsystems | For differential interference contrast microscopy | |
| Other | Discovery M120SE Sorvall Ultracentrifuge | New Life Scientific | For sedimentation and saturation concentration assays | |
| Other | LTQ Orbitrap XL Mass Spectrometer | Thermo Fisher Scientific | For HXMS data acquisition | |
| Other | Exactive Plus EMR Orbitrap Mass Spectrometer | Thermo Fisher Scientific | For HXMS data acquisition | |
| Other | NanoDrop 2000 UV-Vis Spectrophotometer | Thermo Fisher Scientific | ND2000CLAPTOP | For turbidity measurements |
| Other | Zeiss Observer-Z1 Microscope | Zeiss | For optoDroplet assay | |
| Software | XCalibur | Thermo Fisher Scientific | OPTON-30965 | For HXMS data acquisition |
| Software | ExMS2 | Kan et al., 2019 | For HXMS data processing | |
| Software | MATLAB | Mathworks | For HXMS data processing | |
| Software | RStudio | Posit | For HXMS data processing | |
| Software | Bioworks 3.3 | Thermo Fisher Scientific | For HXMS data processing | |
| Software | HDExaminer | Sierra Analytics | For HXMS data processing | |
| Software | GelQuant Express Analysis Software | Fisher Scientific | For densitometry measurements | |
| Software | Fiji (ImageJ) | National Institutes of Health (NIH) | To analyze images | |
| Software | Prism | GraphPad | For data processing |
Additional files
-
Supplementary file 1
Hydrogen-deuterium exchange mass spectrometry summary table for ISB free protein and ISB droplet protein datasets.
- https://cdn.elifesciences.org/articles/92709/elife-92709-supp1-v2.xlsx
-
Supplementary file 2
List of gene block sequences used to produce IMut1SB, IMut2SB, IMut3SB, IMut4SB, IMut5SB, ISBMut, and IMut6SBMut mutant proteins.
- https://cdn.elifesciences.org/articles/92709/elife-92709-supp2-v2.docx
-
MDAR checklist
- https://cdn.elifesciences.org/articles/92709/elife-92709-mdarchecklist1-v2.pdf
Download links
A two-part list of links to download the article, or parts of the article, in various formats.
Downloads (link to download the article as PDF)
Open citations (links to open the citations from this article in various online reference manager services)
Cite this article (links to download the citations from this article in formats compatible with various reference manager tools)
Structural basis for the phase separation of the chromosome passenger complex
eLife 13:e92709.
https://doi.org/10.7554/eLife.92709


