The Listeria monocytogenes persistence factor ClpL is a potent stand-alone disaggregase
- Center for Molecular Biology of Heidelberg University (ZMBH), DKFZ-ZMBH Alliance, Germany
- Structural and Computational Biology Unit, European Molecular Biology Laboratory (EMBL) Heidelberg, Germany
- Heidelberg University Biochemistry Center (BZH), Germany
- Chair of Biochemistry IV, Biophysical Chemistry, University of Bayreuth, Germany
Figures
Figure 1 with 2 supplements
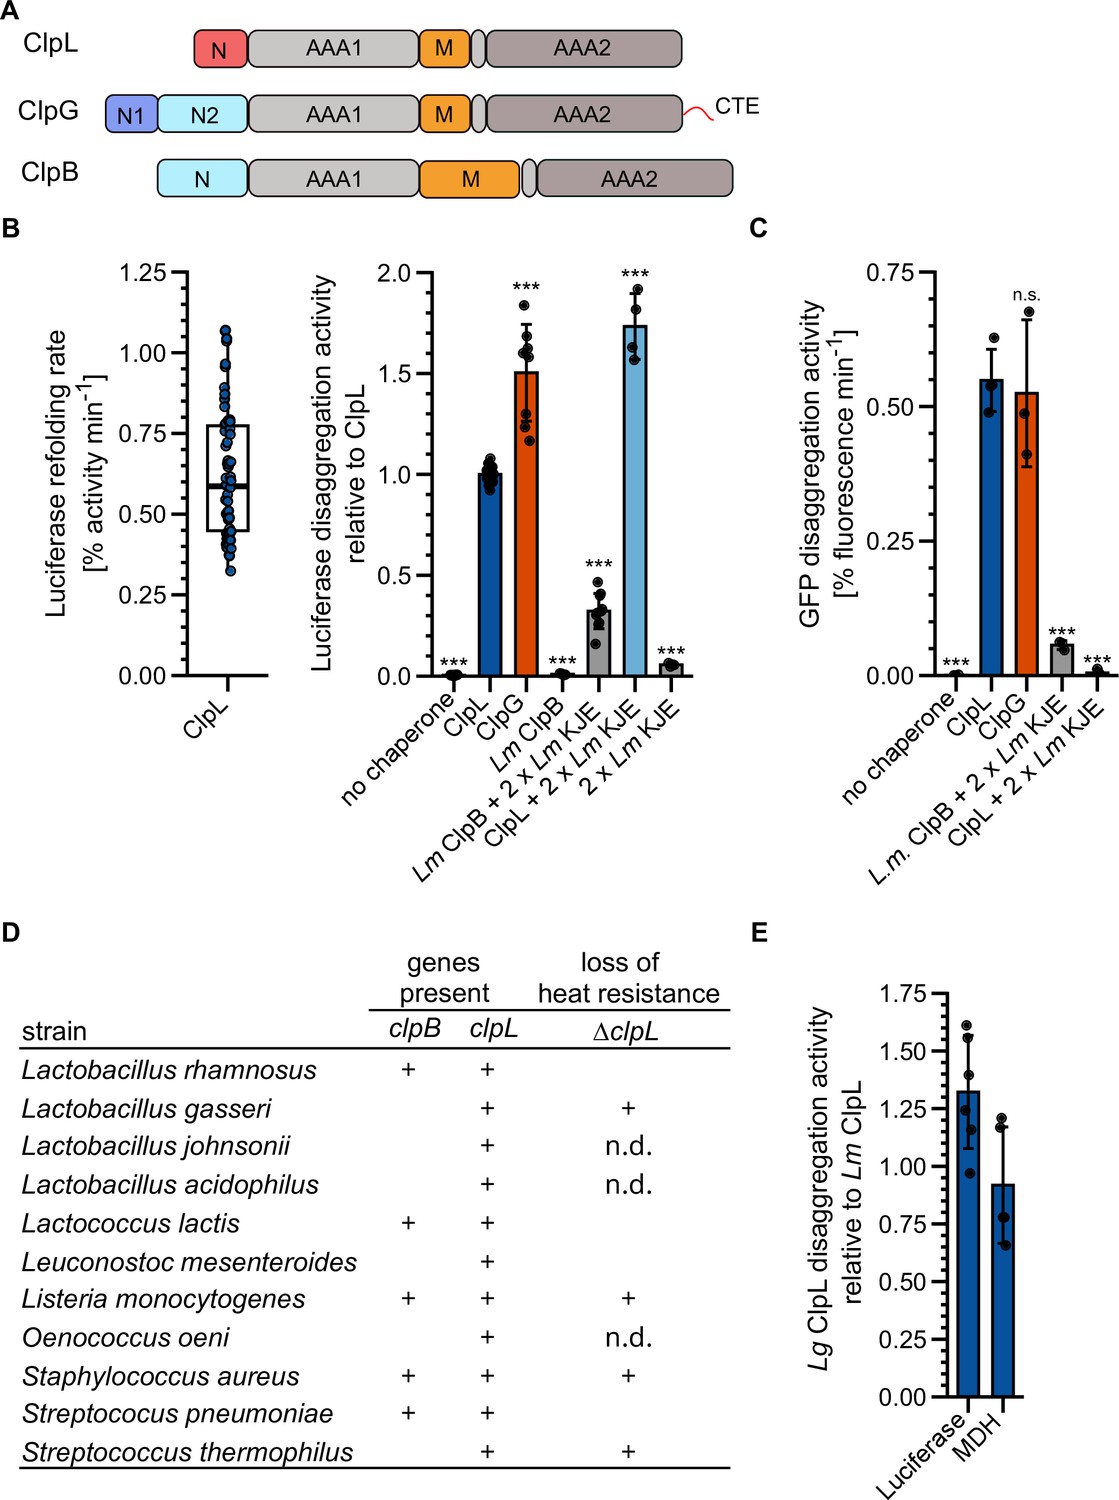
ClpL is an autonomous disaggregase.
(A) Domain organizations of ClpL, ClpG, ClpB. All AAA+ proteins consist of two AAA domains (AAA1, AAA2), a coiled-coil middle domain (M) and diverse N-terminal domains (N). ClpG additionally harbors a disordered C-terminal extension (CTE). (B) Left: Luciferase disaggregation activity (% refolding of aggregated luciferase/min) of Lm ClpL was determined. Right: Relative luciferase disaggregation activities of indicated disaggregation systems were determined. KJE: DnaK/DnaJ/GrpE. The disaggregation activity of Lm ClpL was set to 1. (C) GFP disaggregation activities (% refolding of aggregated GFP/min) of indicated disaggregation systems were determined. (D) Occurrence of ClpB and ClpL disaggregases in selected Gram-positive bacteria. Loss of heat resistance upon clpL deletion in bacteria harboring solely ClpL is indicated. n.d.: not determined. (E) Relative luciferase and malate dehydrogenase (MDH) disaggregation activities (each: % regain of enzymatic activity/min) of Lactobacillus gasseri (Lg) ClpL. Disaggregation activities of Lm ClpL were set to 1. Shown is a boxplot (B) or data points and mean ± SD (B/C/E), n≥3. Statistical analysis: one-way ANOVA, Welch’s test for post hoc multiple comparisons. Significance levels: *p<0.05; **p<0.01; ***p<0.001. n.s.: not significant.
Figure 1—figure supplement 1
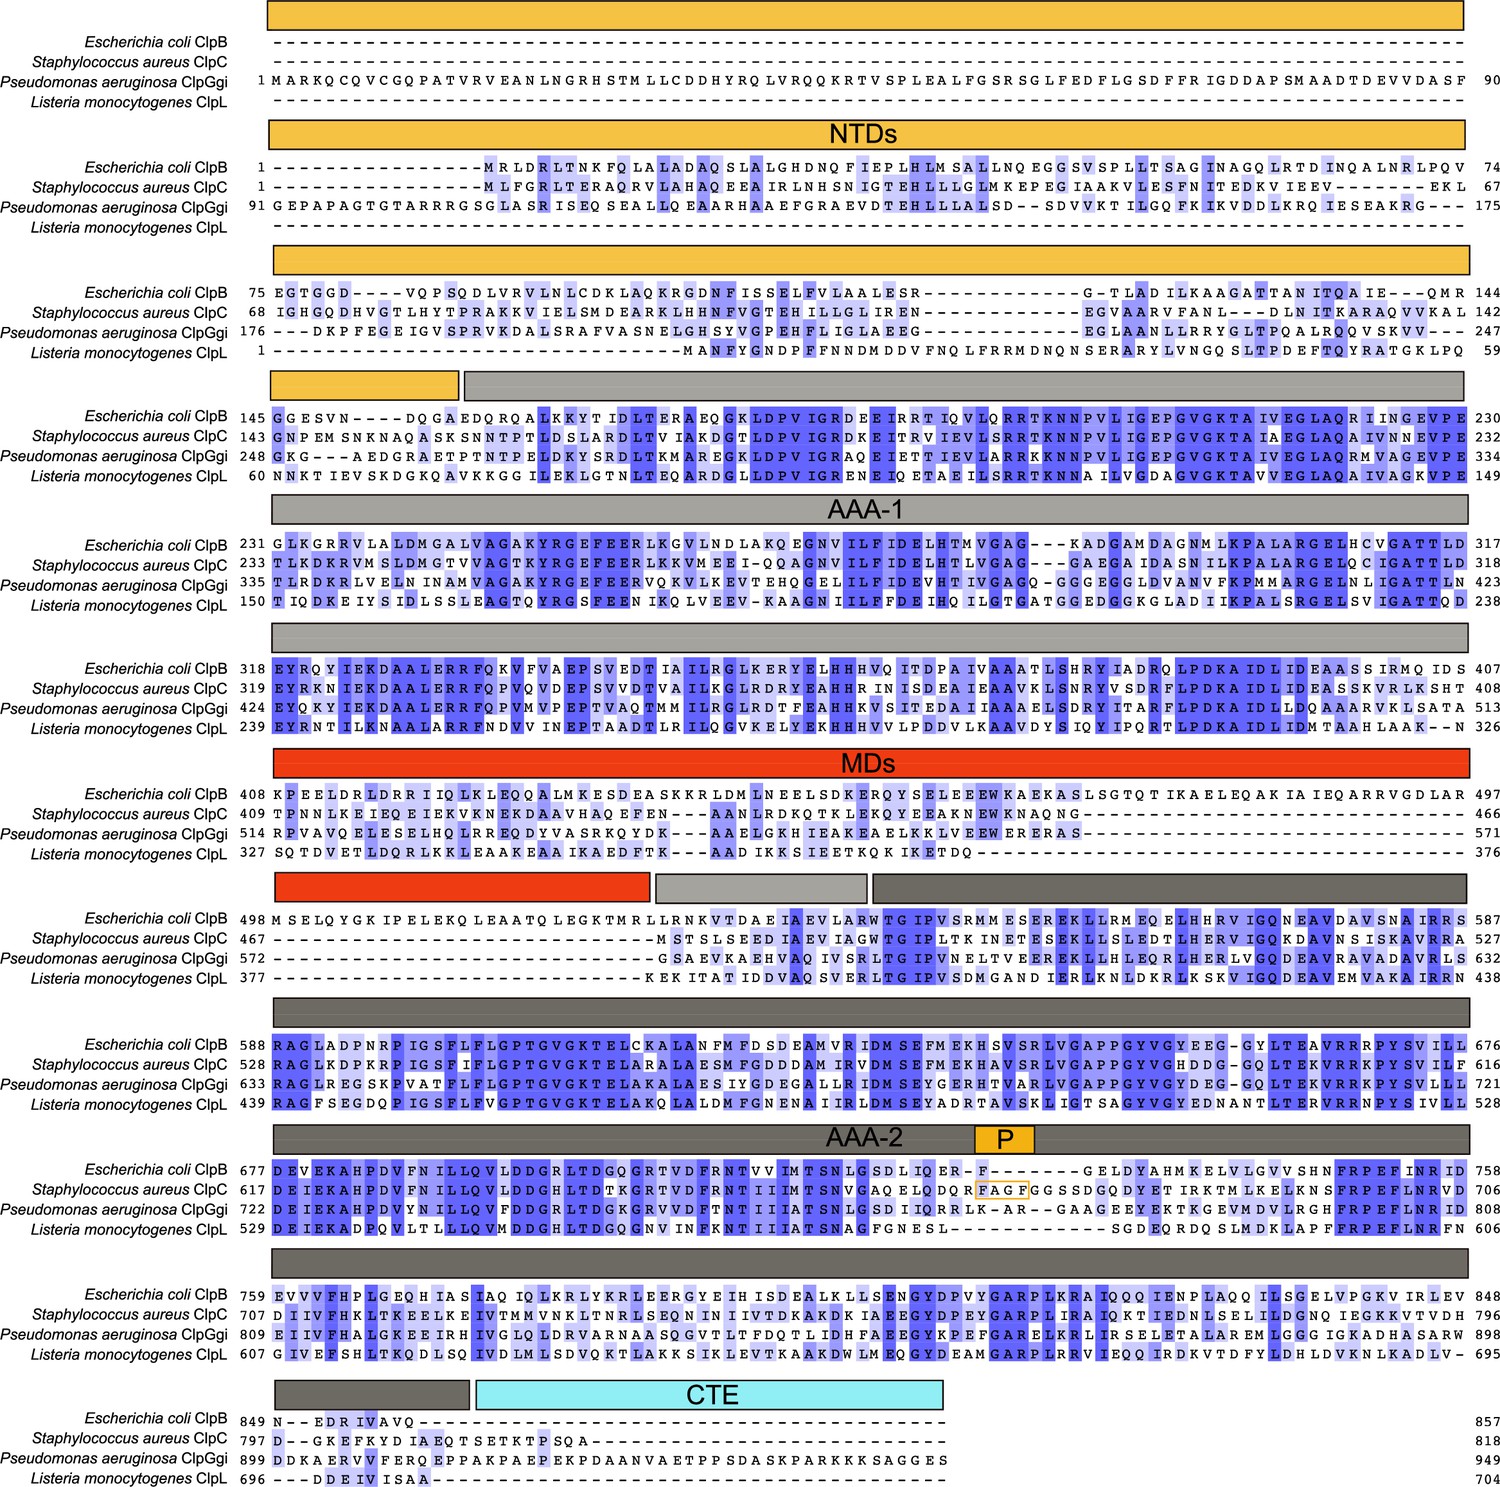
Sequence alignment of Escherichia coli ClpB, S. aureus ClpC, P. aeruginosa ClpGGI, and L. monocytogenes ClpL.
The domain organization is indicated. Similar and identical residues are highlighted in light and dark blue.
Figure 1—figure supplement 2
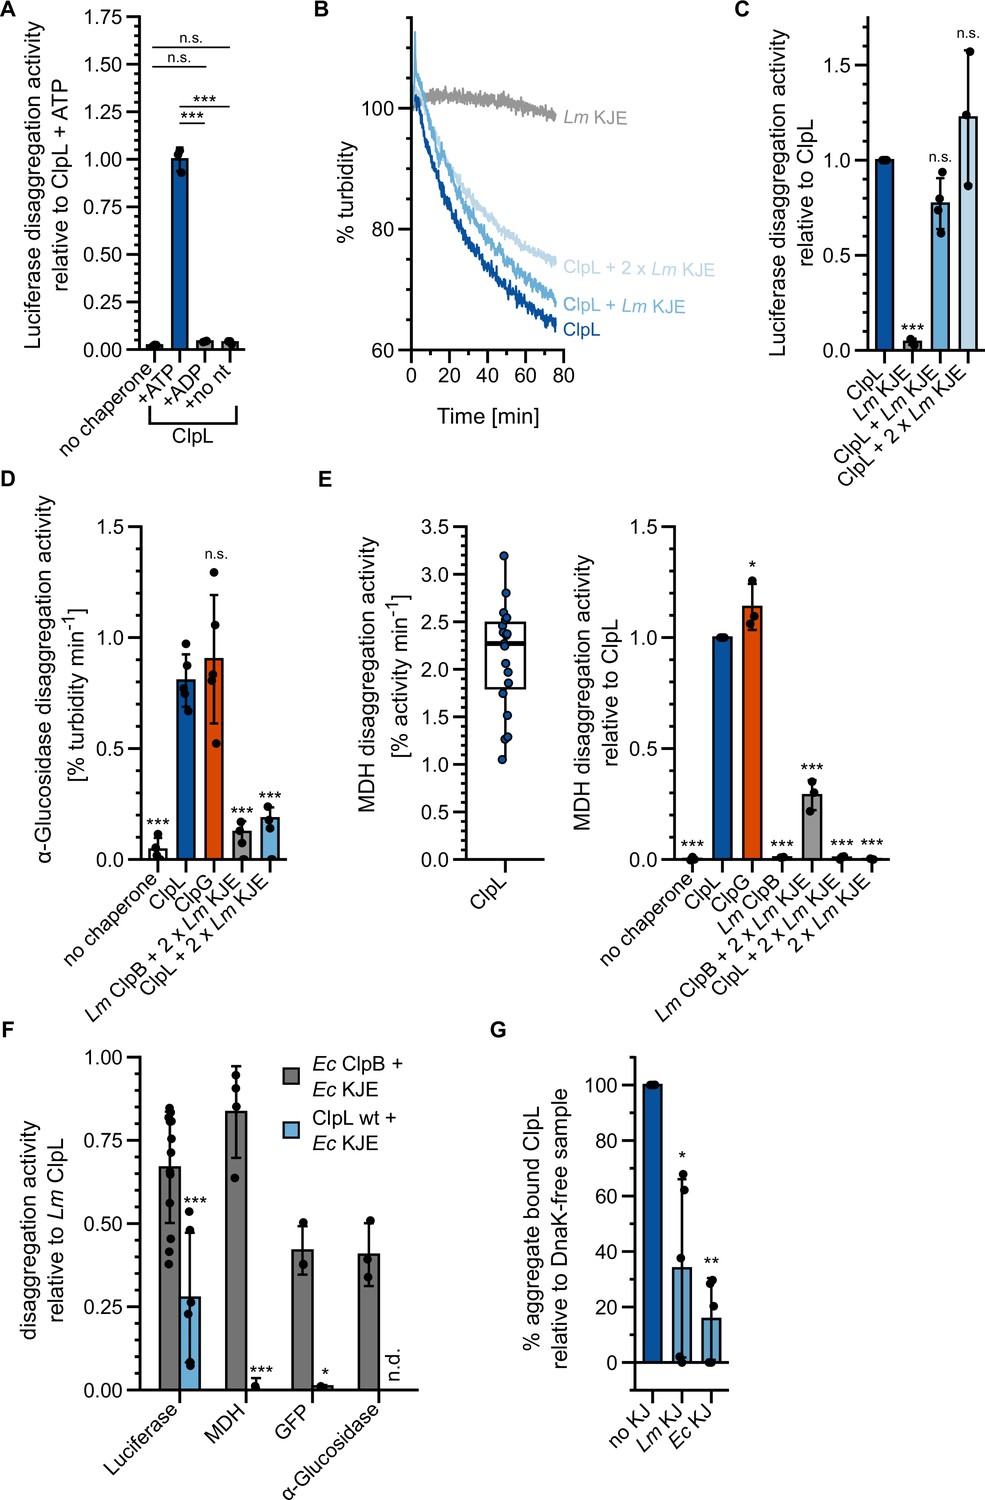
ClpL is a potent, stand-alone disaggregase.
(A) Relative luciferase disaggregation activities (% refolded luciferase/min) of ClpL in the presence of 2 mM ATP (and a regeneration mix), 2 mM ADP and without nucleotide were determined. The disaggregation activity of ClpL wild-type (WT) (+ATP) was set to 1. (B) Disaggregation of aggregated luciferase was monitored by turbidity measurements in the presence of indicated chaperones. KJE: DnaK/DnaJ/GrpE. Initial turbidity was set to 100%. (C) Relative luciferase disaggregation activities (% turbidity/min) were determined for indicated chaperone combinations. The disaggregation activity of ClpL was set to 1. (D) Relative α-glucosidase disaggregation activities (% turbidity/min) were determined in the presence of indicated chaperones. Initial turbidity of α-glucosidase aggregates was set to 100%. Disaggregation activity of ClpL was set to 1. (E) Left: Malate dehydrogenase (MDH) disaggregation activity of ClpL (% refolded MDH/min). Right: Relative MDH disaggregation activities of indicated chaperones were determined. The activity of ClpL was set to 1. (F) Relative disaggregation activities of indicated chaperone combinations toward aggregated luciferase, MDH, GFP, and α-glucosidase were determined. The activity of ClpL was set to 1. n.d.: not determined. (G) ATPase-deficient ClpL-E197A/E530A with and without the Lm/Ec DnaK system (KJ) was incubated with aggregated MDH in the presence of ATP. The extent of aggregate binding (% total protein) was determined by co-sedimentation upon centrifugation. Percentage of aggregate bound ClpL without KJ was set to 1. Shown are representative curves (A), a boxplot (D), or data points and mean ± SD (B/C/D/E), n≥3. Statistical analysis: one-way ANOVA, Welch’s test for post hoc multiple comparisons. Significance levels: *p<0.05; **p<0.01; ***p<0.001. n.s.: not significant.
Figure 2 with 1 supplement
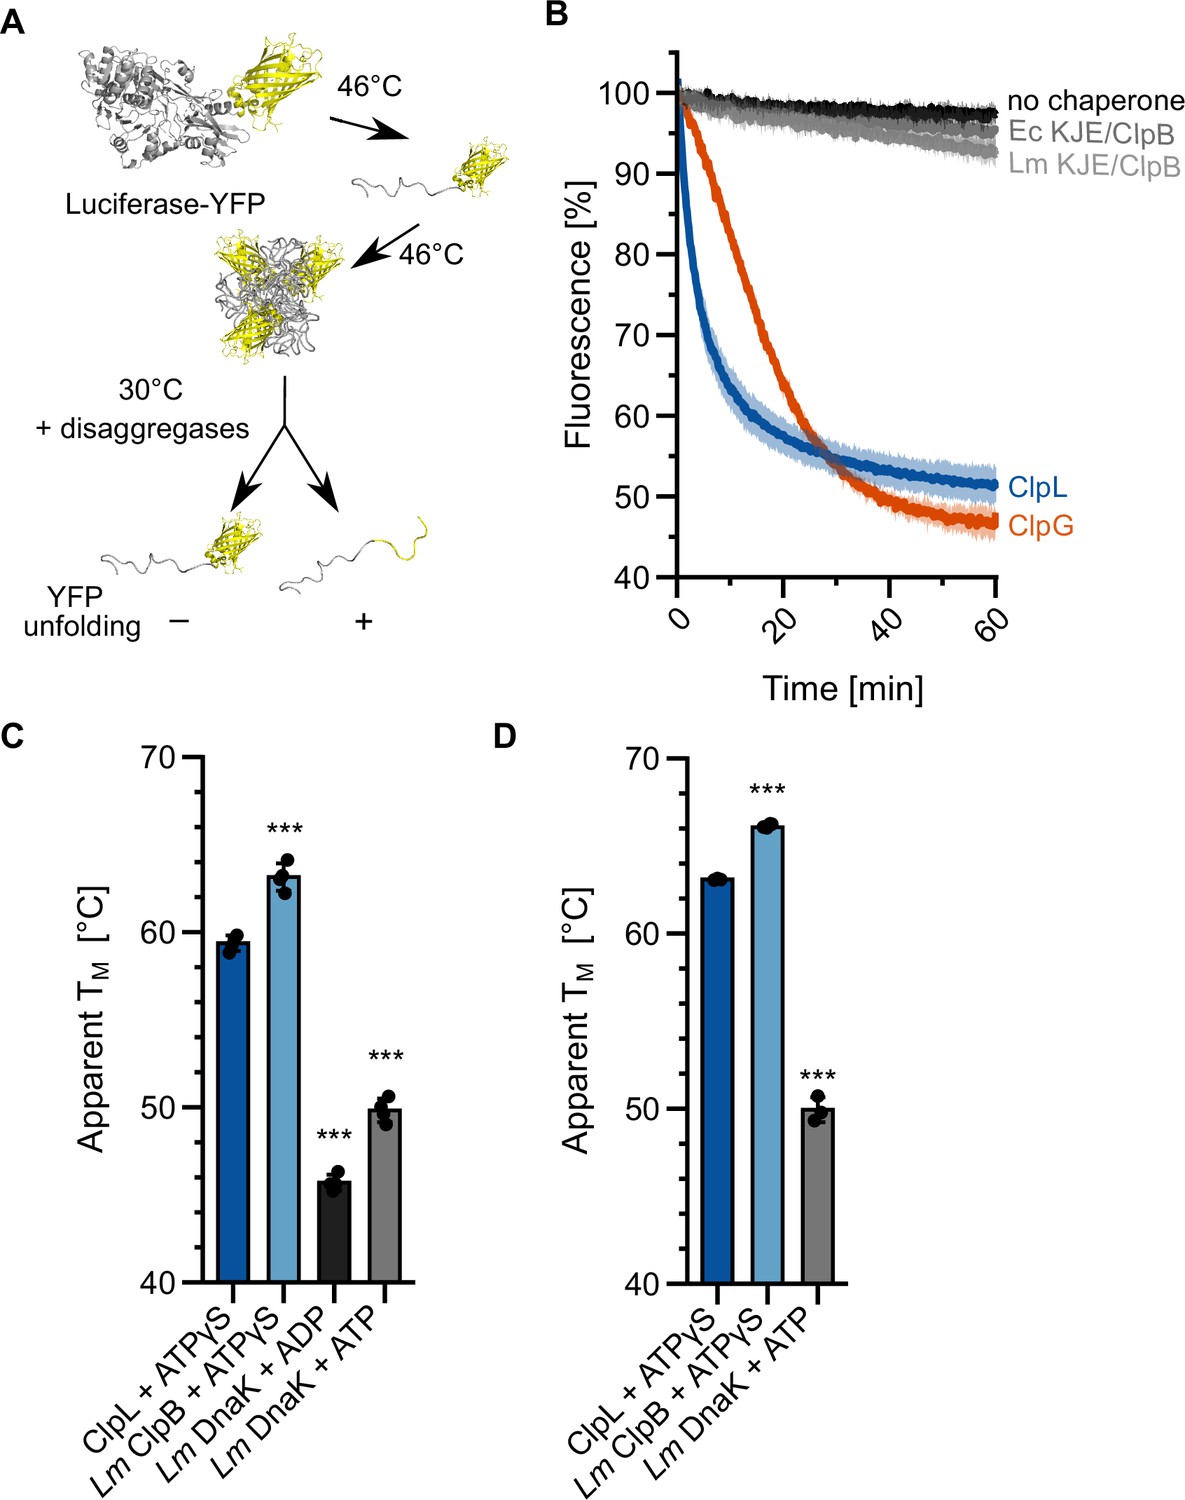
Specific molecular features separate ClpL from ClpB/DnaK.
(A) Incubation of luciferase-YFP at 46°C only leads to unfolding of the luciferase moiety and the formation of mixed aggregates including folded YFP. Unfolding of YFP during disaggregation of aggregated luciferase-YFP reports on threading power. (B) Aggregated luciferase-YFP was incubated in the presence of indicated disaggregation machineries and YFP fluorescence was recorded. Initial YFP fluorescence was set at 100%. (C/D) Melting temperatures of ClpL, L. monocytogenes (Lm) ClpB, and Lm DnaK were determined in the presence of indicated nucleotides by SYPRO Orange binding (C) or nanoDSF (D). Shown are mean curves ± SD (B) or data points and mean ± SD (C/D), n≥3. Statistical analysis: one-way ANOVA, Welch’s test for post hoc multiple comparisons. Significance levels: *p<0.05; **p<0.01; ***p<0.001. n.s.: not significant.
Figure 2—figure supplement 1

Unfolding of DnaK at high temperatures is reversible.
Relative luciferase disaggregation activities (% refolded luciferase/min) of ClpL and L. monocytogenes (Lm) ClpB/KJE were determined. ClpL or DnaK were incubated for 30 min at the indicated temperatures prior to the luciferase disaggregation performed at 30°C. The 30°C condition was set to 1 for each chaperone respectively. Shown are mean curves ± SD (A) or data points and mean ± SD (B), n≥3. Statistical analysis: one-way ANOVA, Welch’s test for post hoc multiple comparisons. Significance levels: *p<0.05; **p<0.01; ***p<0.001. n.s.: not significant.
Figure 3 with 2 supplements
The ClpL N-terminal domain (NTD) is essential for disaggregation activity.
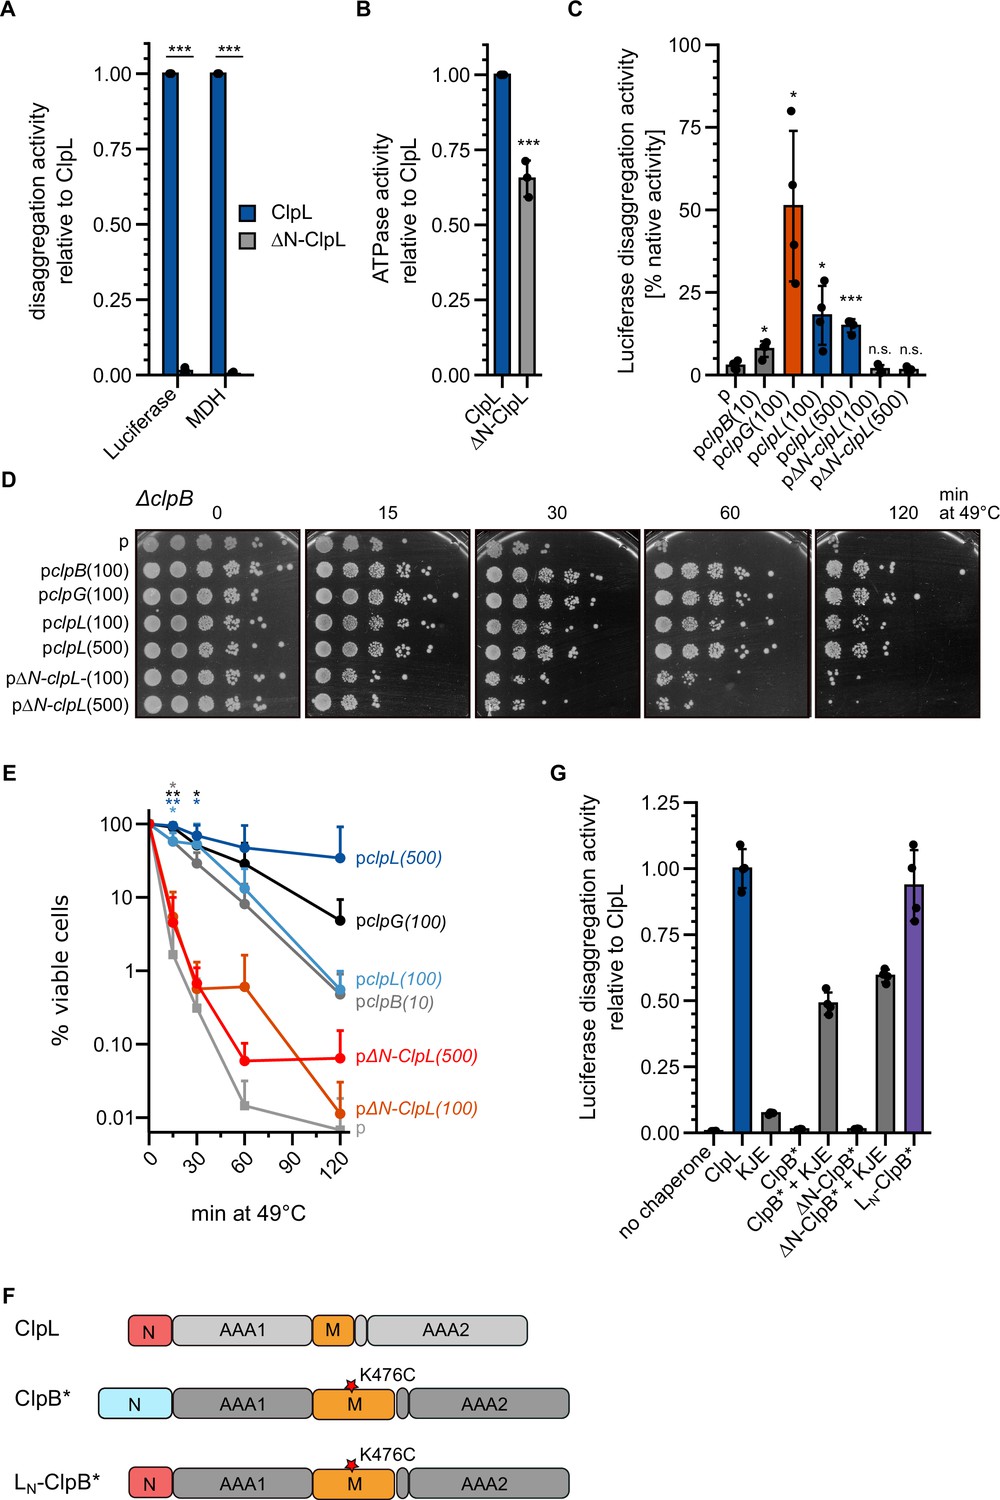
(A) Disaggregation activities of ClpL and ΔN-ClpL toward aggregated luciferase and malate dehydrogenase (MDH) (each: % regain enzymatic activity/min) were determined. The activity of ClpL was set to 1. (B) ATPase activities of ClpL and ClpL-ΔN were determined. The ATPase activity of ClpL was set to 1. (C) E. coli ΔclpB cells harboring plasmids for constitutive expression of luciferase and IPTG-controlled expression of indicated disaggregases were grown at 30°C to mid-logarithmic growth phase and heat shocked to 46°C for 15 min. Luciferase activities prior to heat shock were set to 100%. The regain of luciferase activity was determined after a 120 min recovery period at 30°C. 10/100/500: μM IPTG added to induce disaggregase expression. p: empty vector control. (D) E. coli ΔclpB cells harboring plasmids for expression of indicated disaggregases were grown at 30°C to mid-logarithmic growth phase and shifted to 49°C. Serial dilutions of cells were prepared at the indicated time points, spotted on LB plates, and incubated at 30°C. 10/100/500: μM IPTG added to induce disaggregase expression. p: empty vector control. (E) Quantification of data from (D). (F) Domain organization of the ClpL-ClpB chimera LN-ClpB*. ClpB* harbors the K476C mutation in its M-domain, abrogating ATPase repression. (G) Relative luciferase disaggregation activities (% refolded luciferase/min) of indicated disaggregation machineries were determined. The disaggregation activity of ClpL was set to 1. Shown are mean curves and data points (E) or data points and mean ± SD (A/B/C/G), n≥3. Statistical analysis: one-way ANOVA, Welch’s test for post hoc multiple comparisons. Significance levels: *p<0.05; **p<0.01; ***p<0.001. n.s.: not significant.
Figure 3—figure supplement 1

ClpL disaggregation activity relies on ATP-fueled substrate threading.
(A) Domain organization of ClpL. Pore loop (Y170, Y504) and Walker B (E197, E530) residues of AAA1 and AAA2 domains are indicated. (B) ClpL ATPase activities were determined at 0.125 and 1 μM protein concentrations. (C) Relative ATPase activities of ClpL wild-type (WT) and indicated mutants were determined at 1 µM protein concentration. The ATPase activity of ClpL-WT was set to 1. (D) Relative luciferase disaggregation activities (% refolded luciferase/min) of ClpL-WT and indicated mutants were determined. The activity of ClpL-WT was set to 1. Shown are boxplots (B) or data points and mean ± SD (C/D), n≥3. Statistical analysis: one-way ANOVA, Welch’s test for post hoc multiple comparisons. Significance levels: *p<0.05; **p<0.01; ***p<0.001. n.s.: not significant.
Figure 3—figure supplement 2
The ClpL N-terminal domain (NTD) is crucial for disaggregation activity.
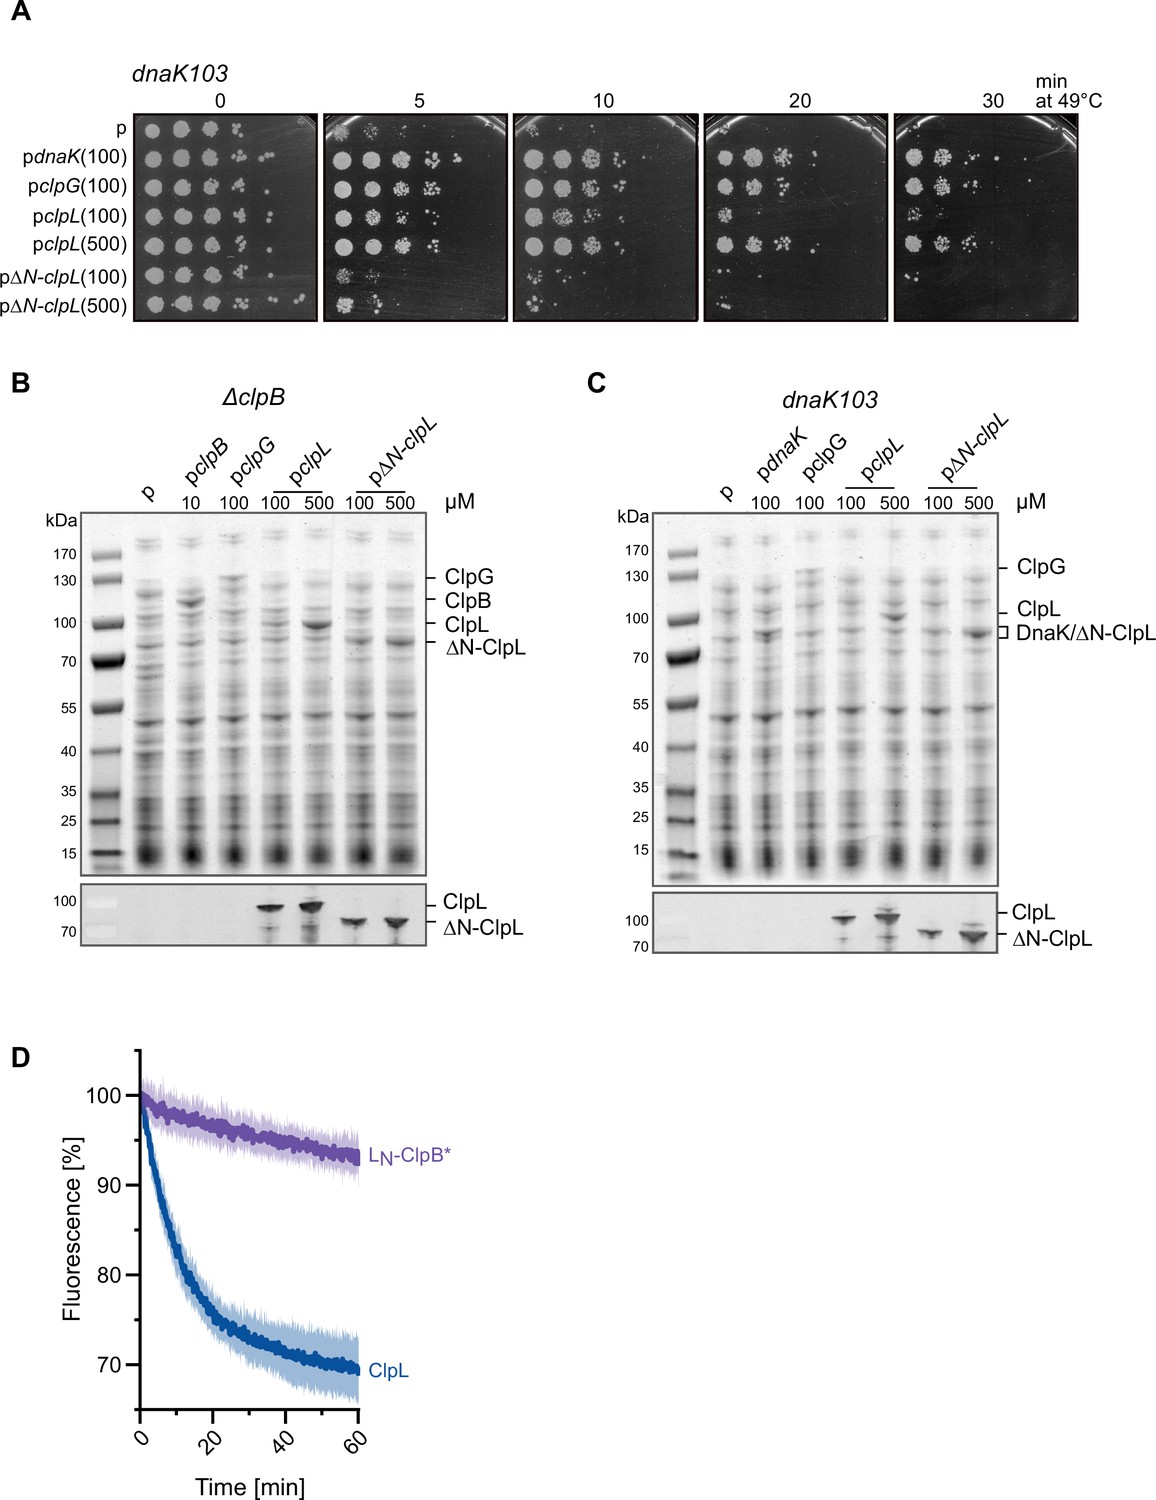
(A) E. coli dnaK103 cells harboring plasmids for IPTG-controlled expression of indicated disaggregases were grown at 30°C to mid-logarithmic growth phase and shifted to 49°C. Serial dilutions of cells were prepared at indicated time points, spotted on LB plates, and incubated at 30°C. 100/500: μM IPTG added to induce disaggregase expression. p: empty vector control. (B–C) Production levels of disaggregases (ClpB, DnaK, ClpG, ClpL, ClpL-ΔN) in E. coli ΔclpB (B) and dnaK103 (C) mutant cells. Cells were grown at 30°C for 1.5 hr and disaggregase expression was induced by the addition of indicated IPTG concentrations (μM) for 2 hr. Total cell extracts were prepared and levels of disaggregases were determined SDS-PAGE followed by Coomassie staining. ClpL levels were additionally determined by western blot analysis using ClpL-specific antibodies. p: empty vector control. (D) The ClpL NTD does not increase ClpB* threading power to ClpL levels. Aggregated luciferase-YFP was incubated in the presence of ClpL or LN-ClpB* and YFP fluorescence was recorded. Initial YFP fluorescence was set at 100%. Shown are mean curves ± SD, n≥3.
-
Figure 3—figure supplement 2—source data 1
Source data include non-cropped and non-processed images of SDS-gels and western blots.
- https://cdn.elifesciences.org/articles/92746/elife-92746-fig3-figsupp2-data1-v2.zip
-
Figure 3—figure supplement 2—source data 2
Source data include non-cropped and non-processed images of SDS-gels and western blots and indicate sections and loading schemata of the respective figure supplement.
- https://cdn.elifesciences.org/articles/92746/elife-92746-fig3-figsupp2-data2-v2.zip
Figure 4 with 2 supplements
Molecular basis of ClpL N-terminal domain (NTD) binding to protein aggregates.
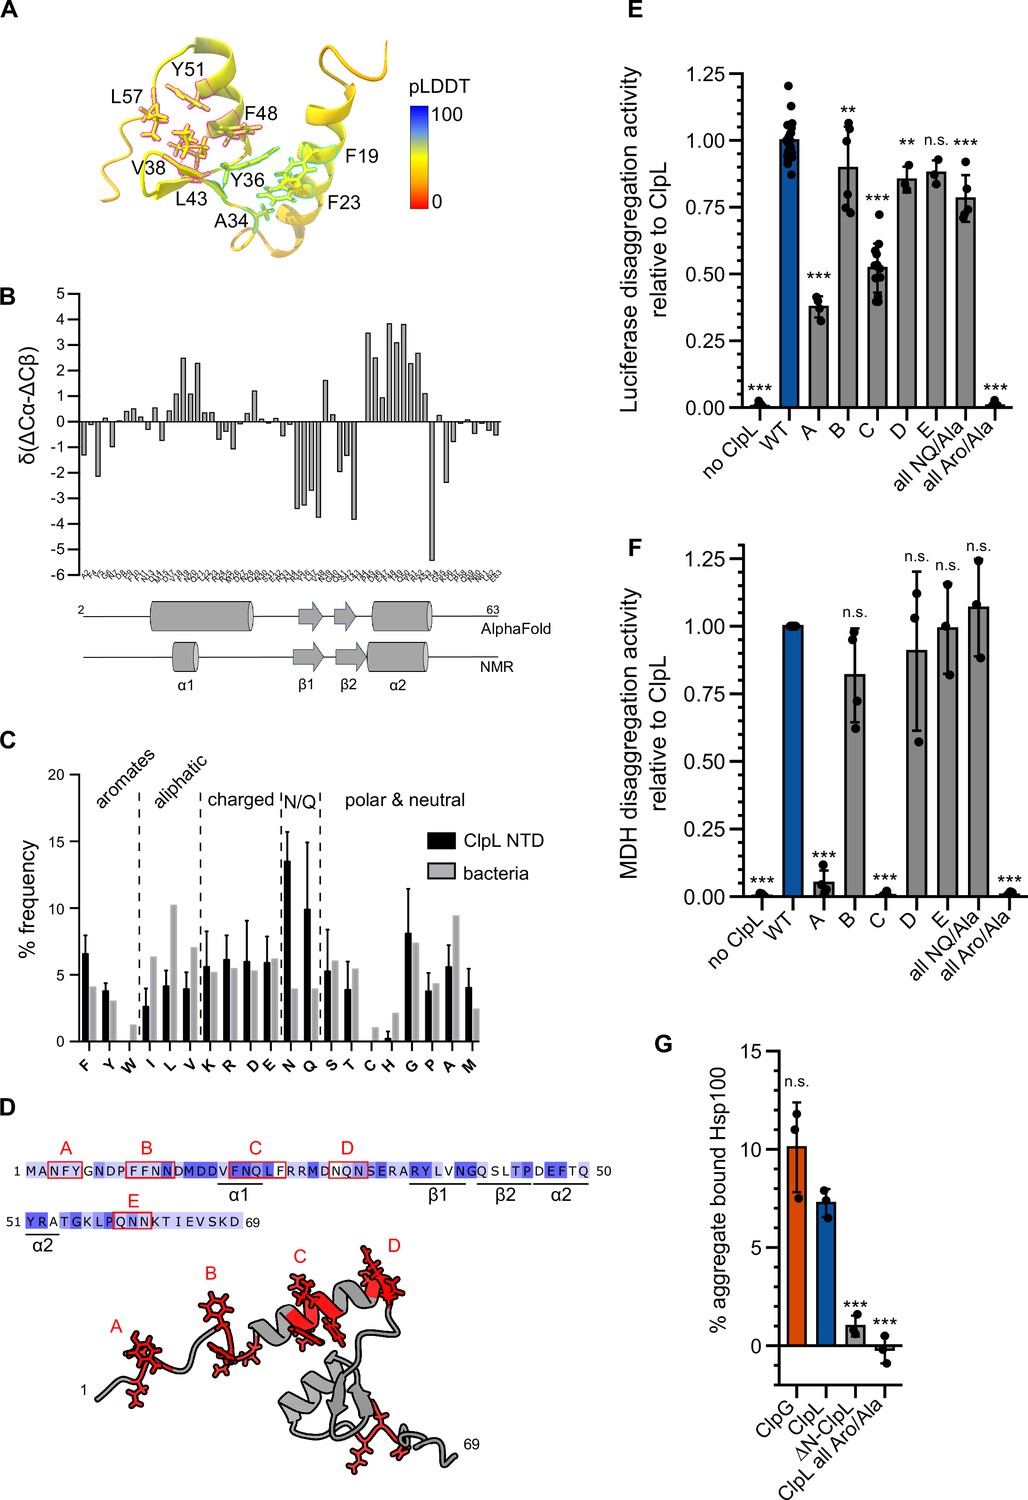
(A) AlphaFold2 model of ClpL NTD. The color code depicts the calculated confidence of the prediction (pLDDT). Residues that potentially participate in the formation of small hydrophobic cores (α1/2 [cyan] and α2/β1,2 [magenta]) are indicated. (B) Secondary structure of ClpL-NTD as determined by magnetic resonance spectroscopy (NMR) using secondary chemical shifts (Cα, Cβ). Secondary structure elements determined from NMR and from the AlphaFold prediction are indicated below the histogram. The predicted α1-helix only transiently forms in isolated solution context, which is confirmed by further NMR analysis (Figure 4—figure supplement 1E). (C) Composition of ClpL NTDs. The frequencies (%) of individual amino acids represent the ratio of the number of a particular residue and the total length of respective NTDs (L. monocytogenes, S. aureus, S. pneumoniae, Lactobacillus plantarum, Oenococcus oeni, Lactobacillus rhamnosus, Streptococcus suis). The average frequency of each amino acid in the total bacterial proteomes is given as reference (Bogatyreva et al., 2006). (D) Localization of patches A-E consisting of aromatic and N/Q residues are indicated. (E/F) Luciferase and MDH disaggregation activities (% refolded enzyme/min) of ClpL wild-type (WT) and indicated patch mutants were determined. The disaggregation activity of ClpL was set to 1. (G) ClpG, ClpL, and indicated ClpL mutants were incubated with aggregated MDH in the presence of ATPγS. The extend of aggregate binding was determined by co-sedimentation upon centrifugation and quantifications of chaperone levels in soluble and insoluble fractions. Shown are data points and mean ± SD (C/E/F/G), n≥3. Statistical analysis: one-way ANOVA, Welch’s test for post hoc multiple comparisons. Significance levels: *p<0.05; **p<0.01; ***p<0.001. n.s.: not significant.
Figure 4—figure supplement 1
Structural analysis of ClpL N-terminal domain (NTD).
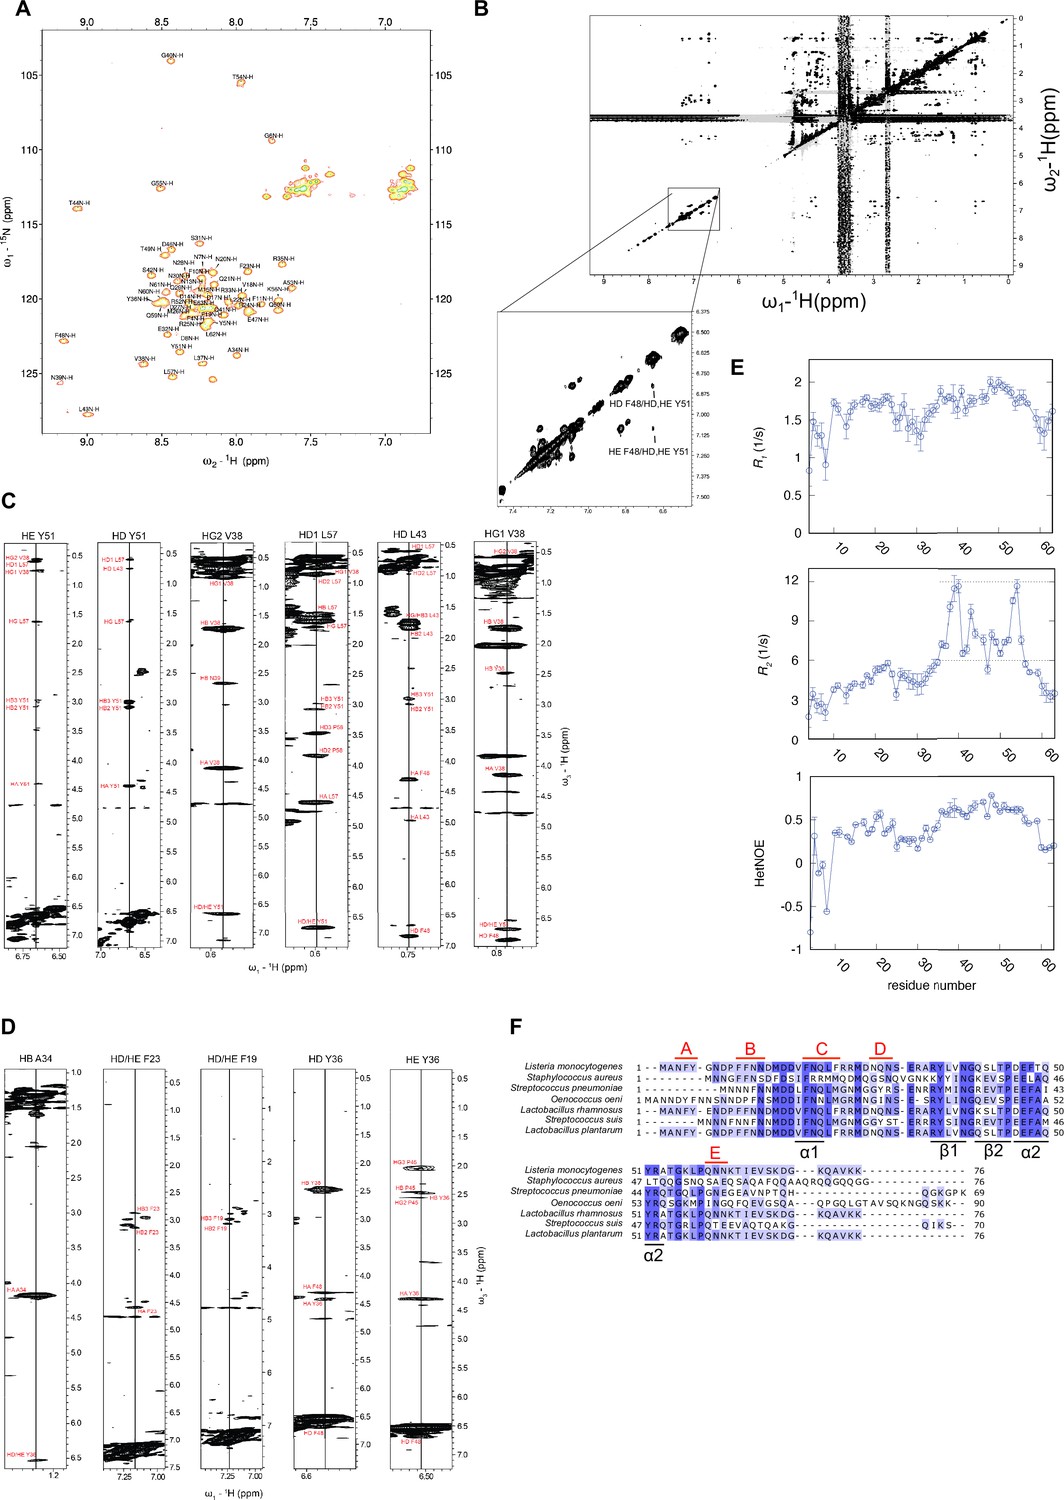
(A) 1H,15N-HSQC of ClpL NTD with resonance assignment labeled at each peak. Several residues exhibit dispersed peak position, indicative of folding. (B) 1H,1H-2D NOESY in D2O of ClpL NTD confirming NOEs between aromatic ring protons of the hydrophobic core formed by α2 and the β-sheet. NOEs of the second predicted core between α1 and α2 are absent, indicating that there is no interaction between α1 and α2. (C) Selected strips of the 13C-edited 3D NOESY-HSQC to illustrate that the predicted hydrophobic core between α2 and the β-sheet is present. Multiple cross-peaks (NOEs) are present between relevant residues (Y36, V38, L43, F48, Y51). (D) Selected strips of the 13C-edited 3D NOESY-HSQC illustrating the absence of NOEs expected to between residues of the second hydrophobic core between α1 and α2. For these residues (F19, F23, A34, Y36) only intra-residue or sequential NOEs are visible (except for Y36, which has NOEs to residues of the first hydrophobic core). Thus, despite transient formation of the α1-helix, there is no or only transient interactions between α1 and α2. (E) 15N spin relaxation data of ClpL NTD. Top: Longitudinal relaxation rates; middle: transverse relaxation rates; bottom: heteronuclear NOEs. All three measurements show that the N-terminal region up to residue R35 is highly flexible, whereas the region of the hydrophobic core between α2 and the β-sheet higher heteronuclear NOE values and longer transverse relaxation rates indicating a higher degree of order. The altogether low heteronuclear NOE values, rarely above 0.6, indicate that the secondary structure elements (α1 vs. α2/β-sheet) are mobile with respect to each other in the ps-ns time scale. (F) Sequence alignment of ClpL NTDs. Similar and identical residues are highlighted in light and dark blue. The positions of secondary structural elements and of patches A-E composed of Y, F, N, and Q residues are indicated.
Figure 4—figure supplement 2

Mutant analysis of ClpL N-terminal domain (NTD).
(A/D) ATPase activities of indicated ClpL mutants determined at 0.125 and 1 μM protein concentration. The ATPase activities of ClpL wild-type (WT) were set to 1. (B/C) Luciferase and malate dehydrogenase (MDH) disaggregation activities (% refolded enzyme/min) of ClpL-WT and indicated mutants were determined. The disaggregation activity of ClpL-WT was set to 1. (E/F) Luciferase and MDH disaggregation activities (% refolded enzyme/min) of ClpL-WT, LN-ClpB*, and LN-ClpB* mutants were determined. The disaggregation activity of ClpL-WT was set to 1. (G) ATPase activities of ClpL-WT, LN-ClpB*, and LN-ClpB* mutants were determined at 0.125 and 1 μM protein concentration. The disaggregation activity of ClpL-WT was set to 1. (H) ClpB*, LN-ClpB*, and indicated mutants were incubated with aggregated MDH in the presence of ATPγS. The extent of aggregate binding (% of total protein) was determined by co-sedimentation upon centrifugation. Shown are data points and mean ± SD (A–H), n≥3. Statistical analysis: one-way ANOVA, Welch’s test for post hoc multiple comparisons. Significance levels: *p<0.05; **p<0.01; ***p<0.001. n.s.: not significant.
Figure 5 with 1 supplement
Multiple ClpL N-terminal domains (NTDs) are required for disaggregation activity.
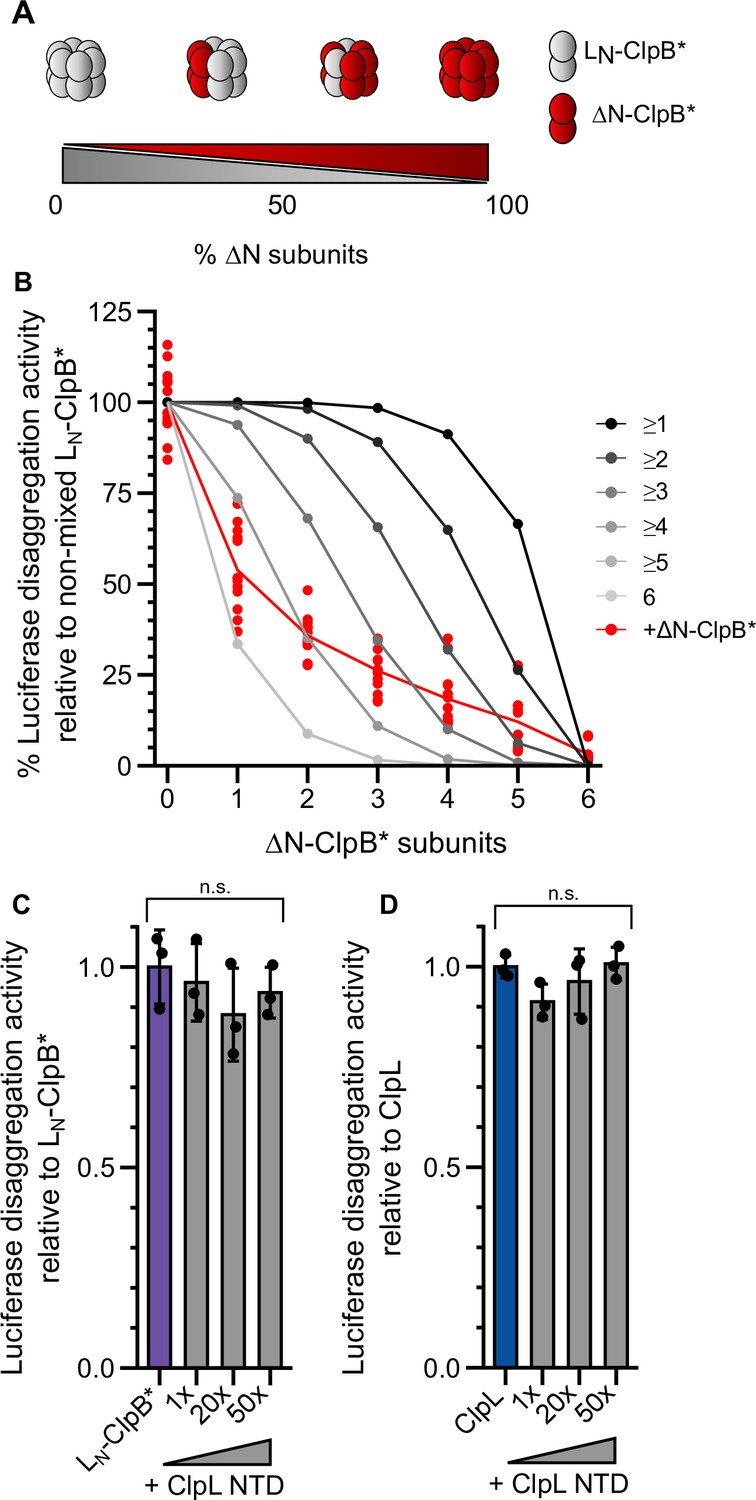
(A) Varying the ratio of LN-ClpB* and ΔN-ClpB* leads to formation of mixed hexamers with diverse numbers of NTDs. (B) Luciferase disaggregation activities (% refolded luciferase/min) of mixed LN-ClpB*/ΔN-ClpB* hexamers were determined and compared with curves calculated from a model (black to gray), which assumes that a mixed hexamer only displays disaggregation activity if it contains the number of NTDs indicated. Mixing ratios are indicated as number of ΔN-ClpB* in a hexamer. (C/D) Luciferase disaggregation activities of LN-ClpB* (C) and ClpL (D) were determined in the absence and presence of an excess of isolated NTD as indicated. Disaggregation activities determined in NTD absence were set as 100%. Shown are data points (B) or data points and mean ± SD (C/D), n≥3. Statistical analysis: one-way ANOVA, Welch’s test for post hoc multiple comparisons. Significance levels: *p<0.05; **p<0.01; ***p<0.001. n.s.: not significant.
Figure 5—figure supplement 1
Multiple ClpL N-terminal domains (NTDs) are required for disaggregation activity.
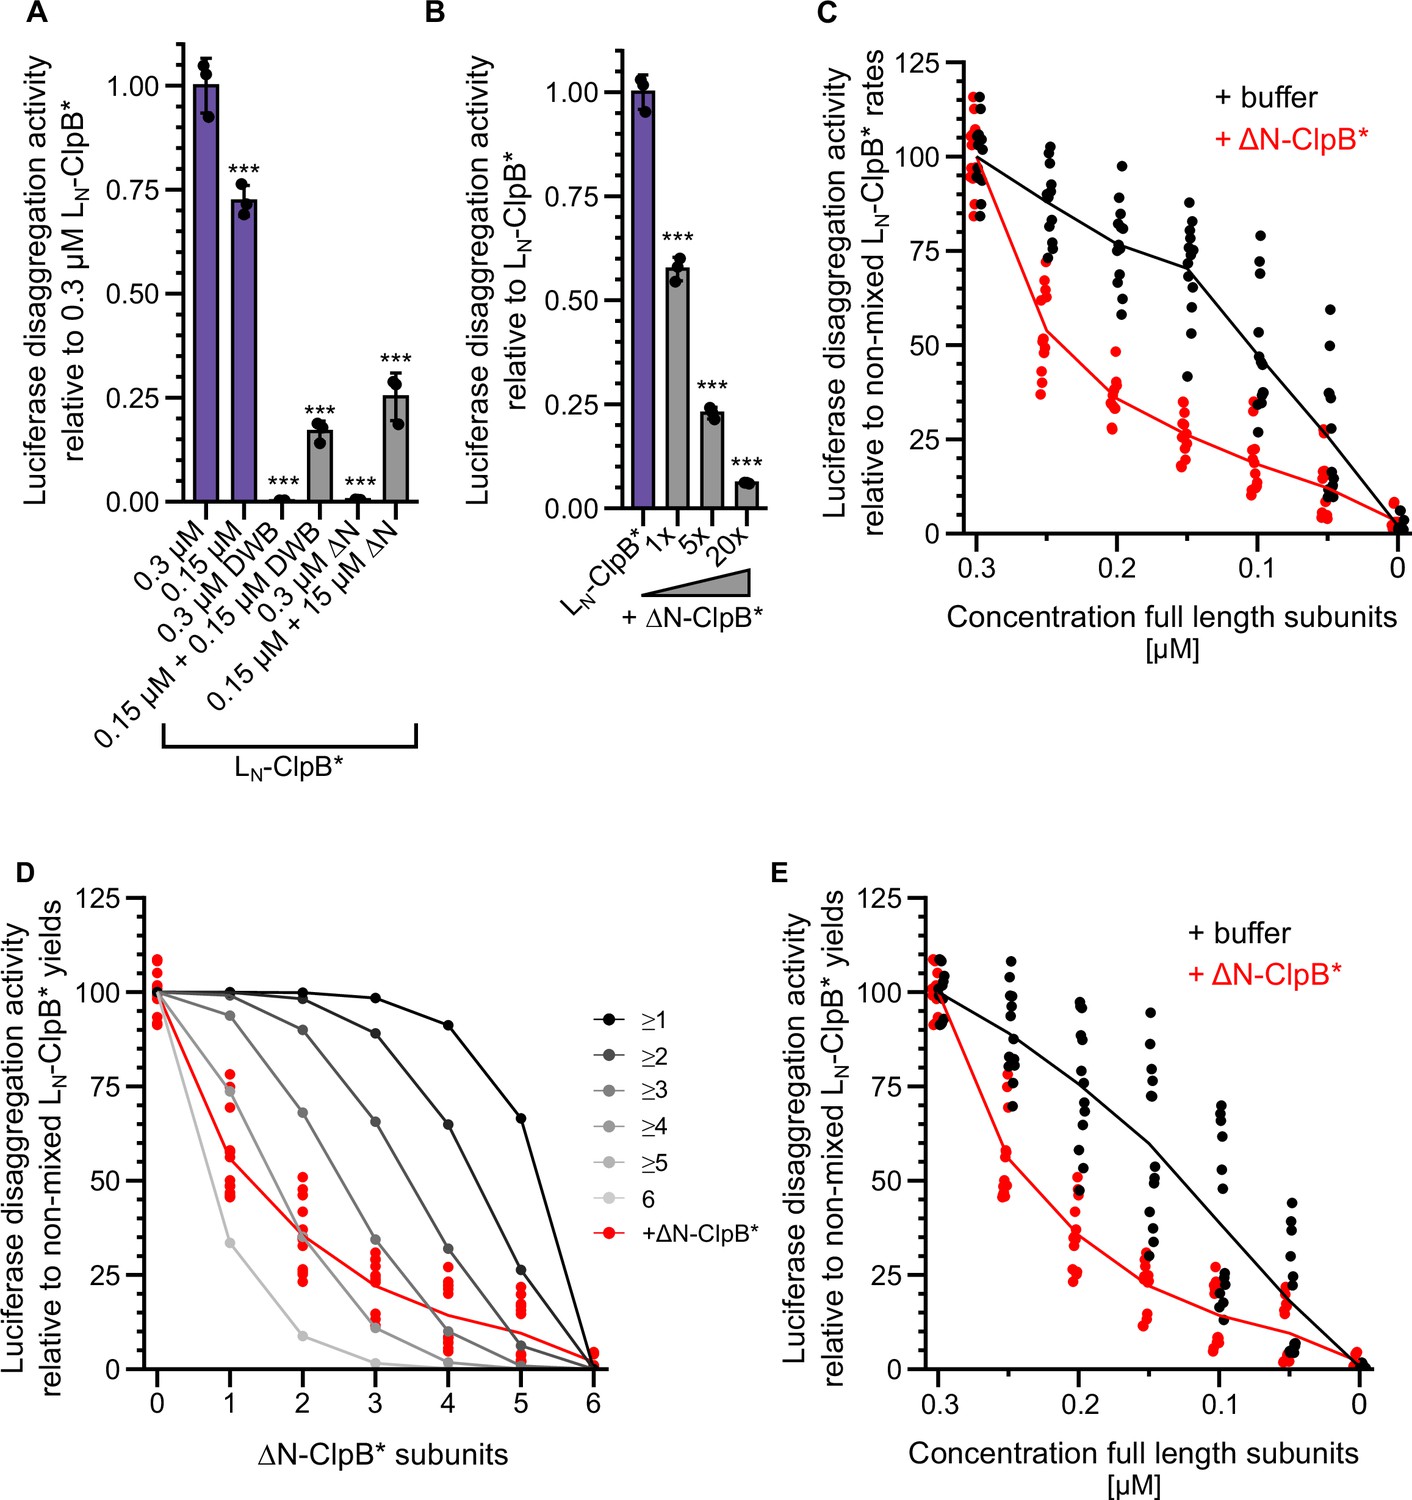
(A) Relative luciferase disaggregation activities (% refolded luciferase/min) of indicated LN-ClpB* disaggregase mixtures were determined (DWB: ATPase-deficient LN-ClpB*-E279A/E678A, ΔN: ΔN-ClpB*). Protein concentrations (μM) are indicated. The disaggregation activity of 0.3 μM LN-ClpB* was set to 1. (B) Relative luciferase disaggregation activities (% refolded luciferase/min) of LN-ClpB* were determined in the absence and presence of ΔN-ClpB* excess as indicated. The disaggregation activity of LN-ClpB* was set to 1. (C) Relative luciferase disaggregation activities (% refolded luciferase/min (=rate)) were determined for mixtures of LN-ClpB* and ΔN-ClpB* and were set as 100% for non-mixed LN-ClpB* (0.3 μM). Mixing ratios are indicated as final concentration of LN-ClpB* in 0.3 μM mixed hexamers. As control disaggregation activities of lower LN-ClpB* concentrations were determined (+buffer). (D) Relative luciferase disaggregation activities (% refolded luciferase after 120 min (=yield)) of mixed LN-ClpB*/ΔN-ClpB* hexamers were determined and compared with curves calculated from a model (black to gray), which assumes that a mixed hexamer only displays disaggregation activity if it contains the number of NTDs indicated. Mixing ratios are indicated as number of ΔN-ClpB* in a hexamer. (E) Relative luciferase disaggregation activities (% refolded luciferase after 120 min (=yield)) were determined for mixtures of LN-ClpB* and ΔN-ClpB* and were set as 100% for non-mixed LN-ClpB* (0.3 μM). Mixing ratios are indicated as final concentration of LN-ClpB* in 0.3 μM mixed hexamers. As control disaggregation activities of lower LN-ClpB* concentrations were determined (+buffer). Shown are data points and mean ± SD (A/B) or mean curves and data points (C/D/E), n≥3. Statistical analysis: one-way ANOVA, Welch’s test for post hoc multiple comparisons. Significance levels: *p<0.05; **p<0.01; ***p<0.001.
Figure 6 with 3 supplements
Stabilizing ClpL ring dimers strongly reduces disaggregation activity.
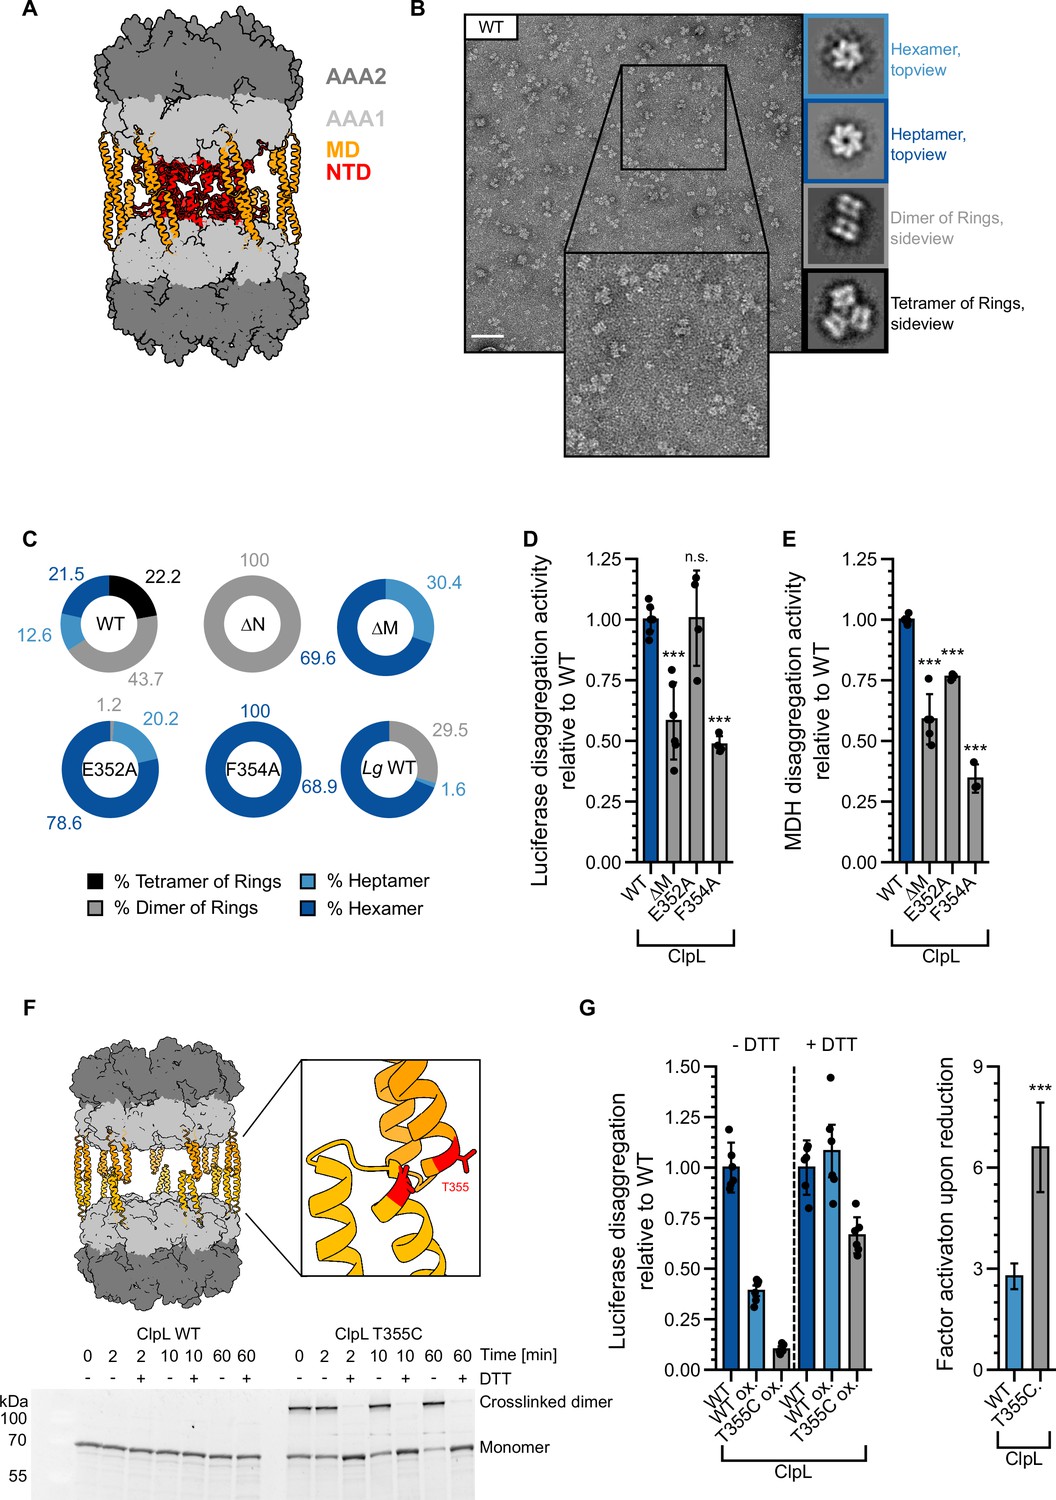
(A) AlphaFold2 model of L. monocytogenes (Lm) ClpL ring dimers. Positions of individual domains are indicated. (B) Negative stain EM of Lm ClpL. Two-dimensional (2D) class averages revealing single ring hexamers or heptamers, ring dimers and tetramers of rings are indicated. The scale bar is 100 nm. (C) Populations (%) of diverse ClpL assembly states based on 2D class averages were determined for Lm ClpL wild-type (WT) and indicated mutants and L. gasseri (Lg) ClpL. Evaluated particles: nWT = 5233, n∆N = 18,314, n∆M = 1900, nE352A = 14,215, nF354A = 7074, nLg WT = 11,765. (D/E) Disaggregation activities of ClpL-WT and indicated M-domain (M) mutants toward aggregated luciferase (D) and malate dehydrogenase (MDH) (E) (each: % regain enzymatic activity/min) were determined. The activity of ClpL was set to 1. (F) Model of ClpL ring dimers. Positions of T355 residues in interacting M-domains are depicted. Crosslinking of ClpL-T355C was achieved by DTT removal and further incubation at room temperature (RT) as indicated. The formation of crosslinked ClpL-T355C dimers was monitored by SDS-PAGE and Coomassie staining. Addition of 10 mM DTT reversed the disulfide bonds. (G) Luciferase disaggregation activities of reduced ClpL-WT (assay control) and oxidized ClpL-WT (treatment control) or ClpL-T355C were determined in the absence of DTT (-DTT). Oxidized variants (WT and T355C) were additionally preincubated with 10 mM DTT for 30 min and tested for disaggregation activity in the presence of DTT (+DTT). The factor of increase in disaggregation activity upon reduction (+DTT) is indicated (right). Shown are data points and mean ± SD (D/E/G) or only mean ± SD (G), n≥3. Standard deviations for the activity gain factors (G) have been propagated from disaggregation activity standard deviations. Statistical analysis: one-way ANOVA, Welch’s test for post hoc multiple comparisons. Significance levels: *p<0.05; **p<0.01; ***p<0.001. n.s.: not significant.
-
Figure 6—source data 1
Source data includes the non-cropped and non-processed image of the SDS-gel.
- https://cdn.elifesciences.org/articles/92746/elife-92746-fig6-data1-v2.zip
-
Figure 6—source data 2
Source data includes the non-cropped and non-processed image of the SDS-gel and indicates sections and loading schemata of the respective figure.
- https://cdn.elifesciences.org/articles/92746/elife-92746-fig6-data2-v2.zip
Figure 6—figure supplement 1
ClpL rings interact in an M-domain-dependent manner.
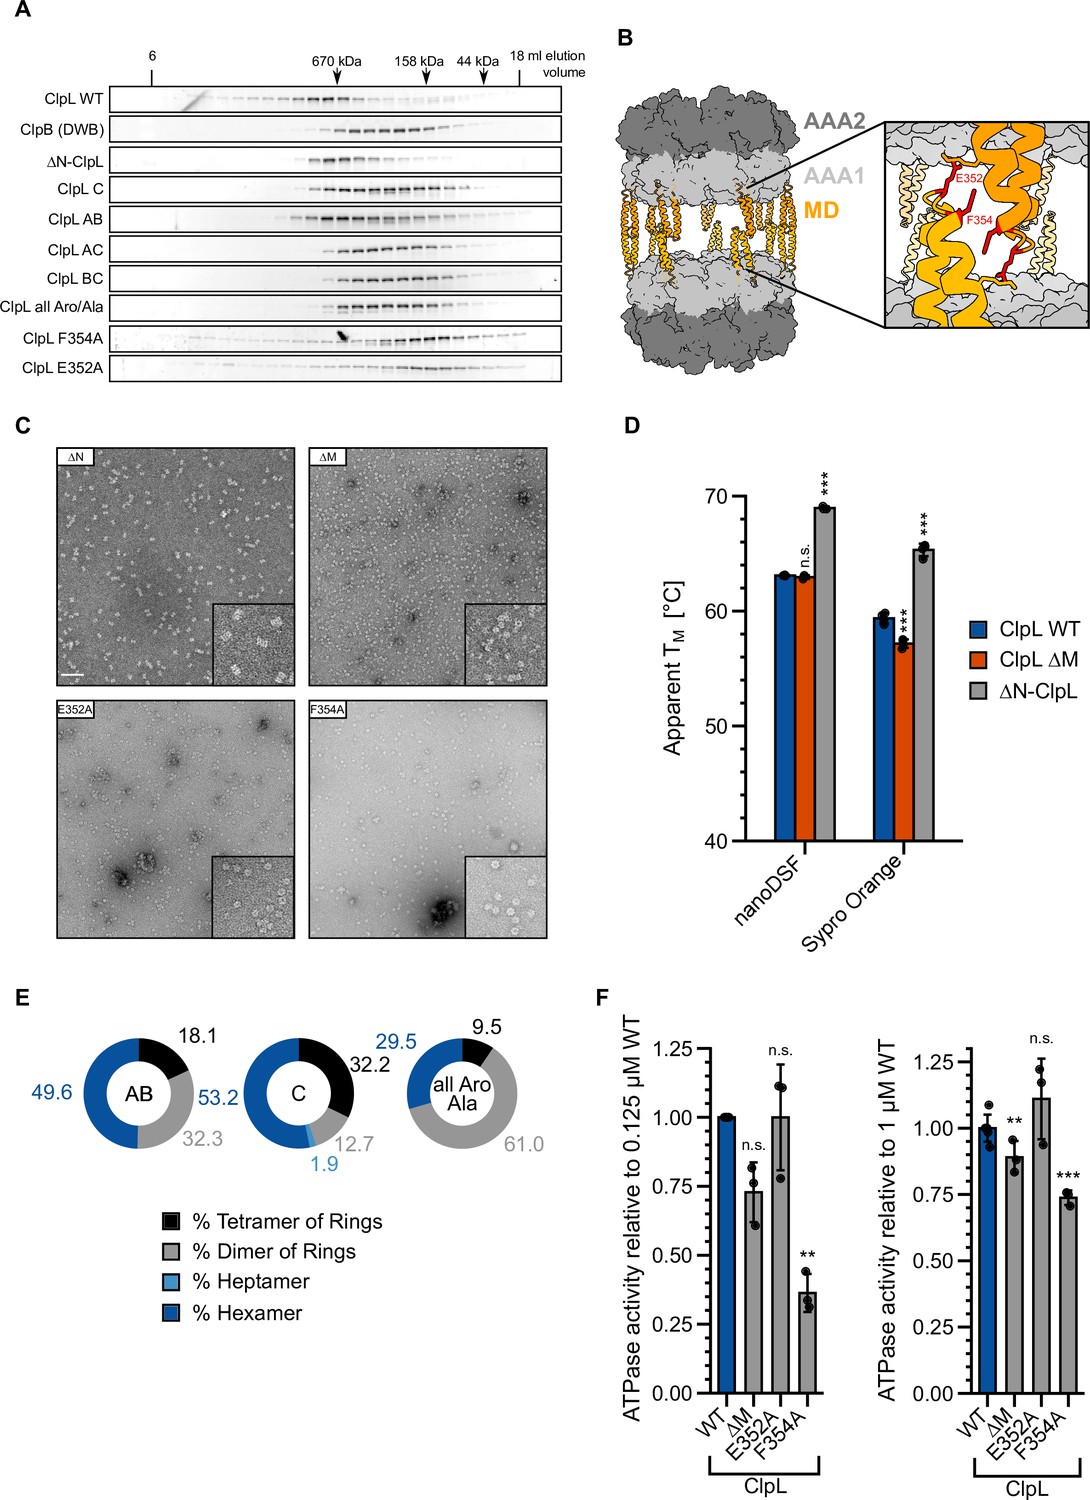
(A) Oligomeric states of ClpL wild-type (WT) and indicated mutants were determined in the presence of ATP by size exclusion chromatography. ATPase-deficient ClpB-E279A/E678A (DWB) served as reference for hexameric rings. Elution fractions were analyzed by SDS-PAGE. Positions of peak fractions of a protein standard are indicated. (B) Model of Listeria monocytogenes (Lm) ClpL highlighting the residues E352 and F354, which are crucial for M-domain-mediated ring interactions. (C) Negative stain EM of indicated ClpL mutants. The insets show a magnification of a representative grid area. The scale bar is 100 nm. (D) Melting temperatures (TM) of ClpL-WT and indicated deletion mutants were determined in the presence of ATPγS by nanoDSF or SYPRO Orange binding. (E) Populations of diverse ClpL assembly states were determined based on two-diemnsional (2D) class averages for indicated ClpL mutants. (F) ATPase activities of indicated ClpL M-domain mutants were determined at 0.125 and 1 μM protein concentration. The ATPase activities of ClpL-WT were set to 1. Standard deviations are based on at least three independent experiments (D/F). Shown data points and mean ± SD (D/F), n≥3. Statistical analysis: one-way ANOVA, Welch’s test for post hoc multiple comparisons. Significance levels: *p<0.05; **p<0.01; ***p<0.001. n.s.: not significant.
-
Figure 6—figure supplement 1—source data 1
Source data include non-cropped and non-processed images of SDS-gels.
- https://cdn.elifesciences.org/articles/92746/elife-92746-fig6-figsupp1-data1-v2.zip
-
Figure 6—figure supplement 1—source data 2
Source data include non-cropped and non-processed images of SDS-gels and indicate sections and loading schemata of the respective figure supplement.
- https://cdn.elifesciences.org/articles/92746/elife-92746-fig6-figsupp1-data2-v2.zip
Figure 6—figure supplement 2
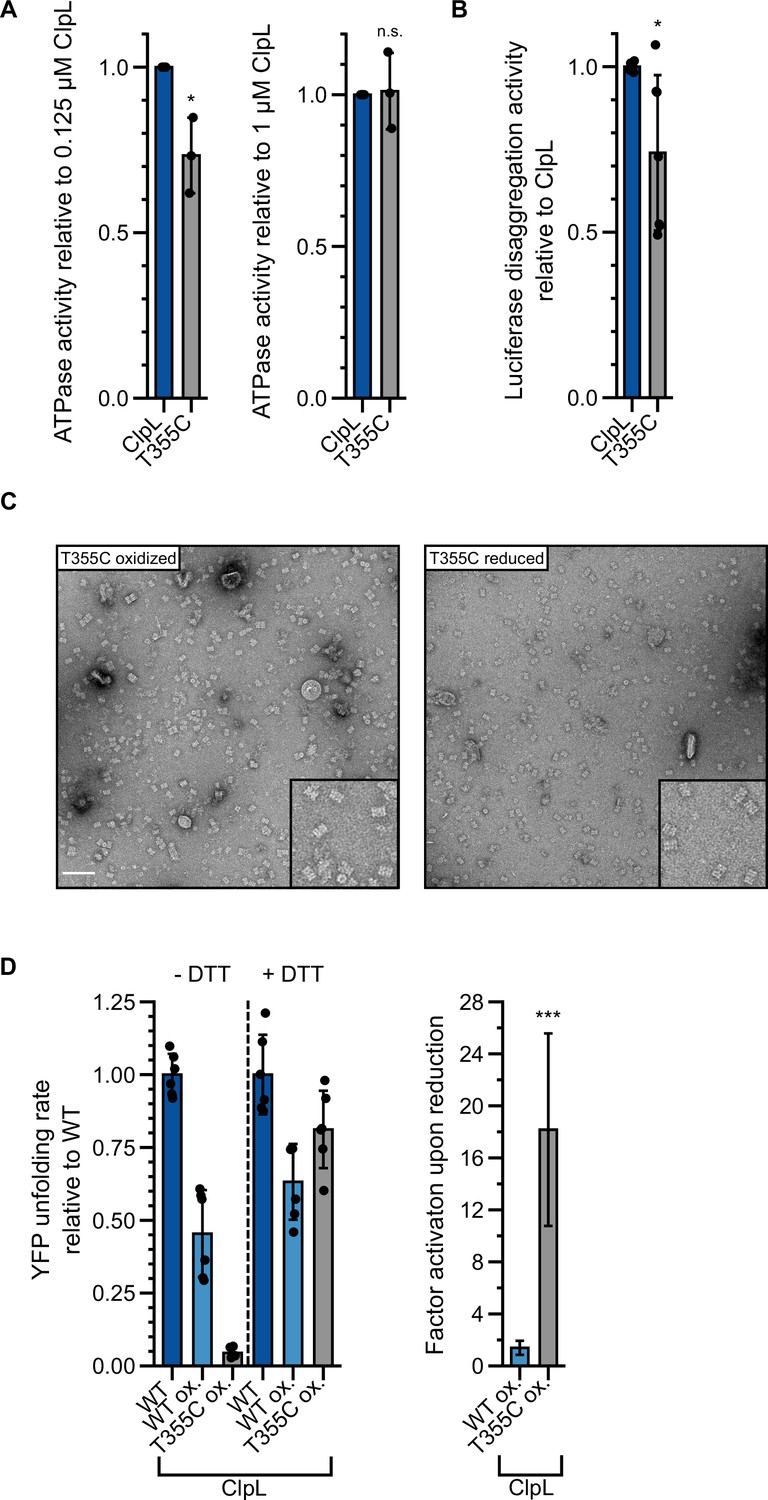
Stabilizing ClpL ring dimers by disulfide crosslinking.
(A) Relative ATPase activities of indicated ClpL wild-type (WT) and T355C were determined at 0.125 and 1 μM protein concentration. The ATPase activities of ClpL-WT were set to 1. (B) Relative luciferase disaggregation activities (% refolded enzyme/min) of ClpL-WT and T355C were determined. The disaggregation activity of ClpL-WT was set to 1. (C) Negative stain EM of ClpL-T355C in oxidized and reduced states in the presence of ATP. The insets show a magnification of a representative grid area. The scale bar is 100 nm. (D) YFP unfolding rates (% YFP fluorescence/min) during disaggregation of aggregated luciferase-YFP by reduced ClpL-WT (assay control) and oxidized ClpL-WT (treatment control) or ClpL-T355C were determined in the absence of DTT (-DTT). Oxidized variants (WT and T355C) were additionally preincubated with 10 mM DTT for 30 min and tested for YFP unfolding activity in the presence of DTT (+DTT). The factor of increase in YFP unfolding activity upon reduction (+DTT) is indicated (right). Shown data points and mean ± SD (A/B/D), n≥3. Standard deviations for the activity gain factors (D) have been propagated from disaggregation activity standard deviations. Statistical analysis: one-way ANOVA, Welch’s test for post hoc multiple comparisons. Significance levels: *p<0.05; **p<0.01; ***p<0.001. n.s.: not significant.
Figure 6—figure supplement 3
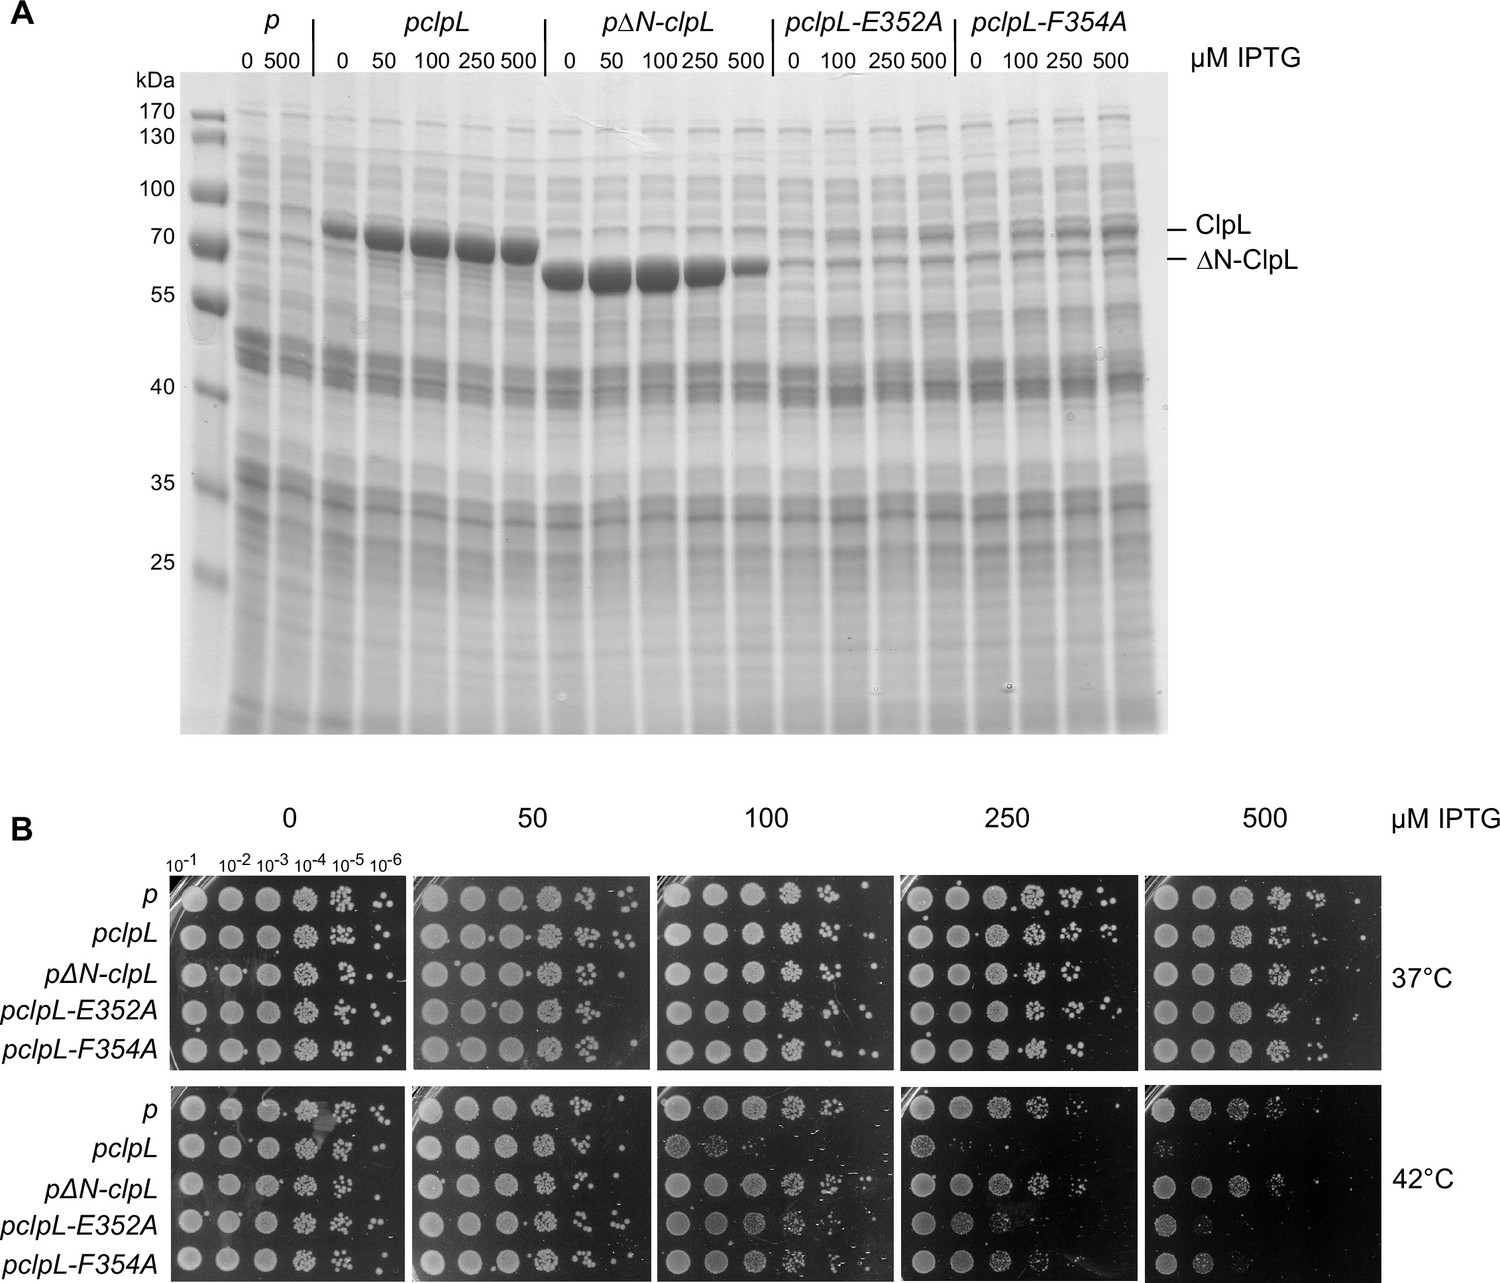
Production of ClpL M-domain (MD) mutants cause increased toxicity in E. coli.
(A) Production levels of ClpL (wild-type [WT] and indicated mutants) in E. coli ΔclpB cells. E. coli ΔclpB cells harboring plasmids for IPTG-controlled expression of clpL (WT and indicated mutants) were spotted on LB plates including the indicated IPTG concentrations (μM) and incubated at 30°C for 24 hr. Total cell extracts were prepared from colonies and ClpL levels were determined by SDS-PAGE followed by Coomassie staining. p: empty vector control. (B) E. coli ΔclpB cells harboring plasmids for IPTG-controlled expression of clpL (WT and indicated mutants) were spotted on LB plates including the indicated IPTG concentrations (μM) and incubated at 30°C and 42°C for 24 hr.
-
Figure 6—figure supplement 3—source data 1
Source data includes the non-cropped and non-processed image of the SDS-gel.
- https://cdn.elifesciences.org/articles/92746/elife-92746-fig6-figsupp3-data1-v2.zip
-
Figure 6—figure supplement 3—source data 2
Source data includes the non-cropped and non-processed image of the SDS-gel and indicates sections and loading schemata of the respective figure supplement.
- https://cdn.elifesciences.org/articles/92746/elife-92746-fig6-figsupp3-data2-v2.zip
Author response image 1

Serial dilutions (10-1 – 10-6) of E.
coli dnaK103 mutant cells expressing E. coli dnaK, L. monocytogenes clpL or P. aeruginosa clpG were spotted on LB plates including the indicatedIPTG concentrations. Plates were incubated at 30°C or 40°C for 24 h. p: empty vector control.
Author response image 2

LN-ClpB* cooperates with DnaK in protein disaggregation.
Relative MDH disaggregation activities of indicated disaggregation systems were determined. KJE: DnaK/DnaJ/GrpE. The disaggregation activity of Lm ClpL was set to 1. Statistical Analysis: Oneway ANOVA, Welch’s Test for post-hoc multiple comparisons. Significance levels: ***p < 0.001. n.s.: not significant.
Additional files
-
MDAR checklist
- https://cdn.elifesciences.org/articles/92746/elife-92746-mdarchecklist1-v2.docx
-
Supplementary file 1
E. coli strains and plasmids used in this study.
- https://cdn.elifesciences.org/articles/92746/elife-92746-supp1-v2.docx
-
Supplementary file 2
Number of replicates.
- https://cdn.elifesciences.org/articles/92746/elife-92746-supp2-v2.docx
Download links
A two-part list of links to download the article, or parts of the article, in various formats.
Downloads (link to download the article as PDF)
Open citations (links to open the citations from this article in various online reference manager services)
Cite this article (links to download the citations from this article in formats compatible with various reference manager tools)
The Listeria monocytogenes persistence factor ClpL is a potent stand-alone disaggregase
eLife 12:RP92746.
https://doi.org/10.7554/eLife.92746.3


