Structure-guided mutagenesis of OSCAs reveals differential activation to mechanical stimuli
- Department of Integrative Structural and Computational Biology, Scripps Research, United States
- Department of Neuroscience, Scripps Research, United States
Figures
Figure 1 with 4 supplements
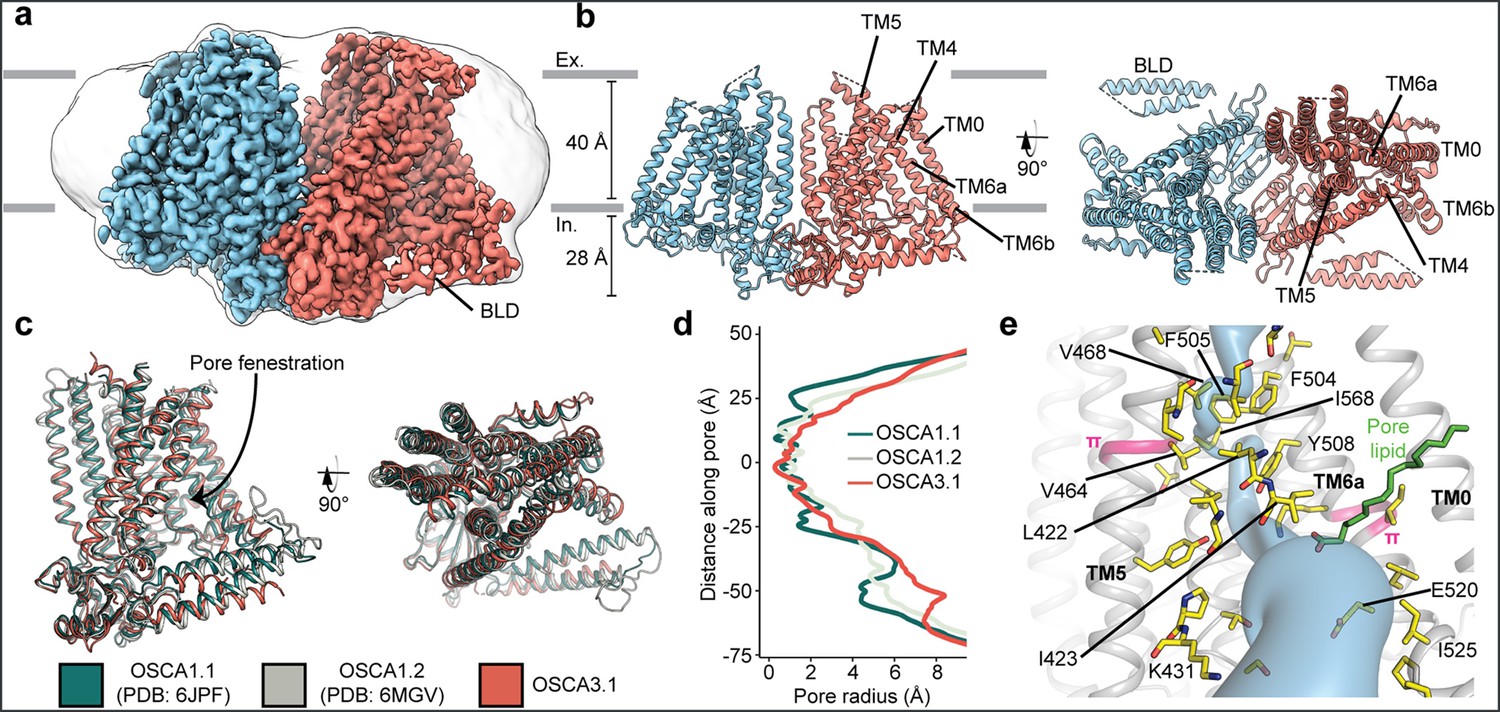
Cryo-EM structure and pore of OSCA3.1.
(a) Cryo-EM map of OSCA3.1 dimer colored by subunit. Nanodisc density in grey corresponds to the unsharpened map (gaussian-filtered to 1.5 σ). (b) Front (left) and top (right) view of atomic model. Ex.: Extracellular, In.: Intracellular. (c) Superposition of OSCA1.1, OSCA1.2 (in nanodiscs) and OSCA3.1 protomers. (d) Pore profile of OSCAs in c. (e) View of the pore pathway (blue) of OSCA3.1. Pore facing residues colored in yellow, with selected residues labeled. π-helical turns in pink. Putative pore lipid in green. Backbone of TM3 and TM4 helices hidden for clarity.
Figure 1—figure supplement 1
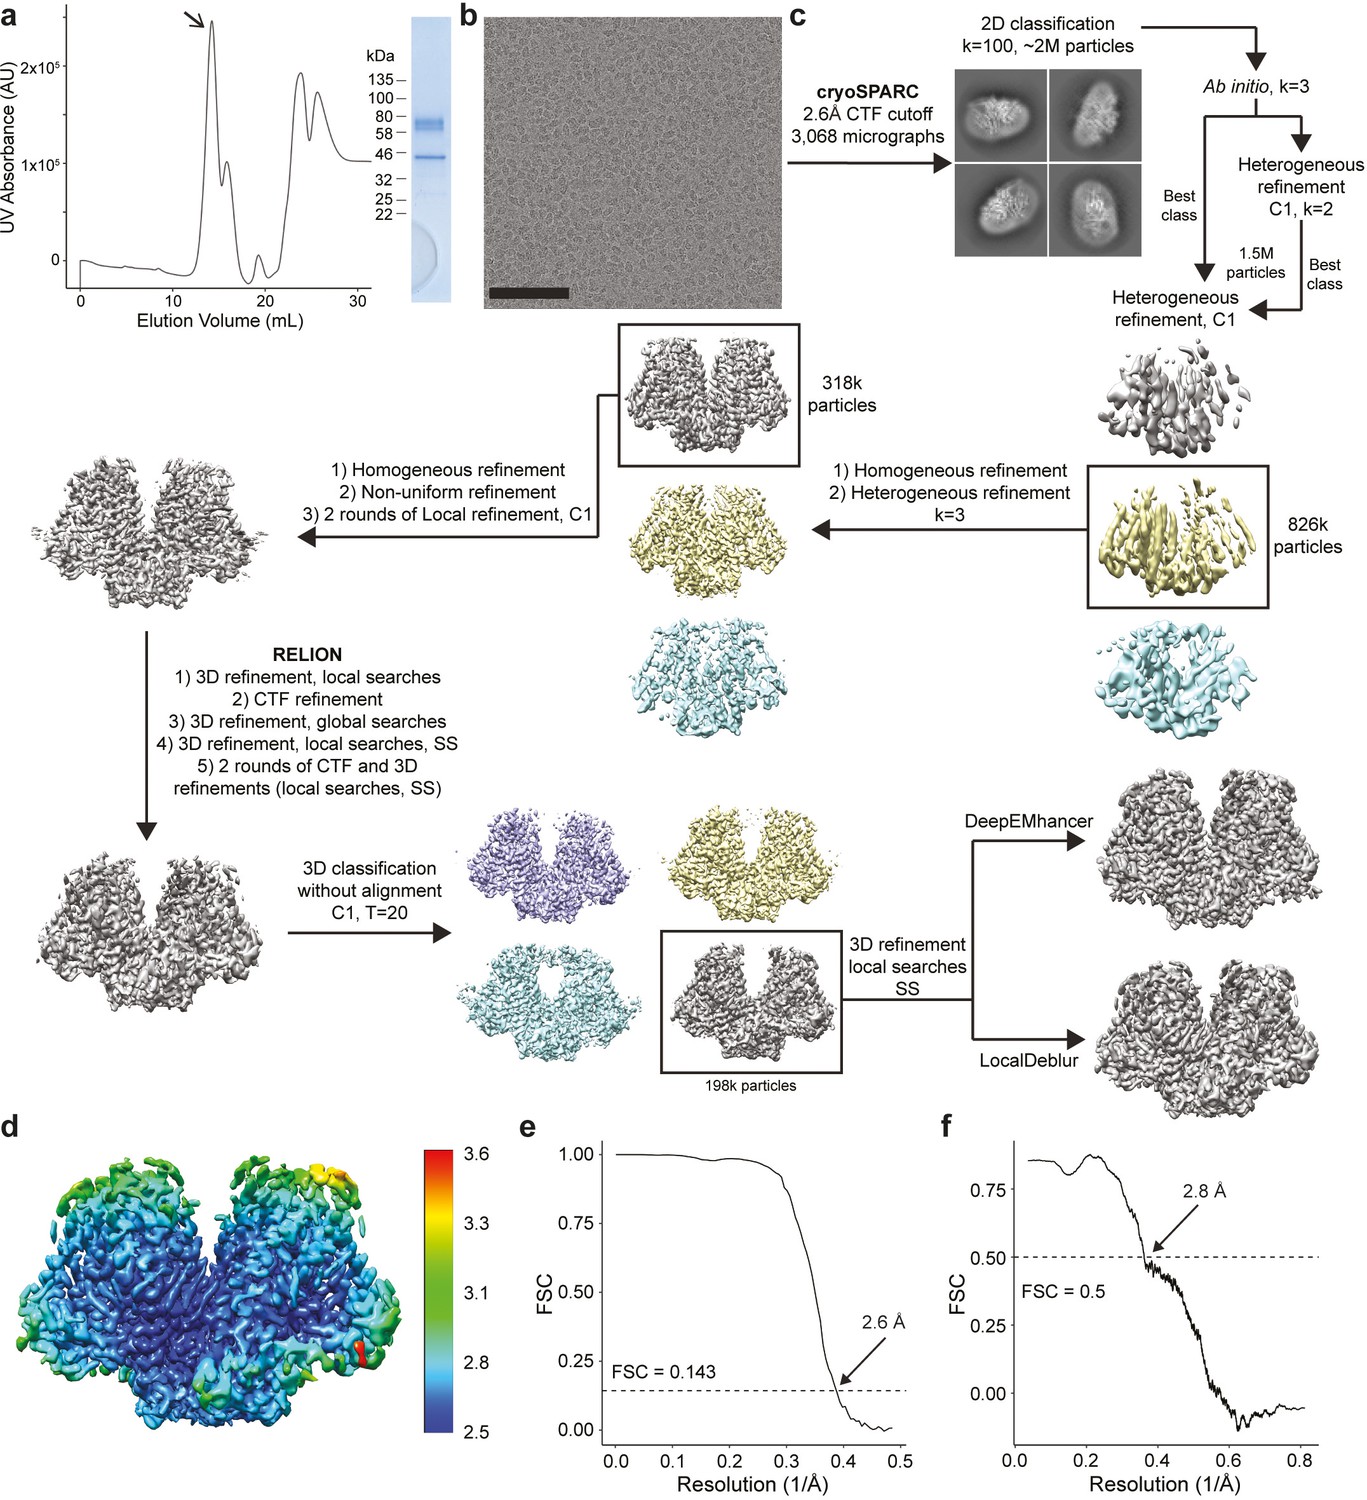
Purification and cryo-EM data processing of OSCA3.1.
(a) SEC trace (left) from OSCA3.1 reconstitution in nanodiscs. Arrow points to peak corresponding to fractions pooled and ran on SDS-PAGE (right). Molecular weight of OSCA3.1 and MSP2N2 is approximately 82 kDa and 43 kDa, respectively. (b) Representative cryo-EM micrograph. Black bar is 100 nm. (c) Cryo-EM processing workflow. C2 symmetry was imposed during refinements unless otherwise specified. 3D refinements in RELION were performed using the SIDESPLITTER algorithm where indicated (SS). (d) LocalDeblur map colored by local resolution calculated in RELION. (e) FSC plot calculated in RELION. (f) LocalDeblur map to model FSC plot.
Figure 1—figure supplement 2

Fit of OSCA3.1 model to LocalDeblur map.
Fit of OSCA3.1 model to selected regions of the LocalDeblur map. Map was contoured at a threshold of 2 (for the BLD) or 4 σ.
Figure 1—figure supplement 3
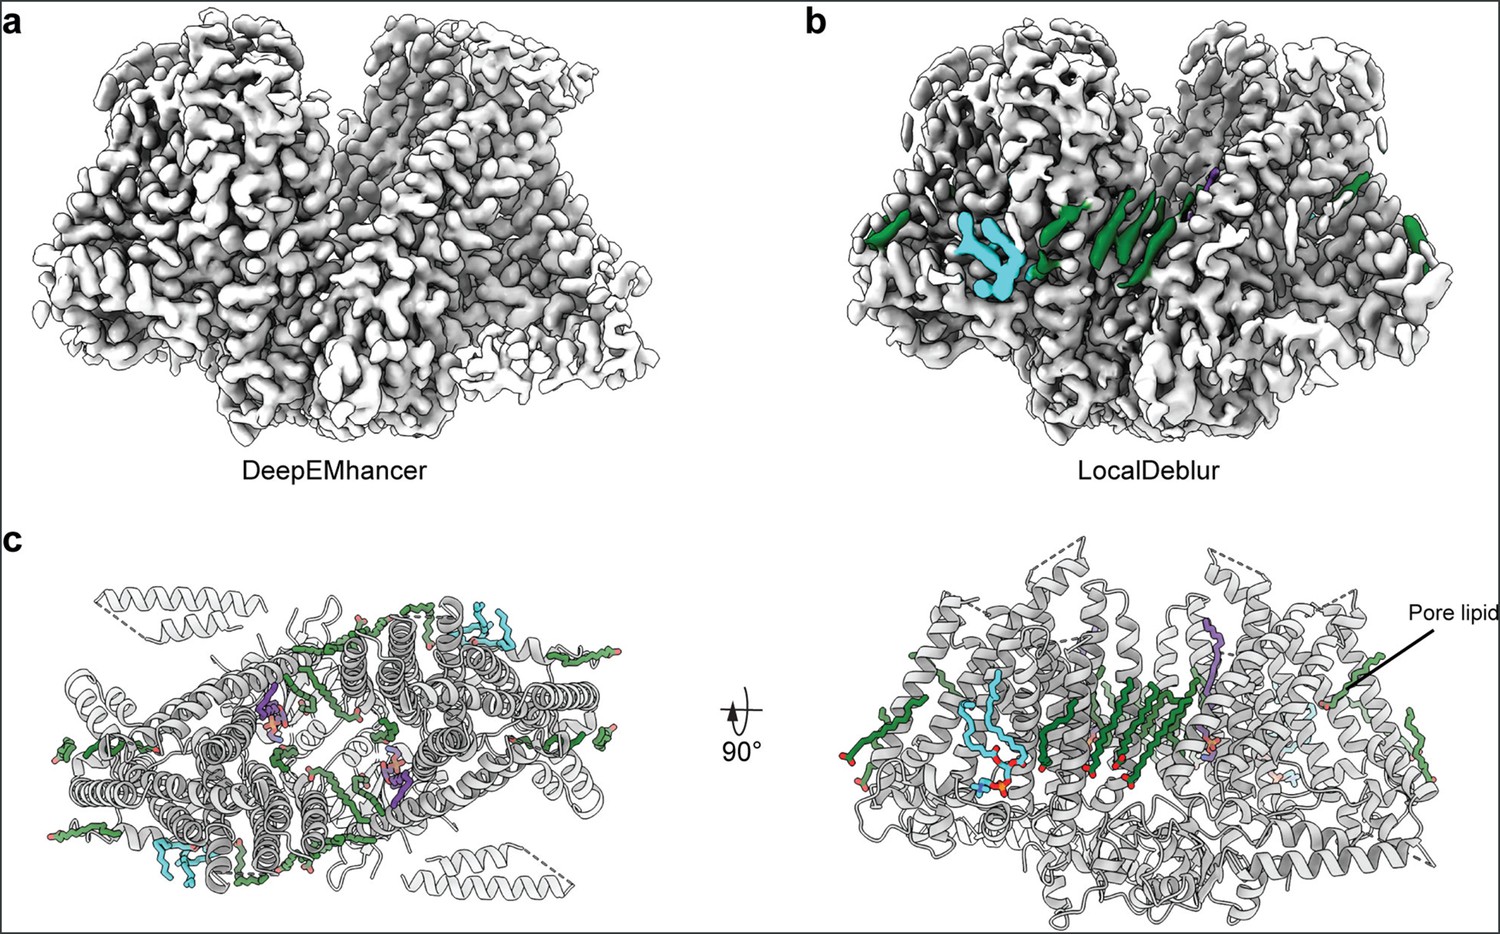
Comparison of DeepEMhancer and LocalDeblur postprocessed maps.
(a) DeepEMhancer map. (b) LocalDeblur map with lipid-like densities colored. (c) Top (left) and front (right) view of OSCA3.1 model with modeled lipids. Lipids were tentatively modeled as palmitic acid (green), phosphatidylcholine (cyan), and lyso-phosphatidylethanolamine (purple).
Figure 1—figure supplement 4
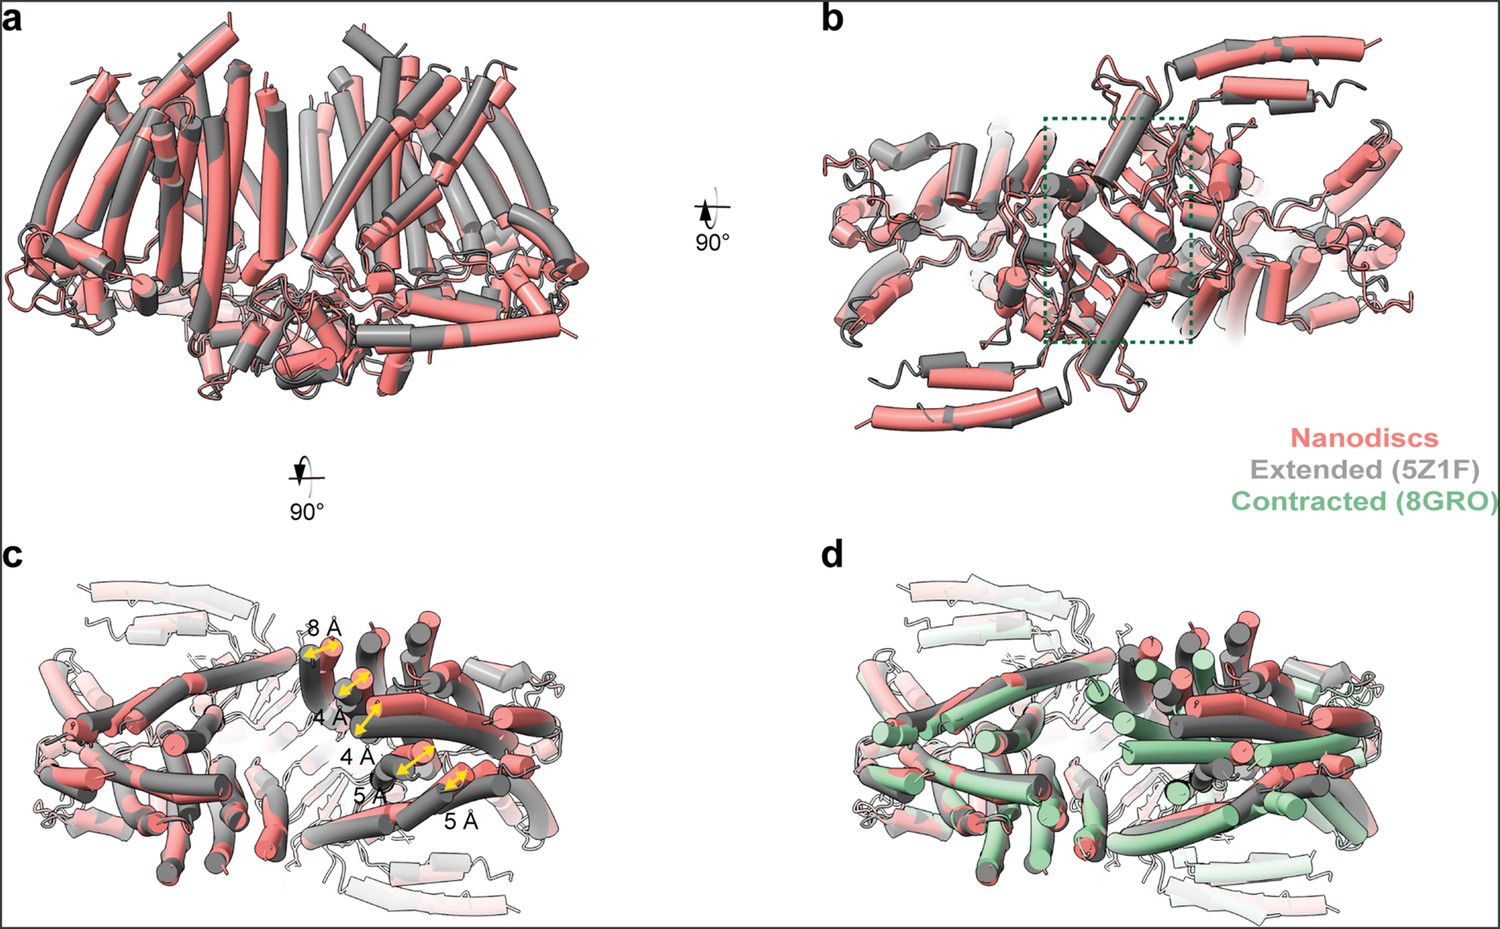
Comparison of OSCA3.1 in nanodiscs and detergent states.
(a) Front view of model superposition of OSCA3.1 in nanodiscs and extended state in digitonin (PDB: 5Z1F). Alignment done on left protomer. (b) Intracellular view. Dimerization domain is enclosed in a green square. (c) Extracellular view illustrating shifts of the nanodisc sample towards the outer edges, and increasing the distance between the two protomers in the inter-subunit cleft. (d) Extracellular view of the OSCA3.1 in nanodiscs, extended state in digitonin, and contracted state in LMNG (PDB: 8GRO).
Figure 2 with 4 supplements
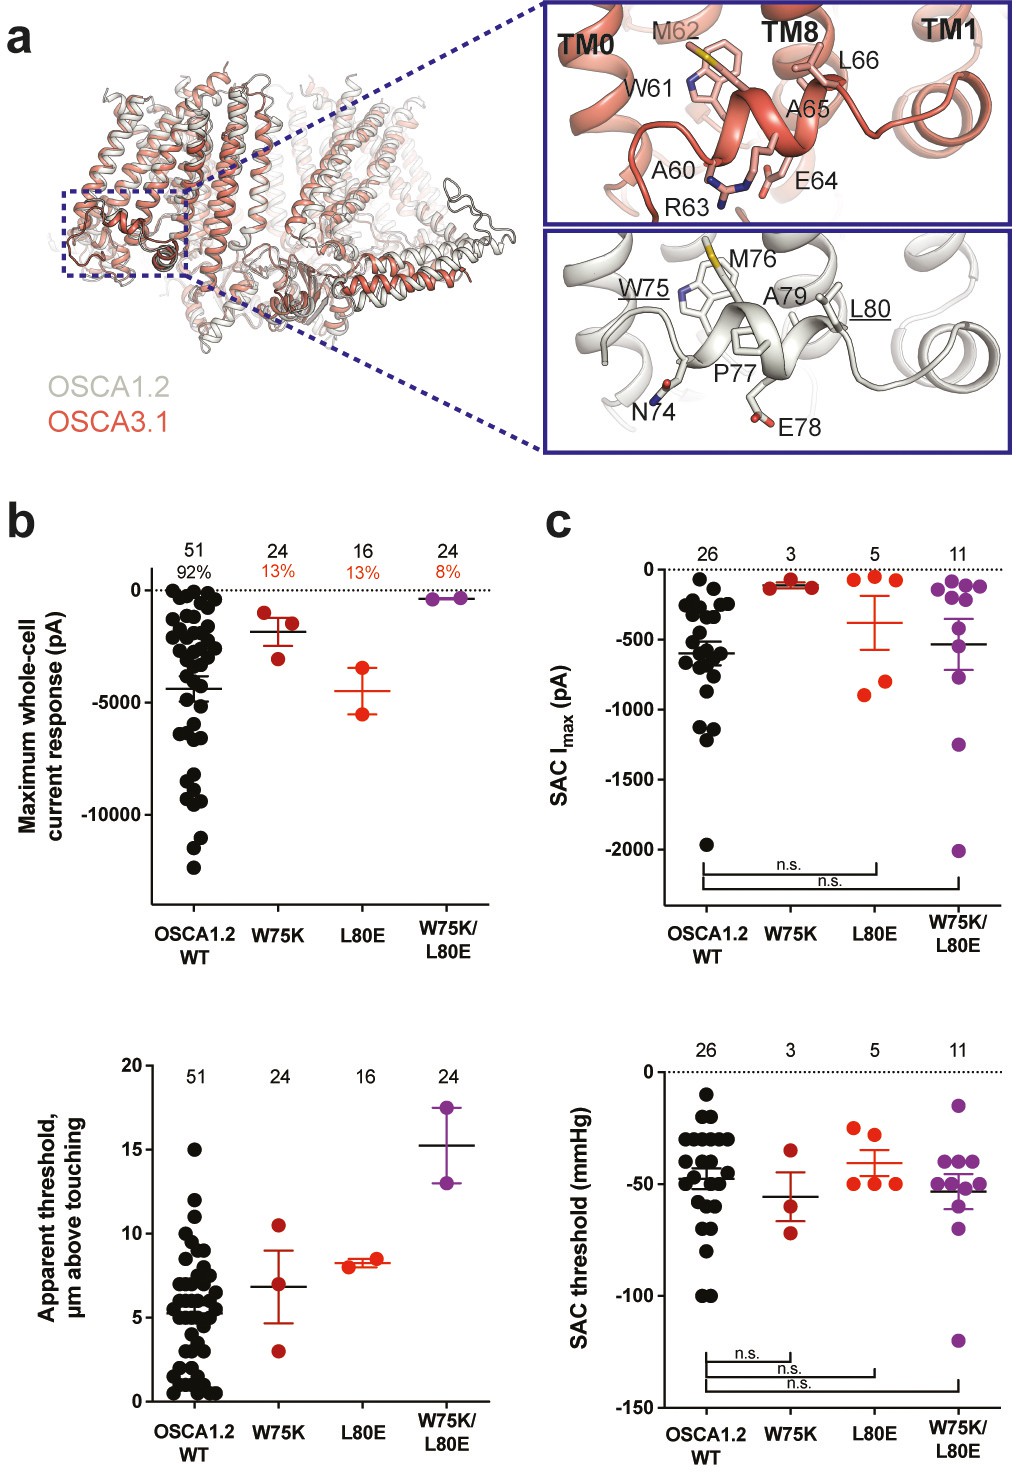
Amphipathic helix mutants of OSCA1.2.
(a) Superposition of OSCA1.2 (grey) and OSCA3.1 (red). Insets: close-up view of amphipathic helix. Residues substituted in OSCA1.2 for electrophysiology experiments are underlined. (b) Few cells expressing mutations in the amphipathic helix respond to poking compared to WT controls. Top panel: Maximum poke-induced currents observed in whole-cell mode for cells exposed to displacements up to 8.9±0.6 µm (N=51; mean ± S.E.M.), 12.8±0.7 µm (N=24), 12.4±0.7 µm (N=16), and 12.8±0.5 µm (N=24) above touching for WT, OSCA1.2W75K, OSCA1.2L80E, and OSCA1.2W75K/L80E, respectively. Bottom panel: the apparent threshold in µm above touching the cell for this cohort. (c) SAC maximal current (Imax) (top) and mmHg threshold (bottom) from WT and OSCA1.2W75K/L80E-expressing cells reveal no significant differences in the ability of negative pressure to activate channels in cell-attached patches (Student’s t-test). Also shown are data from single mutants OSCA1.2W75K and OSCA1.2L80E. Too few patches were obtained for OSCA1.2W75K to compare Imax. Electrode resistances for (c) were similar in all cases (WT: 2.3±0.1 MΩ (N=26); W75K: 2.1±0.4 MΩ (N=3), L80E: 2.2±0.1 MΩ (N=5), W75K/L80E: 1.8±0.1 MΩ (N=11)). For panels (b–c): individual cells are represented as scatter points; mean and S.E.M. are displayed.
Figure 2—figure supplement 1
Protein sequence alignment of OSCA3.1.
Amino acid sequence alignment of Arabidopsis thaliana OSCA3.1, OSCA1.1, and OSCA1.2. Secondary structure of OSCA3.1 represented on top, where rectangles represent α helices and arrows β strands. Dashed lines correspond to regions not modelled. π-helical turns labeled in magenta. IL2H2 and IL2H3 were modelled as poly-Ala and the registry was assigned tentatively. Purple arrowheads point to residues in the amphipathic helix that were mutated in OSCA1.2 for electrophysiology experiments. Predicted lipid-interacting residues denoted by light blue (conserved between OSCA1.2 and OSCA3.1) or brown (not conserved) arrowheads. Evolutionarily coupled residues marked by plus sign (+), with each pair having the same color. TM: Transmembrane; IL: Intracellular Loop; CT: C-terminal; H: Helix; ß: ß-strand.
Figure 2—figure supplement 2
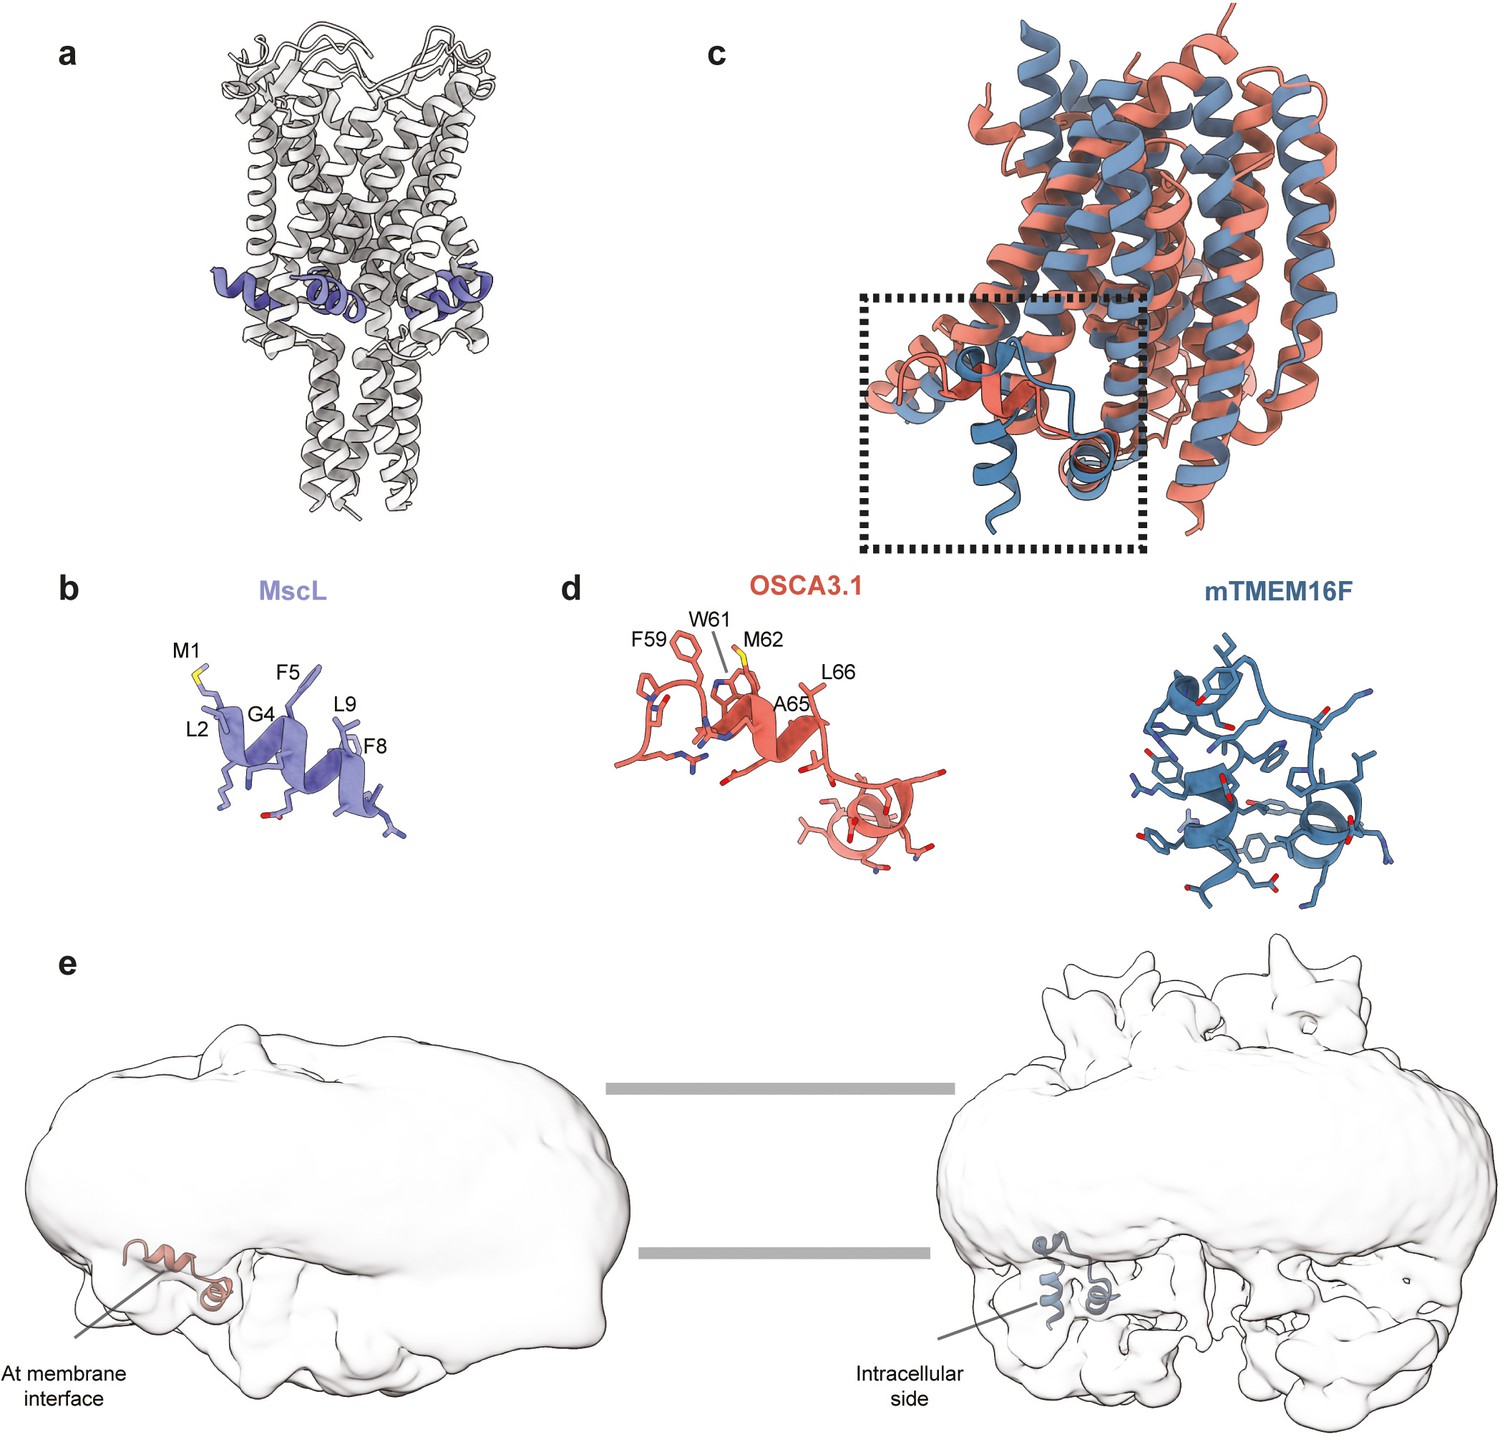
Comparison of the amphipathic helix of OSCA3.1 with corresponding helices in TMEM16 structures.
(a) Structure of MscL (PDB:2OAR). The amphipathic helix is highlighted in purple. (b) Amphipathic helix of MscL with lipid-facing residues labeled. (c) Superposition of transmembrane region of one protomer of OSCA3.1 (TM0 was excluded for simplicity) and homologous mouse (m) TMEM16F (PDB:6QP6). (d) Inset from (c): zoom-in view of amphipathic helix of OSCA3.1 (left) and homologous intracellular helix of mTMEM16F (right). Lipid-facing residues of OSCA3.1 are labeled. (c) EM density of unsharpened density of OSCA3.1 (left) and mTMEM16F (right, EMDB: 4611) showing the position of respective helices shown in (c) and (d). A gaussian-filter of 2 σ was applied to the densities. Horizontal gray lines denote the approximate position of the membrane bilayer.
Figure 2—figure supplement 3
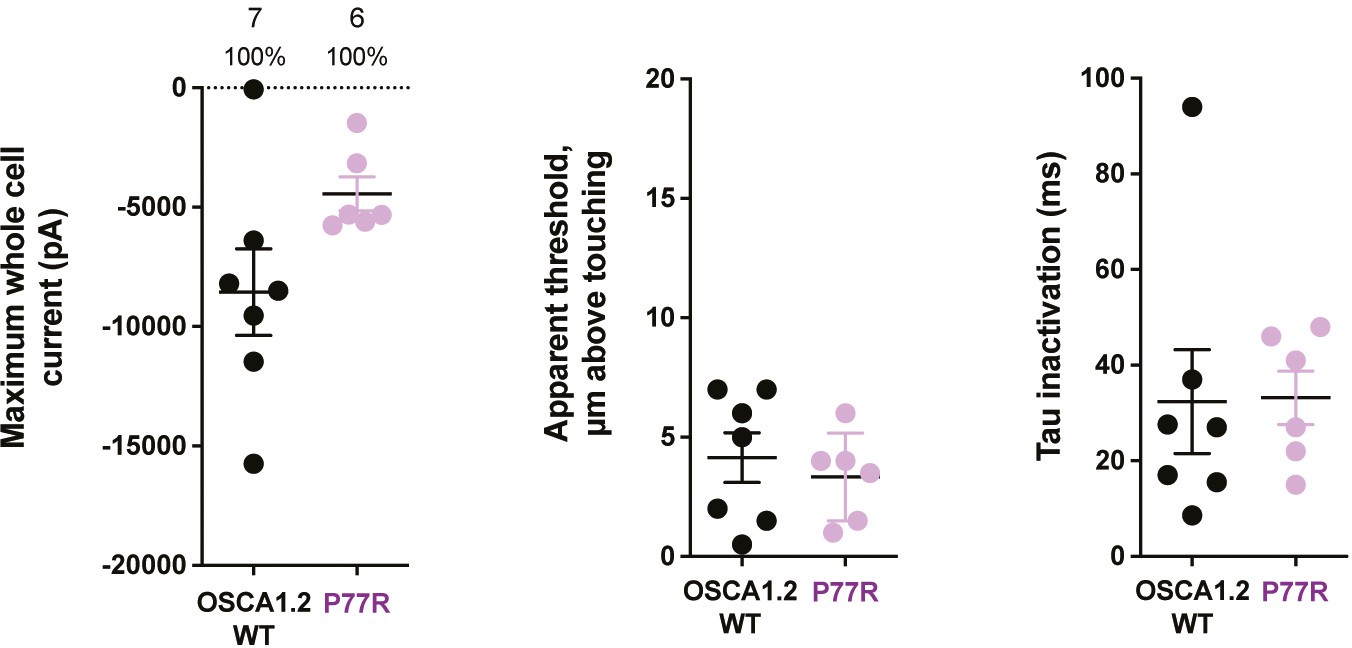
Poke-induced response of OSCA1.2P77R.
Introduction of arginine from OSCA3.1 into the OSCA1.2 background did not alter the poke-induced response. Left panel: Maximum poke-induced whole-cell currents observed for cells exposed to displacements up to 7.2±1.4 µm (N=7; mean ± S.E.M.) and 6.5±0.6 µm (N=6) above touching for WT and OSCA1.2P77R, respectively. Center panel: the apparent threshold in µm above touching for the cells in this cohort. Right panel: Time constant of inactivation of currents elicited in the cells in this cohort.
Figure 2—figure supplement 4
OSCA3.1 may be poke-sensitive at high thresholds.
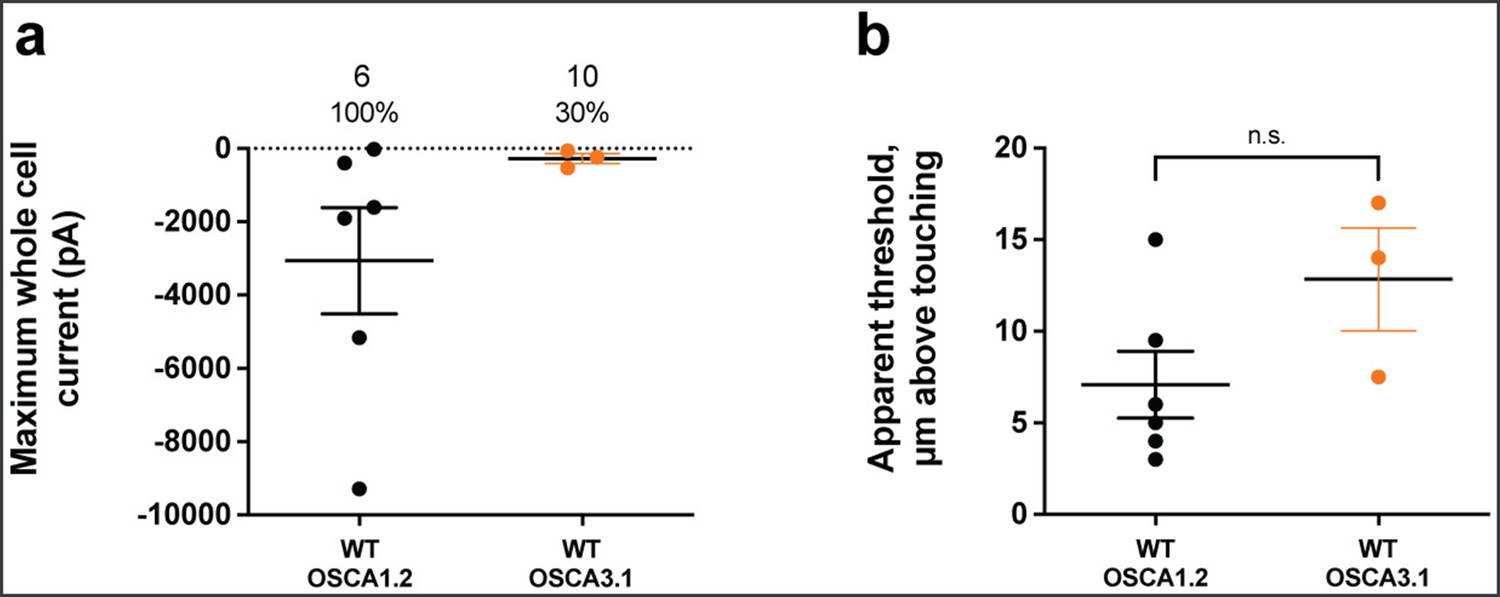
Poke-induced whole-cell current responses are observed in HEK-P1KO cells expressing OSCA3.1. (a) Maximum poke-induced currents observed in whole-cell mode for cells exposed to displacements up to 10.4±1.2 µm (N=6; mean ± S.E.M.) and 13.8±0.9 µm (N=3) above touching for OSCA1.2WT and OSCA3.1WT, respectively. Although 6 of 6 OSCA1.2 expressing cells responded to poking, only 3 of 10 showed a response before the disruption of the recording. (b) The apparent threshold in µm above touching the cell for this cohort.
Figure 3
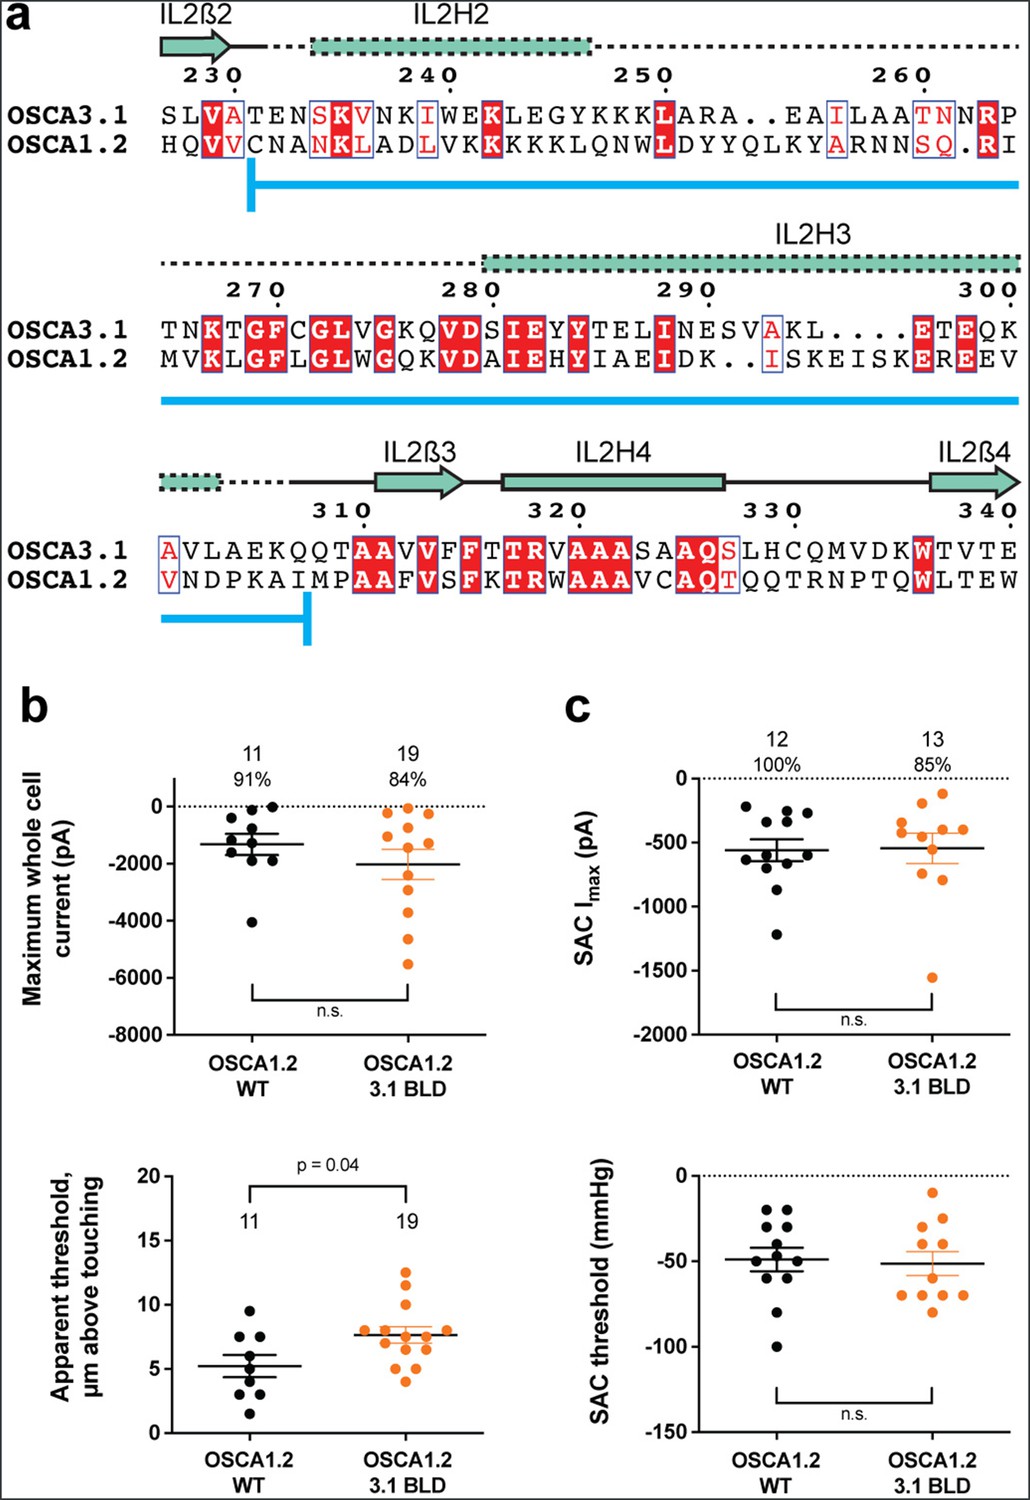
OSCA1.2OSCA3.1-BLD chimera.
(a) Amino acid sequence alignment of the BLD region of OSCA1.2 and OSCA3.1. Full alignment in Figure 2—figure supplement 1. Blue line at bottom of sequences denotes the sequence swapped in OSCA1.2OSCA3.1-BLD chimera. (b) Poke-induced responses are observed in HEK-P1KO cells expressing OSCA1.23.1-BLD. Top panel: Maximum poke-induced currents observed in whole-cell mode for cells exposed to displacements up to 9.8±0.8 µm (N=11; mean ± S.E.M.) and 11.8±0.6 µm (N=19) above touching for WT and OSCA1.23.1-BLD, respectively. The percentage of cells with responses are shown above. Bottom panel: the apparent threshold in µm above touching the cell for this cohort. (c) SAC Imax (top) and mmHg threshold (bottom) from WT and OSCA1.23.1BLD-expressing cells reveal similar activity induced by negative pressure in cell-attached patches. Data shown were obtained from the same experiments. Electrode resistances for (c) were similar in all cases (WT: 2.4±0.1 MΩ (N=12); OSCA1.2OSCA3.1-BLD: 2.5±0.1 MΩ (N=13)).
Figure 4
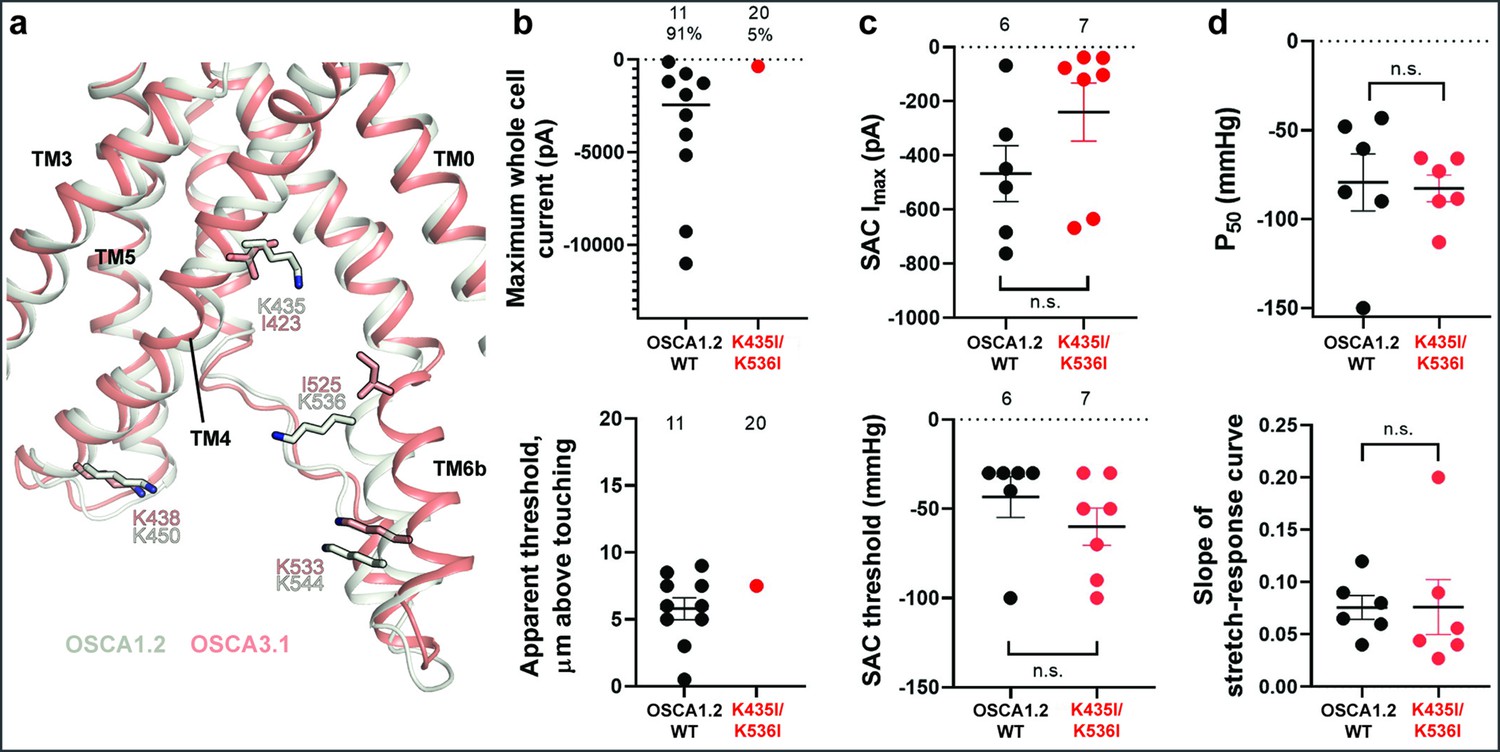
Probing the functional role of the potential lipid-interacting residues.
(a) Superposition of OSCA1.2 and OSCA3.1 around the pore fenestration. Residues of OSCA1.2 predicted to interact with lipids and corresponding residues in OSCA3.1 are shown. (b) Few OSCA1.2K435I/K536I -expressing HEK-P1KO cells respond to the poke stimulus while nearly all cells expressing OSCA1.2 WT channels respond (percentages shown above under the N of cells tested). Top panel: Maximum poke-induced currents observed in whole-cell mode for cells exposed to displacements up to 9.7±1 µm (N=11; mean ± S.E.M.) and 12.1±0.6 µm (N=20) above touching for WT and OSCA1.2K435I/K536I, respectively. Bottom panel: the apparent threshold in µm above touching the cell for this cohort. (c) SAC Imax (top) and mmHg threshold (bottom) from WT and OSCA1.2K435I/K536I-expressing cells reveal no significant differences in the ability of negative pressure to activate channels in cell-attached patches (Student’s t-test). Electrode resistances were similar in all cases (WT: 2.1±0.2 MΩ (N=10); K435I/K546I: 1.7±0.3 MΩ (N=7)). Data were collected within 15 min of exposure of cells to high K+used in this assay. (d) Analysis of stimulus-response relationships reveal no significant differences (Student’s t-test) in pressure to half-maximal activation (P50; top) or the slope of the curve (bottom). Whole cell and SAC data were obtained from cells transfected at the same time.
Tables
Table 1
Data collection, processing, model refinement and validation.
| OSCA3.1 | |
|---|---|
| Data collection and processing | |
| Magnification | 29000 |
| Voltage (kV) | 300 |
| Electron exposure (e–/Å2) | 50 |
| Defocus range (μm) | –0.4 to –1.5 |
| Pixel size (Å) | 1.03 |
| Initial particle images (no.) | 1,913,316 |
| Symmetry imposed | C2 |
| Final particle images (no.) | 197,944 |
| Map resolution (Å) FSC threshold | 2.6 0.143 |
| Map sharpening B factor (Å2) | –64 |
| Model | |
| Composition Peptide chains Protein residues Ligands | 2 1148 24 |
| R.m.s. deviations Bond lengths (Å) Bond angles (°) | 0.023 1.677 |
| Validation MolProbity score Clashscore EMRinger score Poor rotamers (%) | 0.74 0.74 4.12 0.00 |
| Ramachandran plot Favored (%) Allowed (%) Disallowed (%) | 98.93 1.07 0.00 |
| Deposition ID EMDB PDB | 41911 8 U53 |
Additional files
Download links
A two-part list of links to download the article, or parts of the article, in various formats.
Downloads (link to download the article as PDF)
Open citations (links to open the citations from this article in various online reference manager services)
Cite this article (links to download the citations from this article in formats compatible with various reference manager tools)
Structure-guided mutagenesis of OSCAs reveals differential activation to mechanical stimuli
eLife 12:RP93147.
https://doi.org/10.7554/eLife.93147.3


