Transcriptome-wide analysis of the function of Ded1 in translation preinitiation complex assembly in a reconstituted in vitro system
- Section on the Mechanism and Regulation of Protein Synthesis, Eunice Kennedy Shriver National Institute of Child Health and Human Development, United States
- Section on Nutrient Control of Gene Expression, Eunice Kennedy Shriver National Institute of Child Health and Human Development, United States
Figures
Figure 1 with 4 supplements
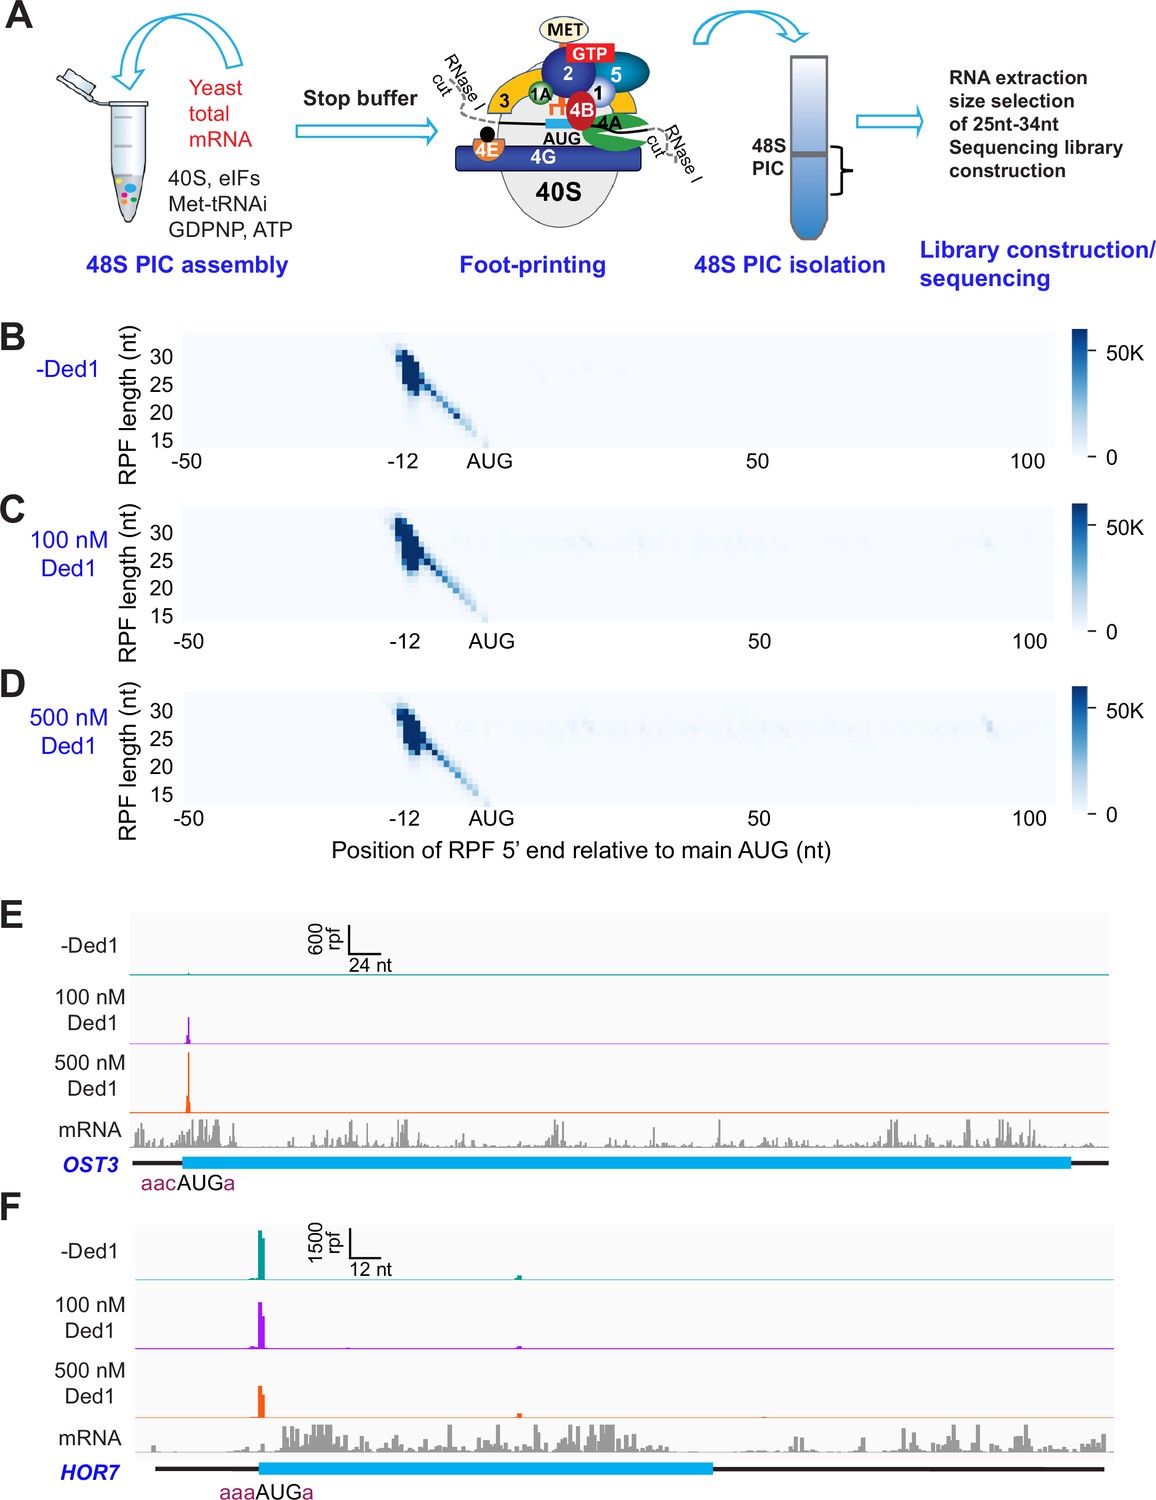
Recruitment Sequencing (Rec-Seq) allows transcriptome-wide analysis of early steps of translation initiation in a purified system.
(A) Overview of steps in the Rec-Seq method. 48S ribosomal preinitiation complexes (PICs) are assembled in vitro from purified S. cerevisiae components. 48S PICs are treated with RNase I to digest unprotected mRNA and then isolated using sucrose density gradient ultracentrifugation. Ribosome-protected mRNA fragments (RPFs) are used to construct a sequencing library. (B–D) Metagene plots of RPF distributions over 150 nt windows (–50 to +100 nt) on all mRNAs aligned to their main AUG start codons for no Ded1 (B); 100 nM Ded1 (C), or 500 nM Ded1 (D). RPF lengths are shown on the Y-axis and the position of the 5′ ends of the RPFs relative to the main start codon are shown on the X-axis. A 5′ end located 12 nt from the start codon is expected for 48S PICs with the AUG in the P site of the 40S subunit (Wagner et al., 2020). The color scale shows RPF density. All reads for three replicates for each condition were combined. (E, F) RPFs for the 0, 100, and 500 nM Ded1 experiments for previously identified Ded1 hypodependent (OST3, E) and hyperdependent (HOR7, F) mRNAs. The position of the main coding sequences (CDS) is shown in cyan and the −3 to −1 and +4 context nucleotides surrounding the main AUG are shown in brick red text. mRNA sequencing reads are also shown below each set of tracks (gray). The Integrated Genome Viewer (IGV, Broad Institute) was used to display RPF and mRNA reads, with RPF and nucleotide (nt) scales indicated on top of each panel. For these and all other gene browser views, the RPFs are plotted to their predicted P-site positions, and the mRNA reads are plotted to their first position from their transcript 5′ ends.
Figure 1—figure supplement 1
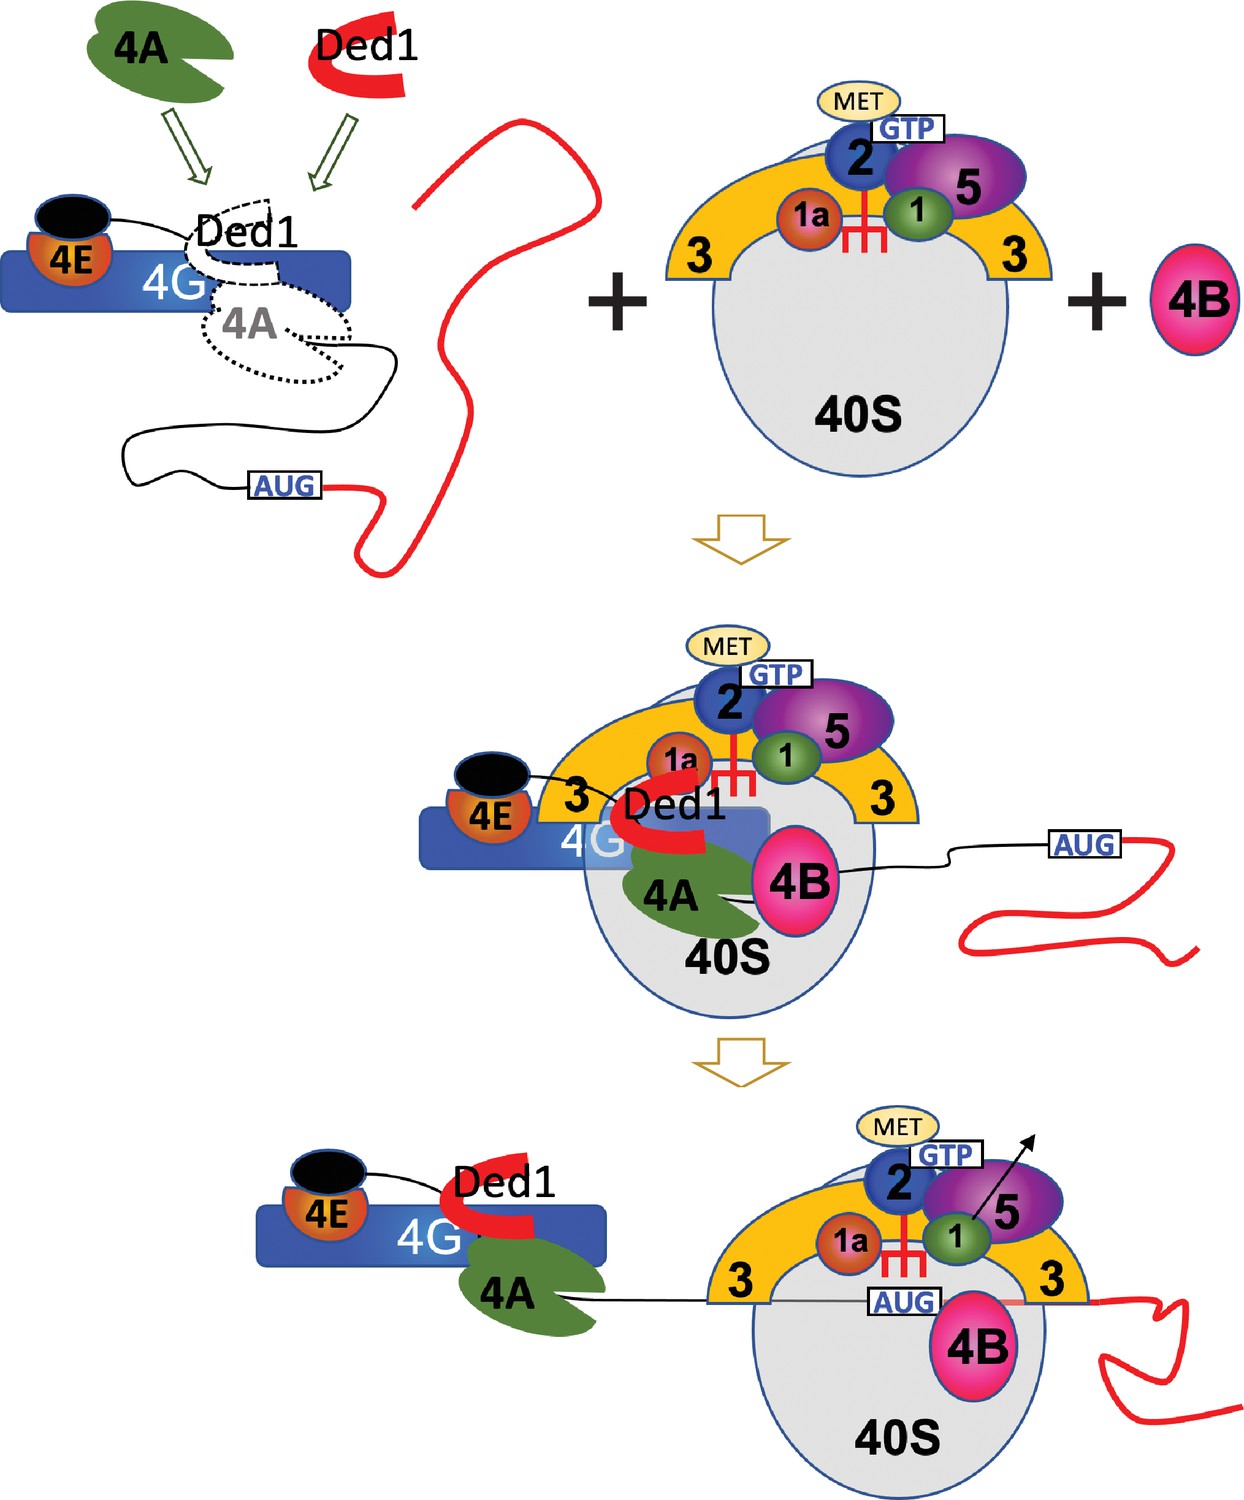
A schematic diagram of mRNA recruitment in translation initiation.
The cap-binding protein complex eIF4F, consisting of eIF4E, eIF4G, and eIF4A subunits attaches to the cap at the mRNA 5′ end. The 43S preinitiation complex (PIC), which includes the 40S ribosomal subunit, eIFs 1, 1A, 3, and 5 and the eIF2•GTP•Met-tRNAi ternary complex, binds to the 5′ end of mRNA with the aid of the eIF4F complex and eIF4B and scans downstream in search of the start codon. A stable 48S-PIC is formed when a start codon is recognized.
Figure 1—figure supplement 2

Internal spike-in normalization controls using preformed 48S preinitiation complexes (PICs) on non-native mRNAs.
(A) Steps in applying 48S-PIC spike-in controls for data normalization. Firefly and Renilla luciferase mRNAs (FLUC and RLUC) were in vitro transcribed from PCR-amplified gene templates containing T7 promoters and enzymatically capped using previously described protocols (Acker et al., 2007). The 48S PICs formed on the spike-in mRNAs were prepared separately from the testing samples in a recruitment reaction followed by RNase I treatment to digest unprotected mRNA. A constant amount of spike-in 48S PICs were resolved by sedimentation through the same sucrose gradients containing the experimental samples. The ribosome-protected fragments (RPFs) from these spike-in PICs served as internal controls for losses occurring during library construction and allowed data normalization across experimental samples. For deep sequencing data processing, non-coding RNA reads were removed and the remaining RPFs were aligned to spike-in mRNA sequences for calculating sample size factors and also aligned to the yeast genome to produce RPF counts on all yeast mRNAs. The RPF counts for all mRNAs in the genome were applied to DESeq2 using sample size factors calculated from the geometric means of spike-in mRNA RPFs mapped to FLUC/RLUC main AUGs and a number of internal AUGs. Recruitment efficiency (RE) values were calculated by normalizing the size-factor corrected RPFs to input mRNA densities. (B–D) Scatterplots of FLUC and RLUC RPF reads at the main and internal AUGs, in the first two of three replicate samples for each condition. The green diagonal line is for 1:1 ratio and the Spearman correlation coefficients (r) were calculated using ‘cor.test’ function in R using option ‘method = spearman’.
Figure 1—figure supplement 3
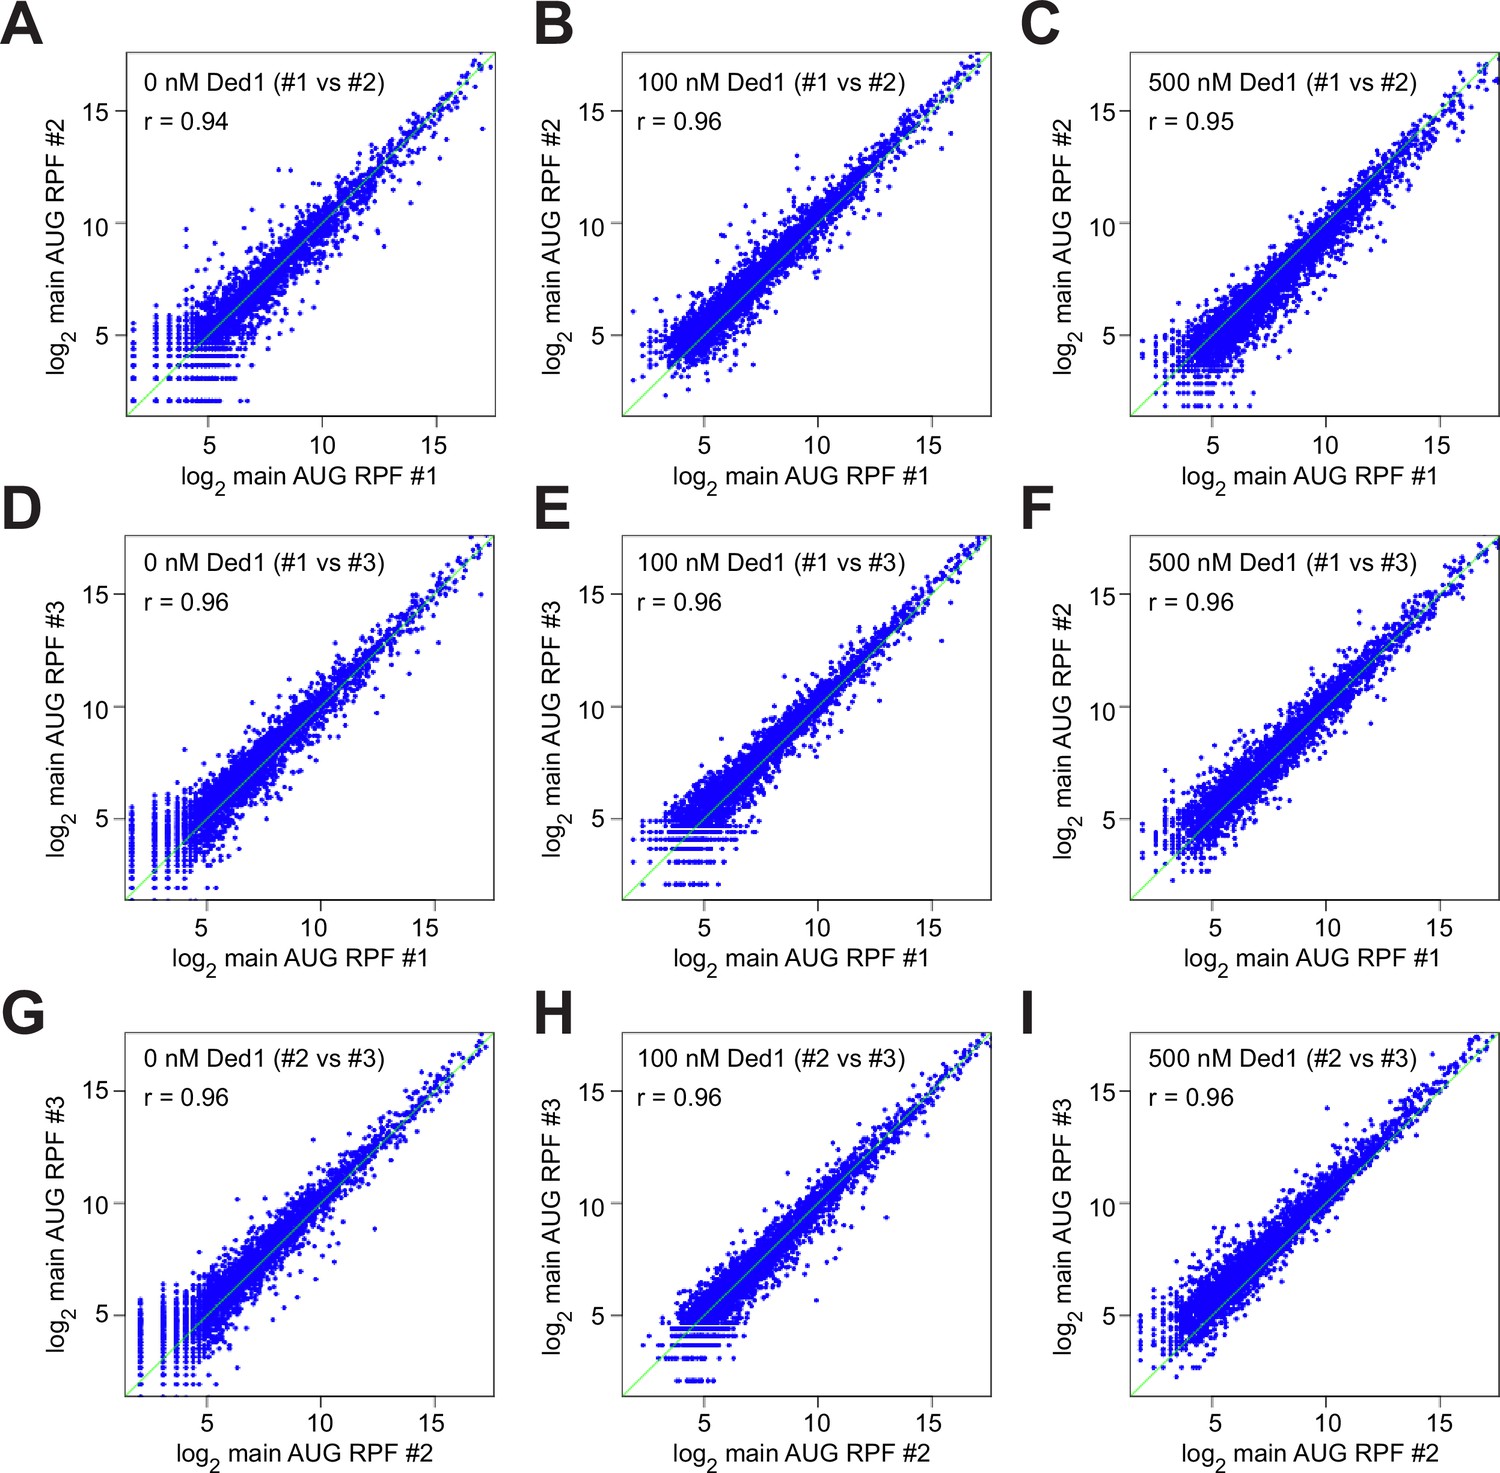
Transcriptome-wide reproducibility of ribosome-protected fragments (RPFs) among replicates.
(A–I) Scatterplots of log2 main AUG ribosome occupancies (normalized by the geometric means of RPF reads on FLUC and RLUC spike-in mRNAs) for comparing each of two of the three replicates in different conditions, 0 nM Ded1 (A, D, G), 100 nM Ded1 (B, E, H), and 500 nM Ded1 (C, F, I) for all mRNAs with ≥90 total RPF reads in the nine samples combined. Spearman correlation coefficients (r) were calculated as in Figure 1—figure supplement 2B–D.
Figure 1—figure supplement 4
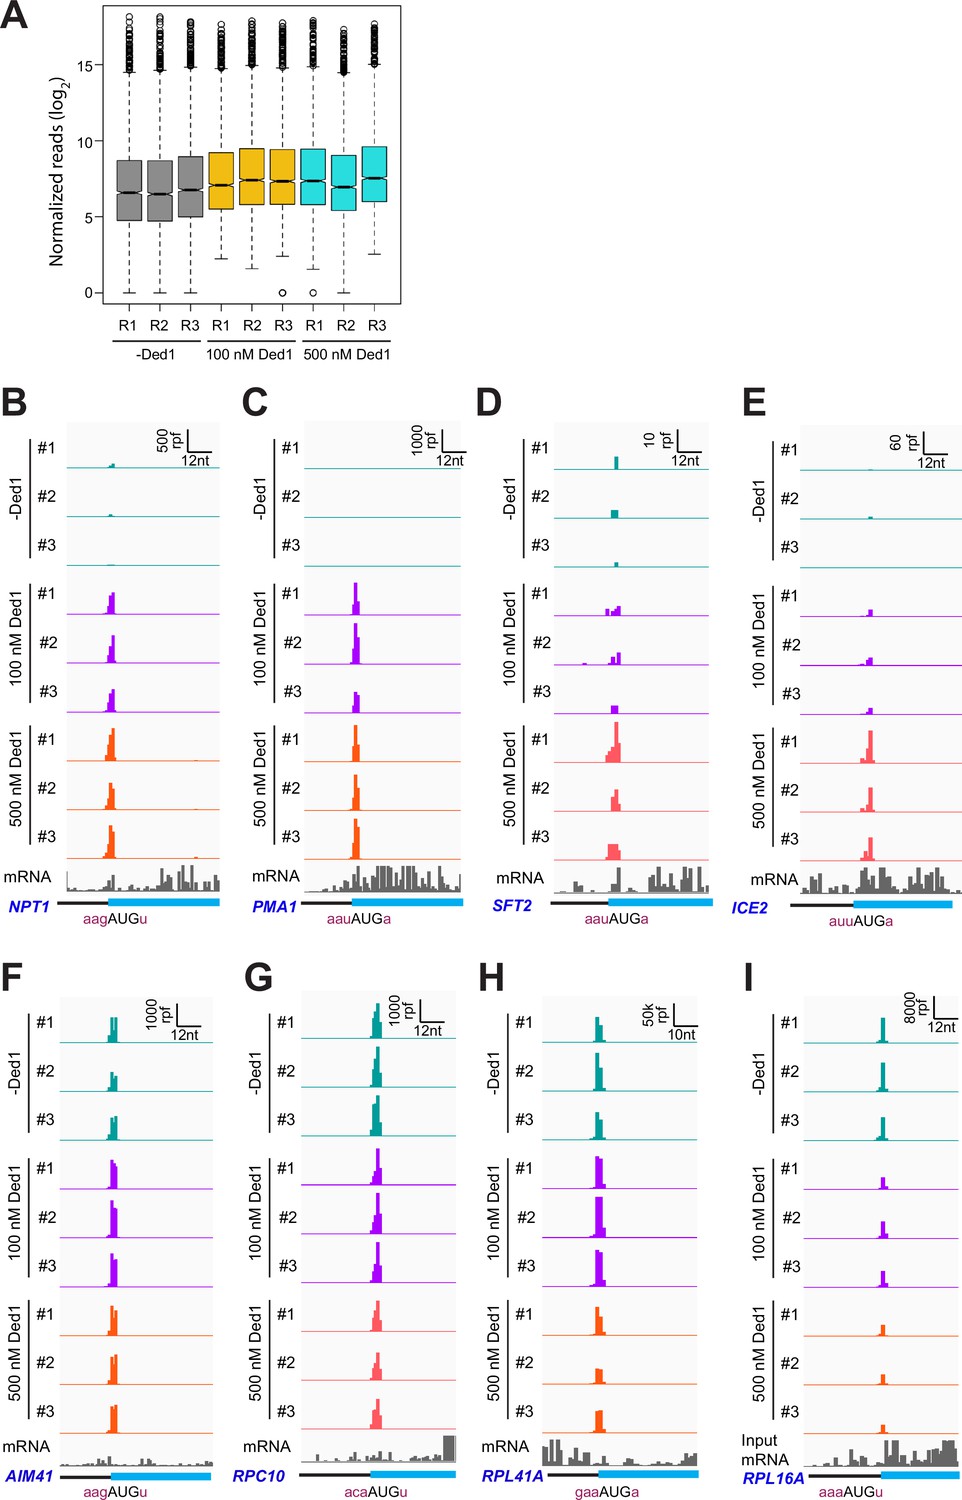
Ribosome-protected fragments (RPFs) on main AUGs are consistent among replicates.
(A) Boxplot analysis of normalized RPF reads for 3052 mRNAs with >90 total reads in nine samples (each of three replicates for 0, 100, and 500 nM Ded1). (B–I) 48S preinitiation complex (PIC)-protected fragments (RPFs) and input mRNA reads for three replicates of each of the three conditions (0, 100, and 500 nM Ded1) on eight example mRNAs across 3′ portions of the 5′UTR and 5′ portions of the coding sequences (CDS) regions flanking the main AUGs. RPF and nt scales are shown in the top-right corner of each panel. The position of the main CDS and the −3 to −1 and +4 context nucleotides surrounding the main AUG are labeled as in Figure 1E and F. mRNAs shown are (B) NPT1; (C) PMA1; (D) SFT2; (E) ICE2; (F) AIM41; (G) RCP10; (H) RPL41A; and (I) RPL16A.
Figure 2
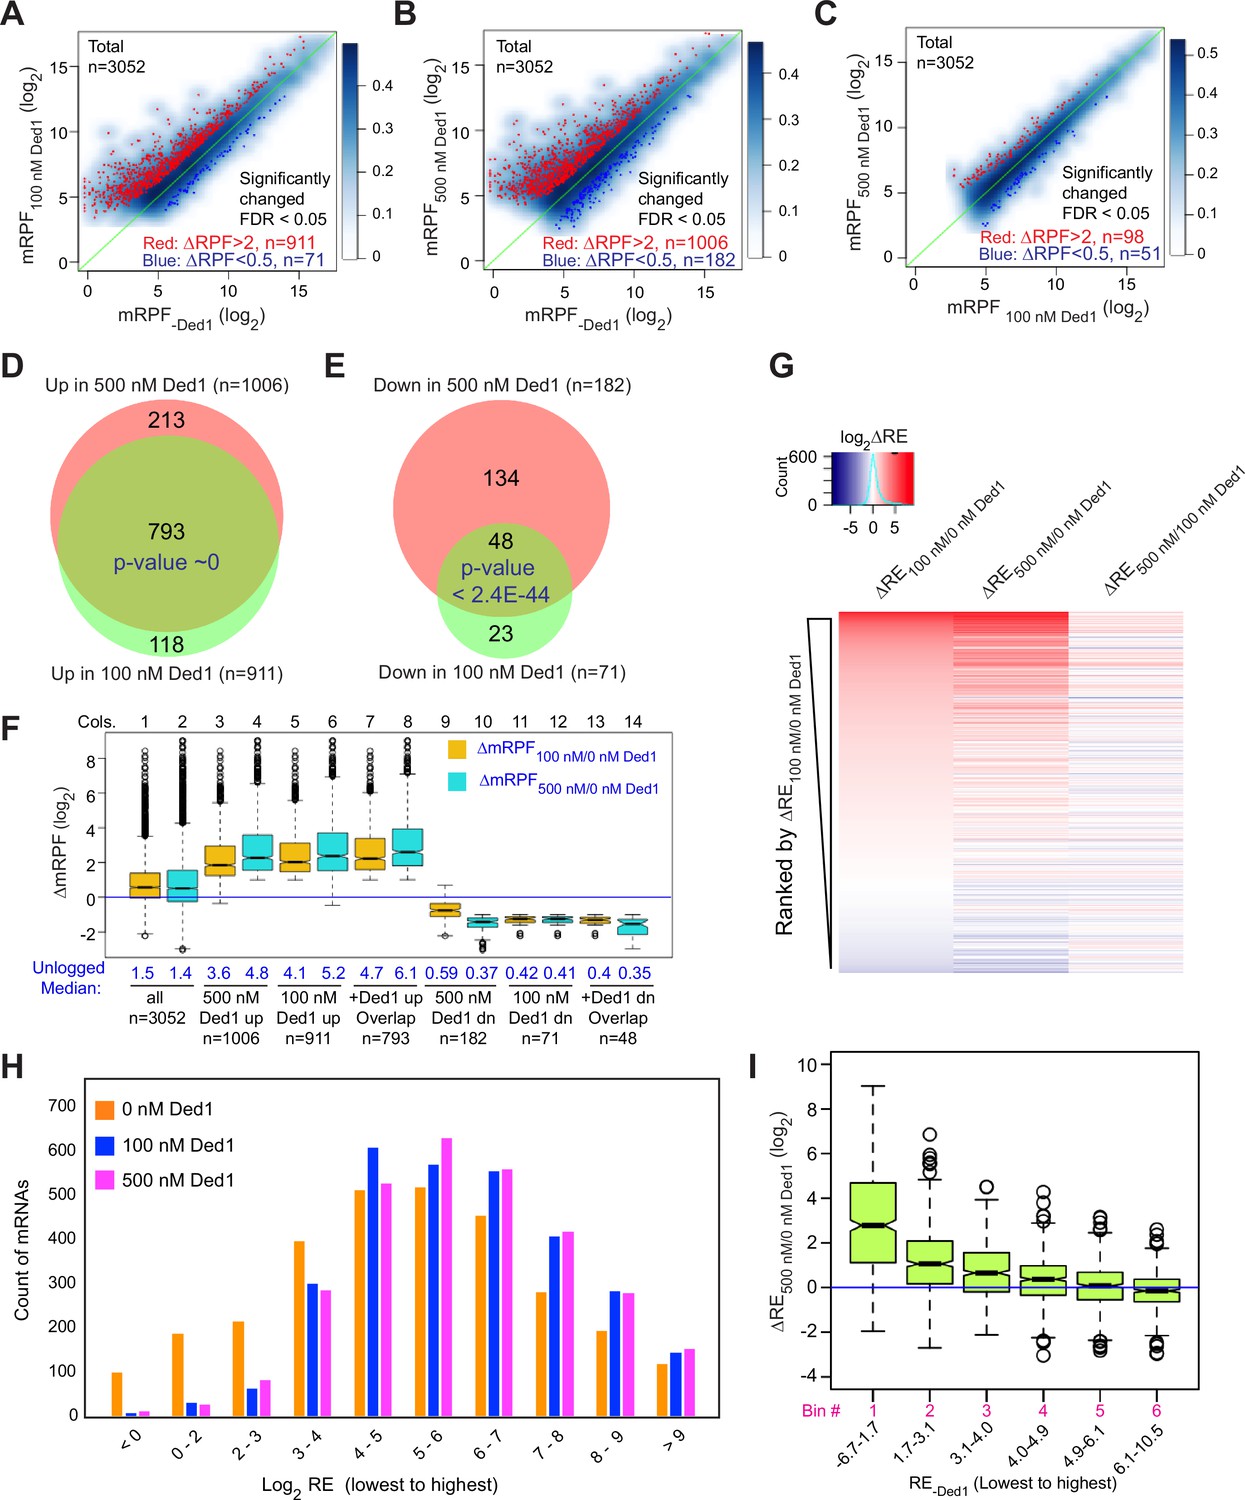
Ded1 promotes the recruitment of a group of 1000 mRNAs.
(A–C) Scatterplots of normalized read densities on the main start codons of mRNAs (mRPF, number of ribosome-protected fragments [RPFs] mapping to the main AUG normalized by the geometric means of the spike-in internal control RPFs) for 3052 mRNAs with >90 total reads in nine samples (three replicates each for 0, 100, and 500 nM Ded1) for 100 versus 0 nM Ded1 (A), 500 versus 0 nM Ded1 (B), or 500 versus 100 nM Ded1 (C). mRNAs with significantly changed recruitment were defined as those with false discovery rate (FDR) < 0.05 and RPF changes (ΔRPF) of >2 for increased or <0.5 for decreased are indicated in red or dark blue, respectively. The number of significantly changed mRNAs is indicated in red (increased) and blue (decreased). (D, E) Overlaps between the mRNAs displaying significantly increased (D) or significantly reduced (E) mRPFs between 100 and 500 nM Ded1 conditions. p-Values for the overlap between each group were calculated using an online tool (http://nemates.org/MA/progs/overlap_stats.html). (F) Boxplot analysis of the distribution and median of log2 change in mRPF between 0 and 100 nM Ded1 (ΔmRPF100/0 nM Ded1, orange) or 0 and 500 nM Ded1 (ΔmRPF500/0 nM Ded1, cyan) for all 3052 mRNAs (cols. 1–2), and for the following 6 groups of mRNAs: 1006 or 911 for which mRPFs were significantly up in 500 or 100 nM Ded1, respectively, relative to no Ded1 (cols. 3–6, for red dots in B and A); 793 mRNAs for which mRPFs were significantly up with both 100 and 500 nM Ded1 (cols. 7–8, for the overlapping mRNAs in D); 182 and 71 mRNAs for which mRPFs were significantly down in 500 or 100 nM Ded1 relative to no Ded1 (cols. 9–12, blue dots in B and A); and 48 mRNAs for which mRPFs were significantly down with both 100 and 500 nM Ded1 (cols.13–14, for the overlaps in E). The blue horizontal line shows no change in mRPFs (ΔmRPF = 1). (G) Heat map analysis of the recruitment efficiency changes ΔRE100/0 nM Ded1, ΔRE500/0 nM Ded1 and ΔRE500/100 nM Ded1 for the 3052 mRNAs described in (A–C), ordered by rank of ΔRE100/0 nM Ded1 from most increased (top) to most decreased (bottom) using the R heatmap.2 function. (H) The distributions of all observed mRNAs across 10 bins of increasing RE values at each concentration of Ded1 (0, 100, 500 nM). (I) Boxplot analysis of ΔRE500/0 nM Ded1 for all 3052 observed mRNAs binned by RE in the absence of Ded1 (RE-Ded1) from the lowest to the highest.
Figure 3 with 3 supplements
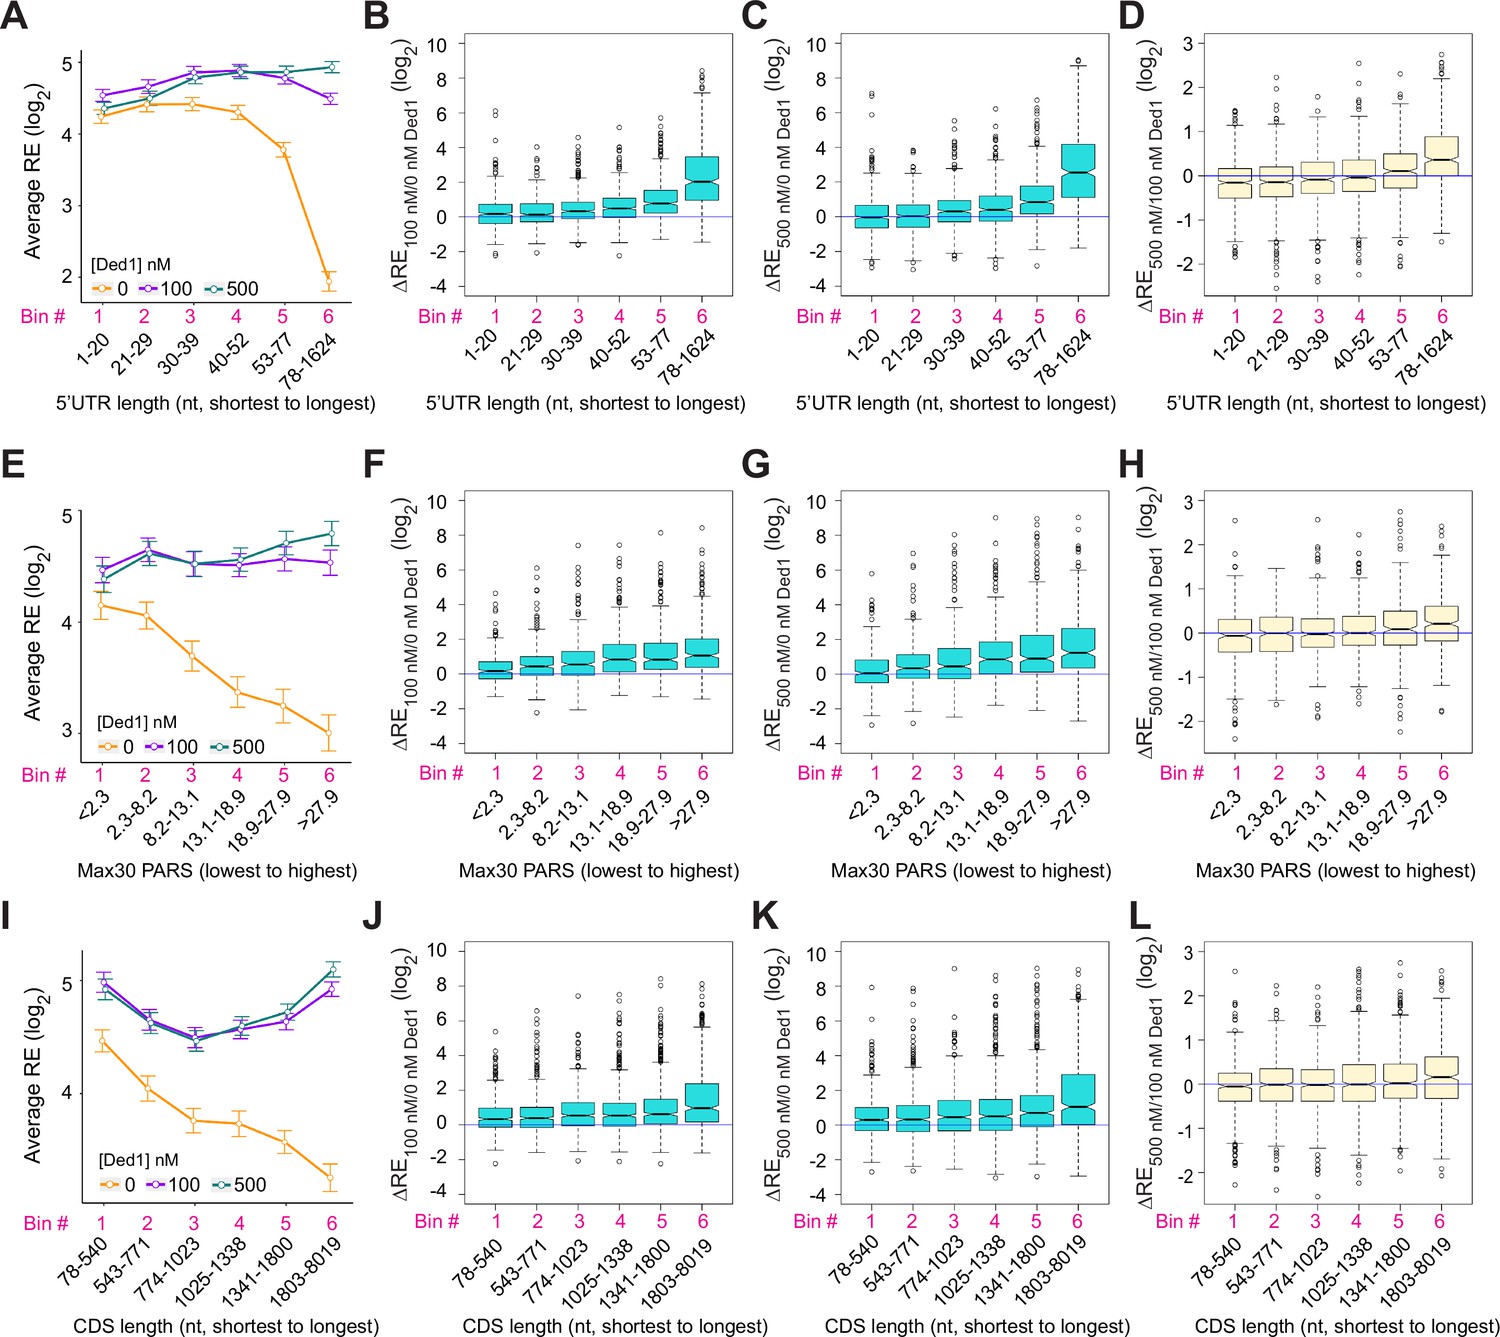
Ded1 promotes the recruitment of mRNAs with long or structured 5′UTRs.
(A) Line plot analysis of average recruitment efficiency (RE) for the 2804 mRNAs observed in the Rec-Seq experiments that have annotated 5′UTRs binned by 5′UTR length at 0, 100, and 500 nM Ded1. Average RE values were determined from the RE values of all mRNAs in each bin. (B–D) Boxplot analyses of the RE changes (ΔRE) between each of two different conditions for the same mRNA bins as in (A) for ΔRE100/0nM_Ded1 (B), ΔRE500/0nM_Ded1 (C), or ΔRE500/100nM_Ded1 (D). (E) Line plot analysis of average RE values for the 1874 mRNAs observed in the Rec-Seq experiments with reported parallel analysis of RNA structure (PARS) scores binned according to Max30 PARS scores from the lowest to the highest. PARS scores were determined by Kertesz et al., 2010 and Max30 and other PARS score intervals were calculated as described in Sen et al., 2015. (F–H) Boxplot analyses for the same mRNA bins as in (E) for ΔRE100/0nM_Ded1 (F), ΔRE500/0nM_Ded1 (G), or ΔRE500/100nM_Ded1 (H). (I) Line plot analysis of average REs for all 3052 mRNAs divided into six equal-sized bins according to coding sequences (CDS) lengths from the shortest to the longest for 0, 100, and 500 nM Ded1. (J–L) Boxplot analysis for the same mRNA bins as in (I) for ΔRE100/0nM_Ded1 (J), ΔRE500/0nM_Ded1 (K), or ΔRE500/100nM_Ded1 (L). All bins contain an equal number of mRNAs.
Figure 3—figure supplement 1
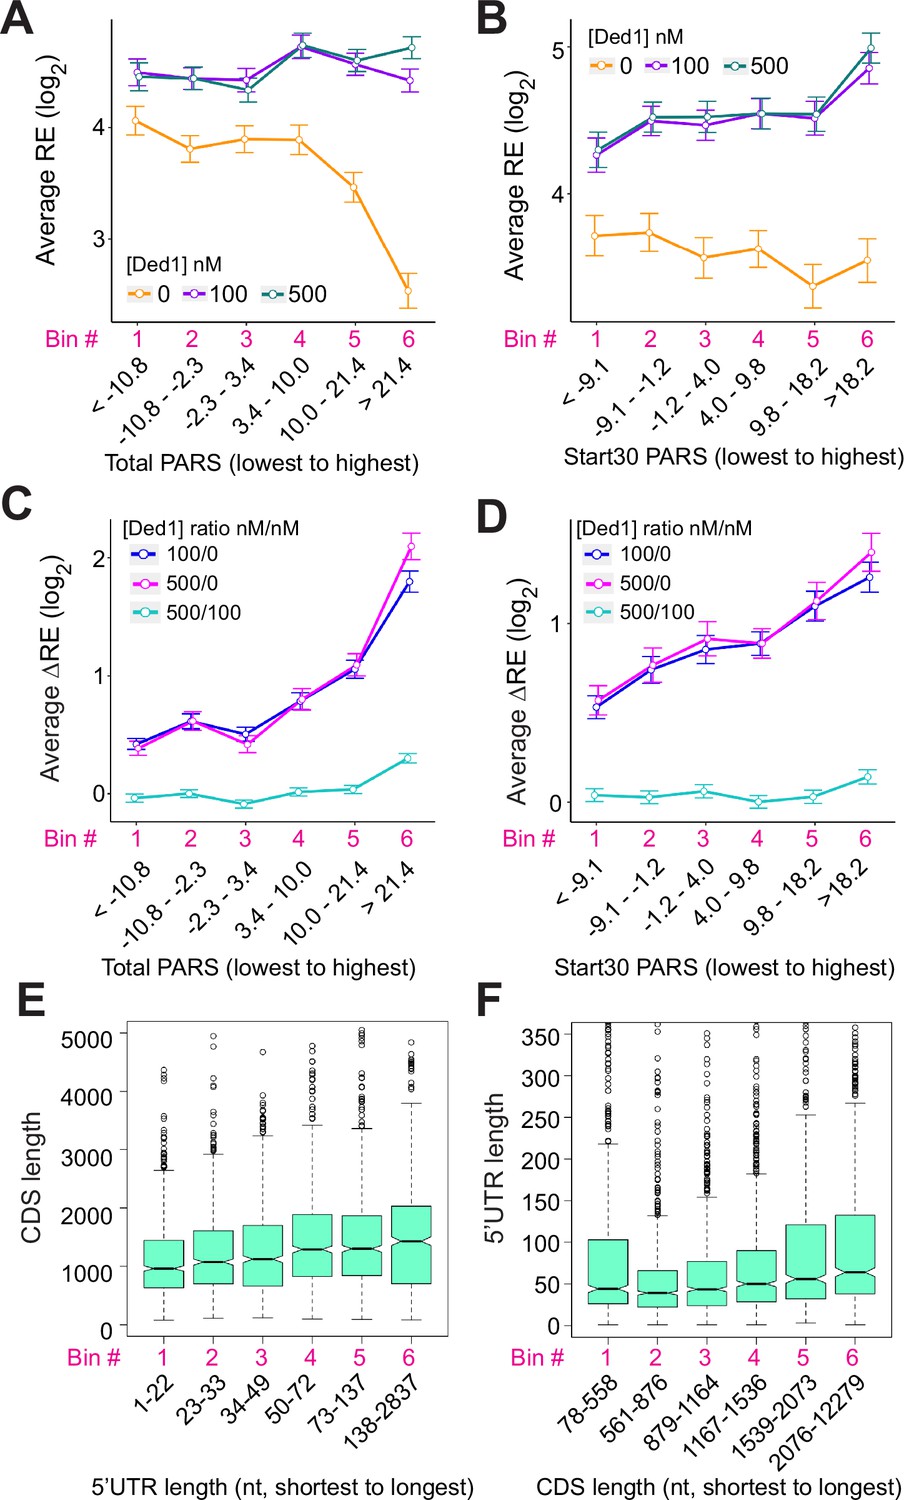
Ded1 preferentially stimulates 48S preinitiation complex (PIC) formation on structured mRNAs.
(A, B) Line plot analysis of log2 average recruitment efficiencies (REs) at 0, 100, and 500 nM Ded1for mRNAs binned according to total parallel analysis of RNA structure (PARS) scores (A) or the sum of PARS scores of the 30 nt surrounding the start codon (for mRNAs with a 5′UTR of ≥15 nt) (Start30 PARS, B). (C, D) Line plot analysis of log2 average ΔREs for 100/0 nM, 500/0 nM, and 500/100 nM Ded1 for the 2035 mRNAs observed in Rec-Seq that have annotated PARS scores binned according to total PARS (C) or Start30 PARS (D) scores from the lowest to the highest. (E, F) Boxplots comparing 5′UTR or coding sequences (CDS) lengths for the 4694 yeast mRNAs that have annotated 5′UTRs (Pelechano et al., 2013) for CDS lengths plotted for mRNAs binned by 5′UTR length from the shortest to the longest (E), or 5′UTR lengths plotted for mRNAs binned by CDS lengths from the shortest to the longest (F). All bins contain equal number of mRNAs.
Figure 3—figure supplement 2
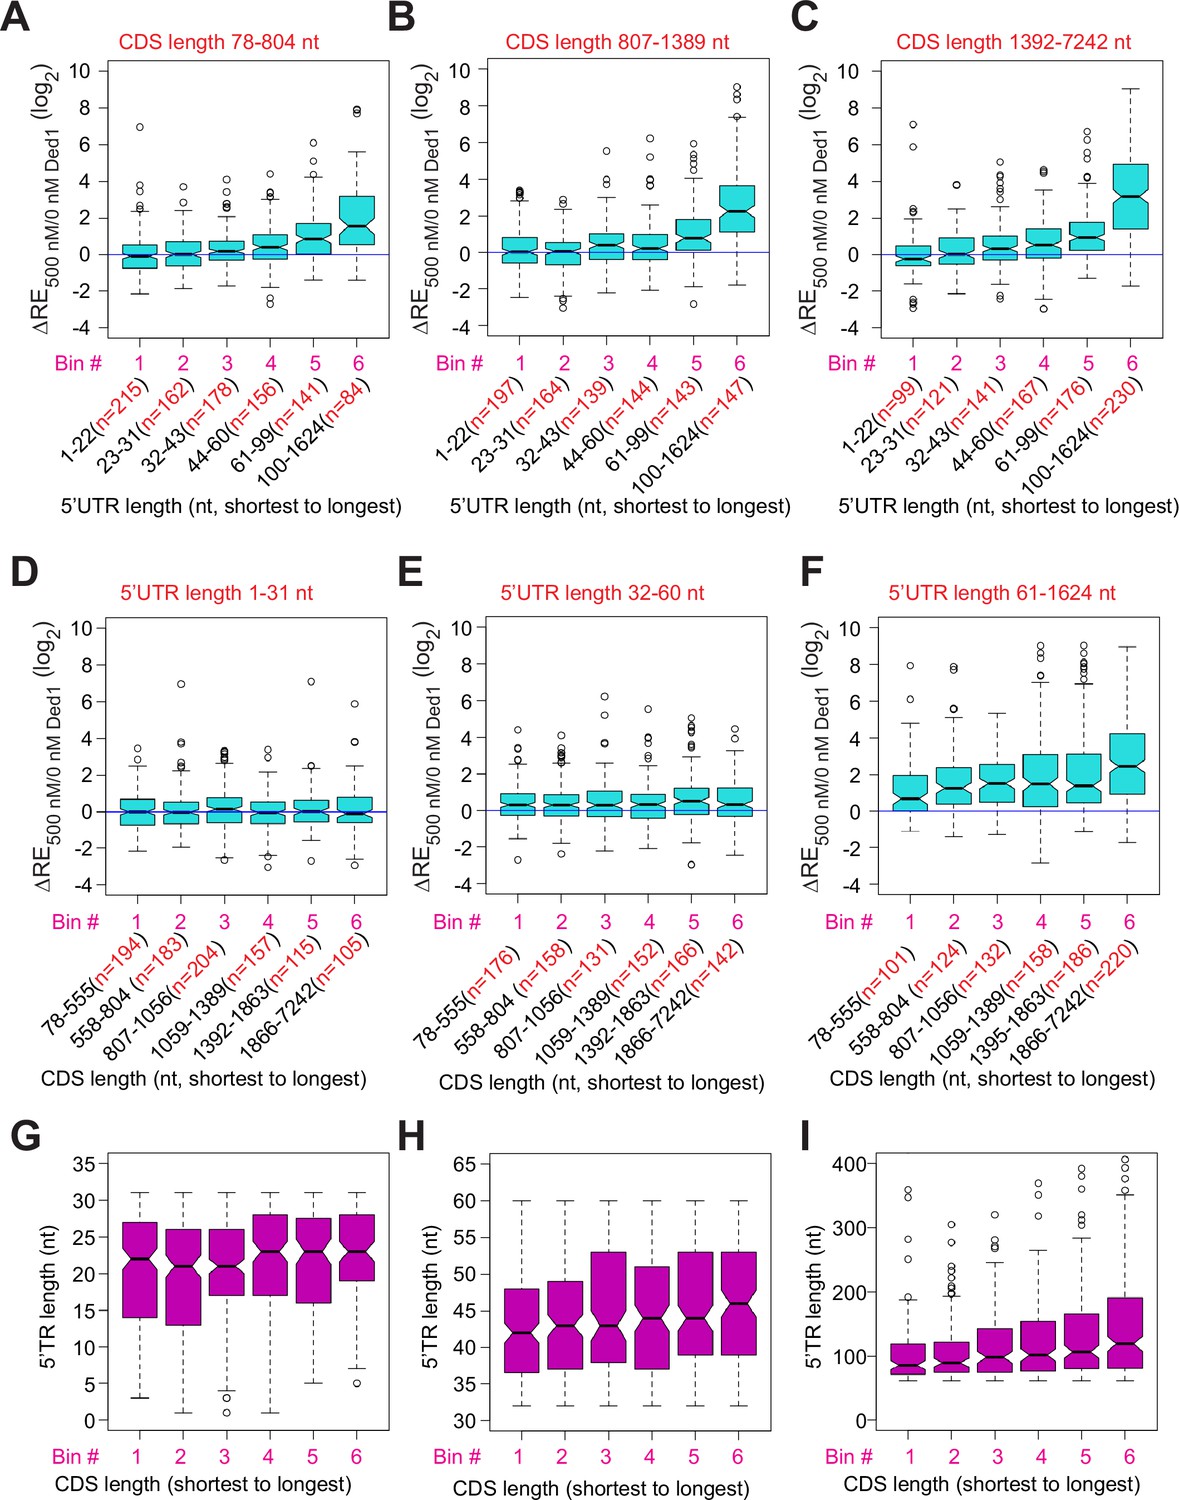
Ded1 promotes the recruitment of mRNAs with long 5′UTRs independent of coding sequences (CDS) lengths.
(A–C) Similar to Figure 3C, but for mRNAs with different CDS length ranges, short (A, 78–804 nt, n = 936), medium (B, 807–1389 nt, n = 934), and long (C, 1392–7242 nt, n = 934). (D–F) Similar to Figure 3K, but for mRNAs with different 5′UTR length ranges, short (D, 1–31 nt, n = 958), medium (E, 32–60 nt, n = 925), and long (C, 13922–7242 nt, n = 921). (G–I) Boxplot analysis of mRNA 5′UTR lengths for the same groups of mRNAs as in panels (D–F), respectively.
Figure 3—figure supplement 3
Ded1 has little effect on discriminating main AUG context scores.
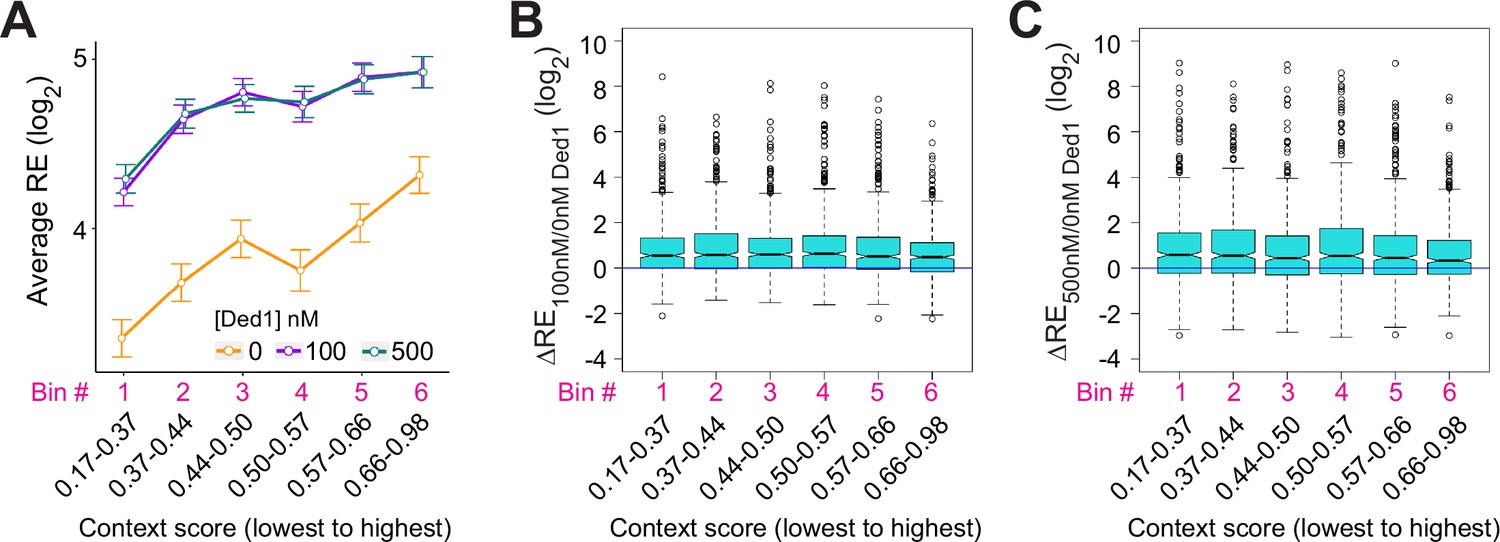
(A) Line plot analysis of average recruitment efficiencies (REs) for the 2768 observed in Rec-Seq that have annotated 5′UTR lengths >5 nt, divided into six equal-sized bins according to context scores from lowest to the highest at 0, 100, and 500 nM Ded1. (B, C) Boxplot analyses of ΔRE100/0nM Ded1 (B) and ΔRE500/0nM Ded1 (C) values for the same mRNA bins as in (A).
Figure 4
Ded1 dependencies observed in Rec-Seq experiments correlate strongly with in vivo results from previous ribosome profiling of the ded1-cs mutant.
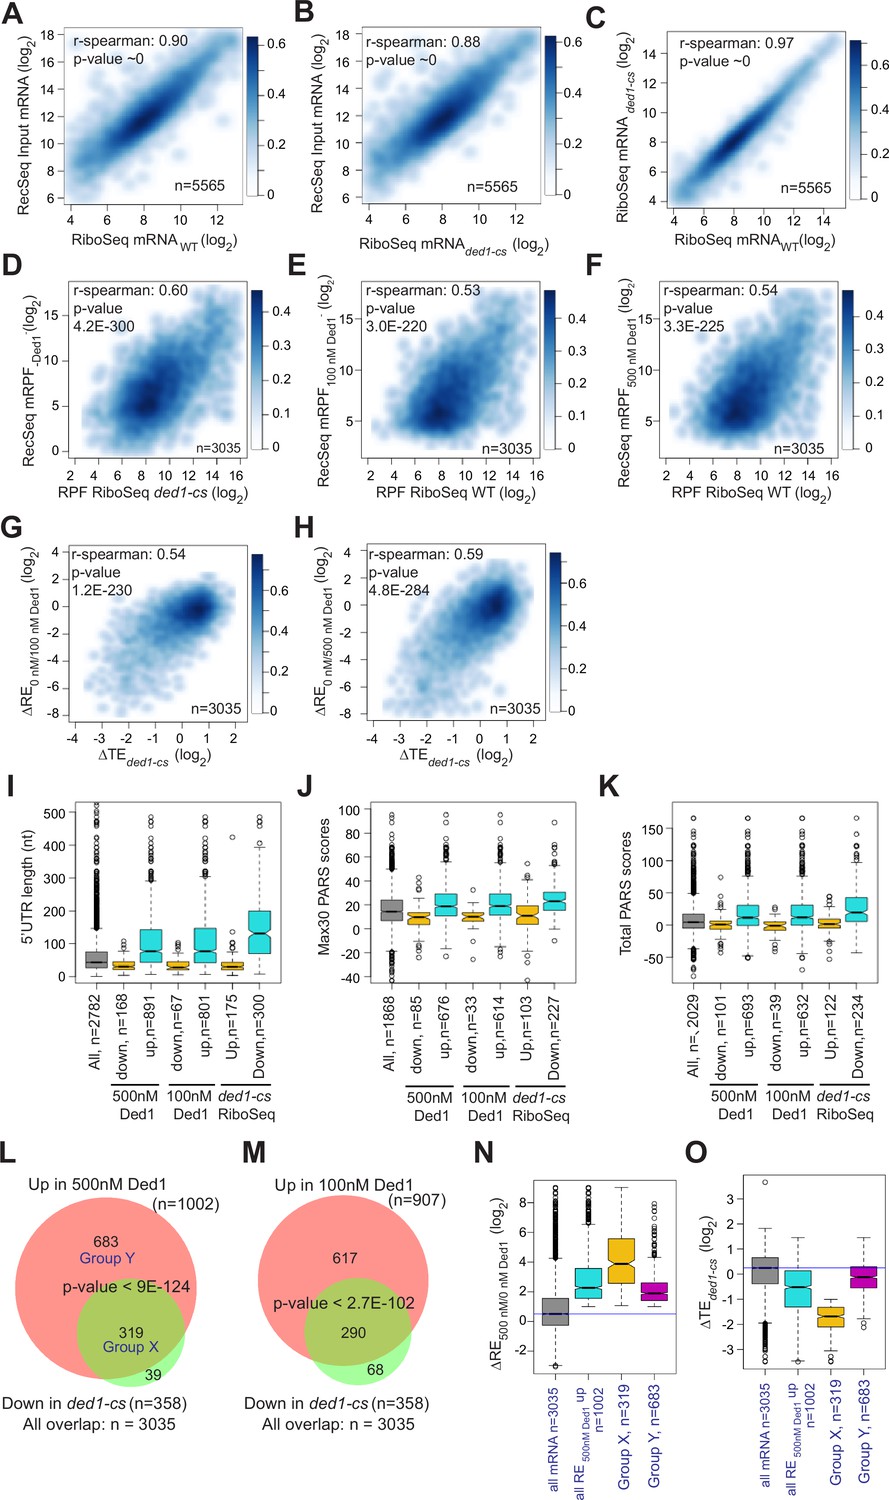
(A, B) Scatterplots comparing Rec-Seq input RNA reads and ribosome profiling mRNA reads of WT (A) or ded1-cs (B) strains. (C) Scatterplot comparing ribosome profiling mRNA reads between WT and ded1-cs strains. (D–F) Scatterplots comparing 48S preinitiation complex (PIC) ribosome-protected fragments (RPFs) from Rec-Seq to 80S RPFs from ribosome profiling for the 3035 mRNAs that passed the significance cutoffs in both experiments for Rec-Seq at 0 nM Ded1 versus ribosome profiling of the ded1-cs mutant (D) or Rec-Seq at 100 nM (E) or 500 nM (F) Ded1 versus ribosome profiling of the WT strain. (G, H) Scatterplots comparing changes in translational efficiency (∆TE) from ribosome profiling of the ded1-cs mutant versus WT to ΔRE0/100nM_Ded1 (G) or ΔRE0/500nM Ded1 (H) values from Rec-Seq. (I–K) Boxplot analysis of 5′UTR lengths (I), Max30 parallel analysis of RNA structure (PARS) (J), or total PARS (K) for mRNAs with annotated 5′UTR lengths or PARS scores that showed significantly decreased (Down) or increased (Up) REs in 100 or 500 nM Ded1 versus no Ded1, or significantly increased (Up) or decreased (Down) TEs in the ded1-cs mutant versus WT. (L, M) Overlaps between mRNAs identified by Rec-Seq at 100 nM Ded1 (L) or 500 nM Ded1 (M) with significantly increased recruitment efficiencies (REs) versus no Ded1 in Rec-Seq and mRNAs with significantly increased translational efficiencies (TEs) in ribosome profiling of the ded1-cs mutant versus WT. p-Values for the overlaps were calculated as described in Figure 2D and E. Group X and Y mRNAs in (L) are those in common between the two groups being compared (X) or those found exclusively in the set of 1002 mRNAs with significantly increased RE in 500 nM Ded1 versus no Ded1 in Rec-Seq (Y). (N, O) Boxplot analysis of log2 ΔRE500/0nM_Ded1 (N) or log2 ΔTEded1-cs (O) values for all 3035 mRNAs observed in both Rec-Seq and ribosome profiling, the 1002 mRNAs with significantly increased recruitment with 500 nM Ded1 versus no Ded1 (of L), the 319 mRNAs in group X (of L), and the 683 mRNAs in group Y (of L).
Figure 5 with 2 supplements
Ded1 increases leaky scanning of main start codons.
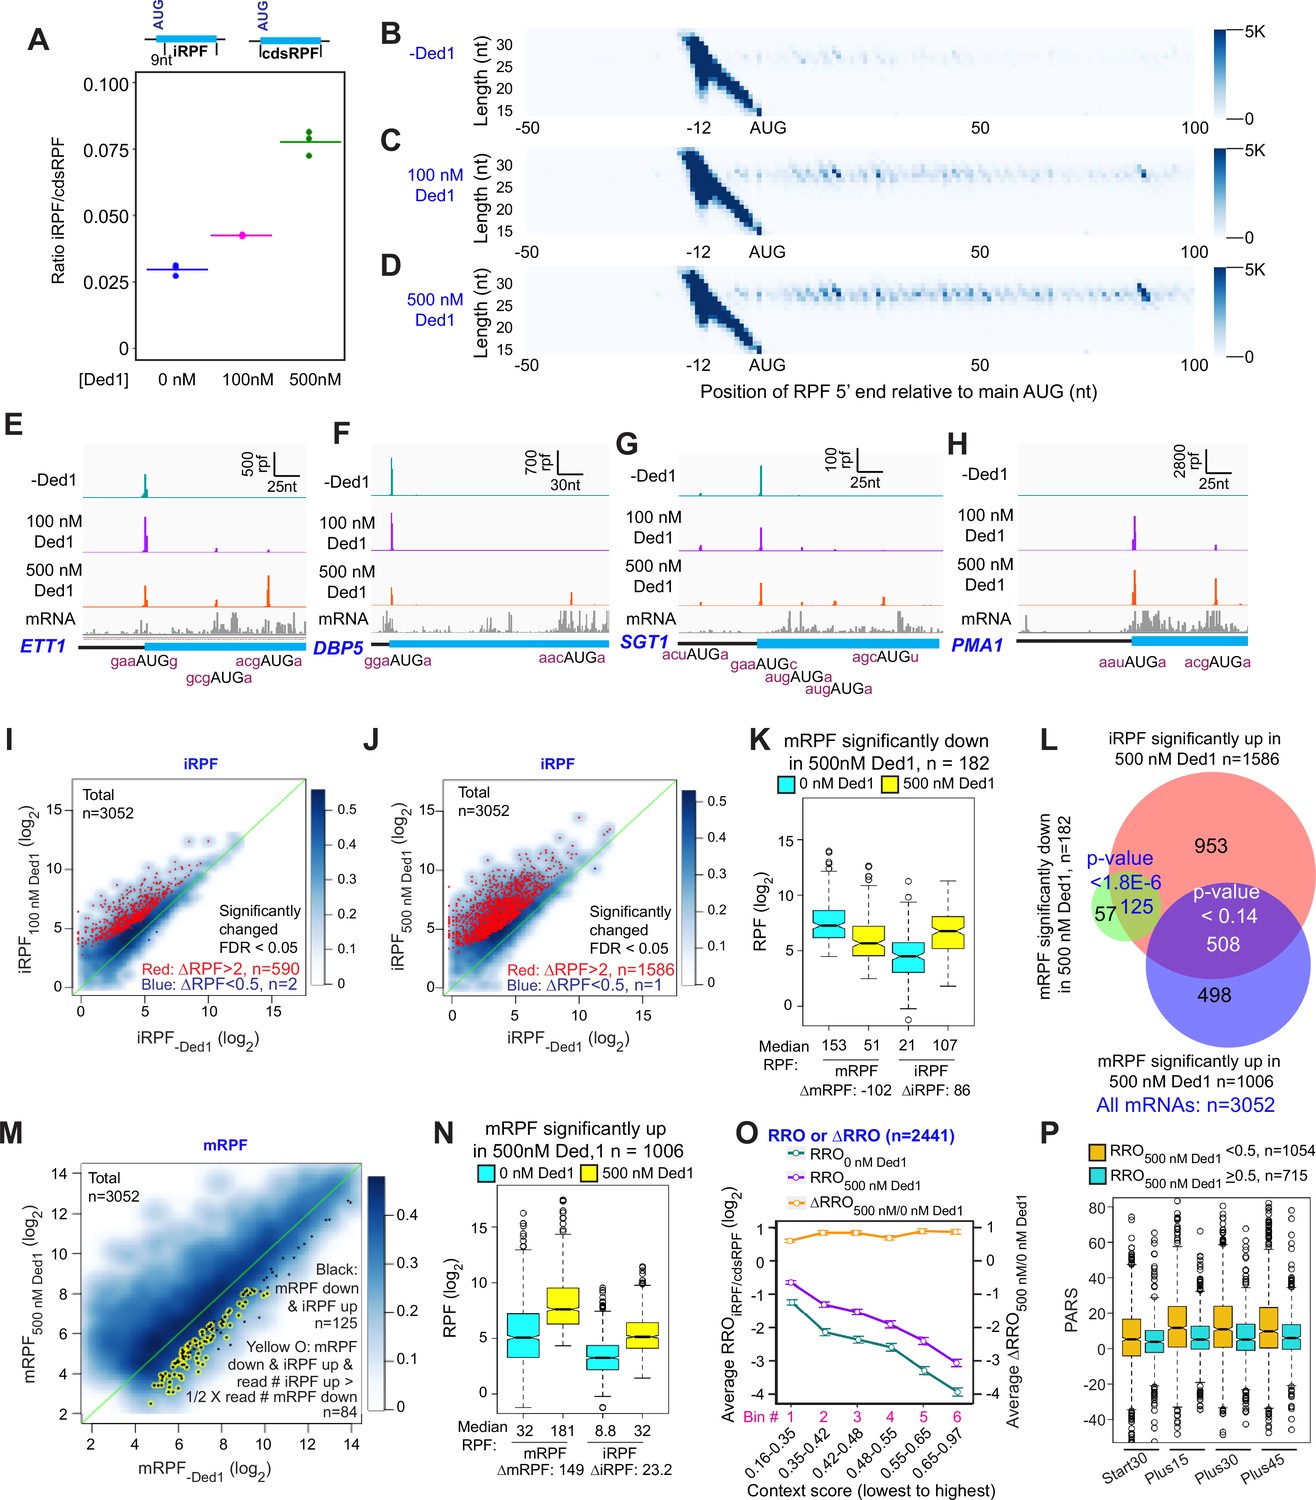
(A) The ratio of the total ribosome-protected fragments (RPFs) internal to the coding sequences (CDS) in mRNAs, excluding the main start codon, to the total RPFs for the full CDS including the main start codon (iRPF/cdsRPF ratio) for each of the three replicates at 0, 100, and 500 nM Ded1. iRPFs were counted from the +9 position of the main AUG to the stop codon, while the cdsRPFs were counted from the start codon to the stop codon of the CDS. The average of the three replicates is indicated by the colored bars (red, green, and blue for 0, 100, and 500 nM Ded1, respectively). (B–D) Metagene plots showing RPF density distribution on all mRNAs aligned to their main AUGs as in Figure 1B–D for 0 (B), 100 (C), and 500 nM Ded1 (D), with color scales adjusted to show internal RPFs (iRPFs). (E–H) 48S preinitiation complex (PIC) RPFs and input mRNA reads on four selected mRNAs that showed elevated internal ribosome occupancies in 100 and 500 nM Ded1 conditions. The –3 to –1 and +4 context nucleotides surrounding the main AUG, iAUG, or upstream AUG (uAUG) are indicated in brick red text. (I–J) Scatterplots comparing log2 iRPF between 100 (I) or 500 nM Ded1 (J) to 0 nM Ded1 as described in Figure 2A and B for the same group of 3052 mRNAs. Red dots show mRNAs that meet the significance cutoff for increases in iRPF (false discovery rate [FDR] < 0.05, more than twofold increase in iRPFs) and blue dots show mRNAs that meet the significance cutoff for decreases in iRPF (FDR < 0.05, <0.5-fold decrease in iRPFs). (K) Boxplot comparing mRPFs and iRPFs between 500 and 0 nM Ded1 for the 182 mRNAs that showed significantly reduced mRPFs with 500 nM Ded1 versus no Ded1. (L) Overlaps between mRNAs with significantly elevated iRPFs (orange), significantly reduced mRPFs (green), or significantly increased mRPFs (blue) with 500 nM Ded1 relative to 0 nM Ded1. The Venn diagram was generated and p-values calculated as in Figure 2D. (M) Scatter plot comparing mRPFs with 500 nM versus 0 nM Ded1. The 125 mRNAs that showed significantly increased iRPFs and significantly decreased mRPFs in 500 nM Ded1 relative to 0 nM Ded1 are labeled by black dots. Among this set, the mRNAs for which the iRPFs increase by at least 50% of the decrease in mRPFs are labeled by yellow circles, to indicate the 84 mRNAs for which the decrease in mRPFs could be responsible for the increase in iRPFs. (N) Boxplot comparing mRPFs and iRPFs between 500 nM and 0 nM Ded1 for the 1006 mRNAs that showed significantly increased mRPFs. (O) Line plot analysis of average RRO (relative ribosome occupancy; iRPF/cdsRPF ratio; left axis) and ΔRRO500/0 nM Ded1 (right axis) for 2441 of 3052 mRNAs in (J) with 5′UTR length >5 nt binned by main AUG context scores from lowest to highest. (P) Boxplot analysis of Start30, Plus15, Plus30, and Plus45 parallel analysis of RNA structure (PARS) scores for mRNAs with RROiRPF/cdsRPF < 0.5 (orange) or ≥0.5 with 500 nM Ded1.
Figure 5—figure supplement 1

Supporting evidence that Ded1 promotes leaky scanning of the main start codon.
(A) Schematic of a 43S preinitiation complex (PIC) leaky scanning through the main AUG and assembling at an internal AUG in the presence of Ded1. (B) Evidence that mRNAs whose recruitment is inhibited by 500 nM Ded1 in Rec-Seq assays generally assemble 48S PICs very efficiently without Ded1. Boxplot analysis of REs of groups of mRNAs at 0 nM (cyan) or 500 nM (yellow) Ded1 for all 3052 mRNAs observed in Rec-Seq, the 1006 mRNAs with significantly increased mRPFs at 500 nM Ded1 versus no Ded1 (Figure 2B, red dots); and the 182 mRNAs with significantly decreased mRPFs with 500 nM Ded1 versus no Ded1 (Figure 2B, blue dots).
Figure 5—figure supplement 2

mRNAs with reduced recruitment efficiency (RE) at 500 nM Ded1 versus no Ded1 in Rec-Seq assays tend to show increased relative translational efficiency (TE) in the ded1-cs mutant versus WT in ribosome profiling experiments.
Boxplot analysis of ΔTEded1-cs for the groups of mRNAs described in Figure 5L and M: the 182 mRNAs with mRPFs significantly reduced at 500 nM Ded1 versus no Ded1 (cyan); the 125 mRNAs with significantly decreased mRPFs and increased iRPFs with 500 nM Ded1 versus no Ded1 (magenta); the 84 mRNAs from the previous set that had an increase in iRPFs that was at least 50% the of the decrease in mRPFs (yellow circles in Figure 5M; orange).
Figure 6 with 1 supplement
Ded1 modestly promotes readthrough of start codons in 5′UTRs of mRNAs.
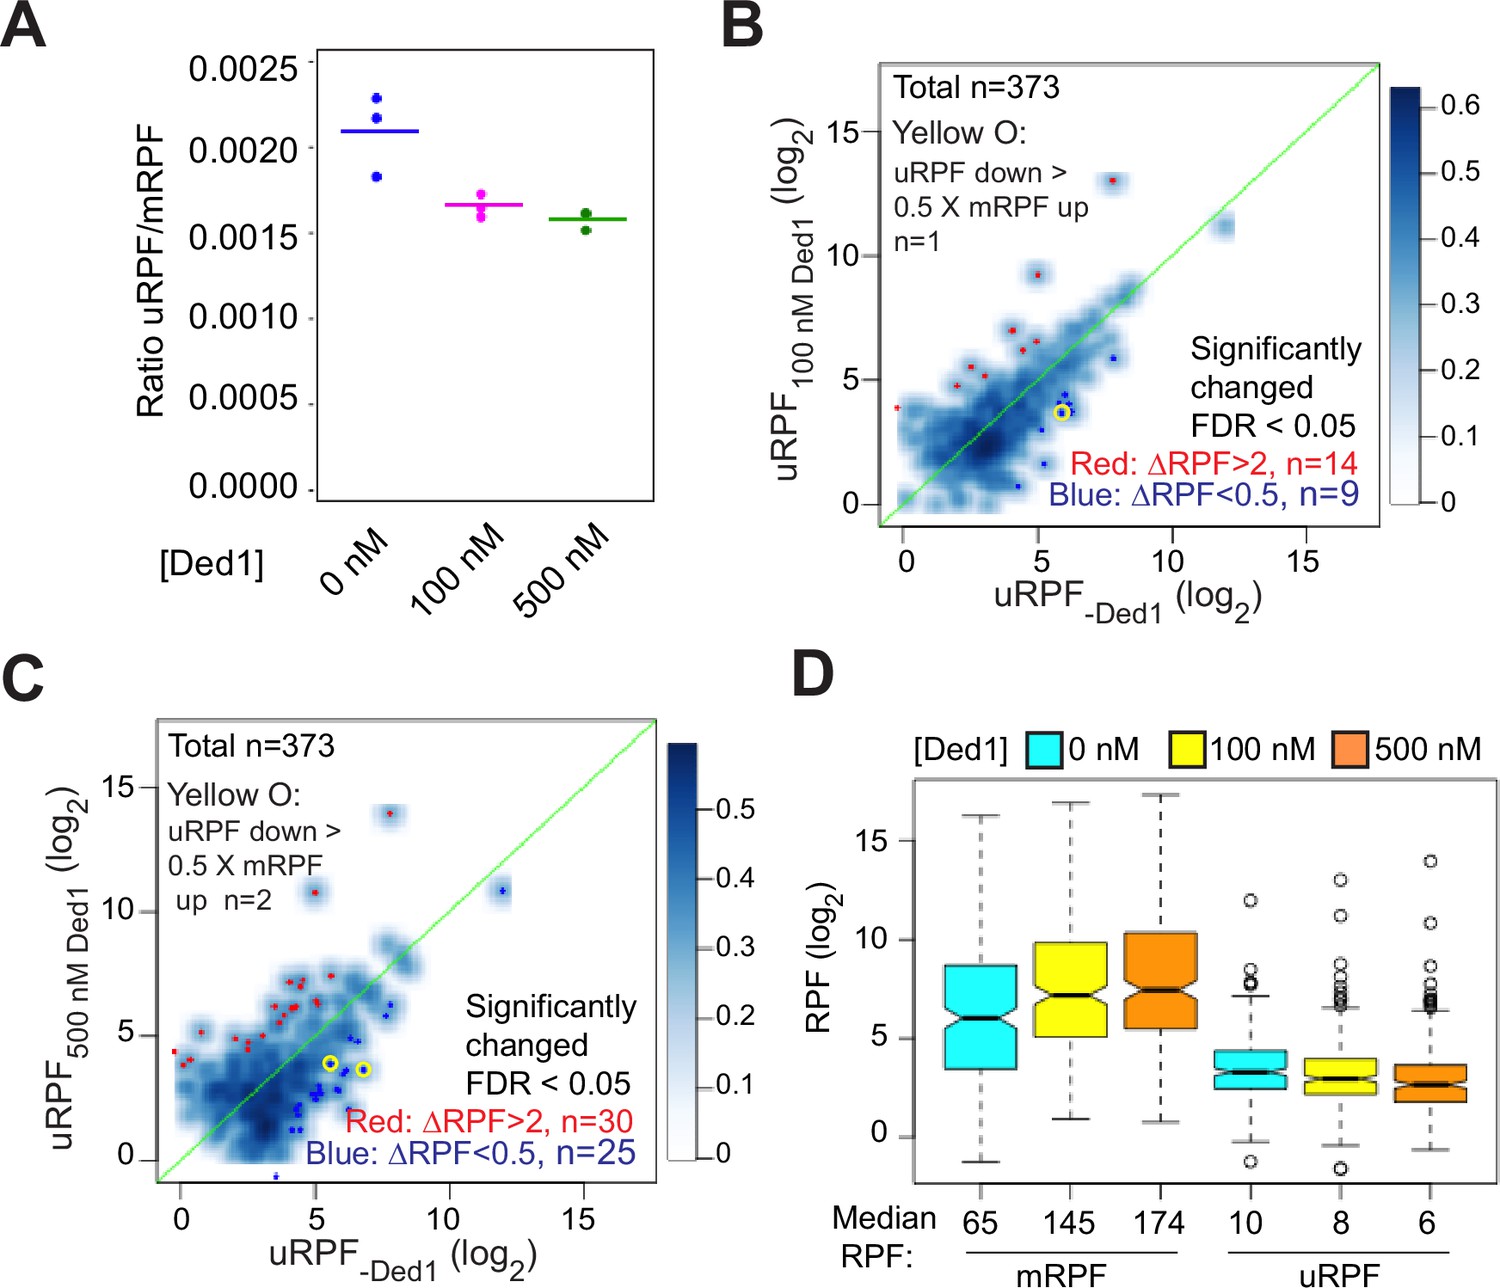
(A) The ratios of ribosome-protected fragments (RPFs) in 5′UTRs to RPFs on main start codons (uRPF/mRPF ratios) for each of the three replicates with 0 (blue), 100 (magenta), or 500 (green) nM Ded1. The 5′UTR RPFs (uRPFs) were counted from the 5′ end of the mRNA to the –5 position relative to the main AUG. The mean of the three replicates is indicated by the colored bars. uRPFs on GCN4 mRNA were analyzed separately (Figure 6—figure supplement 1) because 42 and 57% of all uRPFs were mapped to the GCN4 5′UTR in assays with 100 and 500 nM Ded1, respectively. (B, C) Scatterplots comparing uRPFs in the presence of either 100 nM (B) or 500 nM (C) Ded1 versus 0 nM Ded1. mRNAs with significantly increased or decreased uRPFs in the presence of Ded1 are indicated in red or dark blue dots, respectively. The criteria used for significance were false discovery rate (FDR) < 0.05 and a more than twofold increase or decrease. Yellow circles denote the very few mRNAs whose uRPF read number decreases by more than 50% of the increases in their mRPF reads, indicating a clear reciprocal relationship between the decrease in uRPFs and the increase in mRPFs. (D) Boxplot analysis of mRPF and uRPF read numbers for the 257 mRNAs that had both uRPFs and mRPFs ≥2 reads averaged over all assays conducted at 0, 100, and 500 nM Ded1 concentrations. Unlogged median RPF numbers are labeled under each box.
Figure 6—figure supplement 1

Approximately half of all uRPFs map to the GCN4 5′UTR.
Percentages of all uRPFs mapped to the GCN4 5′UTR for each of the three replicates with 0 (blue), 100 (magenta), or 500 (green) nM Ded1 concentrations. Colored bars indicate the means of the replicates.
Figure 7
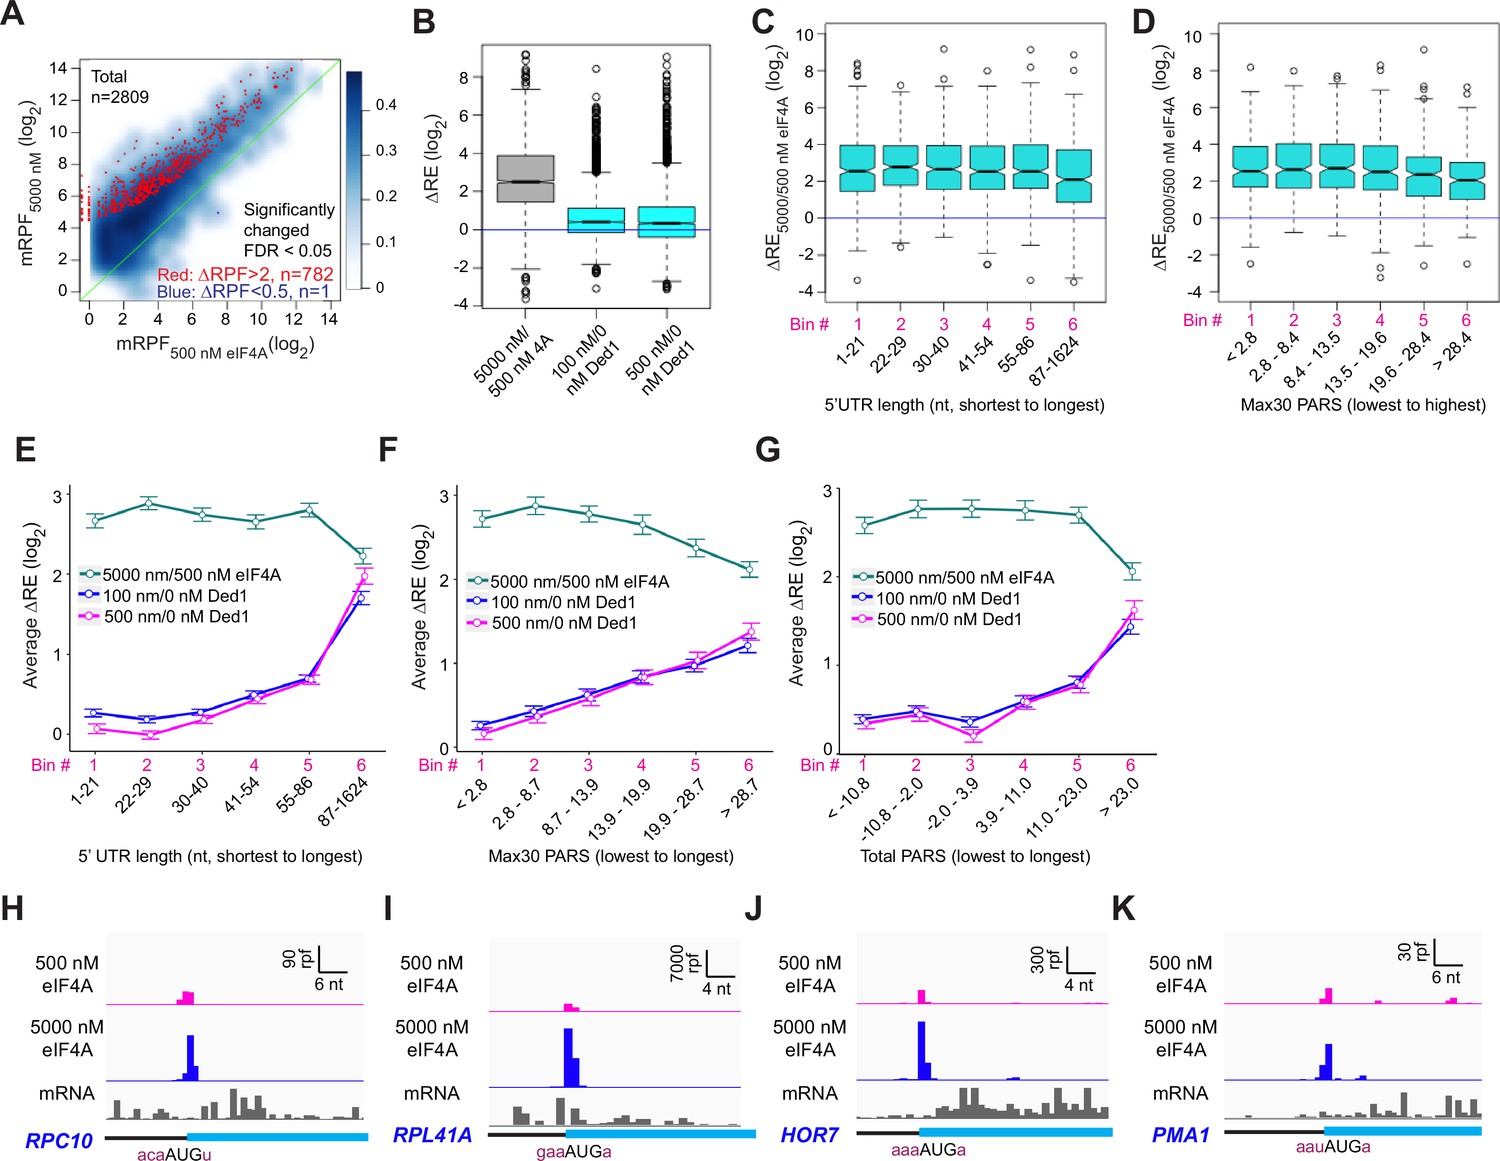
eIF4A enhances the recruitment of almost all mRNAs.
(A) Scatterplots of normalized read densities mapped to main AUGs (mRPFs) with 5000 nM versus 500 nM eIF4A for the 2809 mRNAs with ≥8 total reads in four samples (two replicates each for 5000 and 500 nM eIF4A). Red and blue dots show mRNAs with mRPFs significantly increased or decreased, respectively, at 5000 versus 500 nM eIF4A. The criteria for significance were false discovery rate (FDR) < 0.05 and a more than twofold change in ribosome-protected fragments (RPFs). (B) Boxplot comparing ΔRE5000/500 nM eIF4A (grey) to ΔRE100/0 nM Ded1 and ΔRE500/0 nM Ded1 (cyan) for the 2698 mRNAs that passed the cutoff mentioned in (A) in both experiments. (C) Boxplot of ΔRE5000/500 nM eIF4A for the 2538 of all 2809 mRNAs in (A) that have annotated 5′UTRs, divided into six equal-sized bins according to 5′UTR lengths from the shortest to the longest. (D) Similar to (C), but for the 1708 of all 2809 mRNAs in (A) with annotated parallel analysis of RNA structure (PARS) scores, binned by Max30 PARS from the lowest to the highest. (E–G) Line plots of mean log2 RE changes, ΔRE5000/500 nM eIF4A (green), ΔRE100/0 nM Ded1 (magenta), and ΔRE500/0 nM Ded1 (blue), for mRNAs divided into six equal-sized bins according to the specific mRNA features of 5′UTR length (E), Max30 PARS score (F), or total PARS score (G). (H–K) RPFs assembled with 500 or 5000 nM eIF4A and input mRNA reads for mRNAs shown previously to be hypodependent on Ded1 (RPC10, RPL41A, HOR7) or hyperdependent on Ded1(PMA1) by in vivo ribosome profiling experiments in the ded1-cs mutant.
Tables
Table 1
Oligonucleotides used for spike-in mRNA template amplification.
| Primer name | Sequence (5′–3’) |
|---|---|
| T7-FLUC | AAGGAATTCATCTTAACTTTTAATACGACTCACTATAGGGCAAACAAACAAACCAAAACCAAAACCACAATGGAAGACGCCAAAAACATA |
| T7-RLUC | AAGGAATTCATCTTAACTTTTAATACGACTCACTATAGGGCAAACAAACAAACCAAAACCAAAACCACCATGACTTGCAAAGTTTATGAT |
| FLUC-R | GTCGACGAGGAATTCATTATCAGTGC |
| RLUC-R | GTCGACTTCTCCTTCTTCAGATTTGATC |
-
T7 promoter sequences are in bold and underlined; mAUGs are in bold and italicized.
Additional files
Download links
A two-part list of links to download the article, or parts of the article, in various formats.
Downloads (link to download the article as PDF)
Open citations (links to open the citations from this article in various online reference manager services)
Cite this article (links to download the citations from this article in formats compatible with various reference manager tools)
Transcriptome-wide analysis of the function of Ded1 in translation preinitiation complex assembly in a reconstituted in vitro system
eLife 13:RP93255.
https://doi.org/10.7554/eLife.93255.3


