The cryo-EM structure of ASK1 reveals an asymmetric architecture allosterically modulated by TRX1
- Department of Physical and Macromolecular Chemistry, Faculty of Science, Charles University, Czech Republic
- Institute of Physiology of the Czech Academy of Sciences, Laboratory of Structural Biology of Signaling Proteins, Division BIOCEV, Czech Republic
Figures
Figure 1 with 3 supplements
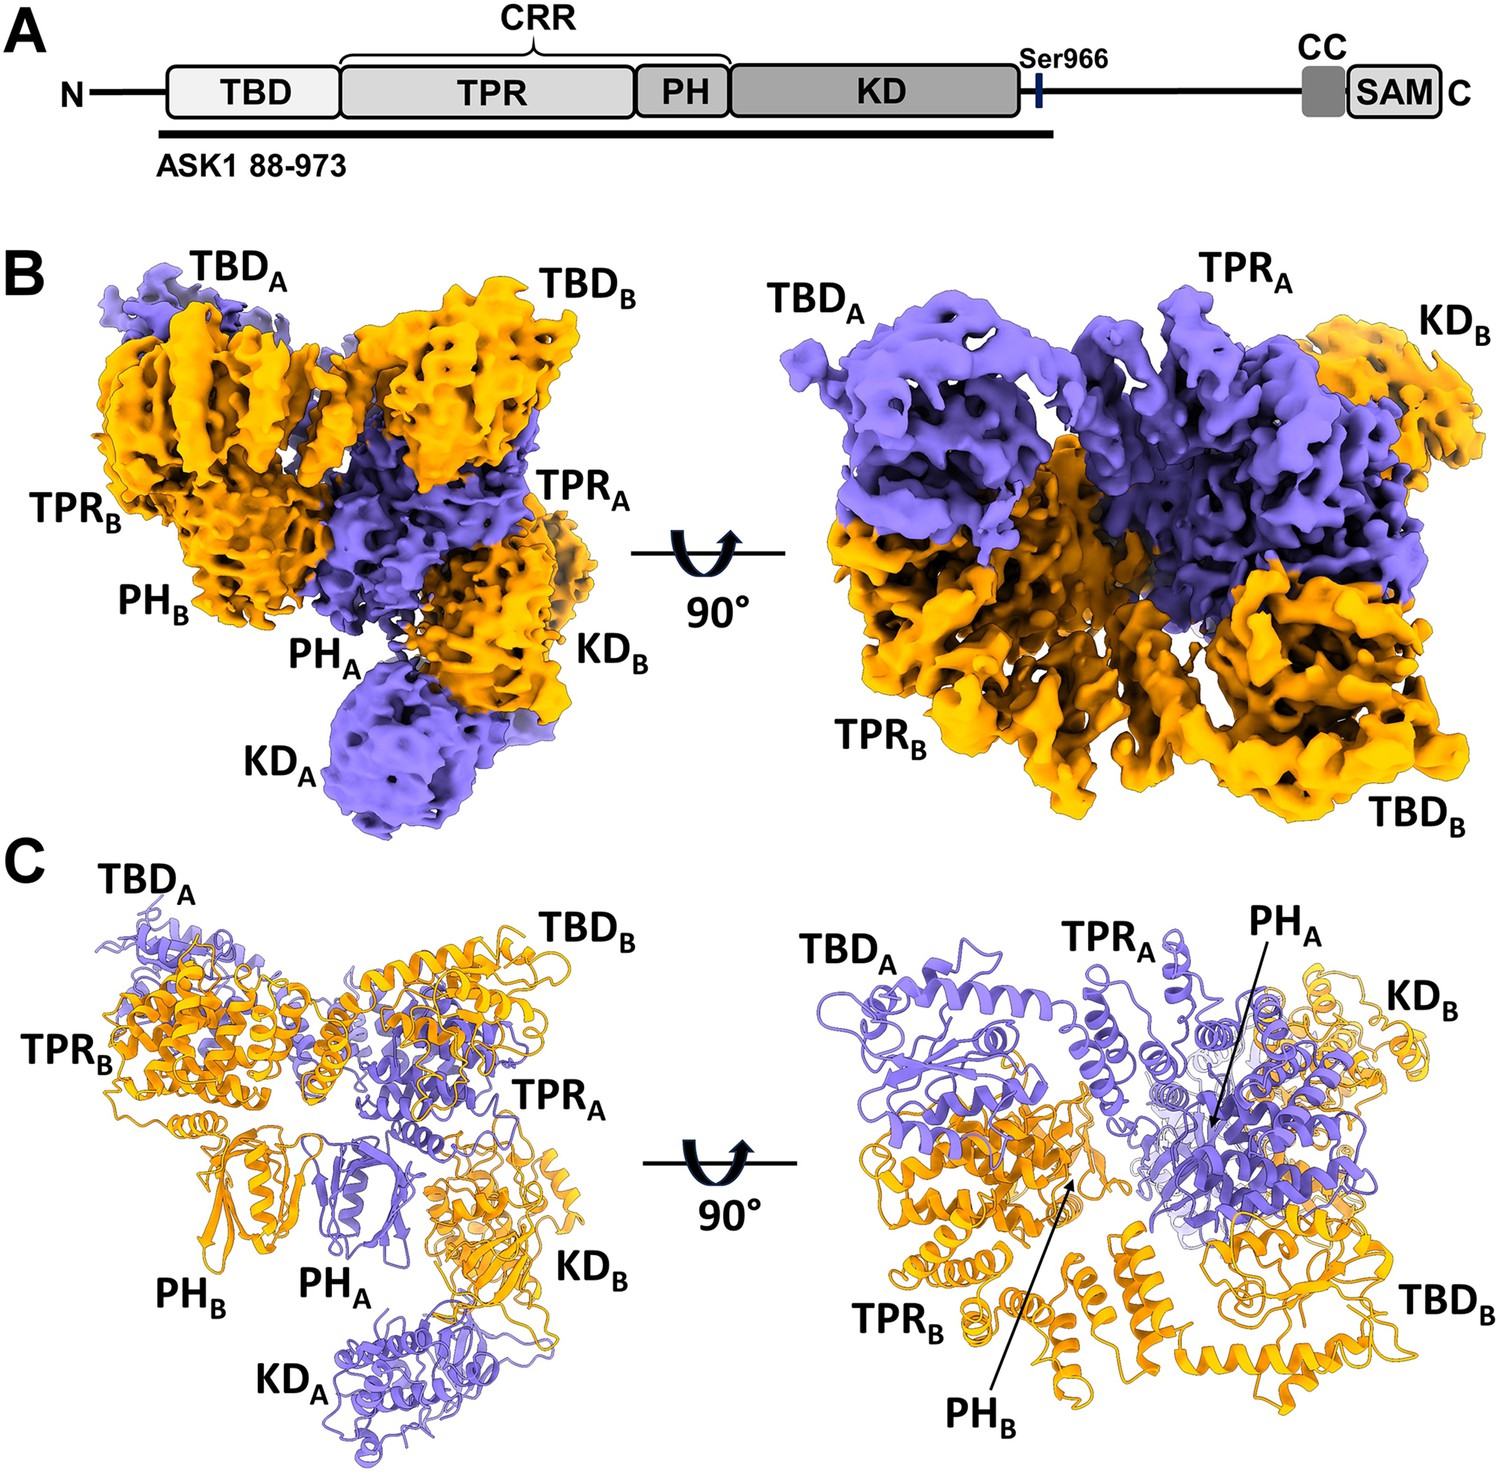
Structure of C-terminally truncated apoptosis signal-regulating kinase 1 (ASK1).
(A) Schematic domain structure of ASK1. TBD, thioredoxin-binding domain; TPR, tetratricopeptide repeats; PH, pleckstrin-homology domain; CRR, central regulatory region; KD, kinase domain; CC, coiled-coil motif; SAM, sterile alpha motif domain. Black bar represents the construct used in cryo-electron microscopy (cryo-EM) analysis. (B, C) Cryo-EM density map and cartoon view of C-terminally truncated dimeric ASK1. Density maps were generated using threshold level 5.5.
Figure 1—figure supplement 1
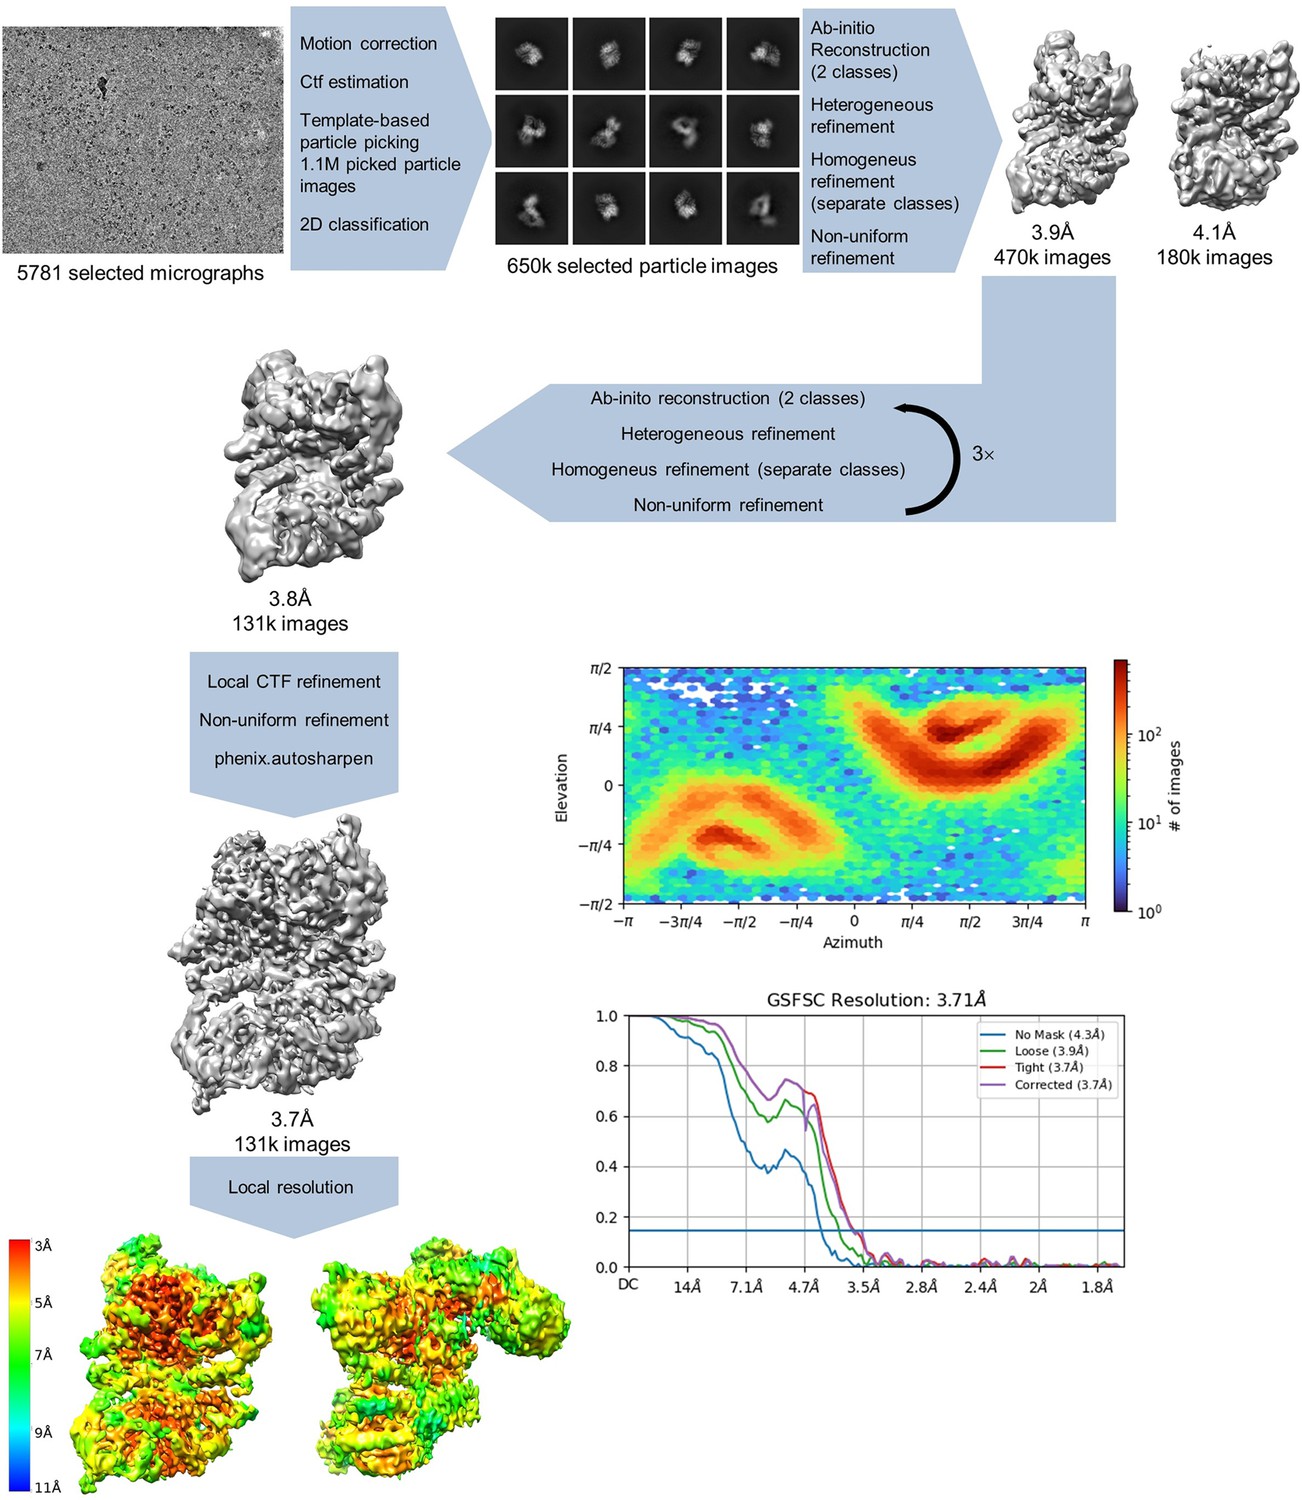
Apoptosis signal-regulating kinase 1 (ASK1) TBD-CRR-KD data processing.
Processing steps are indicated in the scheme, showing the number of particle images, resolution, CryoSPARC 4.1.2 output for gold standard fourier shell correlation (GSFSC) analysis, and view distribution plots. The maps were calculated using either the threshold 0.05–0.1 or the threshold 5 for sharpened maps.
Figure 1—figure supplement 2
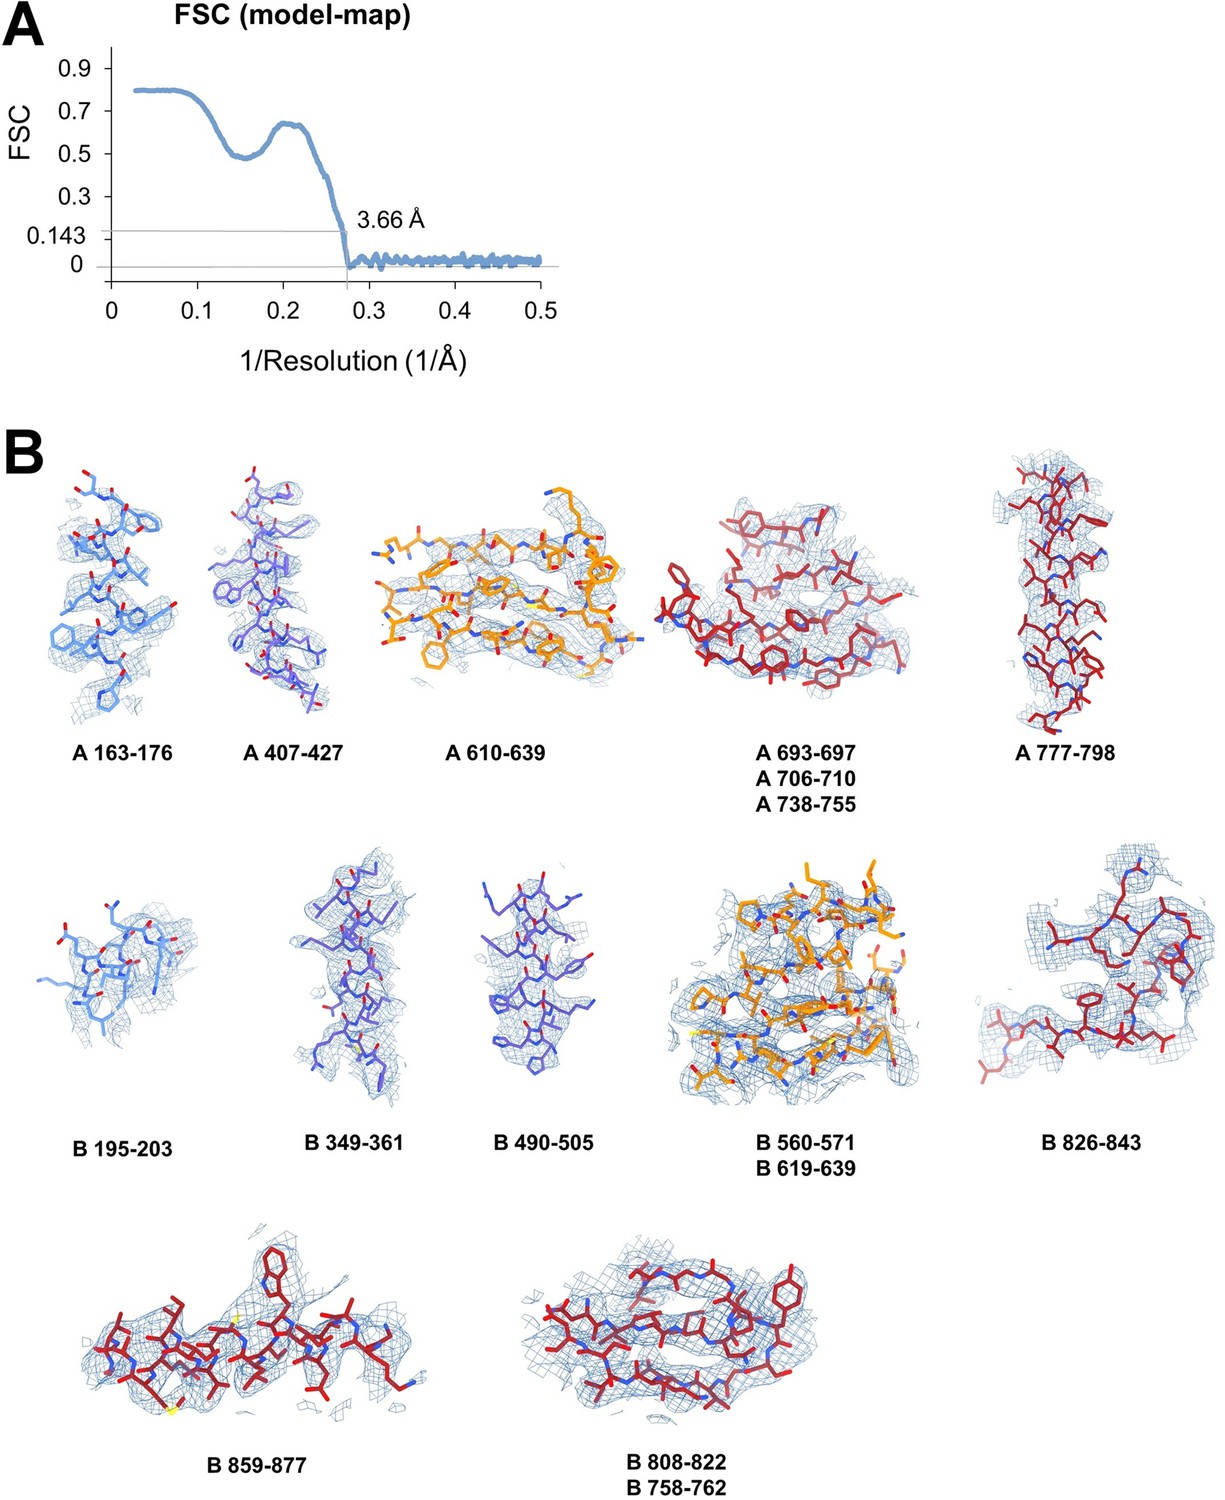
Apoptosis signal-regulating kinase 1 (ASK1) TBD-CRR-KD map quality assessment.
(A) FSC (model-map) reported by the Phenix validation tool (Adams et al., 2019), indicating the threshold of 0.143. (B) Examples of the final density map fitted to the model. The maps were generated in ChimeraX (Pettersen et al., 2021) using a threshold level ranging from 7 to 13.
Figure 1—figure supplement 3
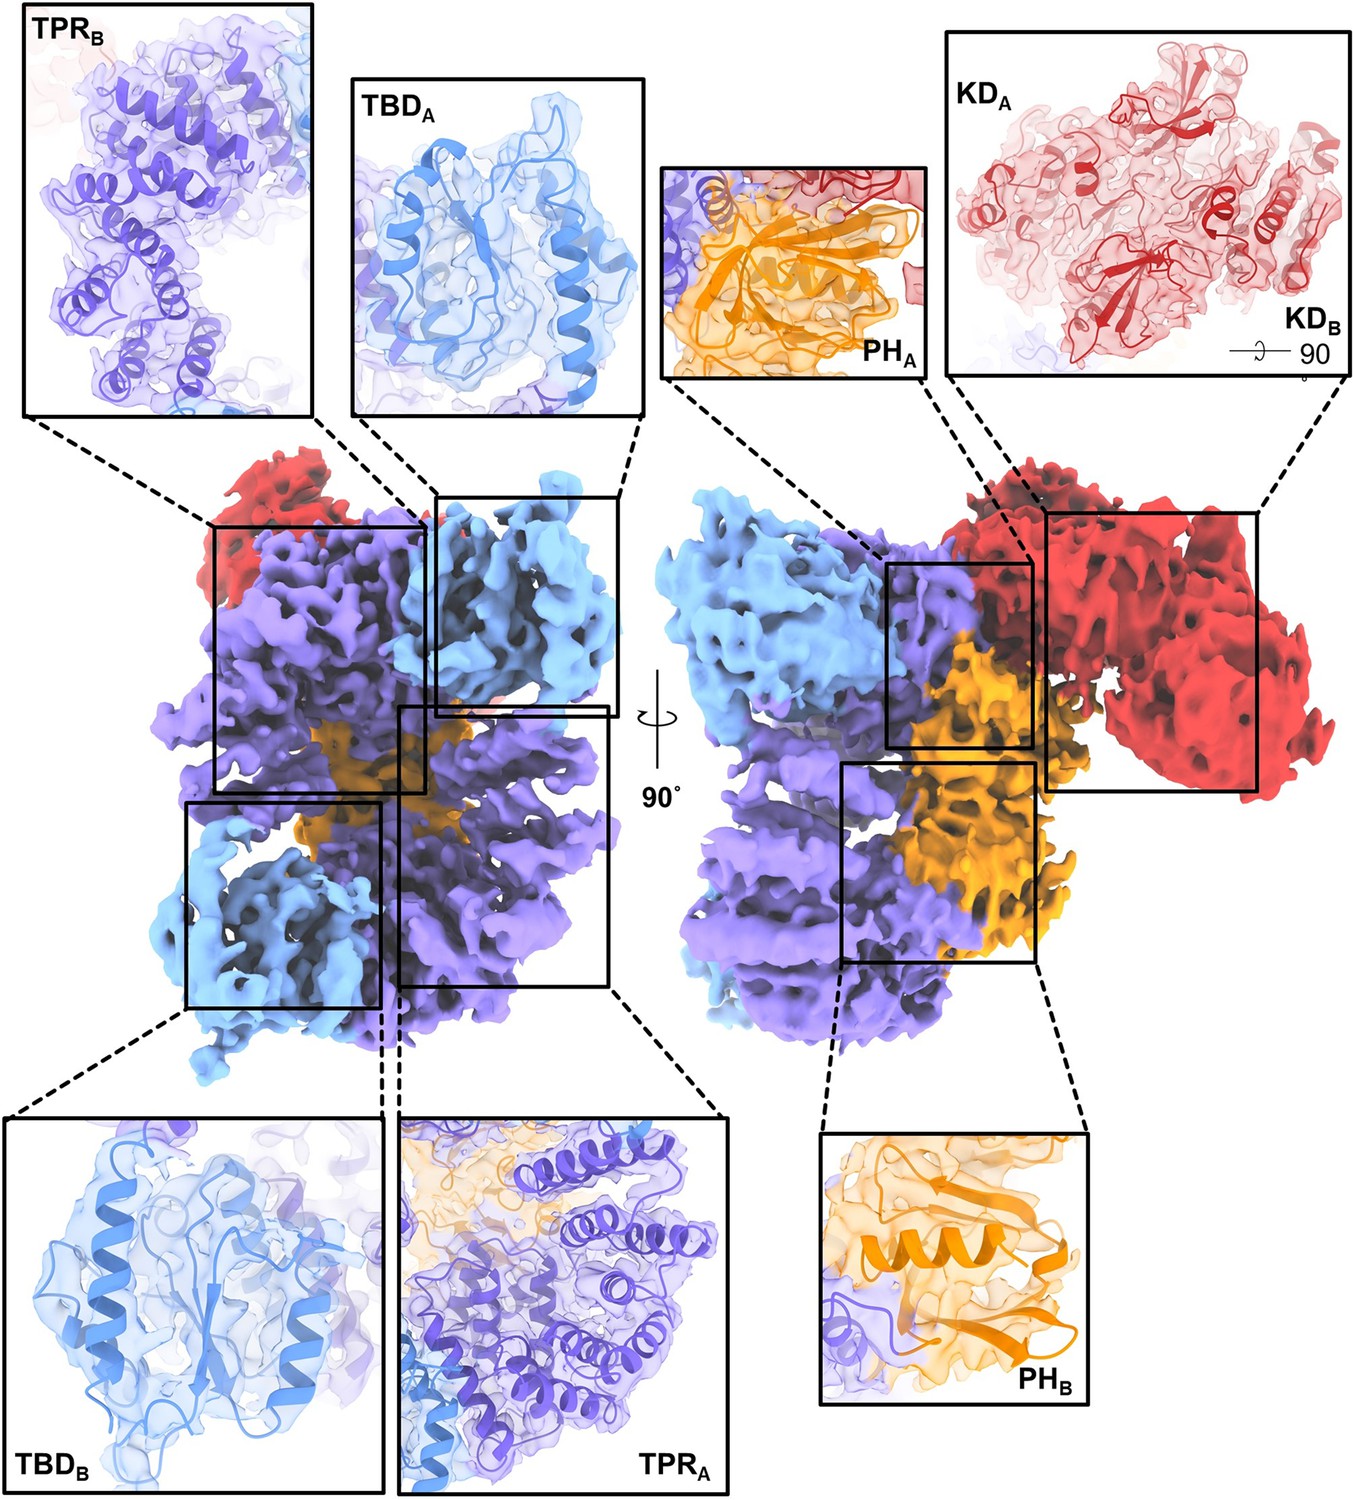
Agreement between the experimental density map and the refined model of C-terminally truncated apoptosis signal-regulating kinase 1 (ASK1).
The maps were generated using a threshold level of 5–7 and 80% transparency.
Figure 2 with 3 supplements
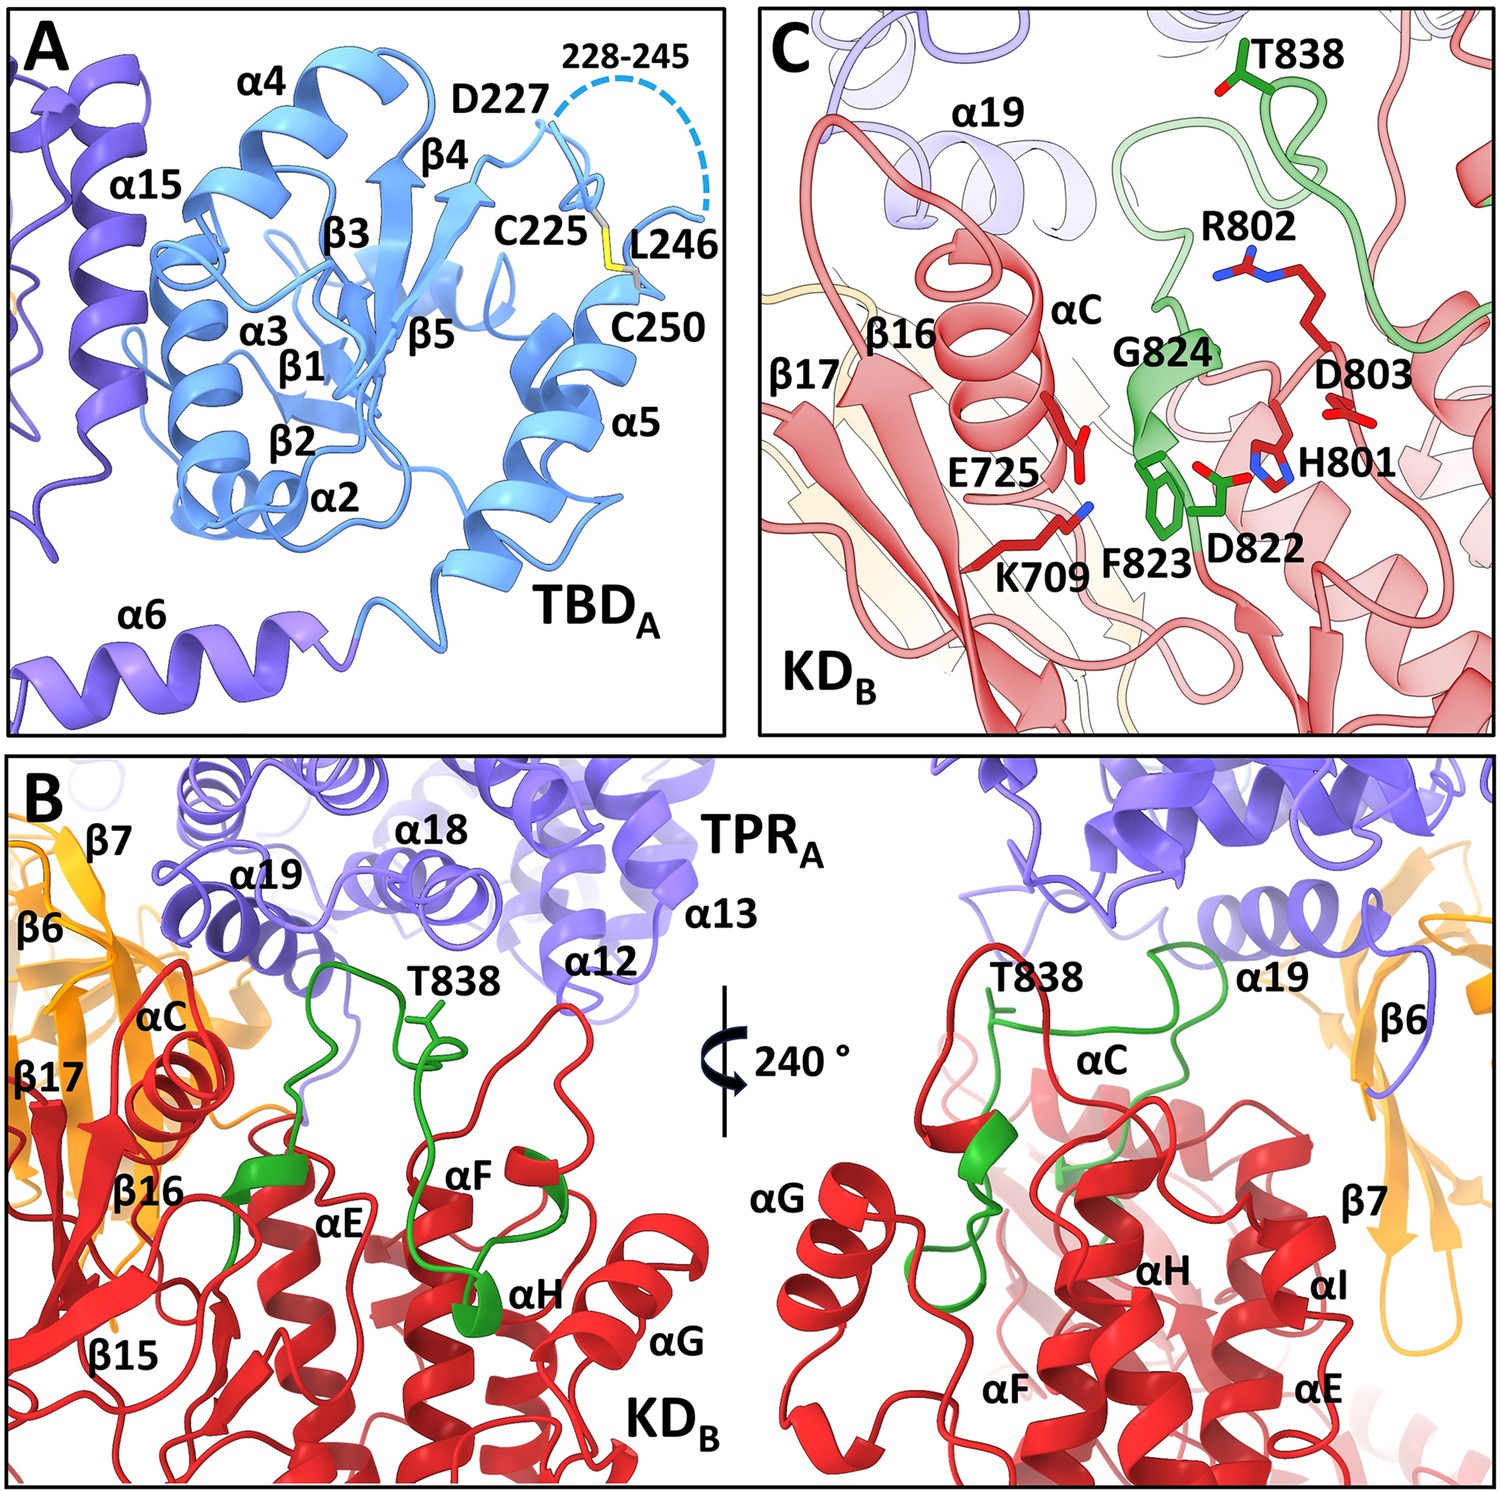
All four N-terminal domains of apoptosis signal-regulating kinase 1 (ASK1) are involved in extensive interdomain and interchain interactions.
(A) Cartoon representation of TBDA and its interaction with helix α15 of TPRB. The dashed line indicates the missing section (residues 228–245). (B) Cartoon representation of interactions between KDB, TPRA, and PHA domains (shown in red, violet, and orange, respectively). The activation segment is shown in green. (C) Detailed view of the active site of KDB. KDB is shown in red, TPRA is shown in violet. The activation segment is shown in green.
Figure 2—figure supplement 1
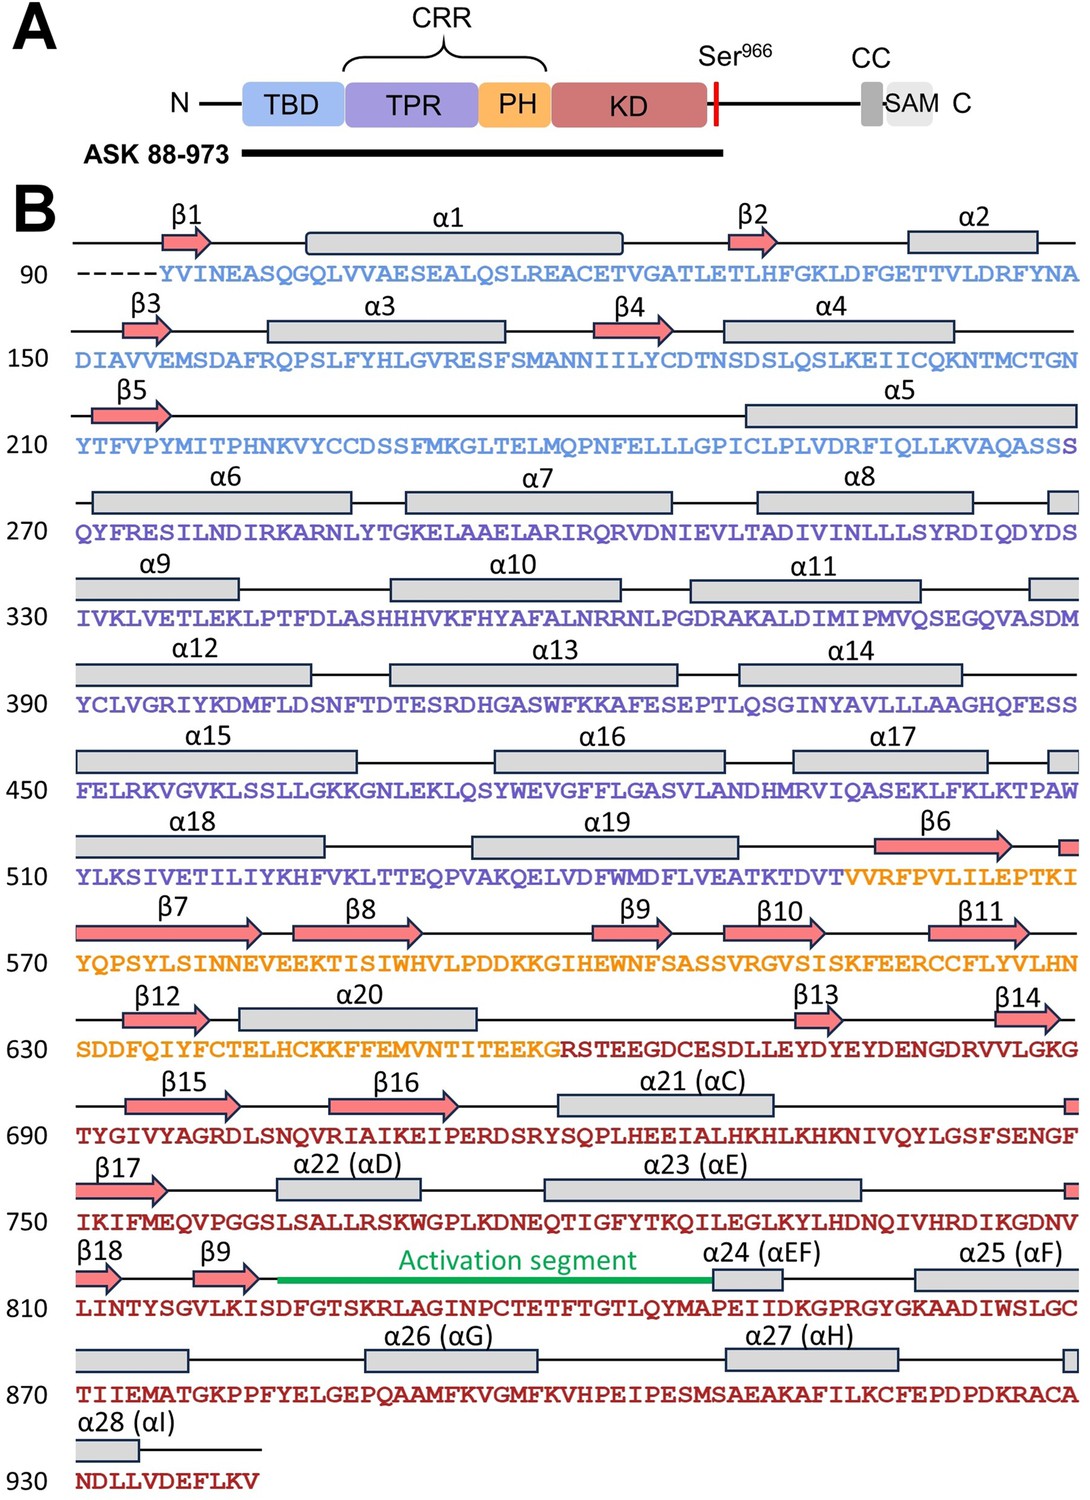
Secondary structure of apoptosis signal-regulating kinase 1 (ASK1) TBD-CRR-KD.
(A) Domain structure of ASK1. The black line indicates the construct used for cryo-electron microscopy (cryo-EM) structural analysis. (B) Secondary structure of the cryo-EM model of ASK1 TBD-CRR-KD.
Figure 2—figure supplement 2
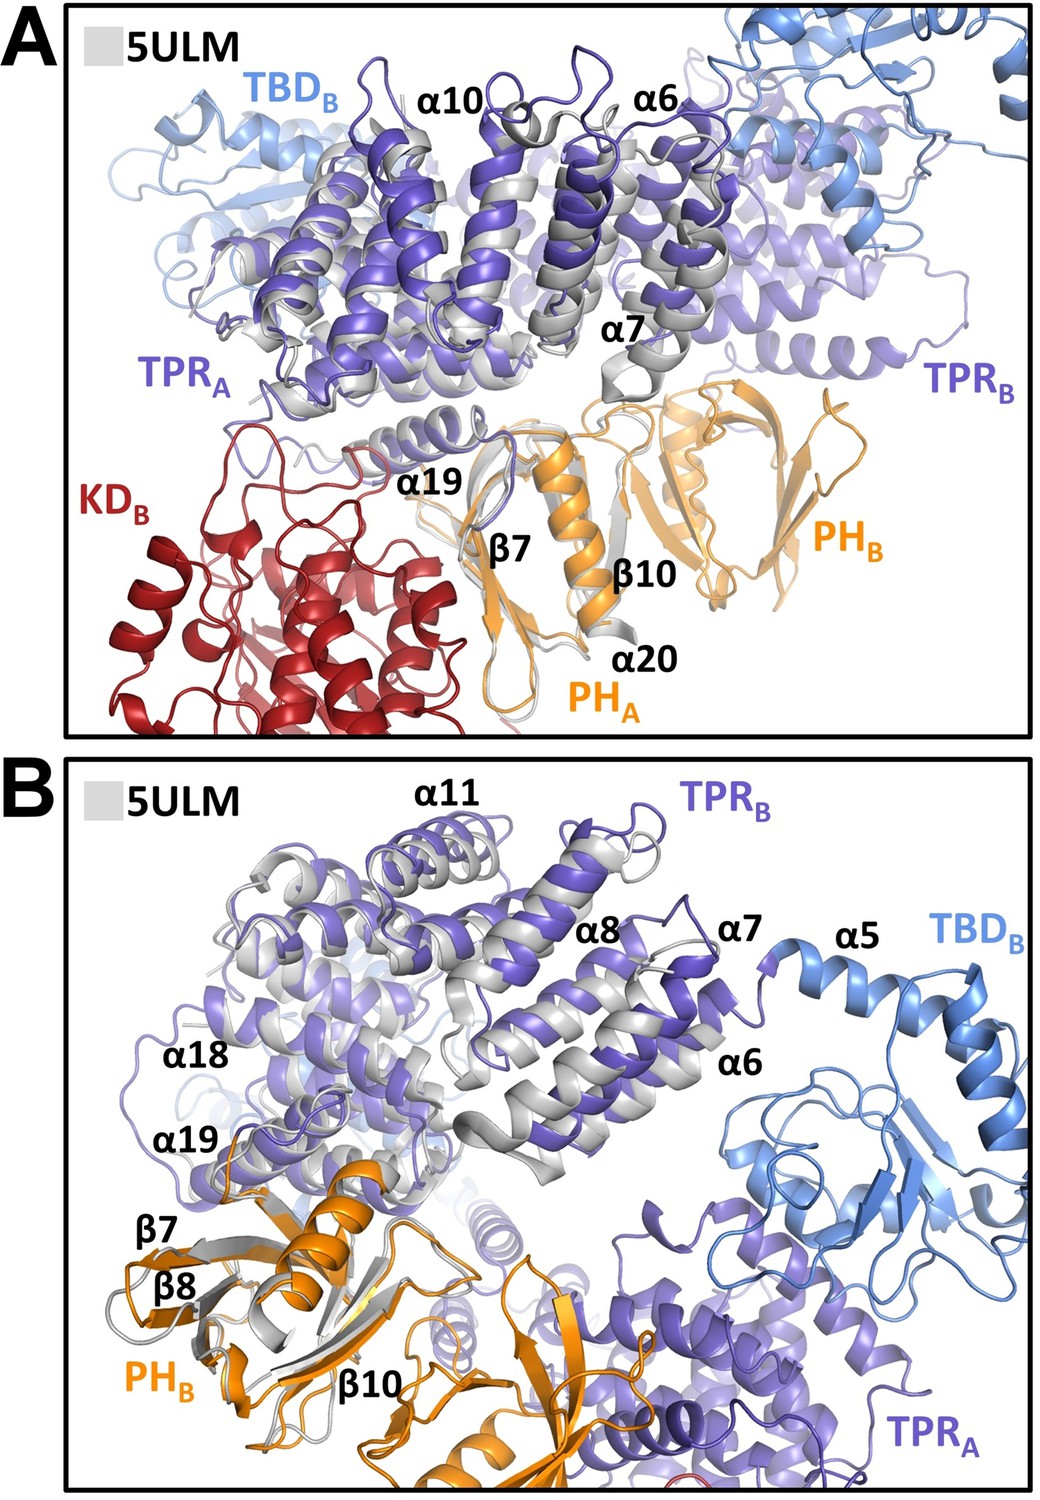
Comparison of central regulatory region (CRR) regions with the crystal structure of the isolated CRR.
Superposition of the X-ray structure of CRR (PDB ID: 5ULM [Weijman et al., 2017], shown in gray) and CRRA (A) and CRRB (B) from the cryo-electron microscopy (cryo-EM) model of ASK1 TBD-CRR-KD. TPR, tetratricopeptide repeats; PH, pleckstrin-homology domain; KD, kinase domain.
Figure 2—figure supplement 3
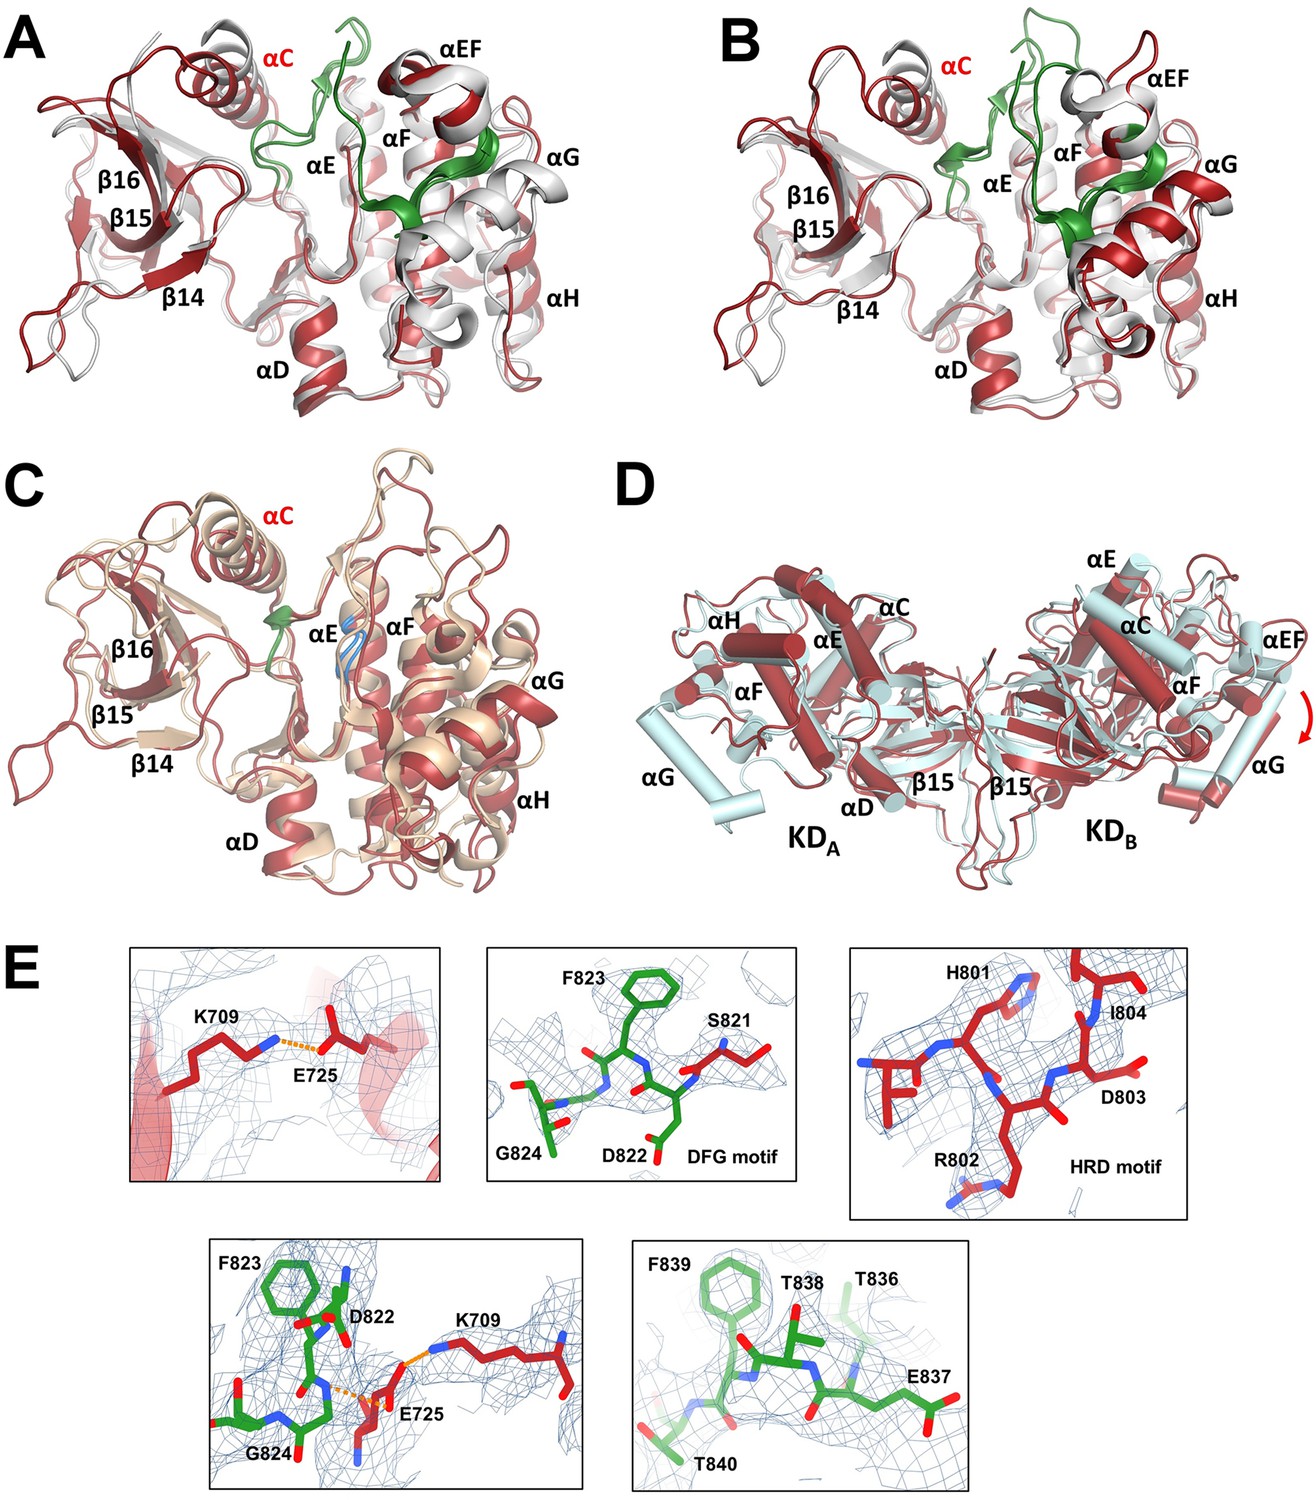
Comparison of kinase domains (KDs) with the crystal structure of the isolated KD.
(A) Superposition of the X-ray structure of KD with bound inhibitor (PDB ID: 2CLQ [Bunkoczi et al., 2007], shown in gray) and KDA from the cryo-electron microscopy (cryo-EM) model of ASK1 TBD-CRR-KD (shown in red). The activation segment is shown in green. (B) Superposition of 2CLQ (gray) and KDB (red). (C) Superposition of the X-ray structure of BRAF (PDB ID: 4MNE (Haling et al., 2014), shown in sand) and KDB (red). The DFG motif is shown in green, the HRD motif is shown in blue. (D) Cryo-EM structure of KD dimer (red) superimposed with the x-ray structure of KD dimer (cyan, PDB ID: 2CLQ) via KDA. Helices are represented as cylinders. The red arrow indicates the shift of the C-lobe of the KDB. (E) Representing density of selected fragments of KDB. Residues and/or visualized motives are indicated in panels. The maps were calculated using a threshold level of 8–15.
Figure 3 with 1 supplement
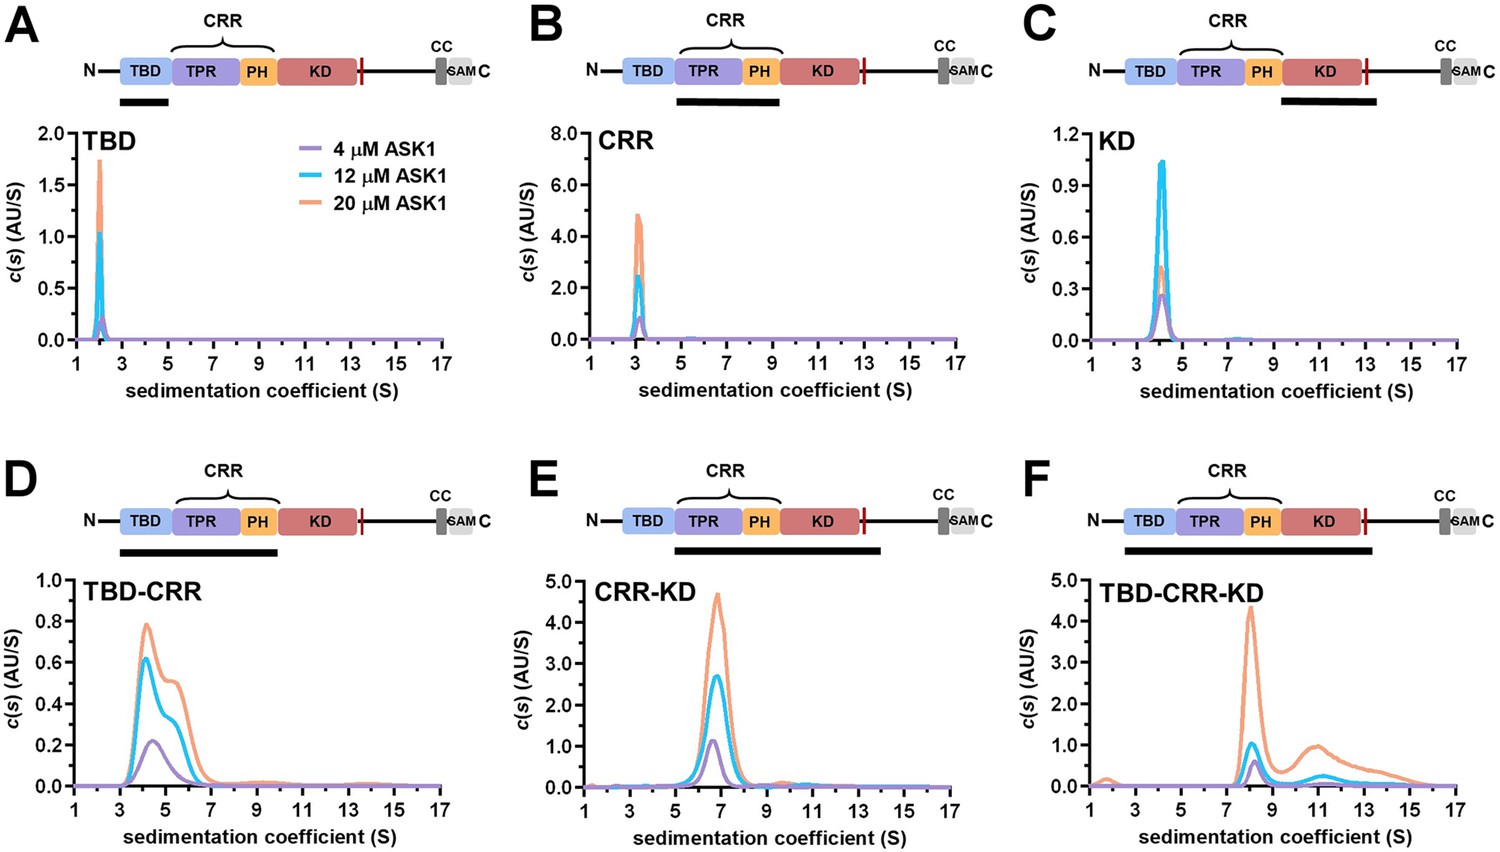
TBD-CRR forms dimers in solution, but not TBD or CRR.
(A–F) Sedimentation coefficient distributions (c(s)) of different apoptosis signal-regulating kinase 1 (ASK1) N-terminal constructs (TBD, CRR, KD, TBD-CRR, CRR-KD, and TBD-CRR-KD) measured at concentrations of 4 μM, 12 μM and 20 μM. Schematic domain structure of ASK1 is shown at the top; the black bar represents the used construct. TBD, thioredoxin-binding domain; TPR, tetratricopeptide repeats; PH, pleckstrin-homology domain; CRR, central regulatory region; KD, kinase domain; SAM, sterile alpha motif domain.
Figure 3—figure supplement 1
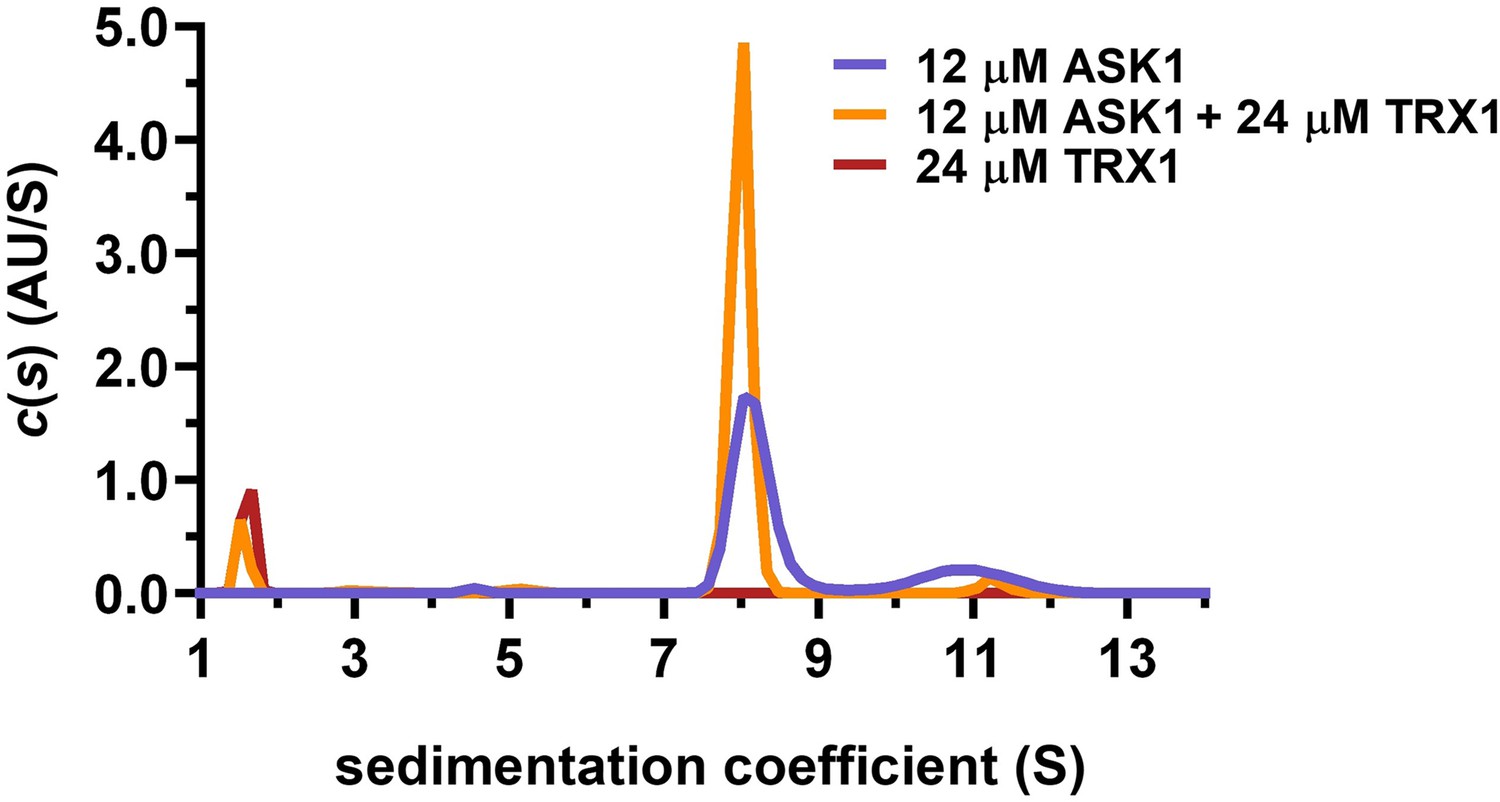
Sedimentation velocity analytical ultracentrifugation (SV AUC) analysis shows the effect of thioredoxin 1 (TRX1) binding on the dimerization of apoptosis signal-regulating kinase 1 (ASK1) TBD-CRR-KD.
Distribution of sedimentation coefficients, c(s), of 12 μM ASK1 TBD-CRR-KD alone, 12 μM ASK1 TBD-CRR-KD with 24 μM TRX1 and 24 μM TRX1 alone are shown in violet, orange and brown, respectively.
Figure 4 with 7 supplements
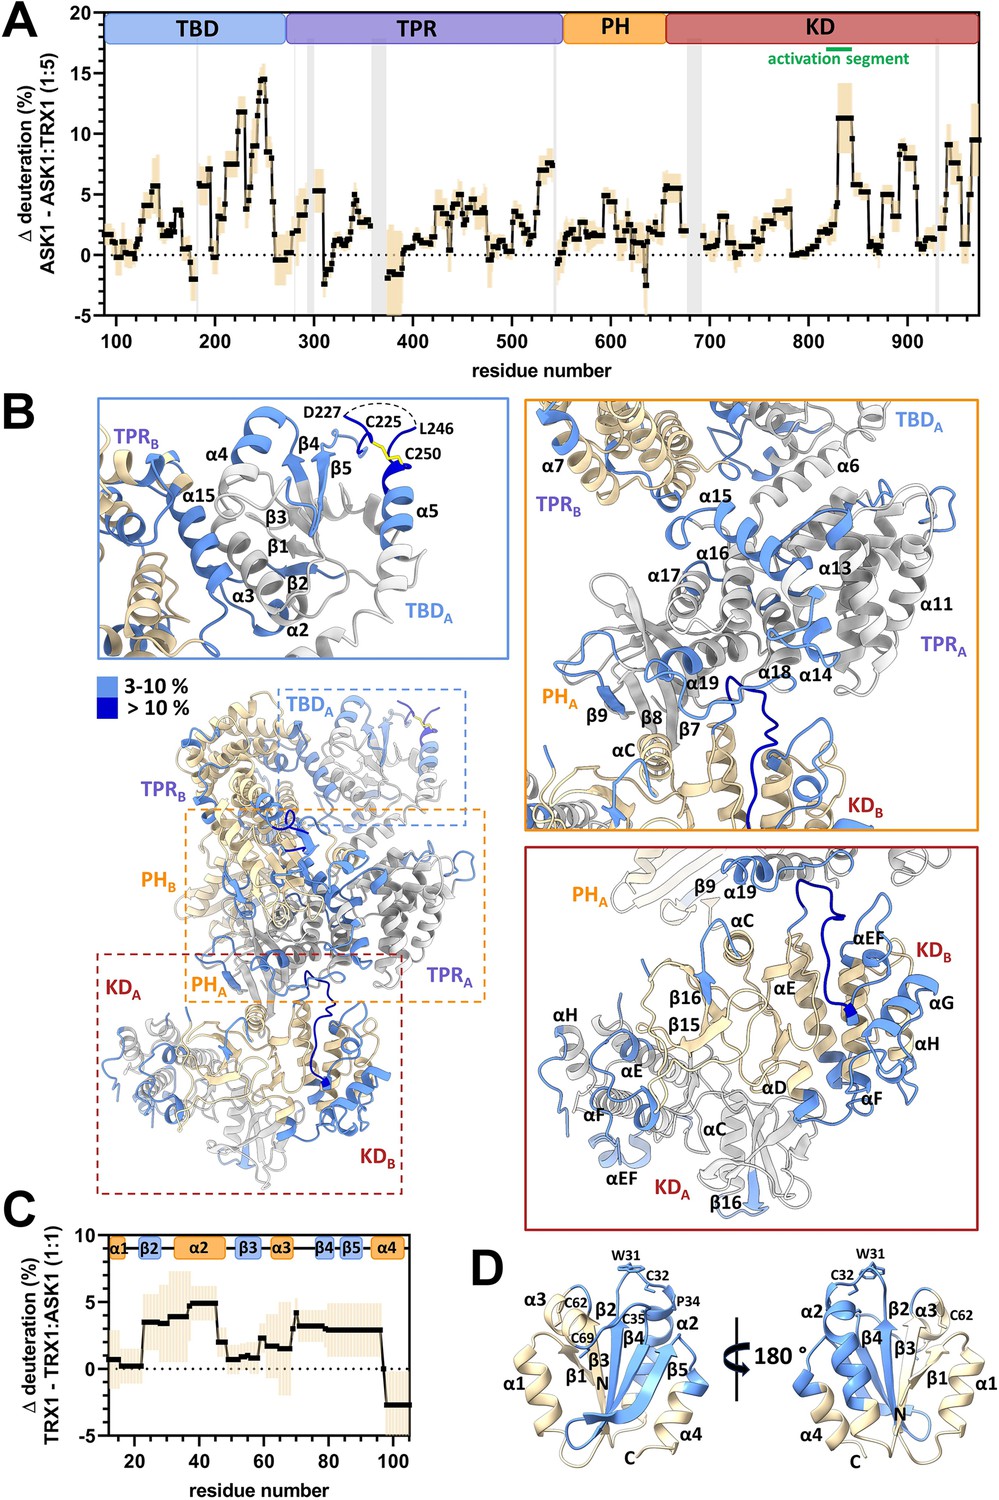
Thioredoxin 1 (TRX1) binding induces structural changes in all N-terminal domains of apoptosis signal-regulating kinase 1 (ASK1).
(A) Differences in ASK1 TBD-CRR-KD deuteration with and without TRX1 after 600 s. Positive values indicate protection (lower deuterium uptake) after TRX1 binding. The graph shows the average of three replicates (black points) and the standard deviation (light orange). Gray zones indicate areas without coverage. The domain structure of ASK1 TBD-CRR-KD is shown at the top. TBD, thioredoxin-binding domain; TPR, tetratricopeptide repeats; PH, pleckstrin-homology domain; CRR, central regulatory region; KD, kinase domain. (B) Cartoon representation of the structure of the ASK1 TBD-CRR-KD dimer (chain A in white, chain B in light yellow) colored according to changes in deuteration in the presence of TRX1 after 600 s. Changes in deuteration greater than twice the standard deviation and above 3% were considered significant. The insets show detailed views of the TBDA and its interface with TPRB (blue box), CRRA (orange box), and KD dimer (brown box). (C) Differences in TRX1 deuteration with and without ASK1 TBD-CRR-KD after 600 s. Positive values indicate protection (lower deuterium uptake) after ASK1 TBD-CRR-KD binding. The graph shows the average of three replicates (black points) and the standard deviation (light orange). The secondary structure of TRX1 is shown at the top. (D) Cartoon representation of TRX1 structure (in the reduced state, PDB ID: 1ERT [Weichsel et al., 1996]) colored according to changes in deuteration after ASK1 TBD-CRR-KD binding for 600 s.
Figure 4—figure supplement 1
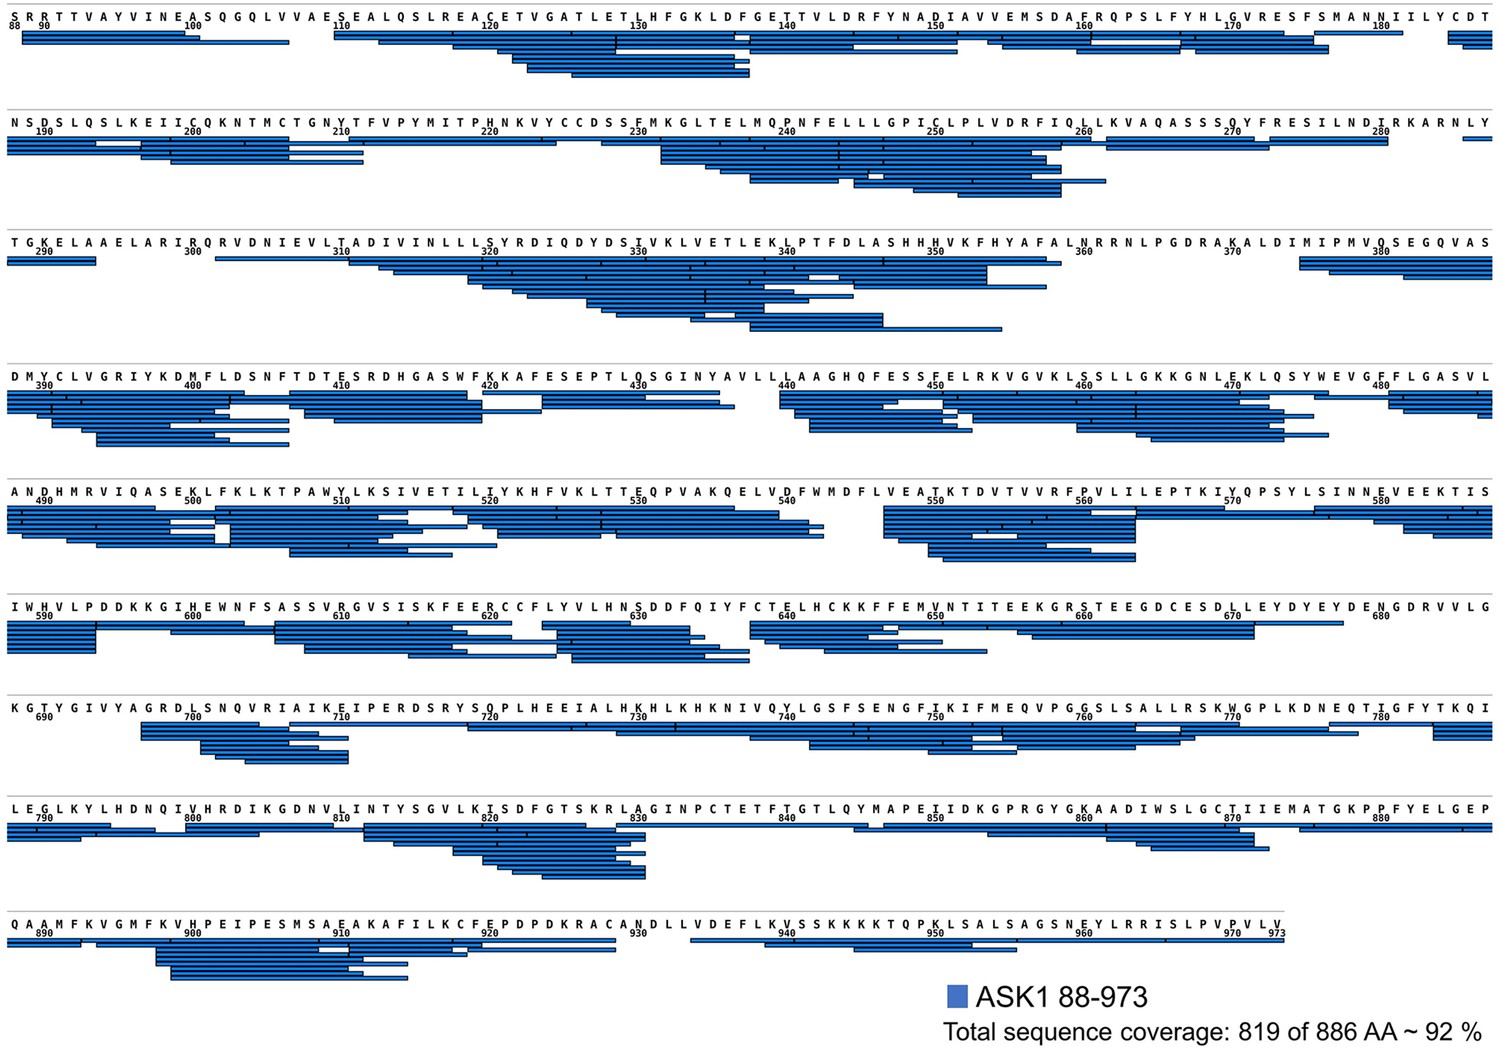
Sequence coverage of apoptosis signal-regulating kinase 1 (ASK1) TBD-CRR-KD (residues 88–973) assessed by hydrogen/deuterium exchange (HDX).
The sequence coverage of the construct reached 92%, with 819 of 886 amino acid residues. The map was created using the DrawMap script of MSTools (http://peterslab.org/MSTools/).
Figure 4—figure supplement 2
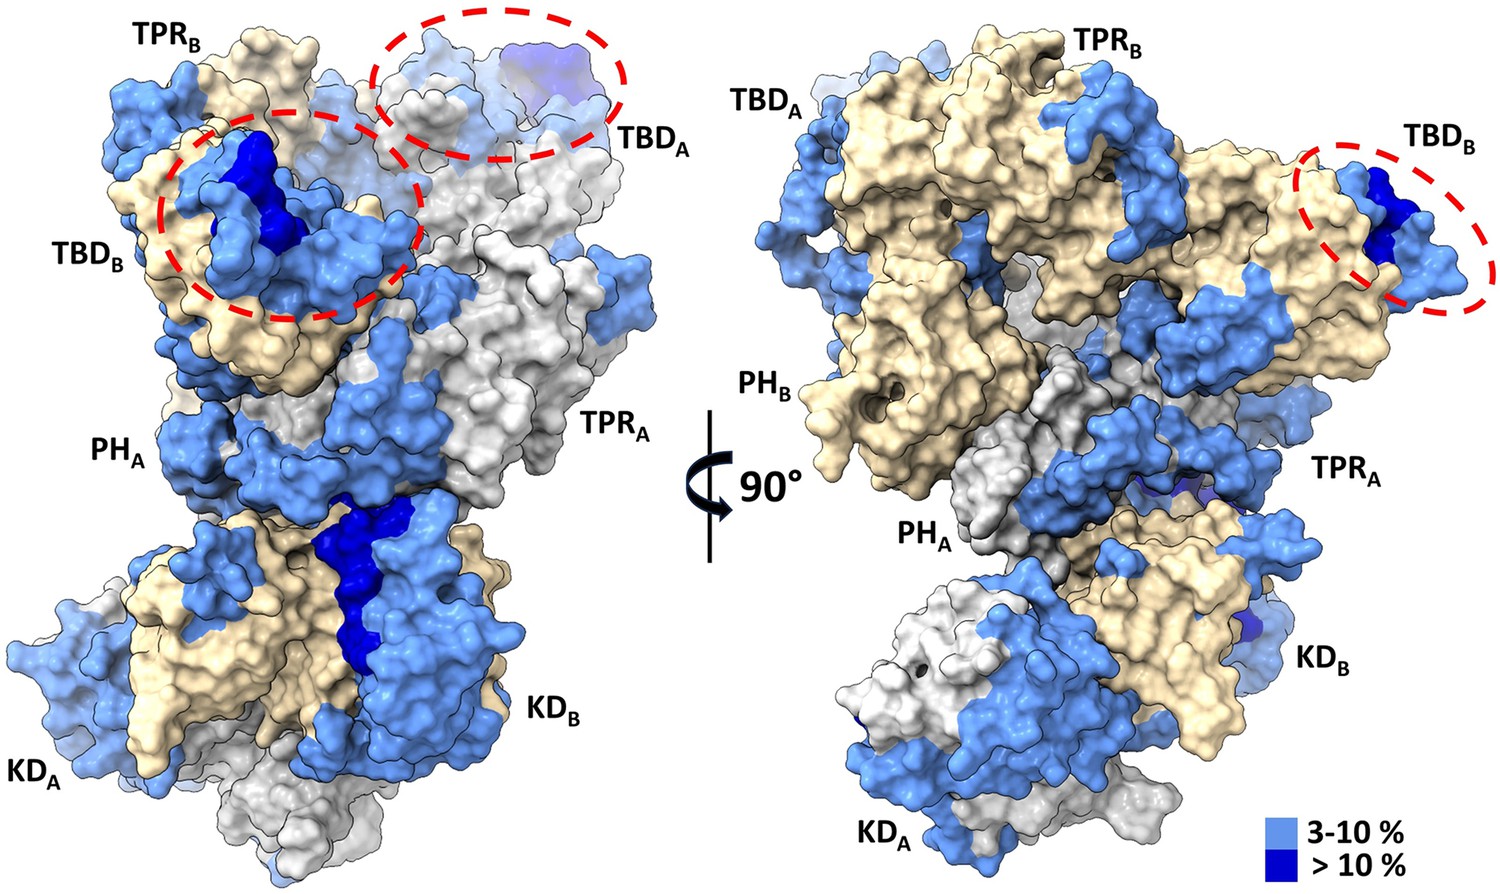
Thioredoxin 1 (TRX1) binding induces structural changes in all domains of apoptosis signal-regulating kinase 1 (ASK1) TBD-CRR-KD.
Surface representation of the structure of the ASK1 TBD-CRR-KD dimer (chain A in gray, chain B in light yellow) colored according to changes in deuteration in the presence of TRX1 after 600 s. Red ellipses indicate TRX1-binding sites on thioredoxin-binding domains (TBDs).
Figure 4—figure supplement 3
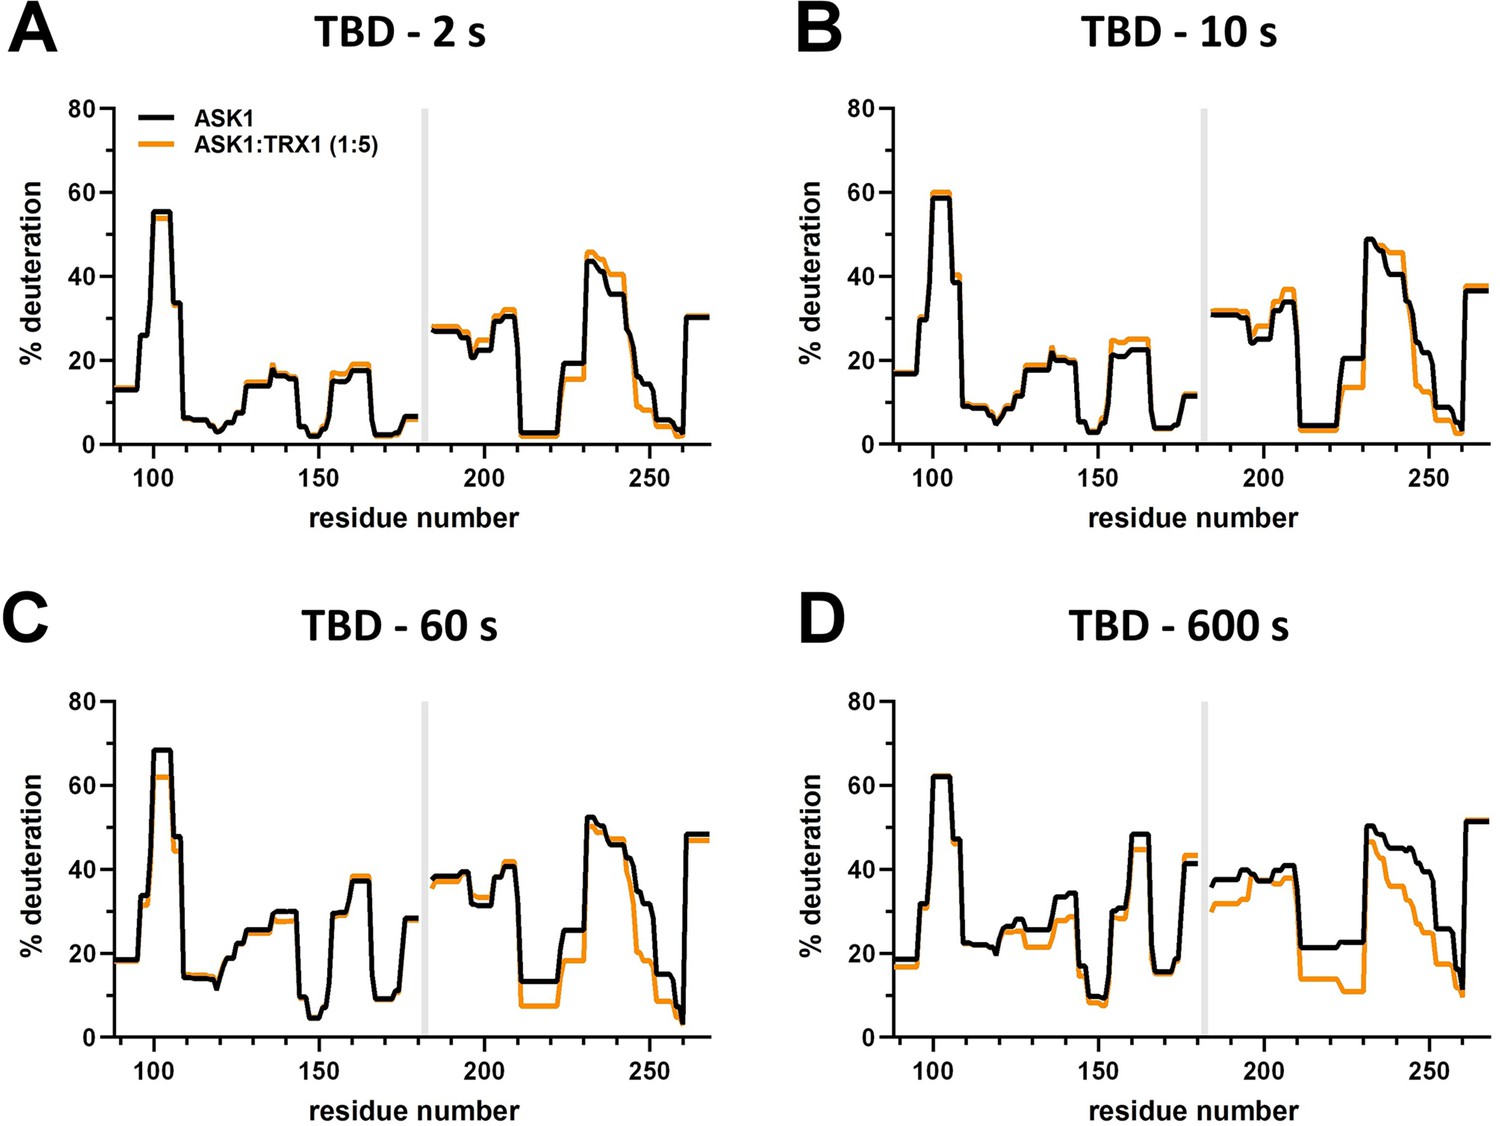
Effect of thioredoxin 1 (TRX1) binding on thioredoxin-binding domain (TBD) deuteration in the apoptosis signal-regulating kinase 1 (ASK1) TBD-CRR-KD dimer.
(A–D) Protection plots showing differences in TBD deuteration within ASK1 TBD-CRR-KD with (orange) or without (black) TRX1 at four different deuteration times: 2 s, 10 s, 1 min, and 10 min. Gray zones indicate areas without coverage.
Figure 4—figure supplement 4
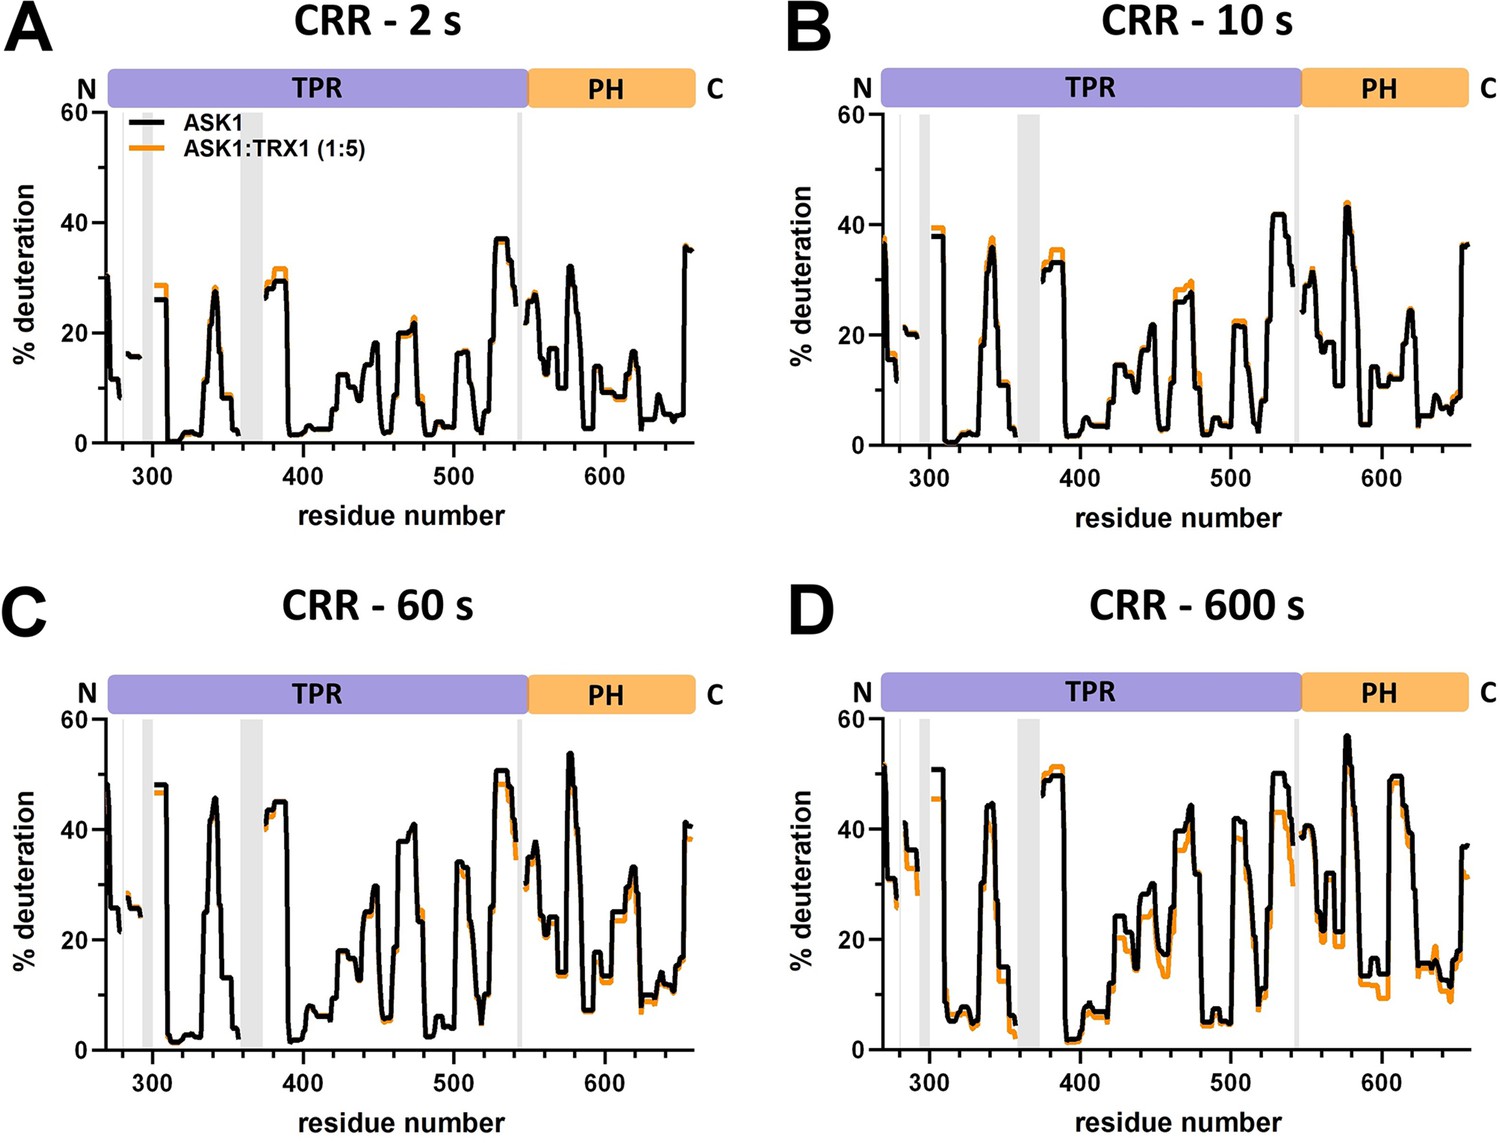
Effect of thioredoxin 1 (TRX1) binding on central regulatory region (CRR) deuteration in the apoptosis signal-regulating kinase 1 (ASK1) TBD-CRR-KD dimer.
(A–D) Protection plots showing differences in CRR deuteration within ASK1 TBD-CRR-KD with (orange) or without (black) TRX1 at four different deuteration times: 2 s, 10 s, 1 min, and 10 min. Gray zones indicate areas without coverage.
Figure 4—figure supplement 5
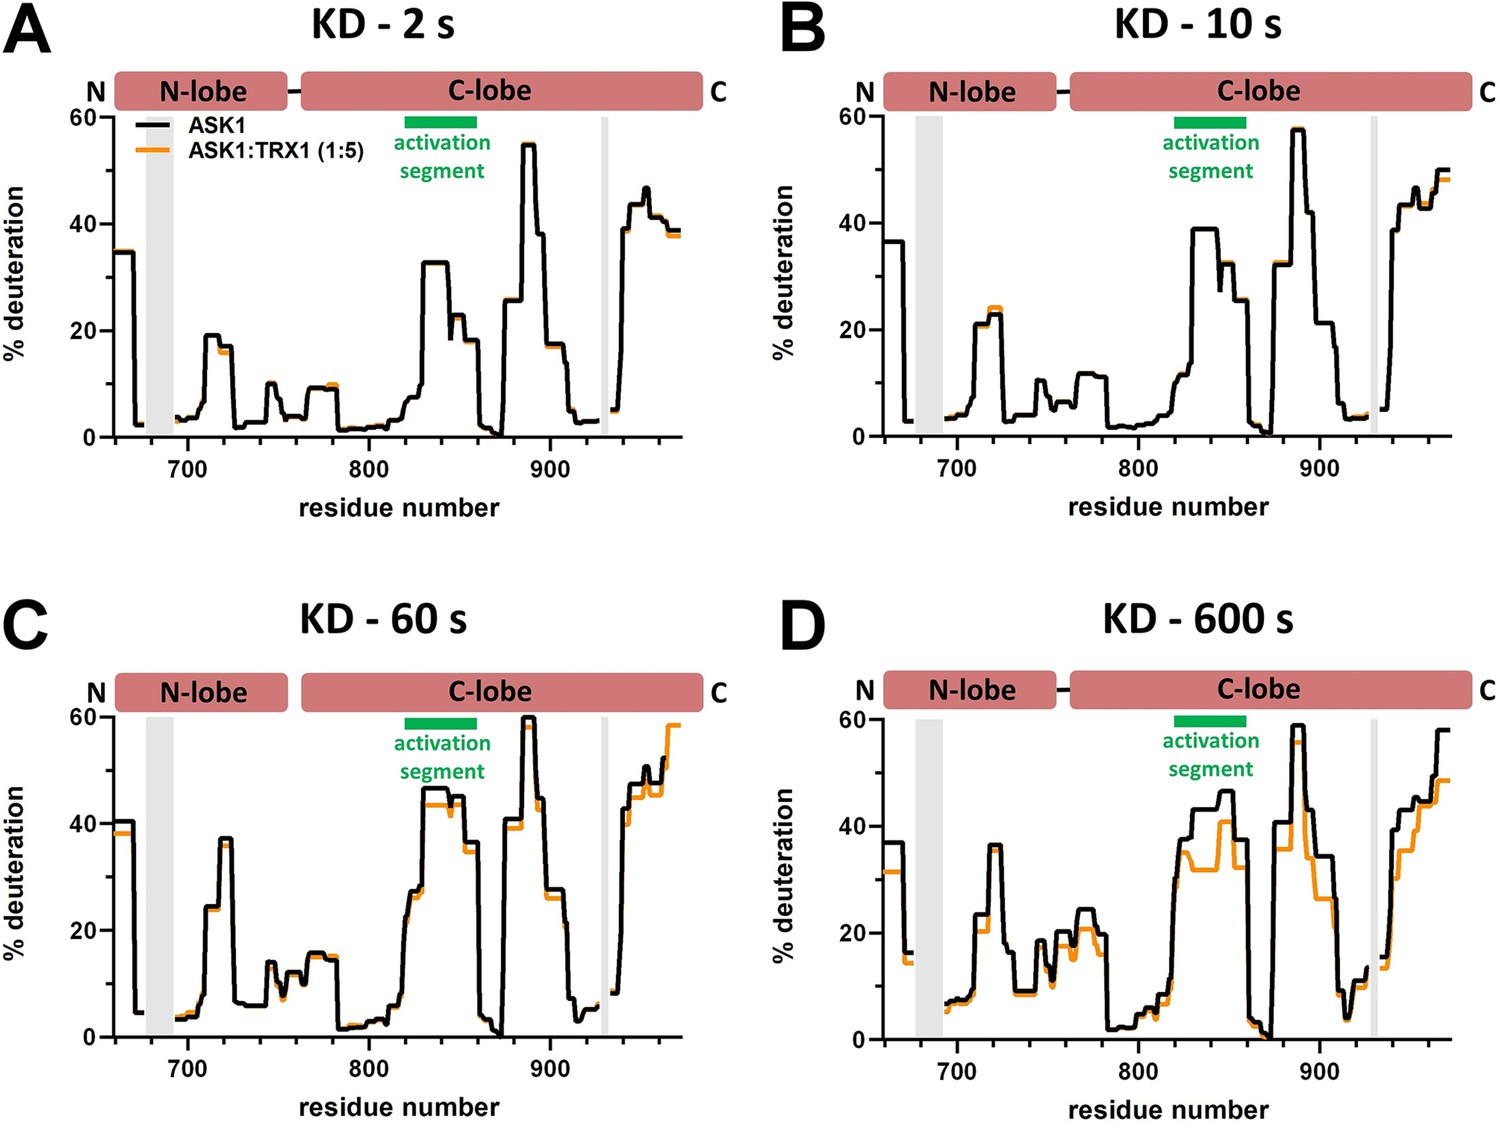
Effect of thioredoxin 1 (TRX1) binding on kinase domain (KD) deuteration in the apoptosis signal-regulating kinase 1 (ASK1) TBD-CRR-KD dimer.
(A–D) Protection plots showing differences in KD deuteration within ASK1 TBD-CRR-KD with (orange) or without (black) TRX1 at four different deuteration times: 2 s, 10 s, 1 min, and 10 min. Gray zones indicate areas without coverage.
Figure 4—figure supplement 6
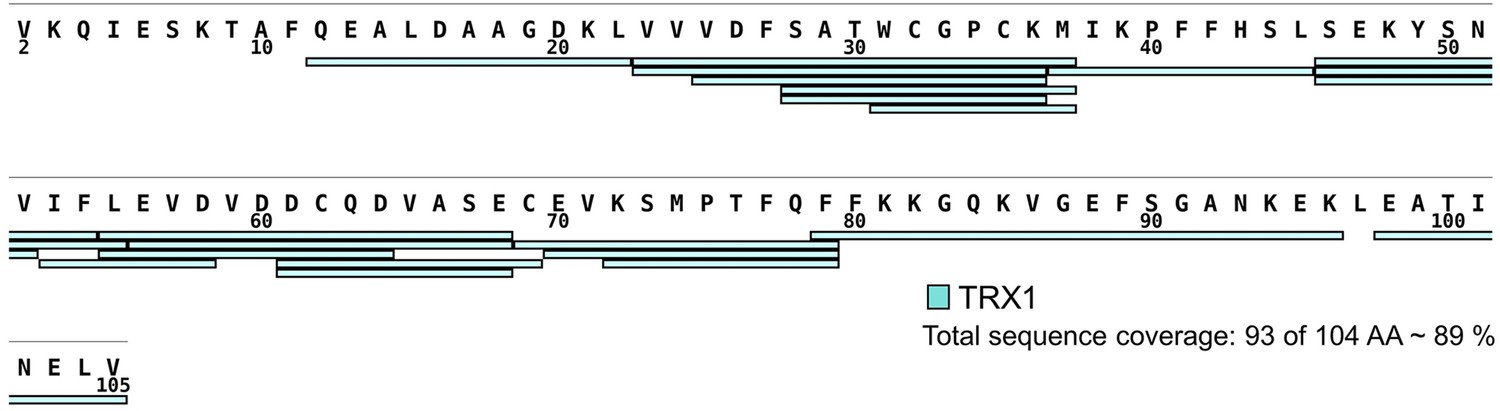
Sequence coverage of thioredoxin 1 (TRX1) assessed by hydrogen/deuterium exchange (HDX).
The sequence coverage of the TRX1 construct reached 89%, with 93 of 104 amino acid residues. The map was created using the DrawMap script of MSTools (http://peterslab.org/MSTools/).
Figure 4—figure supplement 7
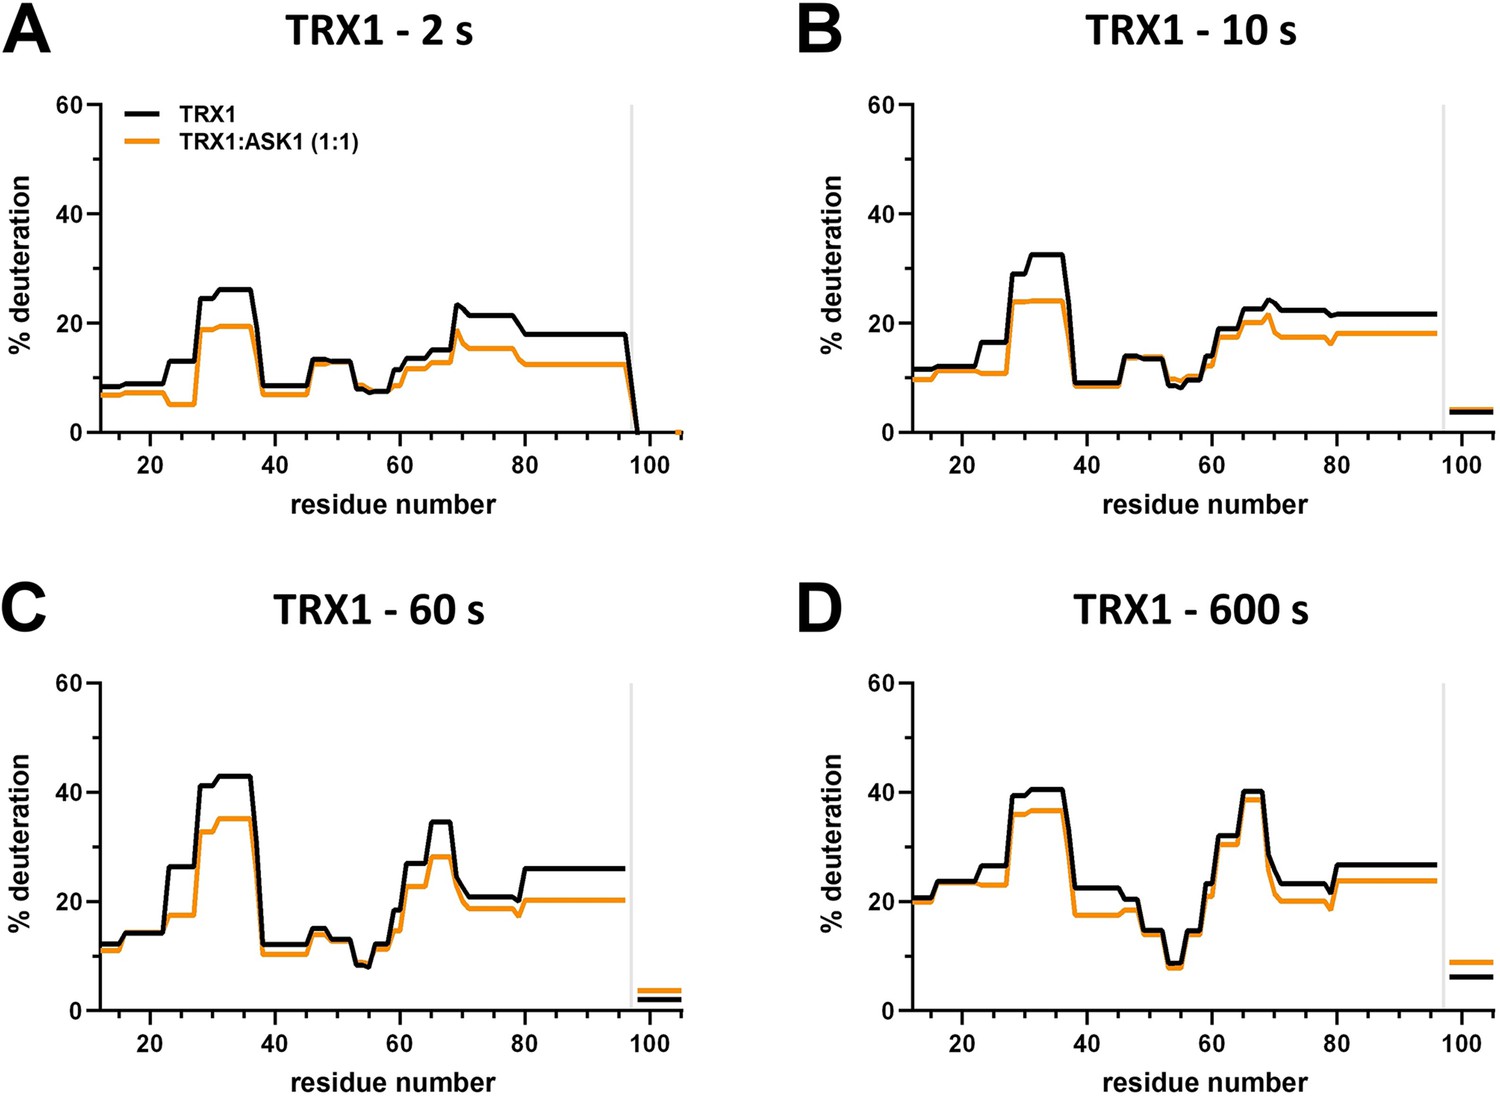
Effect of complex formation on thioredoxin 1 (TRX1) deuteration.
(A–D) Protection plots showing differences in TRX1 deuteration with (orange) or without (black) apoptosis signal-regulating kinase 1 (ASK1) TBD-CRR-KD at four different deuteration times: 2 s, 10 s, 1 min, and 10 min. Gray zones indicate areas without coverage.
Figure 5
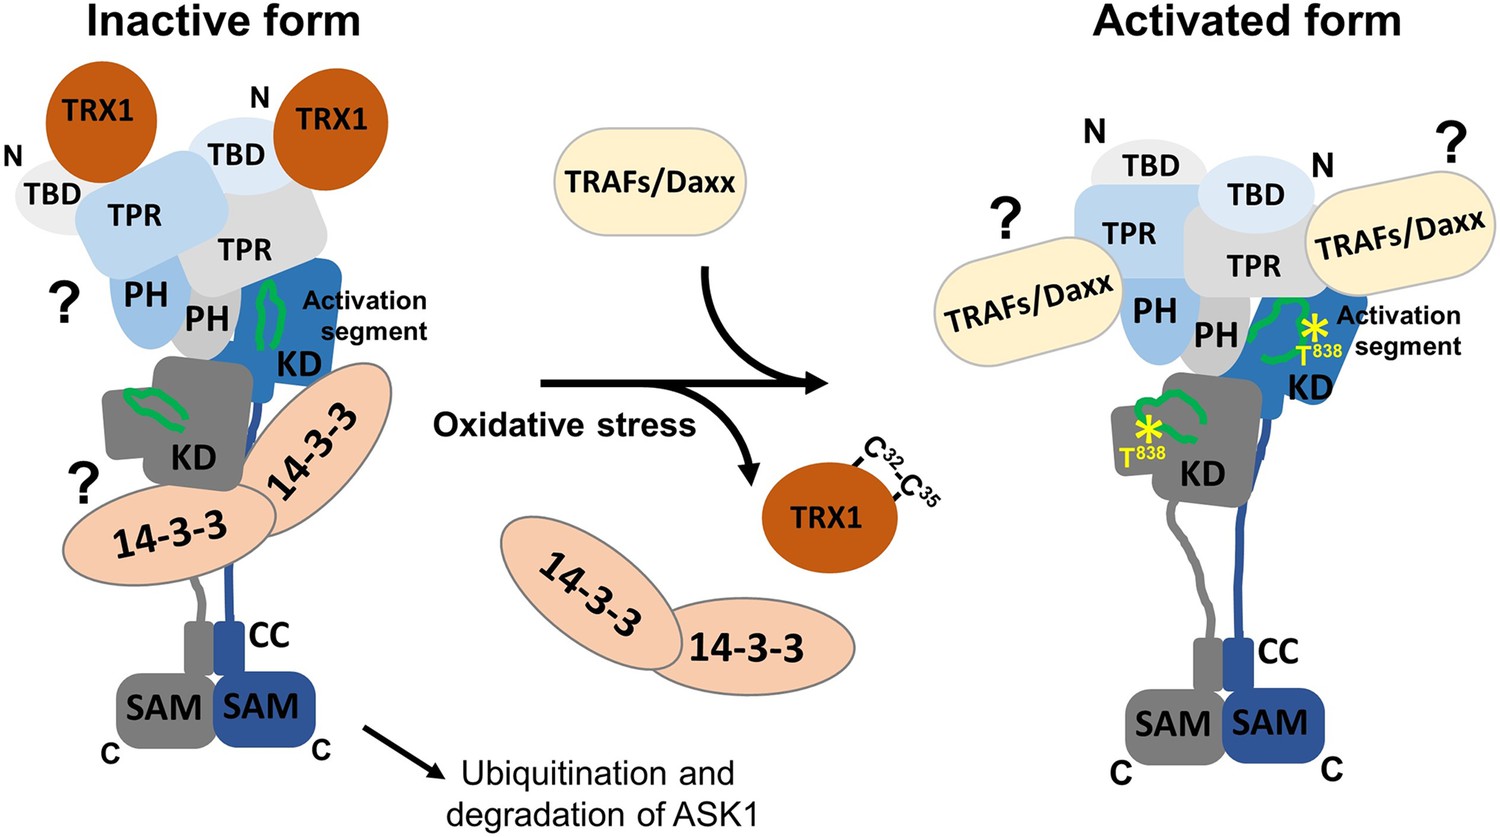
Proposed schematic model of apoptosis signal-regulating kinase 1 (ASK1) activation.
In the resting state, ASK1 constitutively oligomerizes and is kept in an inactive state through interactions with thioredoxin 1 (TRX1) and 14-3-3 proteins. TRX1 appears to function as an allosteric effector whose binding affects the structure of thioredoxin-binding domain (TBD), likely affecting its interaction with tetratricopeptide repeats (TPR). Therefore, TRX1 affects the structure of central regulatory region (CRR) and allosterically modulates several regions of kinase domain (KD), even reducing access to the activation segment with the key phosphorylation site T838. Oxidative stress triggers TRX1 dissociation, followed by 14-3-3 dissociation and tumor necrosis factor receptor-associated factor (TRAF) recruitment. These events subsequently lead to a conformational change in KD and increase access to the activation segment, enabling its phosphorylation at T838 and, as a result, stabilizing the active conformation. The role of 14-3-3 proteins in ASK1 inhibition and the mechanism whereby TRAFs and Daxx are involved in ASK1 activation remain unclear and should be explored in subsequent studies.
Additional files
-
Supplementary file 1
Cryo-electron microscopy (Cryo-EM) data collection, refinement, and validation statistics.
- https://cdn.elifesciences.org/articles/95199/elife-95199-supp1-v1.docx
-
MDAR checklist
- https://cdn.elifesciences.org/articles/95199/elife-95199-mdarchecklist1-v1.docx
Download links
A two-part list of links to download the article, or parts of the article, in various formats.
Downloads (link to download the article as PDF)
Open citations (links to open the citations from this article in various online reference manager services)
Cite this article (links to download the citations from this article in formats compatible with various reference manager tools)
The cryo-EM structure of ASK1 reveals an asymmetric architecture allosterically modulated by TRX1
eLife 13:RP95199.
https://doi.org/10.7554/eLife.95199.2


