Herbivory-induced volatiles function as defenses increasing fitness of the native plant Nicotiana attenuata in nature
- Max Planck Institute for Chemical Ecology, Germany
Figures
Figure 1
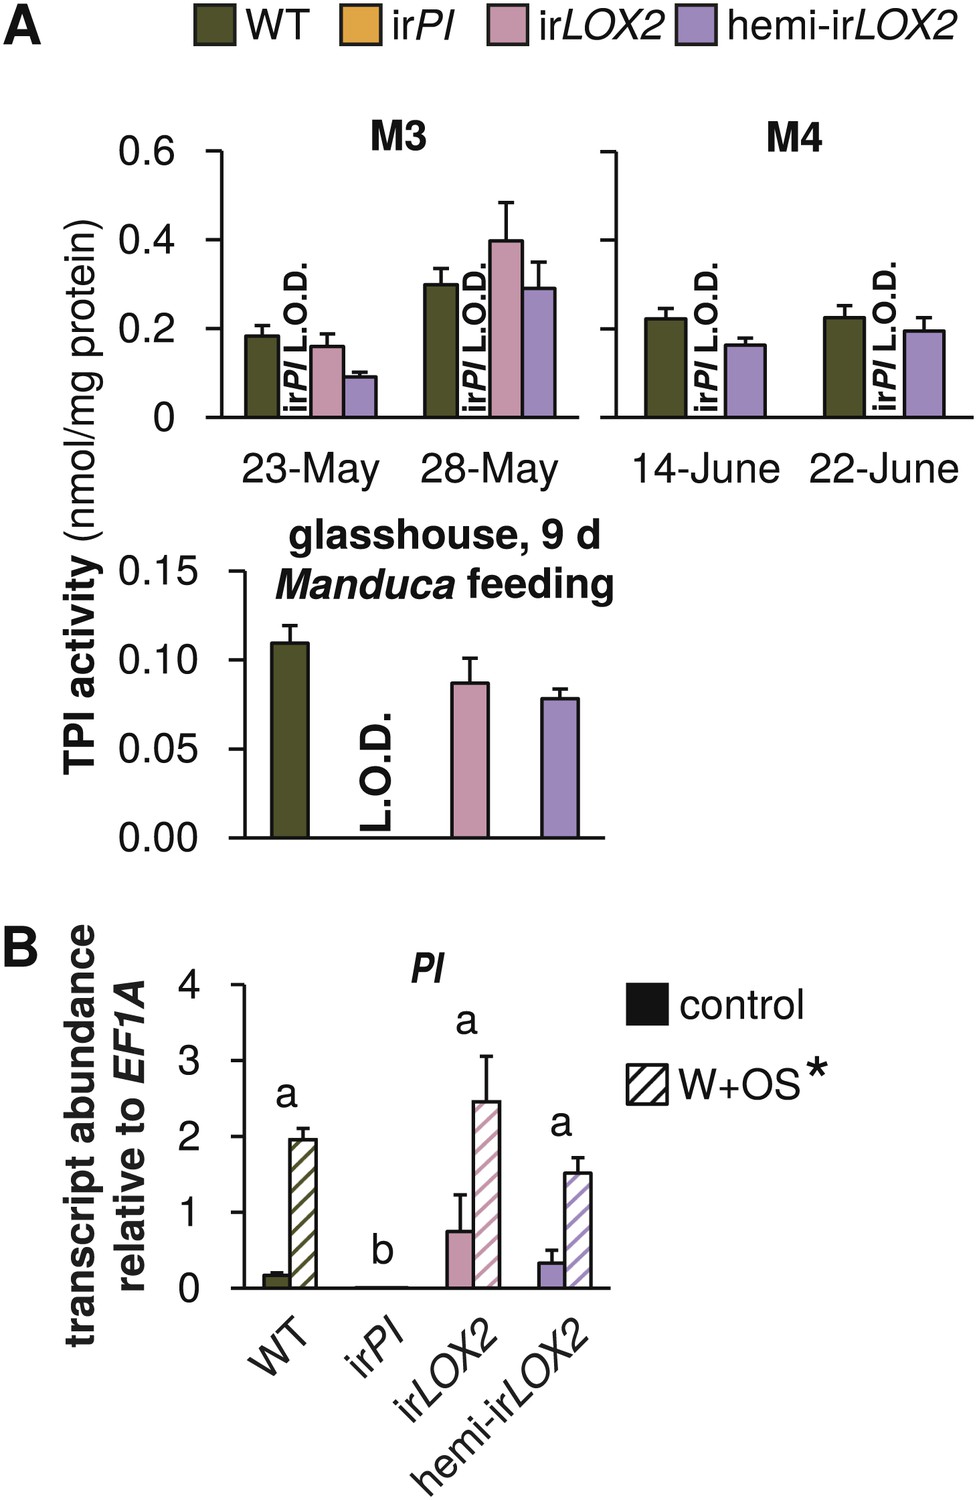
Trypsin protease inhibitor (TPI) activity and transcripts in transformed lines; graphs show means+SEM. (A) TPI activity measured in systemic leaves of field-grown (top two panels, 2011, N=11–14 for panel 1 and N=21 for panel 2) or glasshouse-grown plants (bottom panel, N=10) attacked by Manduca spp. larvae. Only WT, irPI and hemi-irLOX2 plants were used in M4. For a timeline of Manduca spp. infestations M1–M4 see Figure 4A. For raw data, see F2A_SchumanBarthelBaldwin2012TPIactivity.xlsx (Dryad: Schuman et al., 2012). (B) Transcripts of PI in unelicited leaf tissue (control), and at the point of maximum accumulation in W+OS-elicited leaf tissue in glasshouse-grown plants (N=5). For raw data, see F2B_SchumanBarthelBaldwin2012PItranscripts.xlsx (Dryad: Schuman et al., 2012). *W+OS treatment had a significant effect on PI (p<0.001) transcript accumulation. a, b Different letters indicate significant differences between genotypes (p<0.001) in Scheffe post hoc tests following a two-way ANOVA on log2-transformed data with factors treatment and genotype (genotype F3,29=174.077, p<0.001; treatment F1,29=75.909, p<0.001). L.O.D.: below limit of detection for measurement.
Figure 2
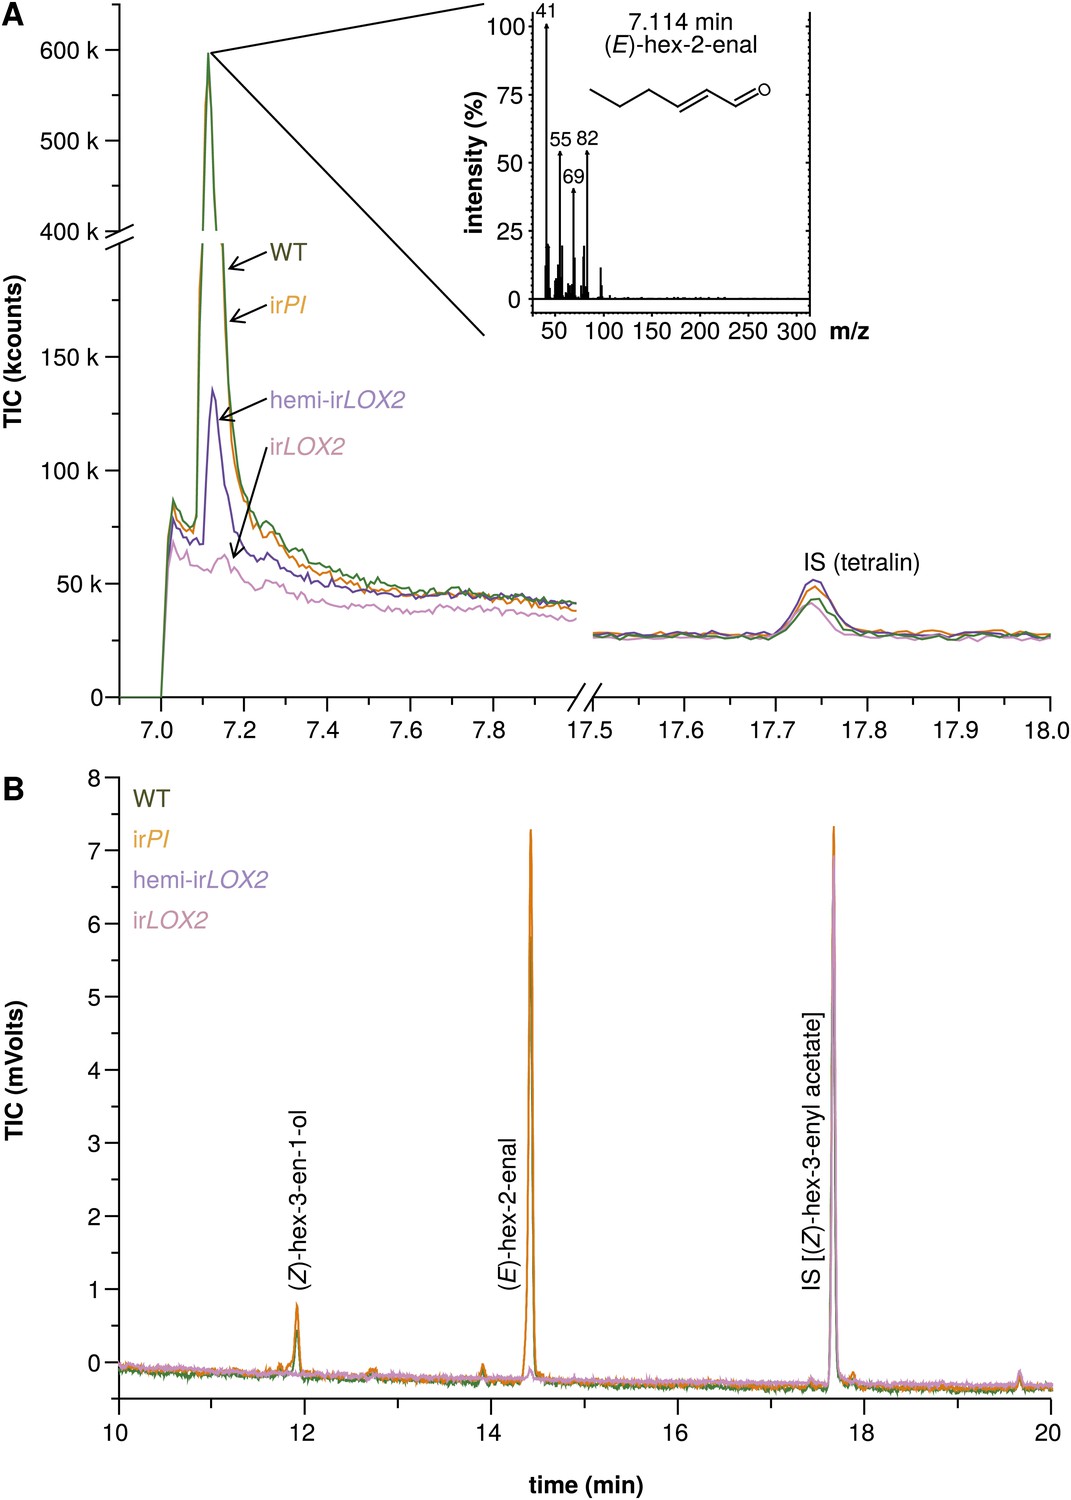
Hexane extracts of leaves from field-grown plants. (A) Hexane extracts from pooled leaf samples of field-grown plants for a qualitative assessment of green leaf volatile (GLV) pools, analyzed by GC-MS with a split ratio of 1/100 onto a nonpolar column; only (E)-hex-2-enal was identified due to poor resolution of (E)-hex-2-enal and (Z)-hex-3-en-1-ol on the nonpolar column; no ester peaks were detected. For raw data, see F3A_SchumanBarthelBaldwin2012chromatograms.xlsx (Dryad: Schuman et al., 2012). (B) Example chromatograms from hexane extracts of individual leaf samples from field-grown plants, analyzed by GC-FID on a wax column. The dominant compound was (E)-hex-2-enal; (Z)-hex-3-en-1-ol was also present in quantifiable amounts. (Z)-3-hexenyl acetate was chosen as an internal standard because no esters were detectable in the preliminary qualitative GC-MS analysis (1A), and because its chemical similarity to (E)-hex-2-enal and (Z)-hex-3-en-1-ol made it a good choice of internal standard for normalization and calculation of yield from extracts. For raw data, see F3B_SchumanBarthelBaldwin2012chromatograms.xlsx (Dryad: Schuman et al., 2012). IS: internal standard.
Figure 3
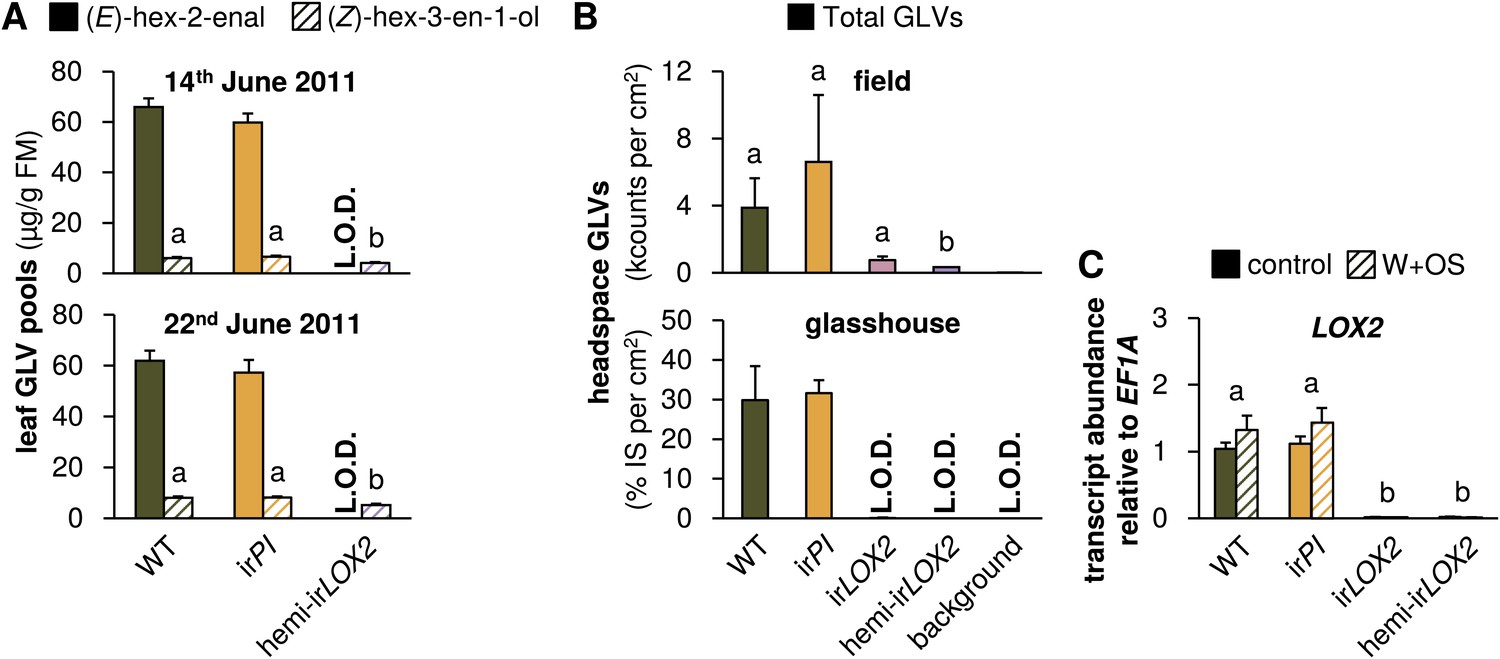
GLV production and emission in transformed lines; graphs show means+SEM. (A) GLVs extracted with hexane from leaf tissue of field-grown WT, irPI, and hemi-irLOX2 plants grouped in triplets for infestation M4 in 2011(Figure 4A). Leaves were harvested from every plant at the beginning (June 14) and in the middle of M4 (June 22) and leaves from plants in 10 randomly chosen triplets were analyzed. Only (E)-hex-2-enal and (Z)-hex-3-en-1-ol were quantifiable in leaf extracts. Different letters (a and b) indicate significant differences (p≤0.05) in Scheffe post hoc tests following one-way ANOVAs for (Z)-hex-3-en-1-ol (top panel, F2,26=9.556, p=0.001; bottom panel, F2,26=12.196, p<0.001). For raw data, see F4A_SchumanBarthelBaldwin2012GLVpools.xlsx (Dryad: Schuman et al., 2012). (B) GLVs measured in headspace samples of leaves from field-grown (top panel, N=3) or glasshouse-grown plants (bottom panel, N=4). For field-grown plants, leaves were harvested and measured on May 21 (just before M3). Intact leaves were kept fresh by placing petioles in water. Immediately before each measurement, one leaf was treated with wounding and M. sexta oral secretions (W+OS); a 1-cm2 disc was stamped out and placed in a 4-mL GC vial. After 15 min the headspace in the vial was measured with a Z-Nose 4200 and total alcohols and aldehydes were quantified. Different letters (a and b) indicate significant differences (p<0.05) in Scheffe post hoc tests following one-way ANOVA (F3,8=7.346, p=0.011). For glasshouse-grown plants, leaves were left on plants, treated with W+OS, and enclosed in padded, 50 mL food-quality plastic containers for 3 hr while the headspace was pulled over a Poropak Q filter. Filter eluents were measured by GC-MS. Three-hour headspace samples contained (Z)-hex-3-en-1-ol, (E)-hex-2-en-1-ol (forms from (E)-hex-2-enal on filters over trapping periods longer than 20 min), (Z)-hex-3-enyl acetate, (Z)-hex-3-enyl butanoate, (Z)-hex-3-enyl isobutyrate, and (Z)-hex-3-enyl propanoate, all of which showed the pattern shown for the total amount. For raw data, see F4B_SchumanBarthelBaldwin2012GLVheadspace.xlsx (Dryad: Schuman et al., 2012). (C) Transcripts of LOX2 in unelicited leaf tissue (control), and at the point of maximum accumulation in W+OS-elicited leaf tissue in glasshouse-grown plants (N=5). For raw data, see F4C_SchumanBarthelBaldwin2012LOX2transcripts.xlsx (Dryad: Schuman et al., 2012). a, b Different letters indicate significant differences between genotypes (p<0.001) in Scheffe post hoc tests following a two-way ANOVA on log2-transformed data with factors treatment and genotype (genotype F3,32=635.477, p<0.001, treatment F1,32=0.021, p=0.887). L.O.D.: below limit of detection for measurement.
Figure 4
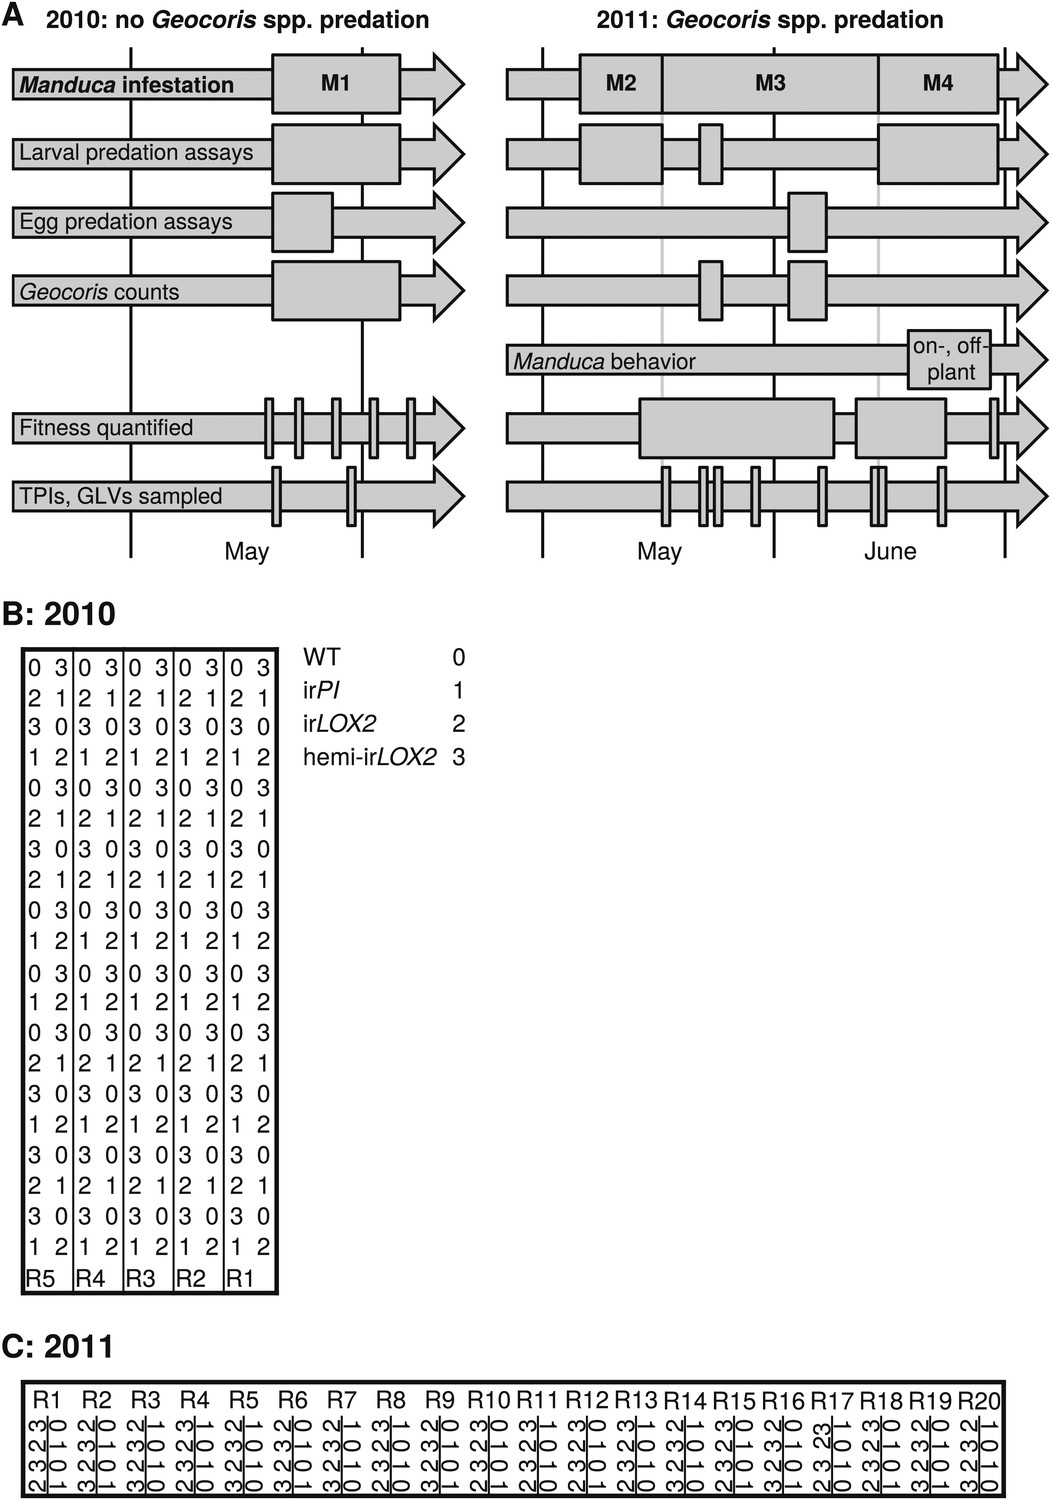
Experimental timeline and layout. (A) Timeline of field experiments in 2010 and 2011. Different assays and measurements are represented by individual arrows, and rectangles span the time frame of each assay or measurement; narrow rectangles represent single days. Four experimental Manduca infestations (M1–M4) structure the overall experimental design: M1–M3, with laboratory Manduca, and M4, with wild Manduca larvae. (B and C) Layouts of field plots in (B) 2010 and (C) 2011. Thick lines denote the borders of the experiment, thin lines denote irrigation lines (vertical borders of plot were also irrigation lines in [B] 2010), and R# denotes row number (used for identifying replicates during the experiment). The genotype key in (B) applies to both (B) and (C).
Figure 5
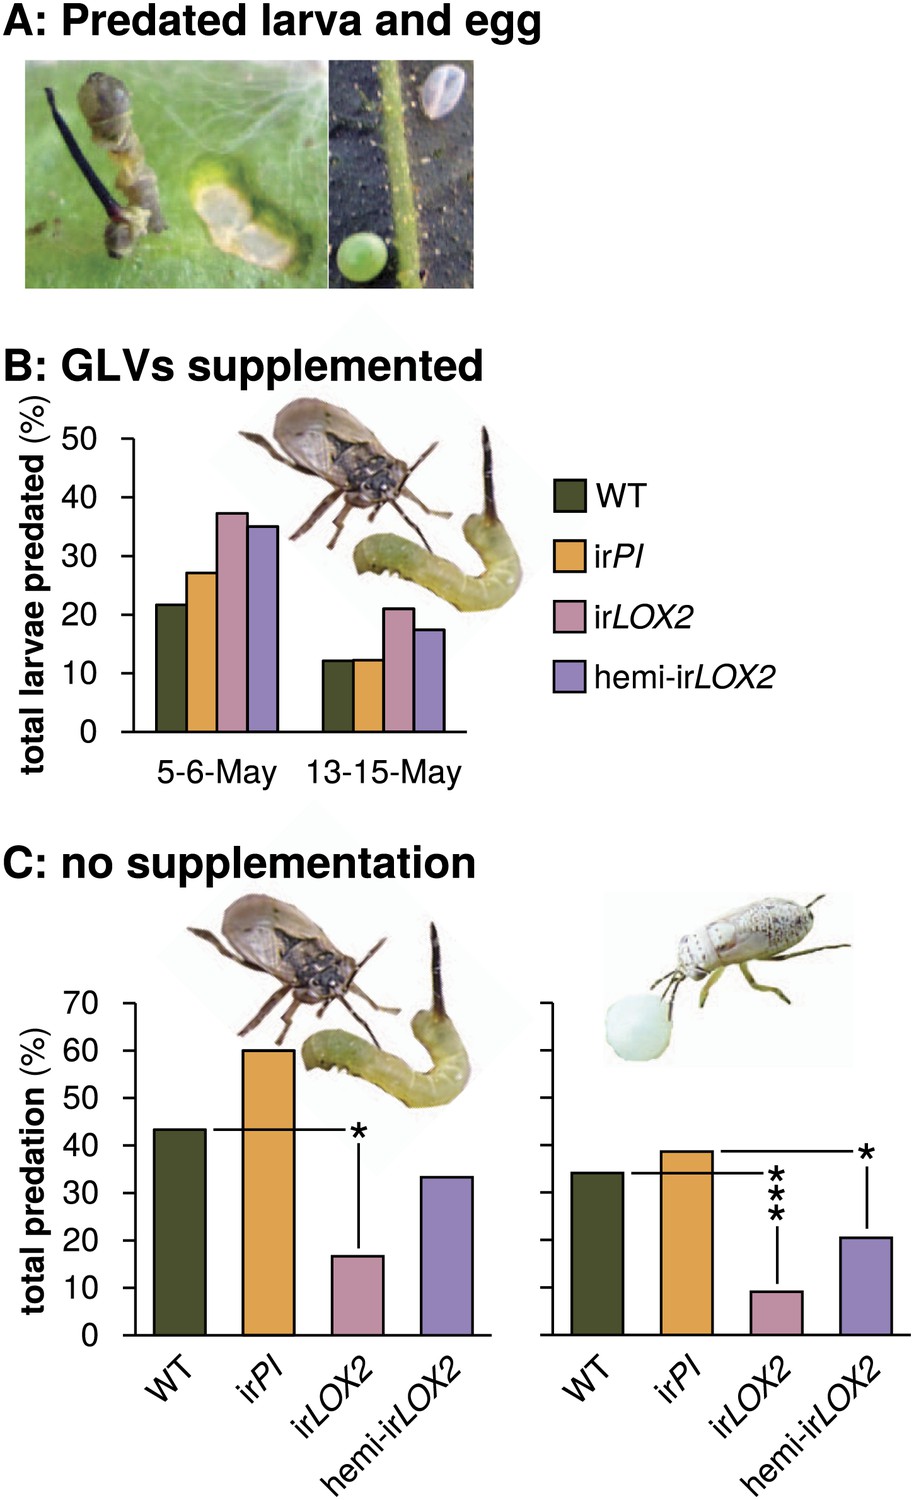
Predation of M. sexta larvae and eggs by Geocoris spp. (A) Examples of predated M. sexta larva (left panel) and egg (right panel). Left, the carcass of a predated first-instar M. sexta larva and typical feeding damage from early-instar Manduca spp. larvae. Right, an intact (lower left) and a predated (upper right) Manduca spp. egg. In this case, the predated egg collapsed during predation. (B) Total predation of M. sexta larvae per trial over two trials during infestation M2. GLVs were supplemented externally by placing cotton swabs next to Manduca-infested leaves (1 per plant). Cotton swabs next to irLOX2 and hemi-irLOX2 plants received 20 μL of a GLV mixture in lanolin paste (Table 1); those next to WT and irPI plants received lanolin with hexane as a control because hexane was used to dissolve GLVs before mixing with lanolin. N=59–60 larvae on May 5–6 and 92–100 larvae on May 13–15. Geocoris spp. tended to predate more larvae from GLV-supplemented plants (Fisher's exact tests, 35–37% vs 22–27% May 5–6, p=0.066; 17–21% vs 12% May 13–15, p=0.069; combined trials, Bonferroni-corrected p=0.0063). (C) Total percentage of M. sexta larvae (left panel, N=30 larvae) and eggs (right panel, N=88 eggs) predated in two separate trials during infestation M3 in 2011 (Figure 4). There was no predation of larvae or eggs by Geocoris spp. in 2010. Raw data for (B) and (C) is in F5BC_SchumanBarthelBaldwin2012predation.xlsx (Dryad: Schuman et al., 2012). Pictures are of a G. pallens adult predating a first-instar Manduca spp. larva (left) and a fifth-instar G. pallens nymph predating a Manduca spp. egg (right picture, S. Allmann). *p<0.05, ***p<0.001 in Fisher's exact tests against WT (irLOX2) or irPI (hemi-irLOX2, which also contains the irPI construct).
Figure 6
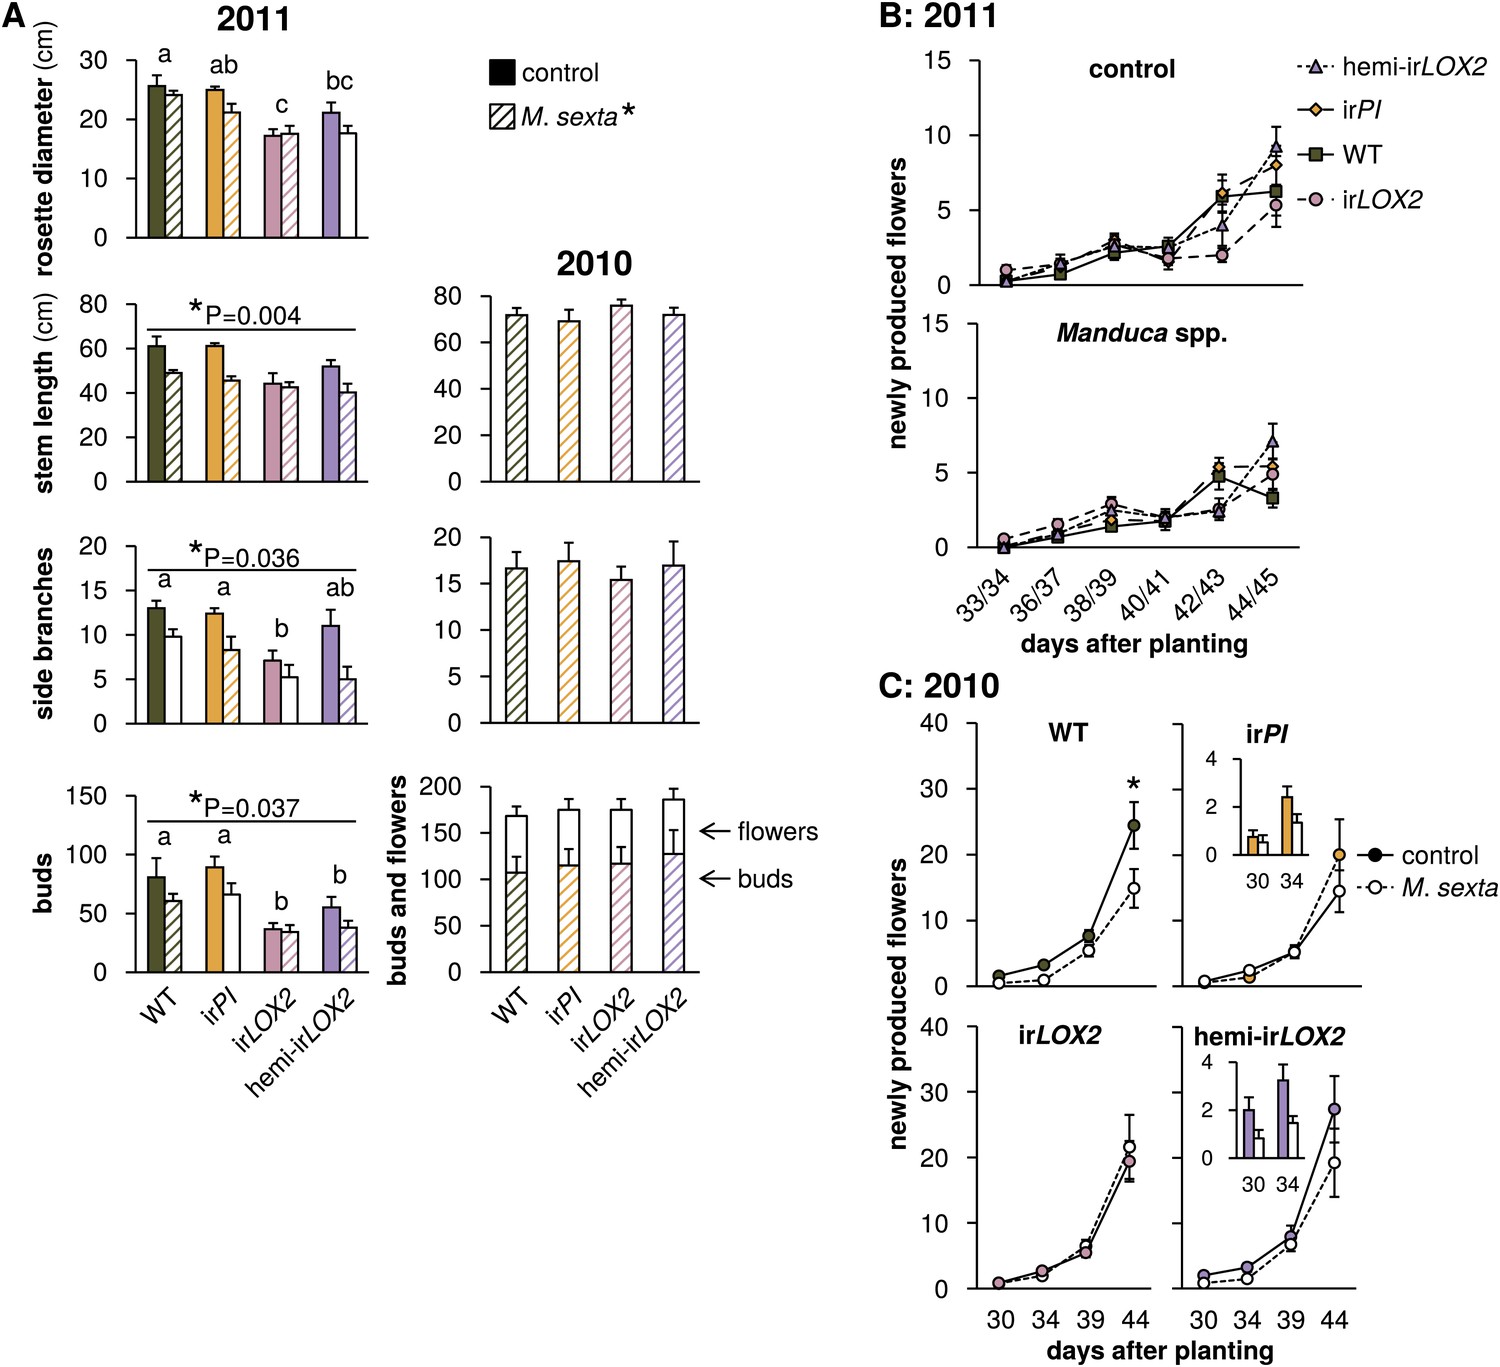
Growth and reproduction of plants during the 2010 and 2011 field seasons; graphs show means±SEM. (A) Final growth measurements for M. sexta-infested and uninfested control plants of each genotype in 2011 (left, 44–45 days after planting, N=11–17) or M. sexta-infested plants in 2010 (right, June 6, 2 days after the removal of fifth-instar M. sexta larvae). *p<0.05 for Wilks' Lambda test of the effect of M. sexta feeding on growth and reproduction in 2011, day 44–45, in a two-way MANOVA with factors genotype and treatment (F6,52=2.287, p=0.049). *p-values above individual graphs denote the significance of M. sexta feeding over all genotypes in 2011 for the measurement shown in the MANOVA, or in a separate Mann-Whitney U-test for side branches (stem F1,57=9.155; side branches, U = 270; buds F1,57=4.572); values for individual genotypes are in Table 3. a, b, c Different letters denote significant (p<0.05) differences between genotypes in 2011 for Scheffe post hoc tests (rosette diameter F3,57=8.791, p<0.001, stem length F3,57=4.192, p=0.009, number of buds F3,57=9.876, p<0.001) or Bonferroni-corrected p-values for Mann-Whitney U-tests following a Kruskal-Wallis test (side branches χ2 = 10.958). In 2010, in the absence of Geocoris spp. activity, there were no significant differences between genotypes in the parameters shown with or without M. sexta infestation (Table 3). Bud numbers from 2010 are also shown in Figure 9. (B and C) Flower production for M. sexta-infested and uninfested control plants from the beginning of flowering in (B) 2011 and (C) 2010. Flowers were counted and removed at the time points shown: each time point represents new flower production. Insets in (C) show the first two time points for irPI and hemi-irLOX2. *p<0.05 for the main effect of M. sexta infestation in a repeated-measures ANOVA with log2-transformed data (Table 3). Raw data for 2011 is in F6AB_SchumanBarthelBaldwin2012growth_reproduction2011.xlsx and T4_SchumanBarthelBaldwin2012growth_reproduction2011.xlsx, and data for 2010 is in F6AC_SchumanBarthelBaldwin2012growth_reproduction2010.xlsx (Dryad: Schuman et al., 2012).
Figure 7

Herbivore damage to plants during the 2010 and 2011 field seasons (means+SEM). For a timeline of Manduca infestations M1–M4, see Figure 4A. (A) Total canopy damage due to naturally occurring herbivores before the start of infestation M1 in 2010, N=17. For raw data, see F7A_SchumanBarthelBaldwin2012herbivoreDamage2010.xlsx (Dryad: Schuman et al., 2012). (B) Total canopy damage due to naturally occurring herbivores before infestation M2 (May 5) and near the end of M3 (May 27) in 2011, N=24–28. a, b Different letters denote significant (p<0.05) differences between genotypes in Scheffe post hoc tests following one-way ANOVAs for arcsine-transformed data at each timepoint (mirids May 27 F3,103=5.291, p=0.002; noctuids May 27 F3,103=3.503, p=0.018); n.s.: not significantly different. #p<0.05 for the main effect of genotype on noctuid damage in a Bonferroni-corrected Kruskal-Wallis test, May 5 (χ2=11.239, p=0.027). (C) Damage in 2011 from M. sexta larvae used in the predation assays in M2 (left panel) and M3 (right panel). GLVs were externally supplemented to plants in infestation M2 and not in M3. Total canopy damage was estimated, using the index, by an independent observer without knowledge of plant identity (N=11–17). *p<0.05 in a Mann-Whitney U-test between irPI and WT on May 28 (U=54, p=0.046); the difference on May 15 was not significant (p>0.1). Note that scales differ. Raw data for (B) and (C) is in F7BC_SchumanBarthelBaldwin2012herbivoreDamage2011.xlsx (Dryad: Schuman et al., 2012).
Figure 8
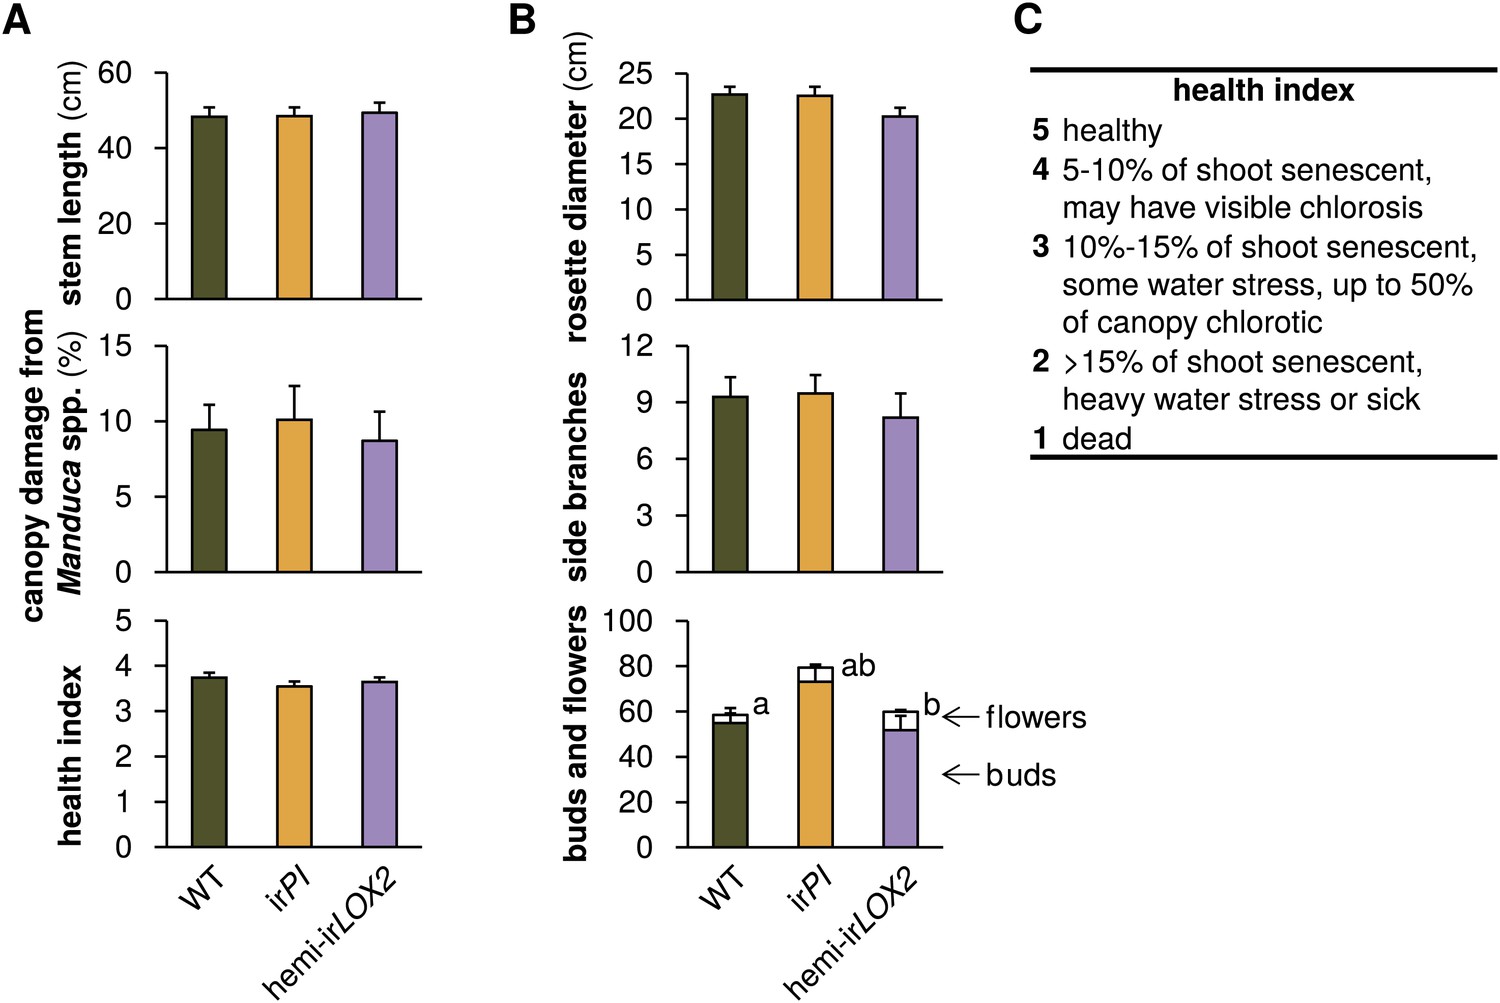
Comparison of plants used in triplets for infestation M4 in 2011 (see Figure 4A); graphs show means+SEM (N=21 plants). (A) Parameters used to match plants in triplets. Measurements and assessments are from the first day of M4. (B) Final measurement of prior growth and reproduction for plants used for triplets; data are from the final two measurements during infestation M3 (see Figure 4A). a, bDifferent letters denote significant differences (p<0.001) for flower number in Scheffe post hoc tests following a MANOVA with all measurements and genotype as the factor (F2,60=8.668, p<0.001). (C) Health index used in (A). For raw data, see F8_SchumanBarthelBaldwin2012triplets.xlsx (Dryad: Schuman et al., 2012).
Figure 9
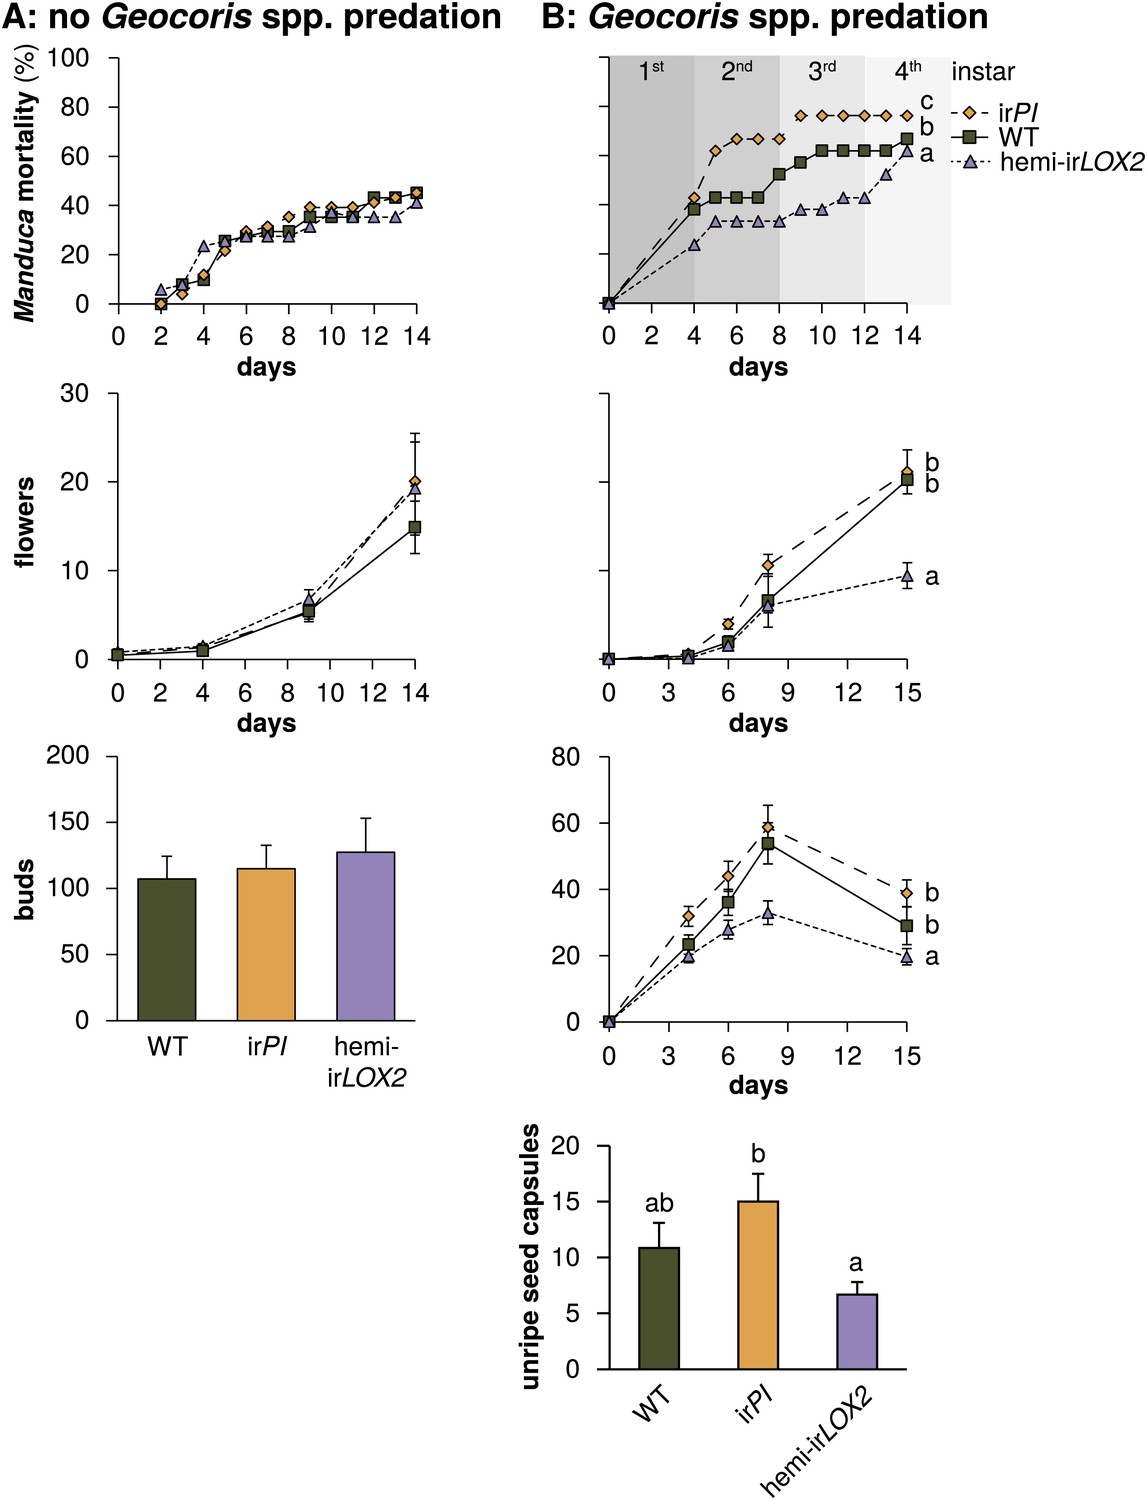
Cumulative mortality of Manduca spp. larvae and numbers of reproductive units produced by infested plants in 2010, in the absence of Geocoris spp. predation, and in 2011, when Geocoris spp. were active predators of Manduca spp. (A) In 2010, flowering plants matched for size (N=17) were each infested with three M. sexta neonates from a laboratory culture (N=51 larvae), which were allowed to reach the final instar on plants. The upper panel shows larva mortality over time, which reached a maximum of 40% by the fifth instar, after 12 days. Flower production (lower panel) did not differ, nor did any other parameters of plant size and reproduction (Figure 6, Table 3) including number of buds produced by June 6, which was day 19 after infestation and day 49 after planting in the field. For raw data, see F9A_SchumanBarthelBaldwin2012data2010.xlsx (Dryad: Schuman et al., 2012). (B) In 2011, plants (N=21) were matched for size, prior reproduction, health, and previous damage by Manduca spp. and other herbivores (Figures 7 and 8) following the end of infestation M3 (Figure 4), and reproductive meristems were removed. Matched plants were infested with one wild Manduca spp. neonate each (M4 in Figure 4), and Manduca spp. larvae were allowed to reach the fourth (penultimate) instar. Larval mortality (upper panel) reached a maximum of 76% after larvae transitioned from the second to third instar (days 9 and 10), at which time larval mortality on hemi-irLOX2 was only half as great as on WT or irPI; larvae beyond this stage are not susceptible to Geocoris spp. (Kessler and Baldwin, 2001). Flower and bud production (lower panel) was twice as great in WT and irPI as in hemi-irLOX2, and numbers of flowers and buds correspond to numbers of seed capsules: hemi-irLOX2 plants also produced fewer unripe seed capsules than WT or irPI plants. For raw data, see F9B_SchumanBarthelBaldwin2012data2011.xlsx (Dryad: Schuman et al., 2012). a, b, c Different letters indicate significant differences (p<0.01) in Bonferroni-corrected pairwise Friedman tests (Manduca spp. mortality), or Scheffe post hoc tests of hemi-irLOX2 versus WT and irPI flowers and buds following a repeated-measures MANOVA over all flower and bud counts shown (results of Greenhouse-Geisser-corrected univariate tests for the interaction of line and day: buds, F4.988,149.653=5.297, p<0.001; flowers, F3.722,111.657=4.403, p=0.003), or significant differences (p<0.05) in Scheffe post hoc tests following an ANOVA for unripe seed capsules at day 15 with genotype as the factor (F2,60=4.142, P=0.021).
Figure 10
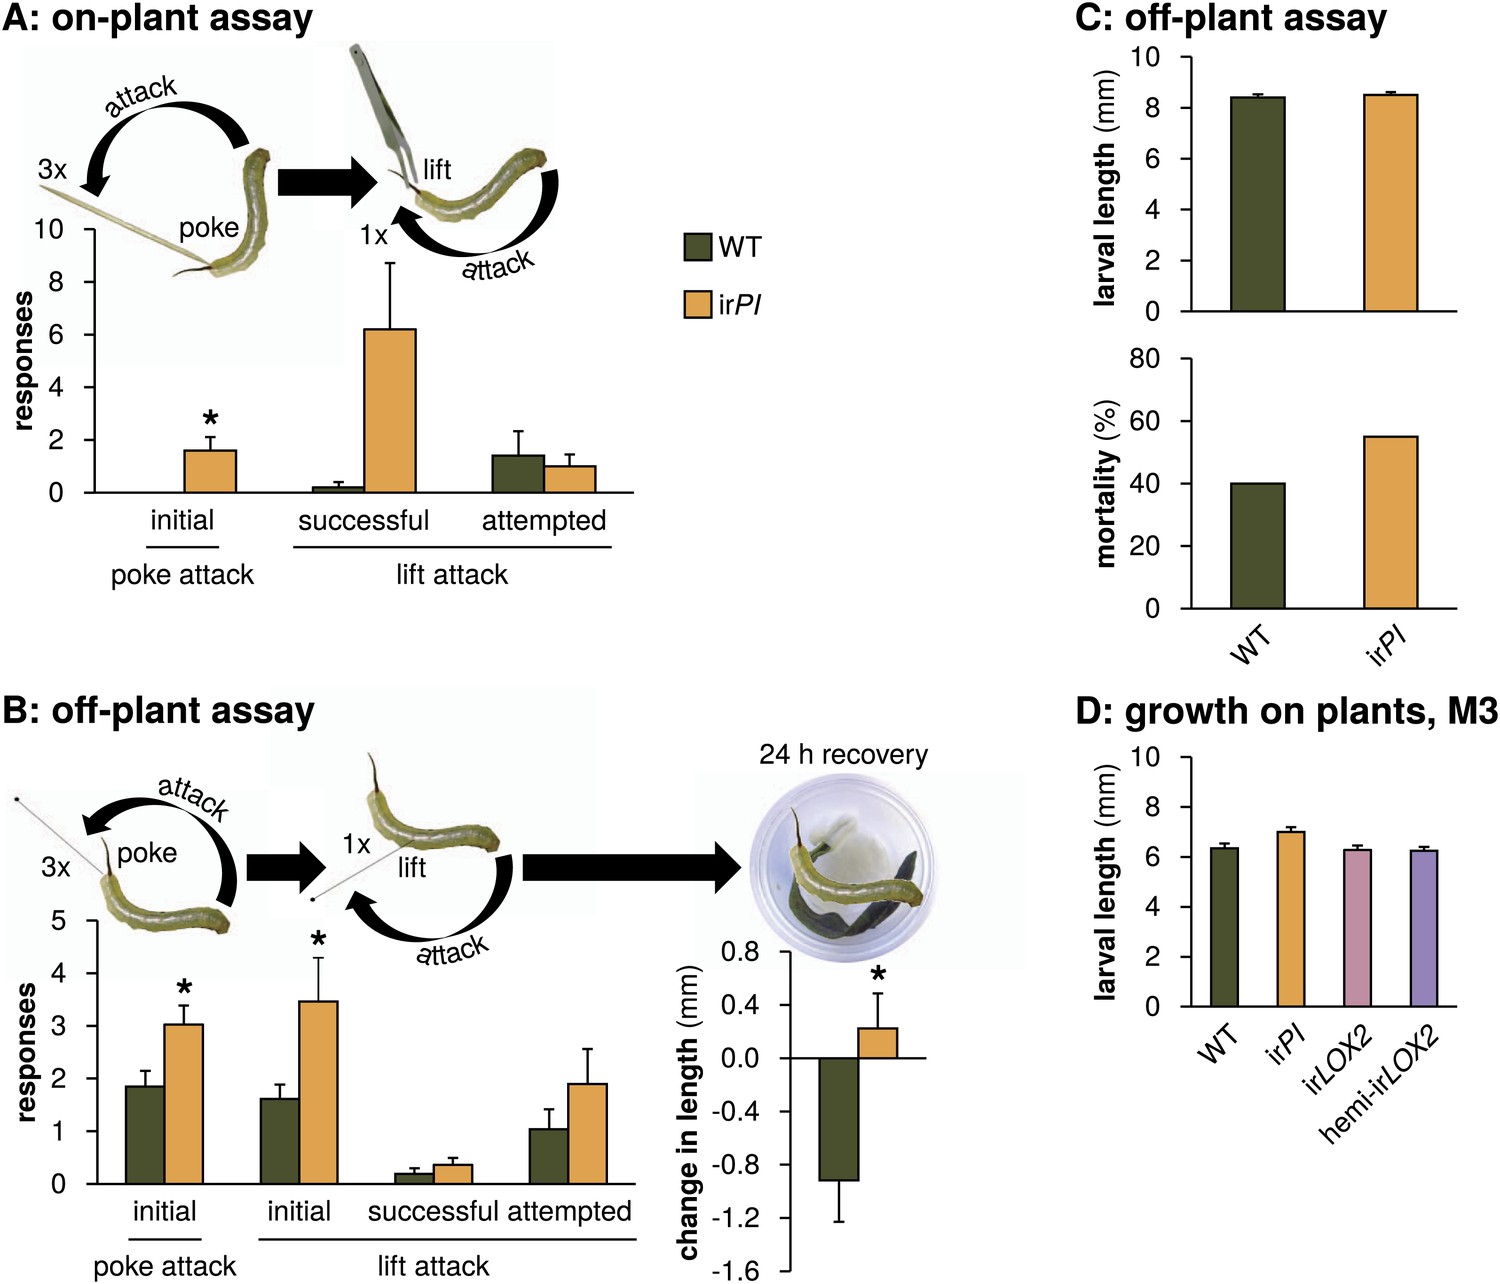
Mock Geocoris spp. predation assays with Manduca spp. larvae fed on WT or irPI plants. (A) Response of wild Manduca spp. (Figure 4A) on plants in the field to poking with a toothpick and lifting with a featherweight forceps (N=5 second-instar larvae matched for size). We first poked larvae below the horn three times, 3 s apart, with the end of a toothpick and counted how often they attacked the toothpick, defined as the larva whipping its head around toward the toothpick and making contact. We then lifted larvae from the plant using the forceps and counted how often they attempted to attack, or succeeded in attacking the forceps over 15 s. In an attempted attack, the larvae moved from hanging at a 180° angle below the forceps vertically toward the forceps; and in a successful attack, the front end of the larva made contact with the forceps, before returning to its original position. All individuals were recorded and responses were counted from videos (see Videos 1 and 2). *p<0.05 in a paired t-test. (B) Left, response of M. sexta from a laboratory strain raised for 48 hr in boxes on either WT or irPI leaf tissue (N=20 first-instar larvae matched for size) to being poked, pierced and lifted with an insect pin. Right, growth of larvae in the following 24 hr. The procedure was identical to that for the on-plant assay described above, except that larvae were poked with an insect pin rather than a toothpick, and then pierced in the rear flank and lifted with the same insect pin (see Videos 3 and 4). *p<0.05 in a paired t-test. The length of each larva was measured prior to poking and lifting. Afterward, larvae were placed in individual cups, each with a moist paper towel round and fresh WT or irPI leaf tissue, and length of the larvae in millimeters was again measured after 24 hr; mortality did not differ between WT- and irPI-fed larvae. *p<0.05 in a Student's t-test. (C) Upper panel, length of first instar larvae fed for 2 days on WT or irPI tissue and size-matched for use in the off-plant behavioral assay mimicking Geocoris attack (B); lower panel, mortality of first instar larvae 24 hr after mock Geocoris attack as described in (B). Mortality was not significantly different in a Fisher's exact test. (D) Larval length in the first instar after 2 days on plants in the field: larvae on irPI were not significantly larger. Length of surviving larvae was measured in a predation assay during infestation M3 (Figures 4 and 5C), N=13–26 larvae. Length was not significantly different for larvae feeding on irPI in a one-way ANOVA with genotype as the factor (F3,77=2.792, p=0.046, all post-hoc tests p>0.05). For raw data, see F10_SchumanBarthelBaldwin2012Manduca.xlsx (Dryad: Schuman et al., 2012).
Videos
Video 1
On-plant assay, plant 7u, WT, June 18, 2011.
Video 2
On-plant assay, plant 2o, irPI, June 18, 2011.
Video 3
Off-plant assay, replicate 3, WT, June 24, 2011.
Video 4
Off-plant assay, replicate 3, irPI, June 24, 2011.
Tables
Table 1
GLV mix used to externally supplement plant GLV emission in M2 (see Figure 4) (Allmann and Baldwin, 2010)
| Component | Nanogram/20 μL lanolin |
| (Z)-hex-3-enal | 3530 |
| (E)-hex-2-enal | 2690 |
| (Z)-hex-3-en-1-ol | 1780 |
| (E)-hex-2-en-1-ol | 2440 |
| (Z)-hex-3-enyl acetate | 46.6 |
| (E)-hex-2-enyl acetate | 35.5 |
| (Z)-hex-3-enyl propanoate | 9.00 |
| (E)-hex-2-enyl propanoate | 8.08 |
| (Z)-hex-3-enyl butanoate | 97.0 |
| (E)-hex-2-enyl butanoate | 35.6 |
-
Pure GLVs were diluted in 1 mL of hexane and mixed into 14 mL of lanolin to yield the amount shown per 20 μL, representing the emission per g leaf material within the first 20 minutes of W+OS elicitation. Lanolin containing an equivalent amount of hexane was used as a control.
Table 2
Numbers (N) of Geocoris spp. individuals (nymphs and adults) within 5 cm radii around plants used for predation experiments, counted within half an hour during the main period of Geocoris spp. activity
| Experiment | Genotype | Geocoris spp. per day (n) | Plants (n) | ||||
| Larval predation | Dates | May | 21 | 22 | |||
| May 21–23, 2011 | WT | 3 | 4 | 19 | |||
| irPI | 6 | 6 | 24 | ||||
| irLOX2 | 6 | 4 | 20 | ||||
| hemi-irLOX2 | 8 | 2 | 20 | ||||
| Total | 23 | 16 | 83 | ||||
| Egg predation | Dates | June | 3 | 4 | 5 | 7 | |
| June 2–6, 2011 | WT | 2 | 5 | 2 | 1 | 18 | |
| irPI | 3 | 7 | 1 | 5 | 21 | ||
| irLOX2 | 4 | 2 | 0 | 3 | 21 | ||
| hemi-irLOX2 | 1 | 1 | 2 | 2 | 24 | ||
| Total | 10 | 15 | 5 | 11 | 84 | ||
-
Numbers are shown as subtotals for each plant genotype and grand totals per day (in bold).
Table 3
Results of Mann–Whitney U-tests, Kruskal–Wallis tests, and ANOVAs for control vs M. sexta-infested plants of each genotype grown in the field in 2010 and 2011 (Figures 6 and 9)
| 2010 | Branches | Stem, buds, flowers | |||||||||||||||||
| Mann–Whitney, Kruskal–Wallis | MANOVA, Wilks' lambda | ||||||||||||||||||
| Comparison | Genotype | df | χ2 | p* | df | F | p | ||||||||||||
| Treatment | All | 1 | 0.022 | 1.000 | 3, 148 | 0.463 | 0.709 | ||||||||||||
| Genotype | All | 3 | 2.909 | 0.802 | 9, 360.344 | 1.186 | 0.303 | ||||||||||||
| Branches (n) | Rosette diameter (cm) | Stem length (cm) | Buds (n) | Flowers (n) | |||||||||||||||
| 2011 | Student's t-test | Student's t-test | MANOVA, Wilks' lambda | MANOVA, Wilks' lambda | MANOVA, Wilks' lambda | ||||||||||||||
| Comparison | Genotype | df | t | p | df | t | p | df | F | p | df | F | p | df | F | p | |||
| Treatment×time | WT | 26 | 1.696 | 0.102 | 26 | −0.870 | 0.932 | 5, 22 | 3.871 | 0.011 | 5, 22 | 3.188 | 0.026 | 3, 24 | 1.213 | 0.326 | |||
| irPI | 26 | 1.024 | 0.315 | 26 | −0.161 | 0.873 | 5, 22 | 0.991 | 0.446 | 5, 22 | 0.656 | 0.660 | 5, 22 | 0.525 | 0.755 | ||||
| irLOX2 | 25 | 1.112 | 0.277 | 25 | −0.058 | 0.954 | 5, 21 | 0.606 | 0.696 | 5, 21 | 0.535 | 0.748 | 5, 21 | 0.540 | 0.744 | ||||
| hemi-irLOX2 | 22 | 1.753 | 0.094 | 22 | 1.140 | 0.267 | 5, 18 | 1.118 | 0.386 | 5, 18 | 3.001 | 0.038 | 4, 19 | 0.723 | 0.587 | ||||
-
2010: Numbers of side branches (Mann–Whitney, Kruskal–Wallis), stem length, and final numbers of buds and flowers (MANOVA) were recorded in a single measurement at the end of M1 (Figure 4). Numbers of newly produced flowers were counted repeatedly upon flower removal, and Wilks' Lambda F values for the main effect of M. sexta feeding are shown from repeated-measures ANOVAs across all measurements; Wilks' F values for the M. sexta-by-time interaction were not significant. * Bonferroni-corrected p-values.
-
2011: Because many plants had few or no side branches before the final measurement, and rosette diameters did not change over the period that plants were measured, t-tests are shown for the final measurement of these parameters in M3 (Figure 4). For stem lengths, numbers (n) of buds, and numbers of flowers, Wilks' lambda F values for the M. sexta-by-time interaction are shown from repeated-measures ANOVAs across all measurements. Significant p-values are given in bold.
Table 4
Primers used for quantitative PCR (SYBR Green)
| Gene | Forward primer sequence (5′-3′) | Reverse primer sequence (5′-3′) | Citation |
| PI | TCAGGAGATAGTAAATATGG | ATCTGCATGTTCCACATTGC | Fragoso et al. (2011) |
| LOX2 | TTGCACTTGGTGTTTGAGATGGT | TTAGTAGAAAATGAGCACCACAA | Kallenbach et al. (2010) |
Download links
A two-part list of links to download the article, or parts of the article, in various formats.
Downloads (link to download the article as PDF)
Open citations (links to open the citations from this article in various online reference manager services)
Cite this article (links to download the citations from this article in formats compatible with various reference manager tools)
Herbivory-induced volatiles function as defenses increasing fitness of the native plant Nicotiana attenuata in nature
eLife 1:e00007.
https://doi.org/10.7554/eLife.00007


