Cytoplasmic genetic variation and extensive cytonuclear interactions influence natural variation in the metabolome
- University of California, Davis, United States
- University of Copenhagen, Denmark
Figures
Figure 1
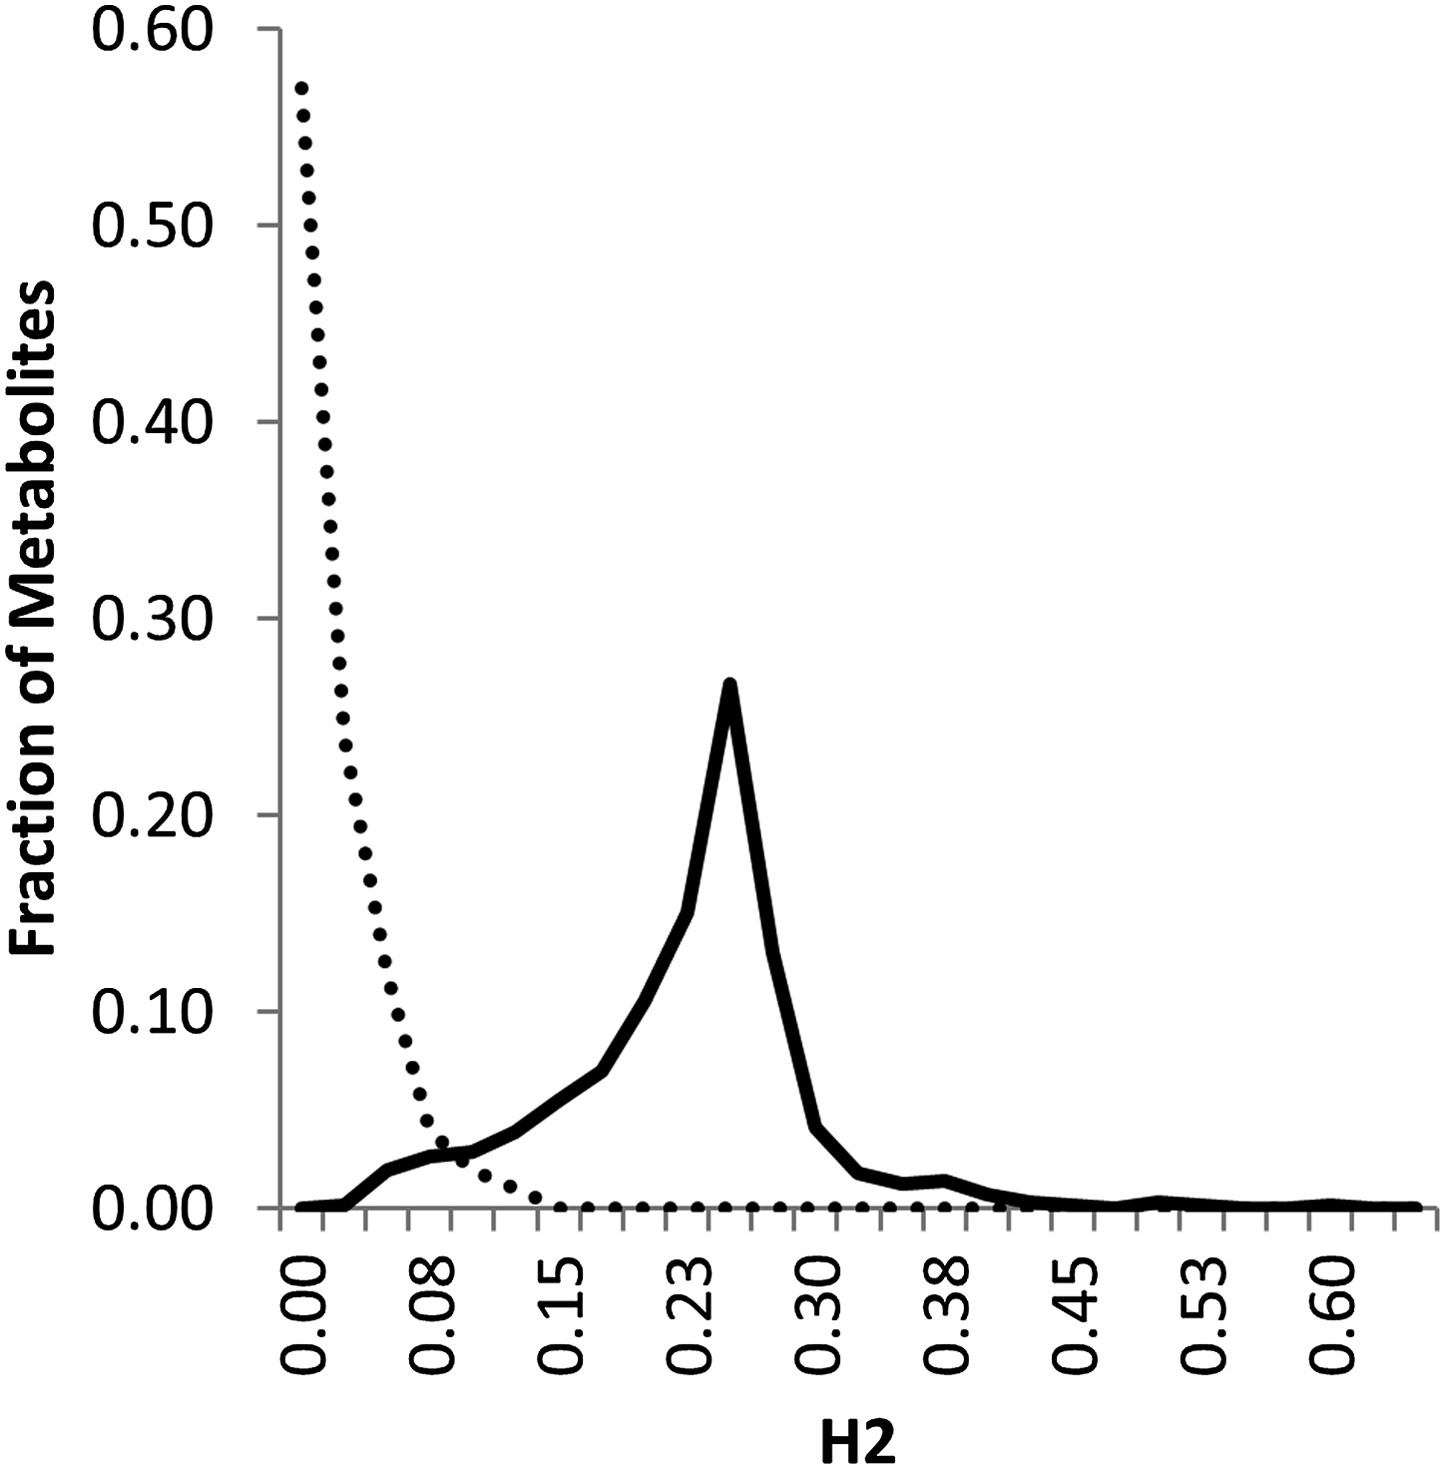
Line estimation of heritability in nuclear and organellar genomes.
We compared the estimated metabolite heritability’s due to nuclear (solid line) and organelle (dashed line) variation across the lines of the Kas × Tsu (black) RIL populations. Shown are frequency plots of heritability and for each class, the bin size is 5% for the frequency plots.
-
Figure 1—source data 1
Heritability.
Results of the ANOVA model (Model I) for metabolic variance in the experiment are shown by metabolite.
- https://doi.org/10.7554/eLife.00776.004
-
Figure 1—source data 2
Means.
All metabolic mean accumulation is shown by line and subpopulation.
- https://doi.org/10.7554/eLife.00776.005
Figure 2
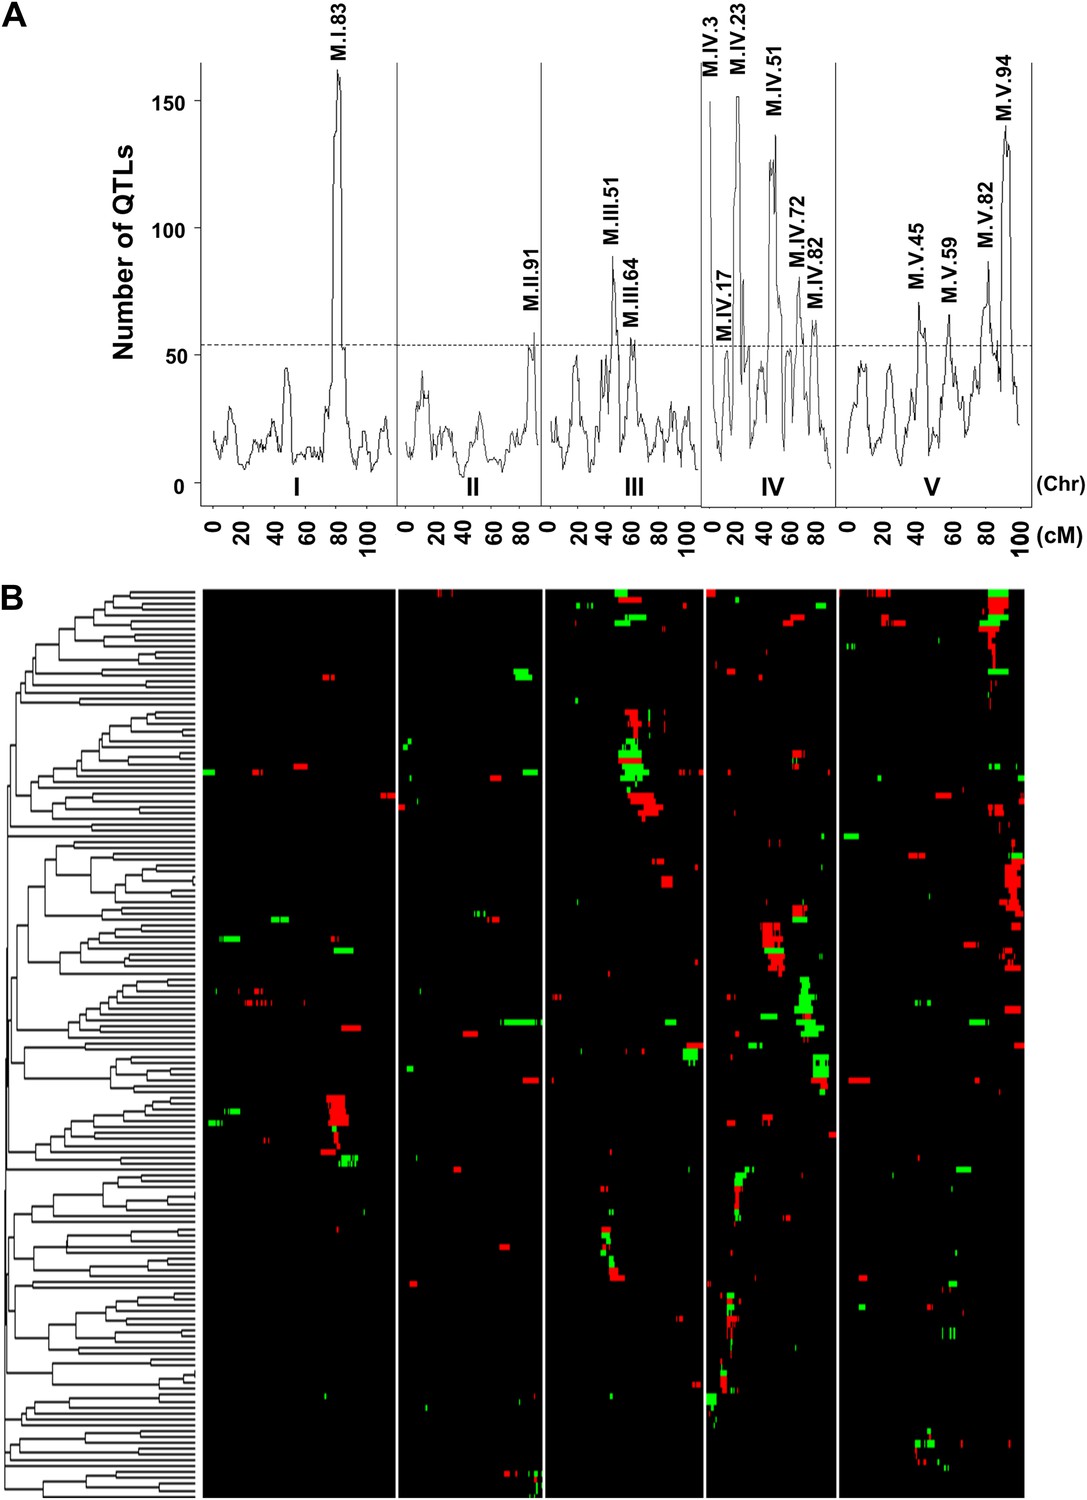
Genetic architecture of metabolite QTLs across the Kas × Tsu genome.
(A) The number of metabolites for which a QTL was detected within a 5 cM sliding window is plotted against the genetic location of the metabolite QTLs in cM. The permuted threshold (p=0.05) for detection of a significant metabolite hotspot is 54 QTLs. The graph is scaled to match part (B). Hotspots are labeled above the respective locus with the chromosome and cM. (B) Heat map showing the location and effect of significant QTLs detected for average metabolite accumulation across the five chromosomes. Red indicates a positive effect of the Kas allele, while green indicates a positive effect of the Tsu allele. Vertical white lines separate the chromosomes (I to V from left to right). Clustering on the left is based on the absolute Pearson correlation of QTL effects across all significant loci for each metabolite. Only metabolites with two or more QTLs were plotted.
-
Figure 2—source data 1
QTL Lists.
The location and effect of all metabolic QTLs identified from the CIM model are presented.
- https://doi.org/10.7554/eLife.00776.007
Figure 3 with 12 supplements
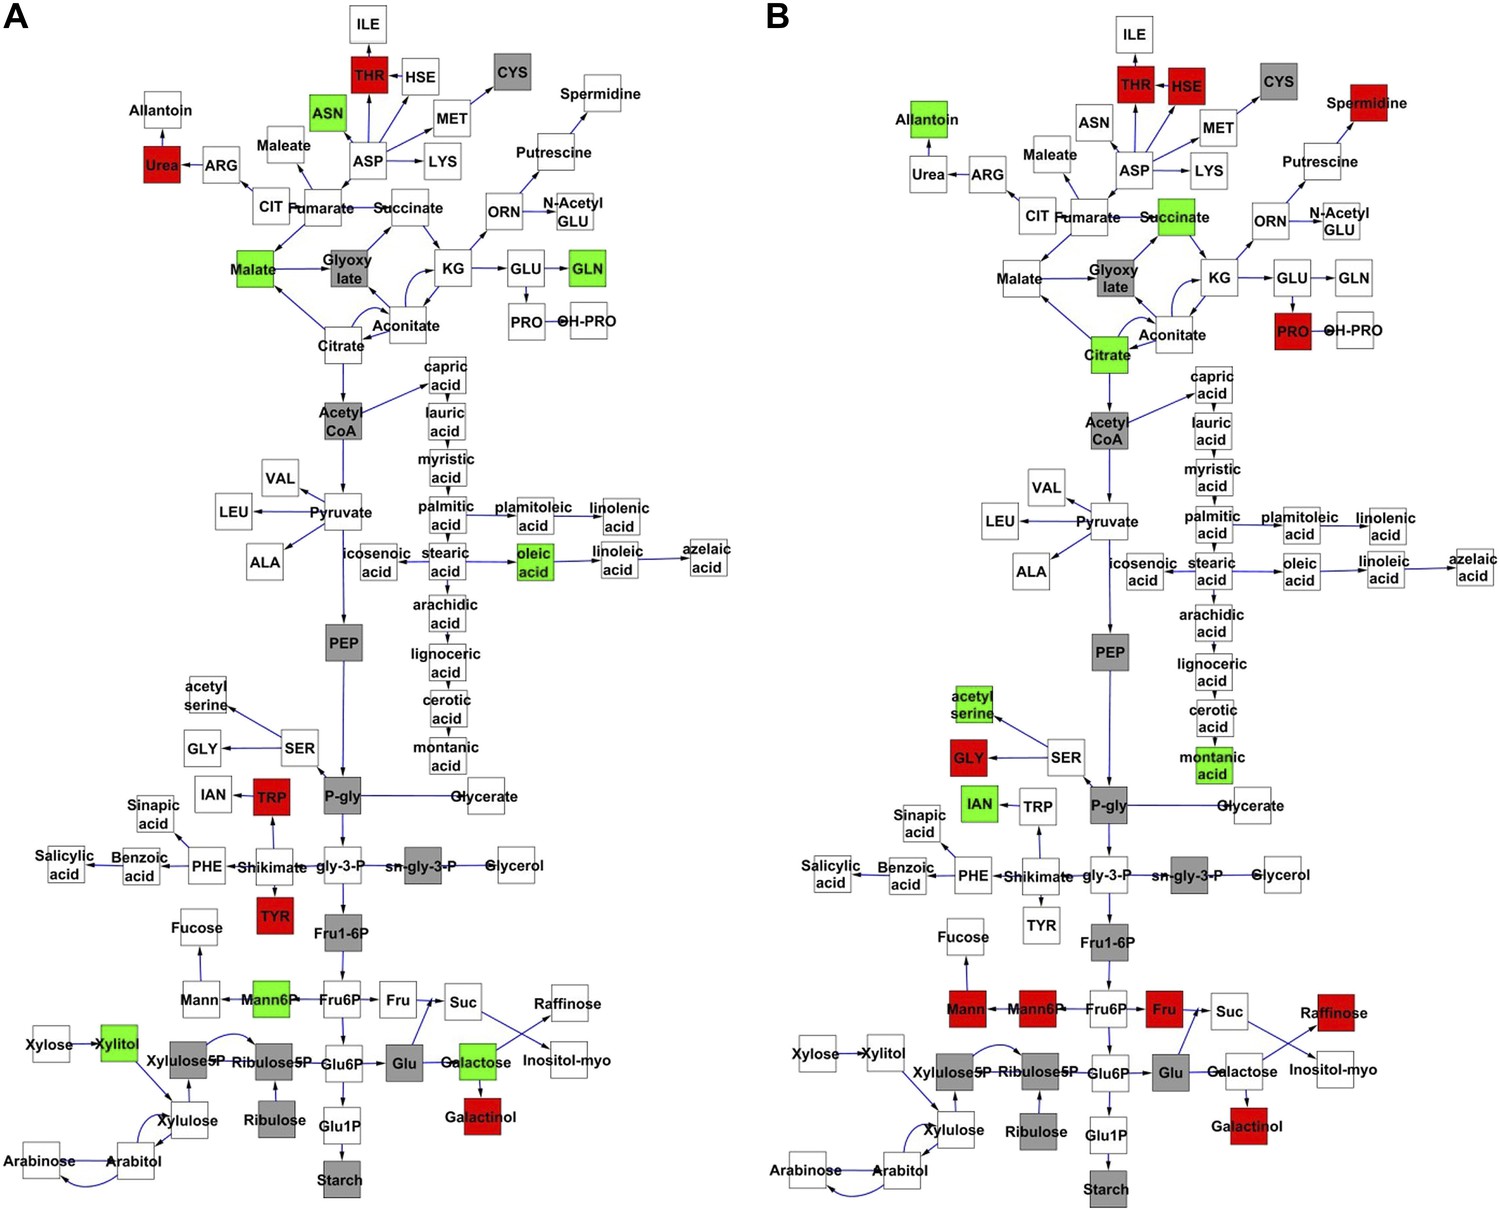
Metabolomic consequence of variation at nuclear loci.
A map of central metabolism was created in cytoscape and this was used to plot the estimated allele effect of genetic variation at nuclear loci. A red box shows increased metabolite accumulation when the line contains the Kas allele at the nuclear locus while green shows increased metabolite accumulation when the line contains the Tsu allele at the nuclear locus. White boxes are metabolites that were detected but not significantly influenced by the cytoplasmic genome and gray boxes are metabolites that were not detected. The two loci shown are those that had the most metabolites affected within the metabolic map. All other nuclear loci are plotted in Figure 3—figure supplements 1–12. (A) Estimated allele effects of the M.V.59 hotspot. (B) Estimated allele effects of the M.I.83 hotspot.
-
Figure 3—source data 1
Single marker ANOVA.
p values for main effect model of metabolic QTL variance using hotspot markers
- https://doi.org/10.7554/eLife.00776.009
Figure 3—figure supplement 1
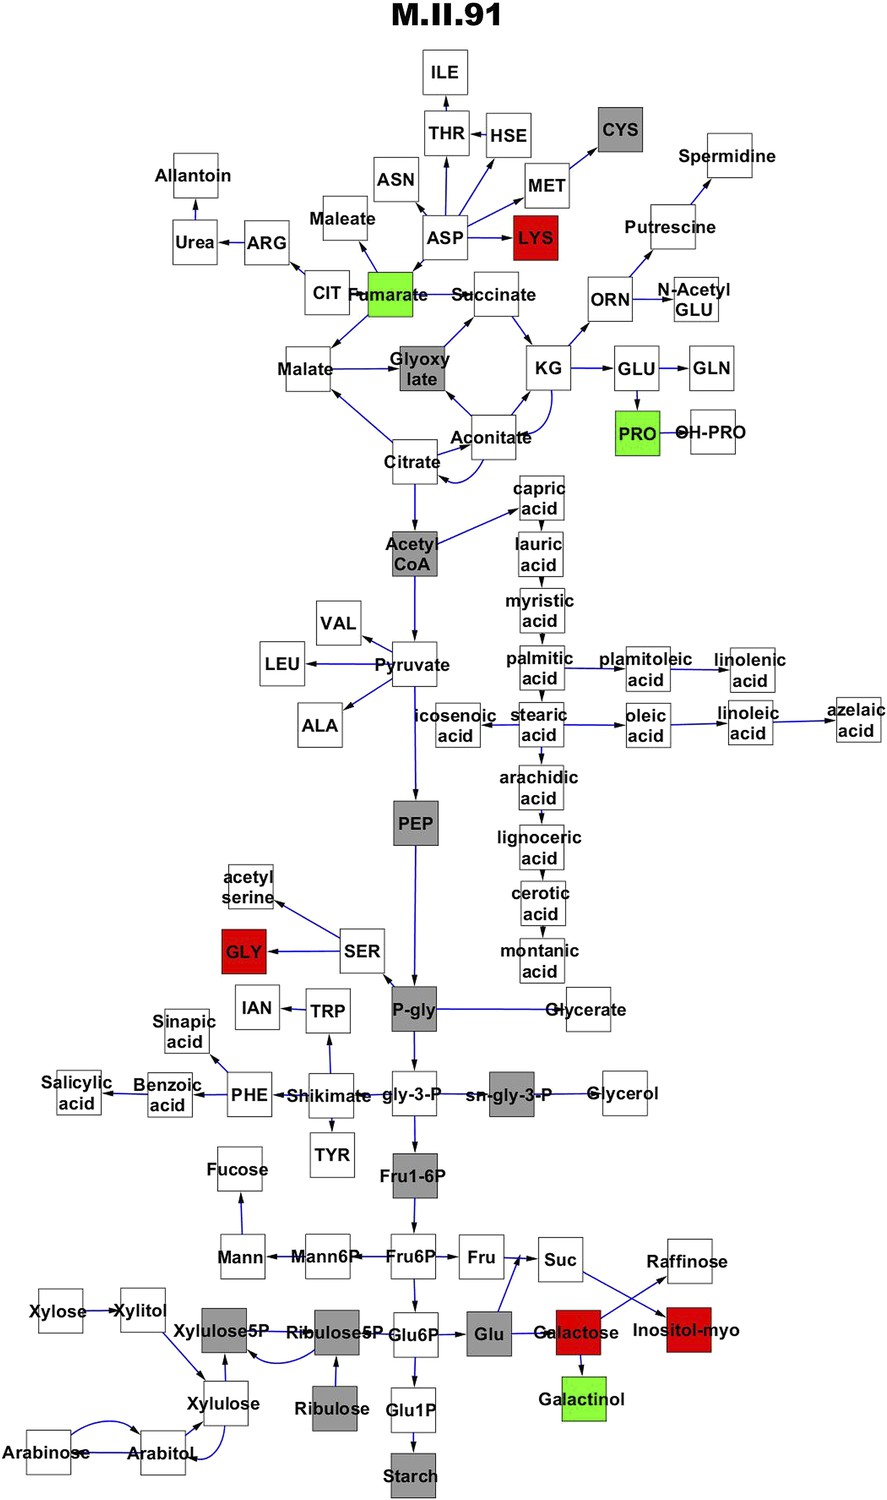
Metabolomic consequence of variation at nuclear locus M.II.91.
A map of central metabolism was created in cytoscape and this was used to plot the estimated allele effect of genetic variation at each nuclear hotspot locus. A red box shows increased metabolite accumulation when the line contains the Kas allele at the nuclear locus while green shows increased metabolite accumulation when the line contains the Tsu allele at the nuclear locus. White boxes are metabolites that were detected but not significantly influenced by the locus and gray boxes are metabolites that were not detected. The specific hotspot metabolomic QTL locus is listed at the top of the page using the nomenclature shown in Figure 2A.
Figure 3—figure supplement 2
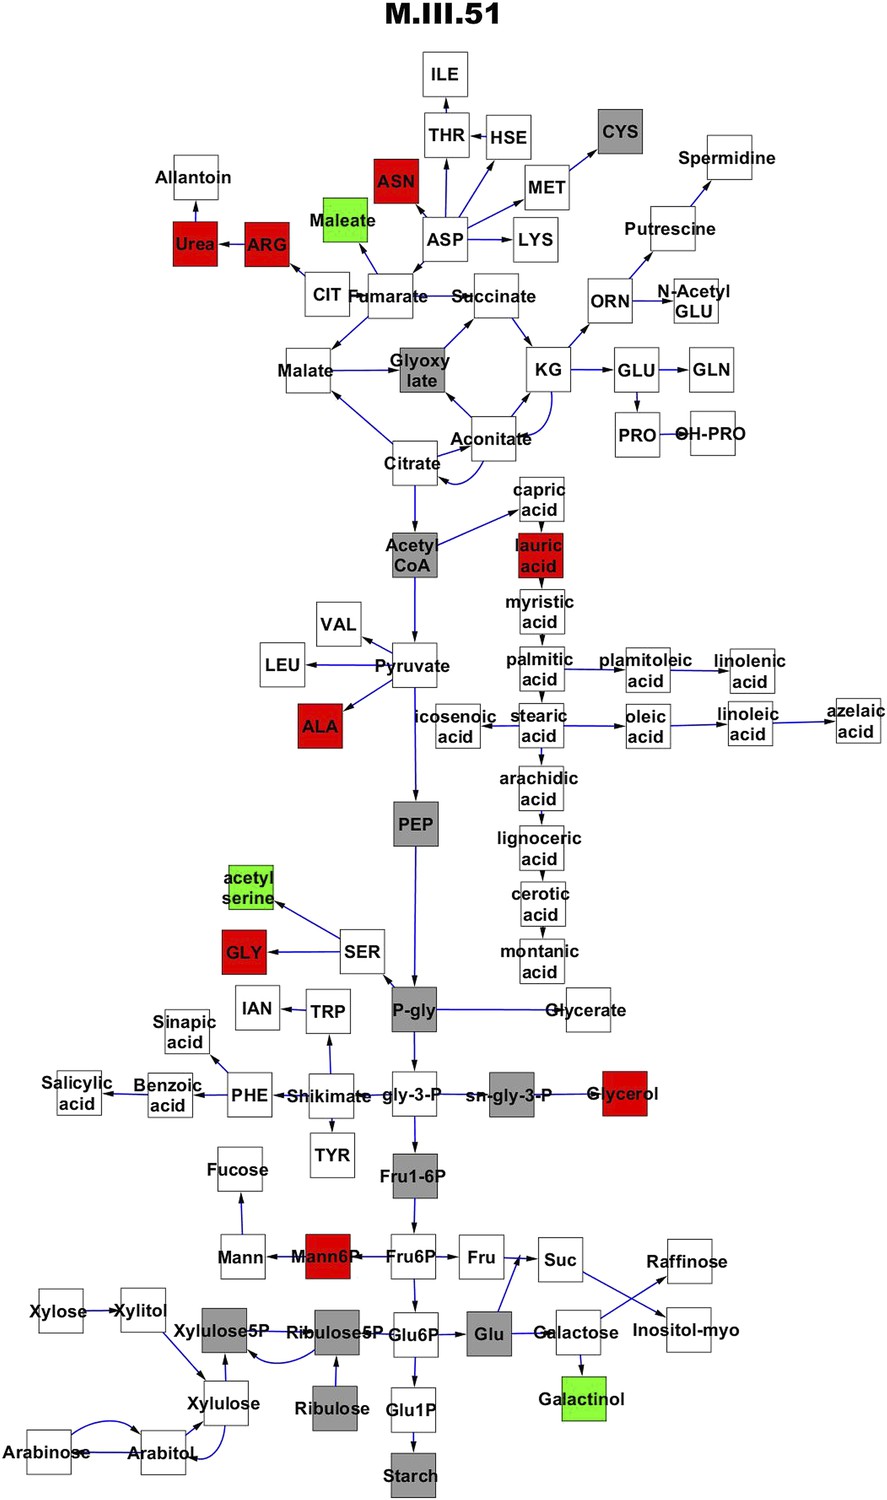
Metabolomic consequence of variation at nuclear locus M.III.51.
A map of central metabolism was created in cytoscape and this was used to plot the estimated allele effect of genetic variation at each nuclear hotspot locus. A red box shows increased metabolite accumulation when the line contains the Kas allele at the nuclear locus while green shows increased metabolite accumulation when the line contains the Tsu allele at the nuclear locus. White boxes are metabolites that were detected but not significantly influenced by the locus and gray boxes are metabolites that were not detected. The specific hotspot metabolomic QTL locus is listed at the top of the page using the nomenclature shown in Figure 2A.
Figure 3—figure supplement 3
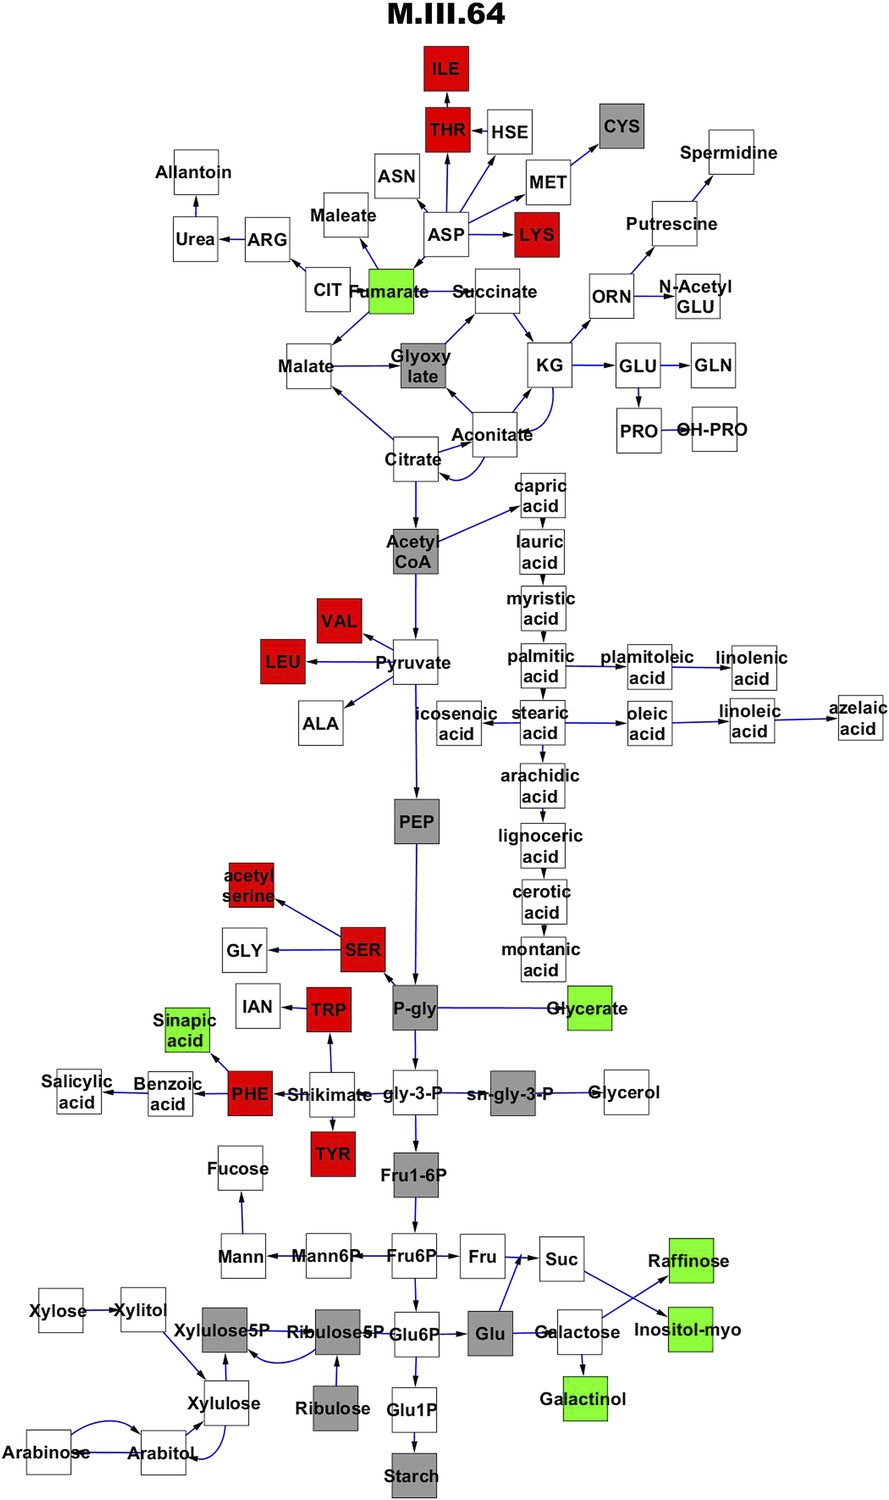
Metabolomic consequence of variation at nuclear locus M.III.64.
A map of central metabolism was created in cytoscape and this was used to plot the estimated allele effect of genetic variation at each nuclear hotspot locus. A red box shows increased metabolite accumulation when the line contains the Kas allele at the nuclear locus while green shows increased metabolite accumulation when the line contains the Tsu allele at the nuclear locus. White boxes are metabolites that were detected but not significantly influenced by the locus and gray boxes are metabolites that were not detected. The specific hotspot metabolomic QTL locus is listed at the top of the page using the nomenclature shown in Figure 2A.
Figure 3—figure supplement 4
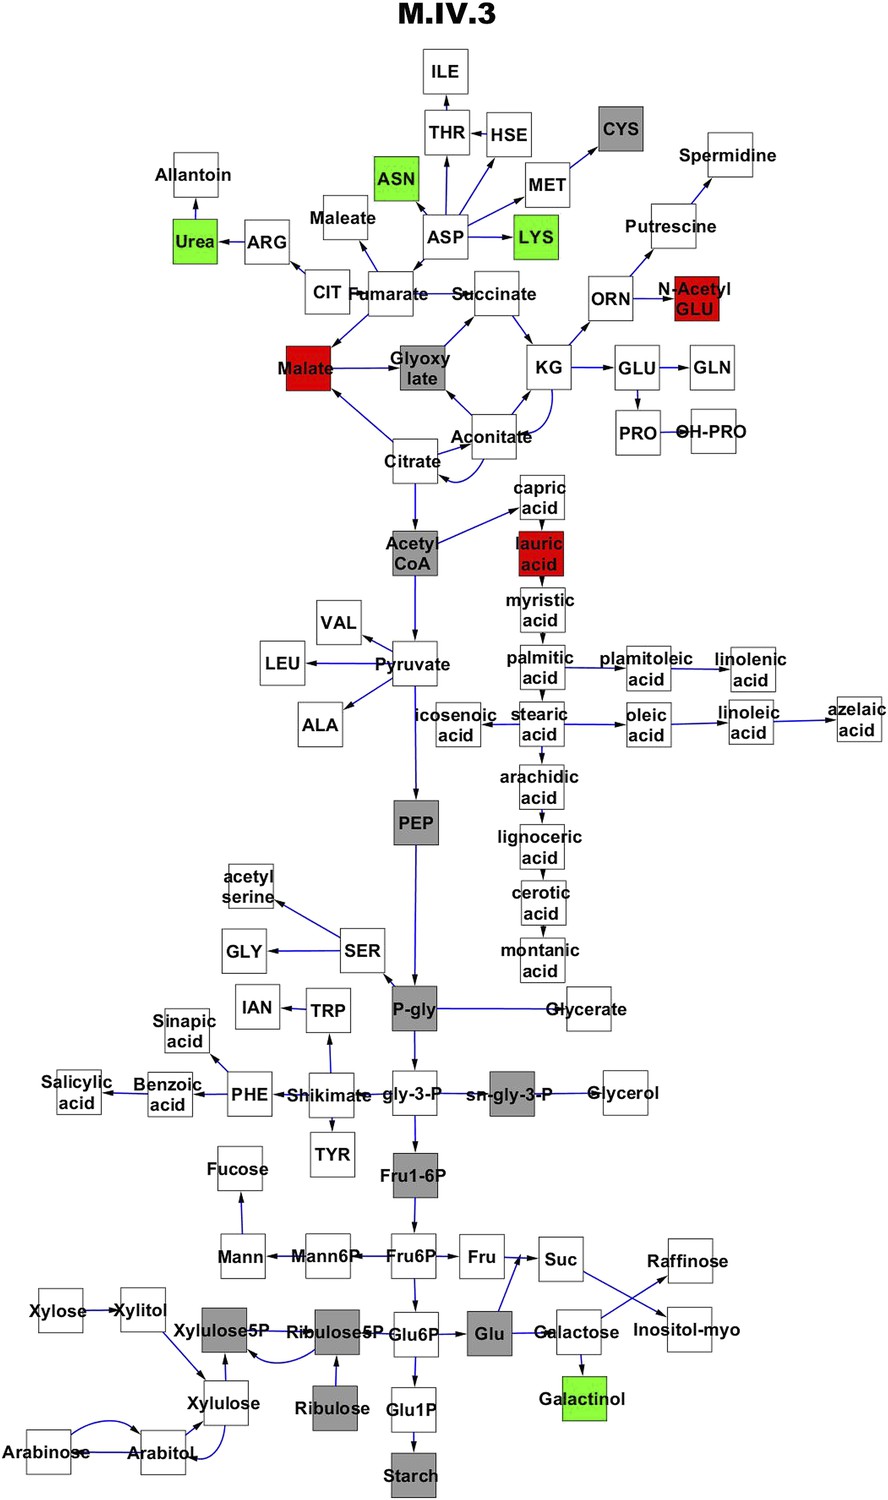
Metabolomic consequence of variation at nuclear locus M.IV.3.
A map of central metabolism was created in cytoscape and this was used to plot the estimated allele effect of genetic variation at each nuclear hotspot locus. A red box shows increased metabolite accumulation when the line contains the Kas allele at the nuclear locus while green shows increased metabolite accumulation when the line contains the Tsu allele at the nuclear locus. White boxes are metabolites that were detected but not significantly influenced by the locus and gray boxes are metabolites that were not detected. The specific hotspot metabolomic QTL locus is listed at the top of the page using the nomenclature shown in Figure 2A.
Figure 3—figure supplement 5
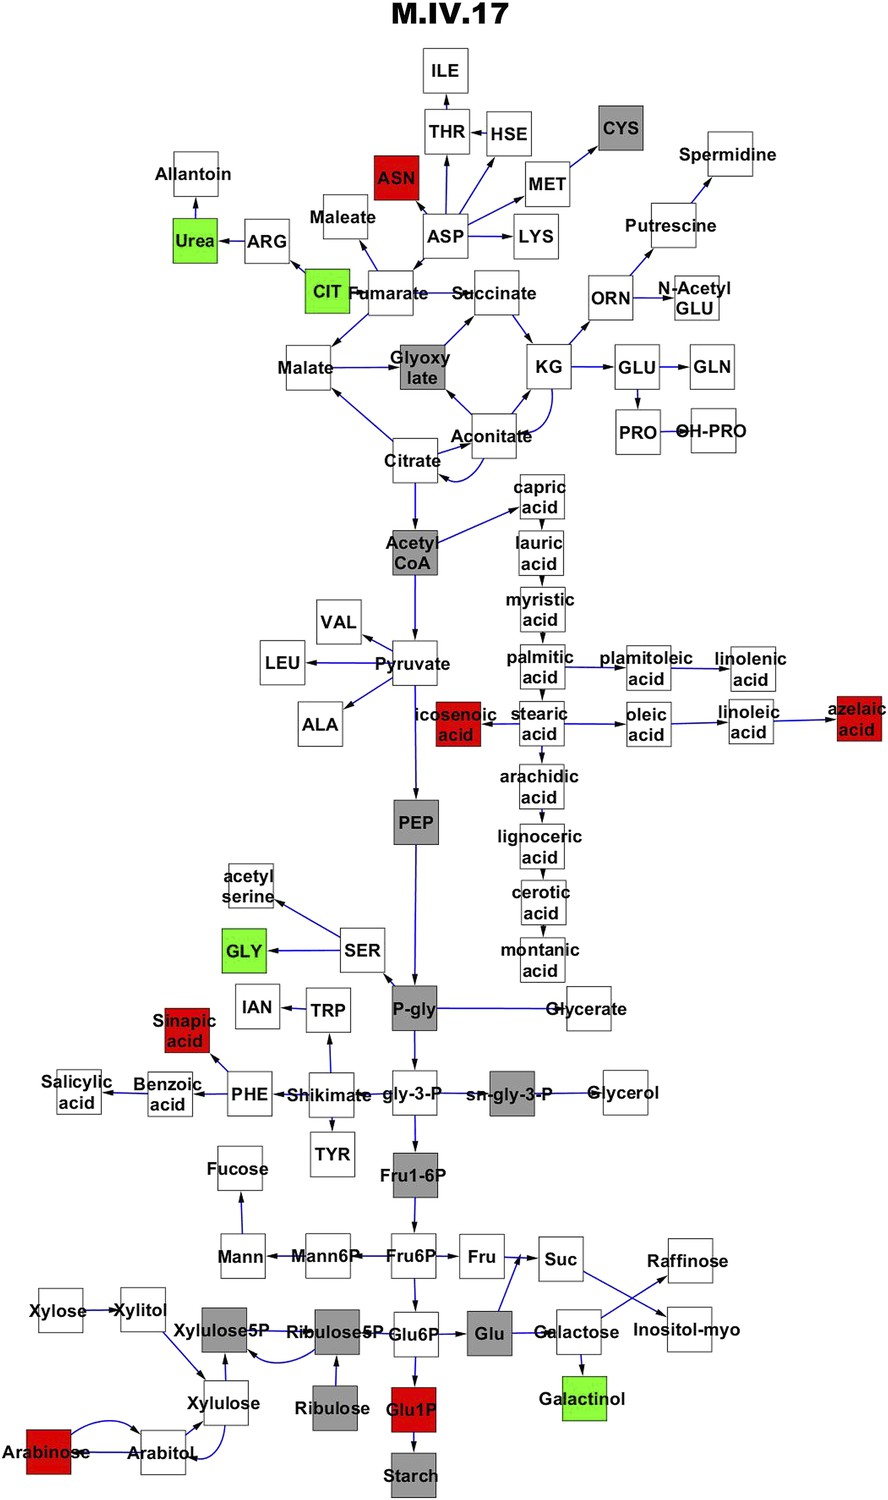
Metabolomic consequence of variation at nuclear locus M.IV.17.
A map of central metabolism was created in cytoscape and this was used to plot the estimated allele effect of genetic variation at each nuclear hotspot locus. A red box shows increased metabolite accumulation when the line contains the Kas allele at the nuclear locus while green shows increased metabolite accumulation when the line contains the Tsu allele at the nuclear locus. White boxes are metabolites that were detected but not significantly influenced by the locus and gray boxes are metabolites that were not detected. The specific hotspot metabolomic QTL locus is listed at the top of the page using the nomenclature shown in Figure 2A.
Figure 3—figure supplement 6
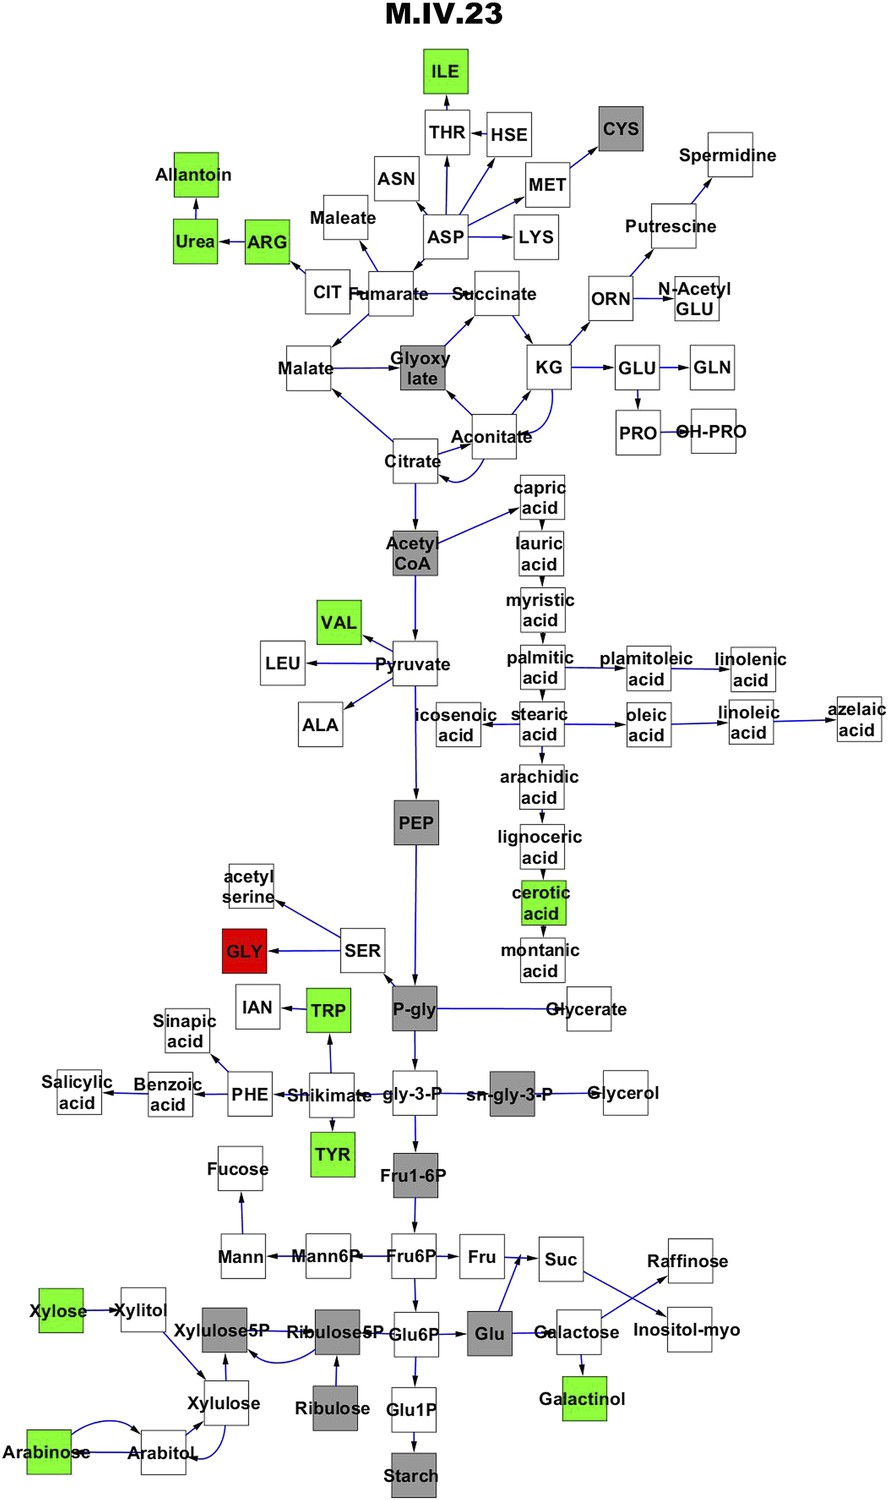
Metabolomic consequence of variation at nuclear locus M.IV.23.
A map of central metabolism was created in cytoscape and this was used to plot the estimated allele effect of genetic variation at each nuclear hotspot locus. A red box shows increased metabolite accumulation when the line contains the Kas allele at the nuclear locus while green shows increased metabolite accumulation when the line contains the Tsu allele at the nuclear locus. White boxes are metabolites that were detected but not significantly influenced by the locus and gray boxes are metabolites that were not detected. The specific hotspot metabolomic QTL locus is listed at the top of the page using the nomenclature shown in Figure 2A.
Figure 3—figure supplement 7
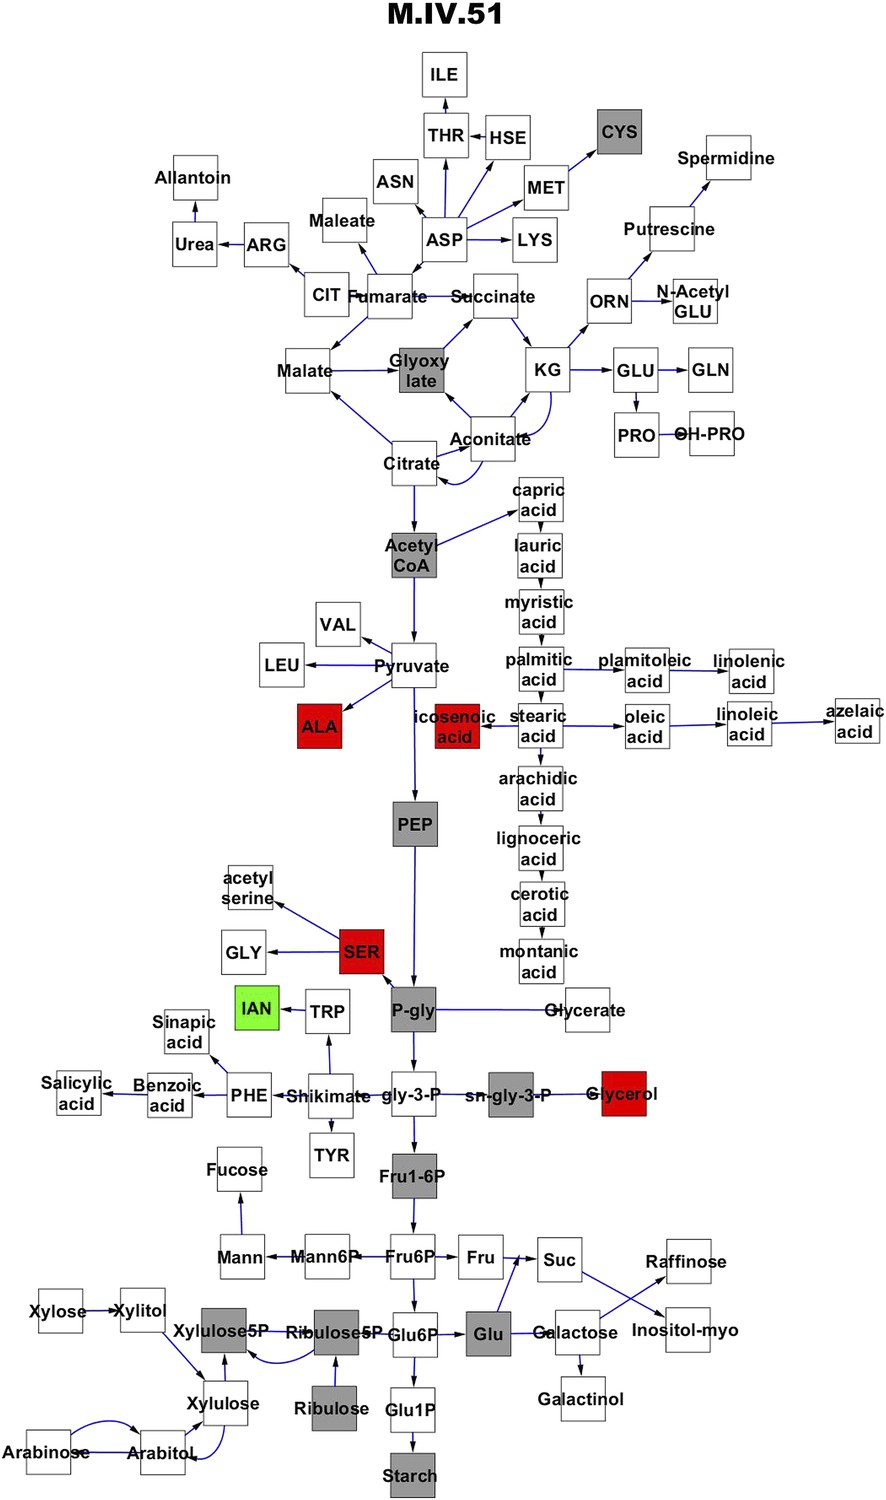
Metabolomic consequence of variation at nuclear locus M.IV.51.
A map of central metabolism was created in cytoscape and this was used to plot the estimated allele effect of genetic variation at each nuclear hotspot locus. A red box shows increased metabolite accumulation when the line contains the Kas allele at the nuclear locus while green shows increased metabolite accumulation when the line contains the Tsu allele at the nuclear locus. White boxes are metabolites that were detected but not significantly influenced by the locus and gray boxes are metabolites that were not detected. The specific hotspot metabolomic QTL locus is listed at the top of the page using the nomenclature shown in Figure 2A.
Figure 3—figure supplement 8
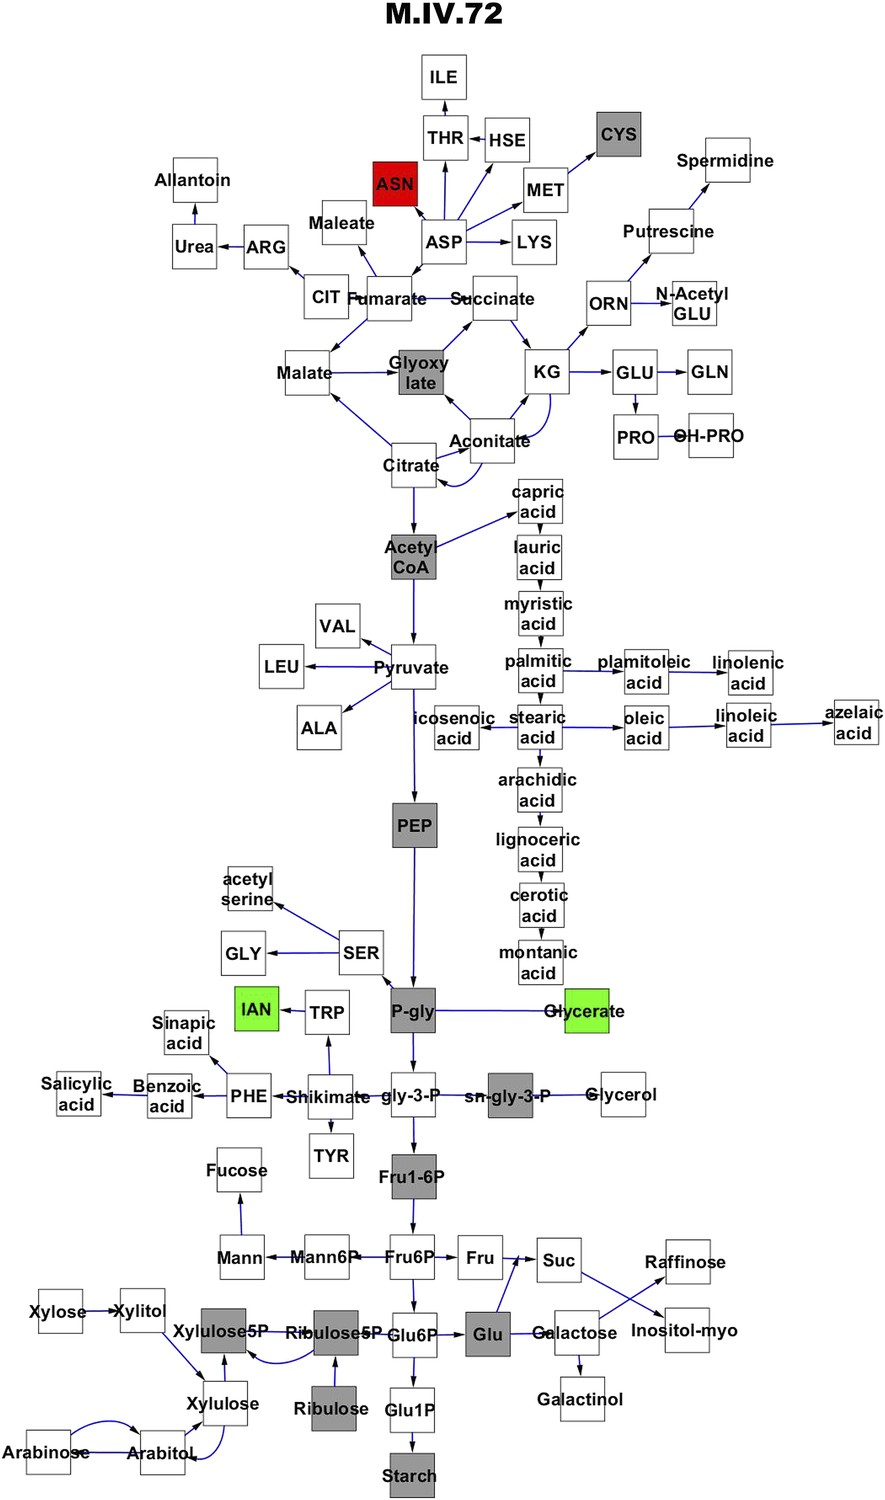
Metabolomic consequence of variation at nuclear locus M.IV.72.
A map of central metabolism was created in cytoscape and this was used to plot the estimated allele effect of genetic variation at each nuclear hotspot locus. A red box shows increased metabolite accumulation when the line contains the Kas allele at the nuclear locus while green shows increased metabolite accumulation when the line contains the Tsu allele at the nuclear locus. White boxes are metabolites that were detected but not significantly influenced by the locus and gray boxes are metabolites that were not detected. The specific hotspot metabolomic QTL locus is listed at the top of the page using the nomenclature shown in Figure 2A.
Figure 3—figure supplement 9
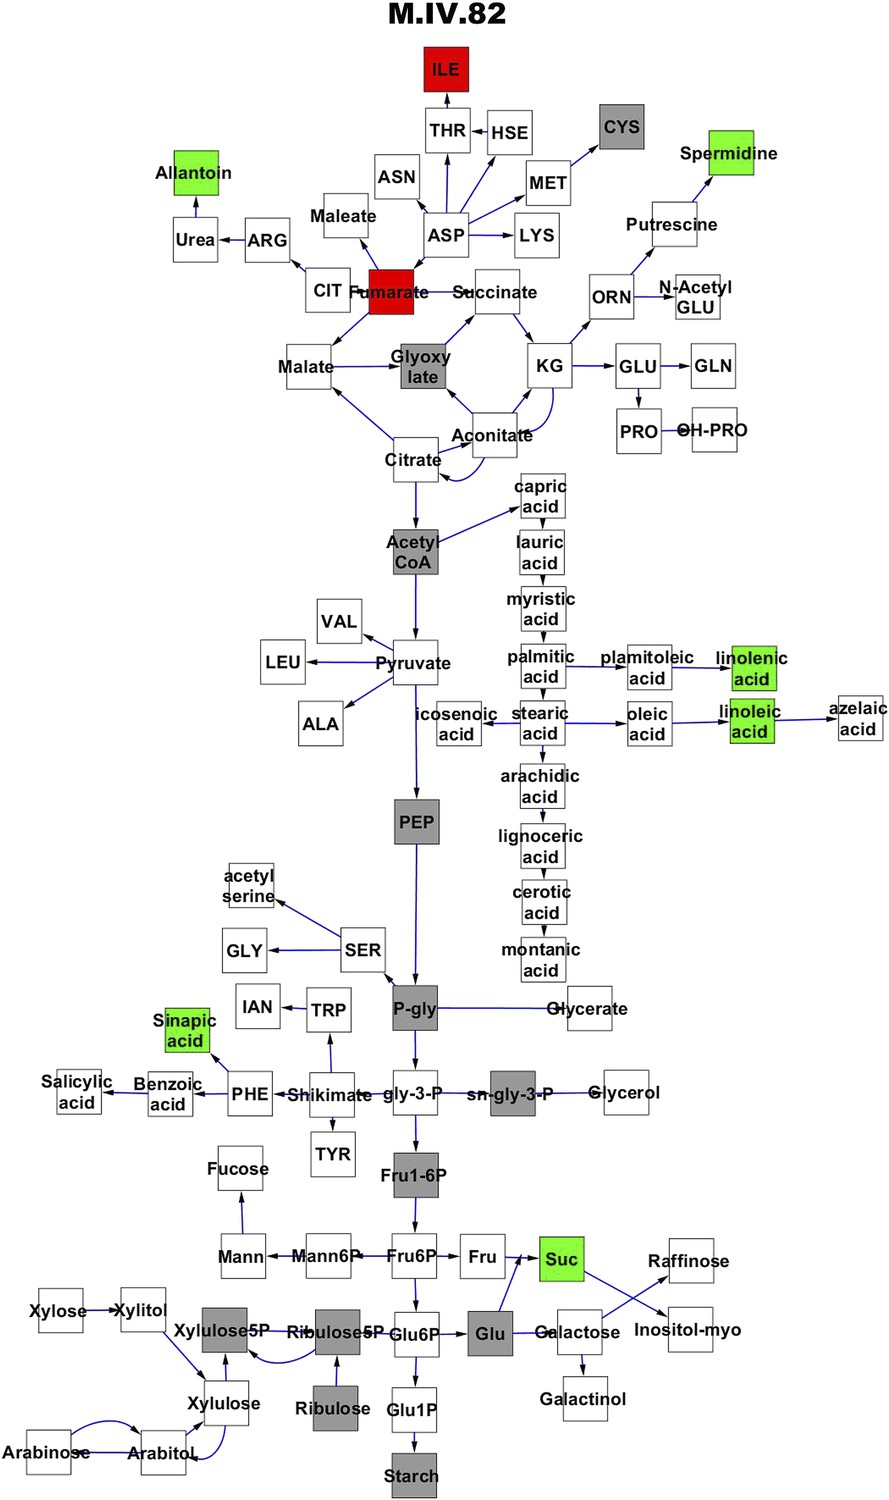
Metabolomic consequence of variation at nuclear locus M.IV.82.
A map of central metabolism was created in cytoscape and this was used to plot the estimated allele effect of genetic variation at each nuclear hotspot locus. A red box shows increased metabolite accumulation when the line contains the Kas allele at the nuclear locus while green shows increased metabolite accumulation when the line contains the Tsu allele at the nuclear locus. White boxes are metabolites that were detected but not significantly influenced by the locus and gray boxes are metabolites that were not detected. The specific hotspot metabolomic QTL locus is listed at the top of the page using the nomenclature shown in Figure 2A.
Figure 3—figure supplement 10
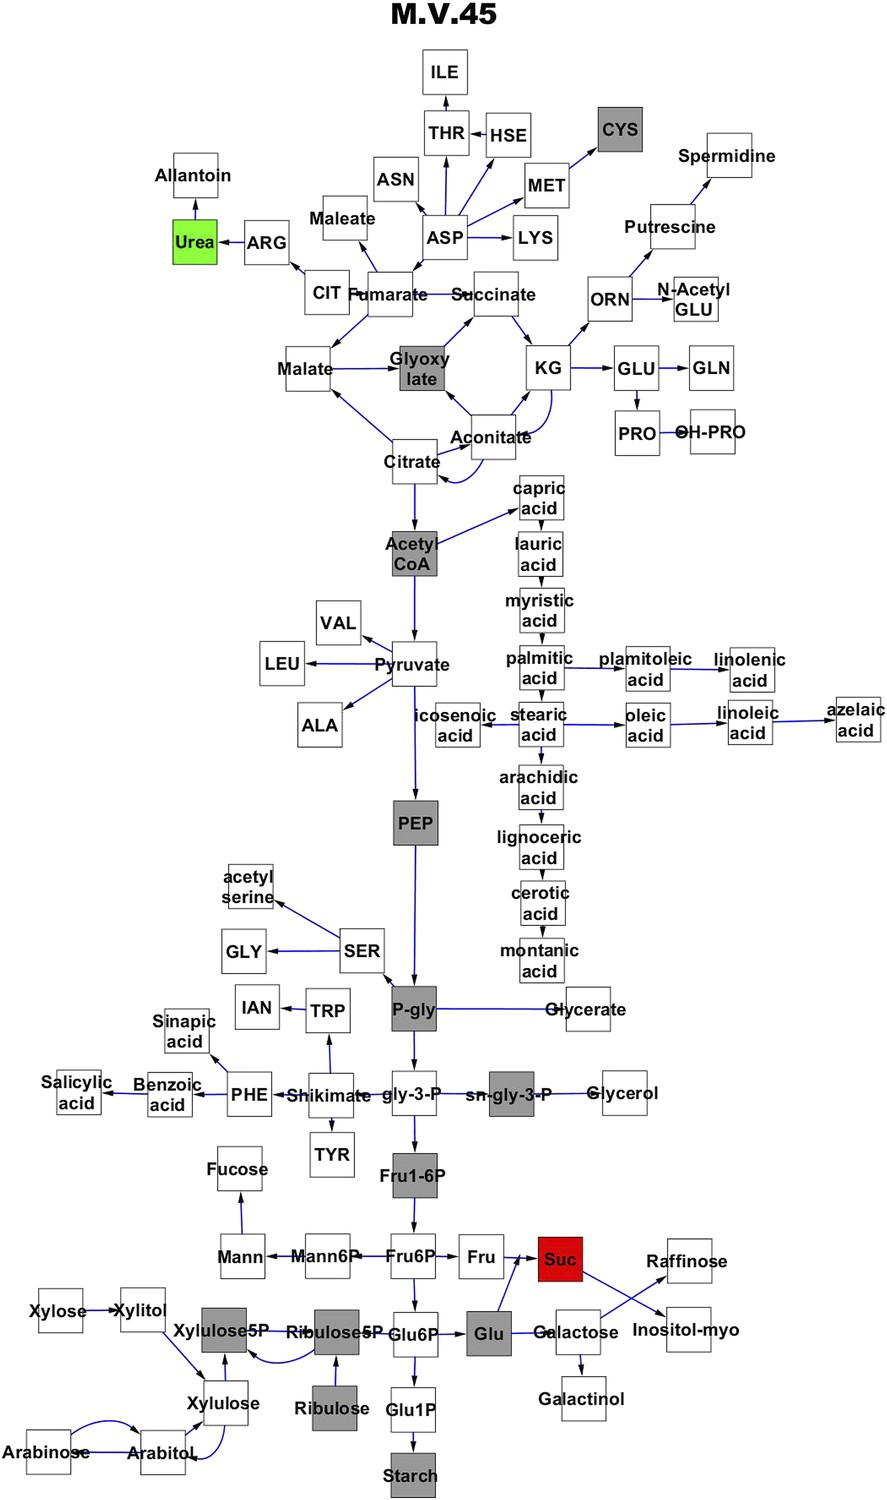
Metabolomic consequence of variation at nuclear locus M.V.45.
A map of central metabolism was created in cytoscape and this was used to plot the estimated allele effect of genetic variation at each nuclear hotspot locus. A red box shows increased metabolite accumulation when the line contains the Kas allele at the nuclear locus while green shows increased metabolite accumulation when the line contains the Tsu allele at the nuclear locus. White boxes are metabolites that were detected but not significantly influenced by the locus and gray boxes are metabolites that were not detected. The specific hotspot metabolomic QTL locus is listed at the top of the page using the nomenclature shown in Figure 2A.
Figure 3—figure supplement 11
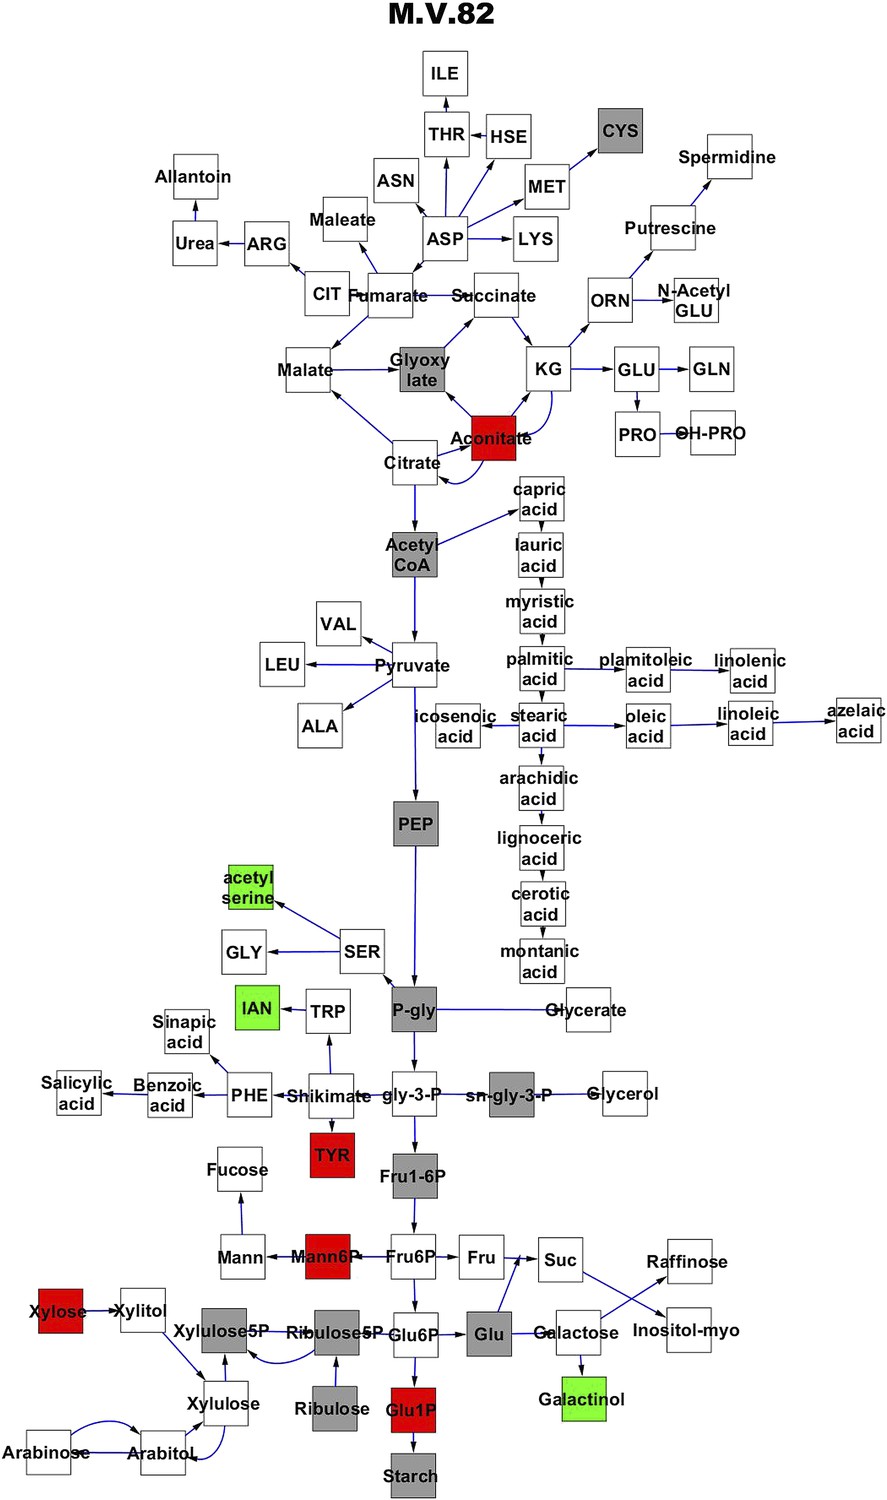
Metabolomic consequence of variation at nuclear locus M.V.82.
A map of central metabolism was created in cytoscape and this was used to plot the estimated allele effect of genetic variation at each nuclear hotspot locus. A red box shows increased metabolite accumulation when the line contains the Kas allele at the nuclear locus while green shows increased metabolite accumulation when the line contains the Tsu allele at the nuclear locus. White boxes are metabolites that were detected but not significantly influenced by the locus and gray boxes are metabolites that were not detected. The specific hotspot metabolomic QTL locus is listed at the top of the page using the nomenclature shown in Figure 2A.
Figure 3—figure supplement 12
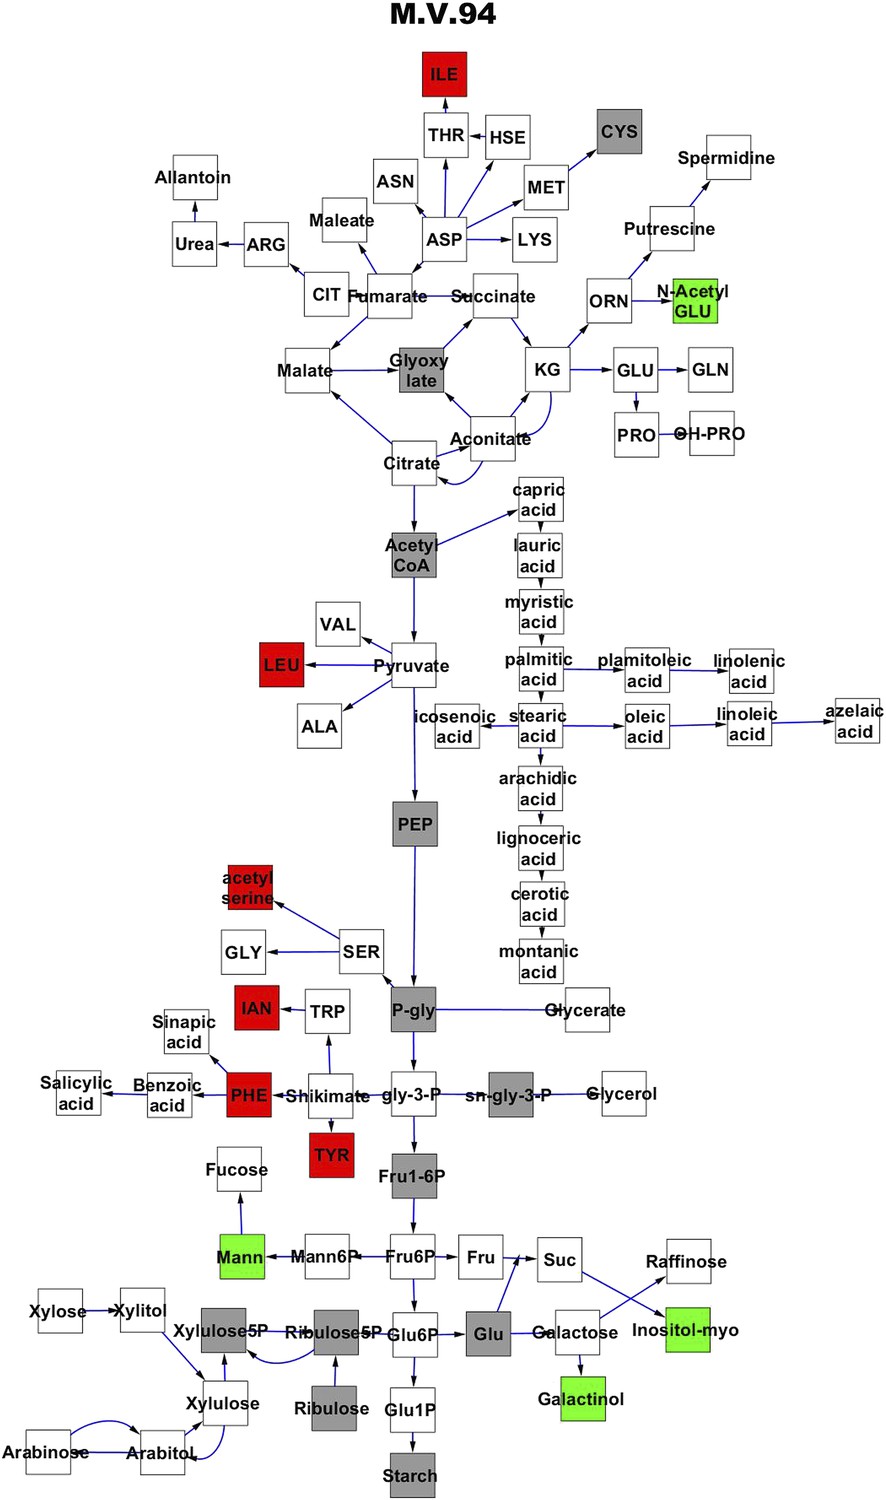
Metabolomic consequence of variation at nuclear locus M.V.94.
A map of central metabolism was created in cytoscape and this was used to plot the estimated allele effect of genetic variation at each nuclear hotspot locus. A red box shows increased metabolite accumulation when the line contains the Kas allele at the nuclear locus while green shows increased metabolite accumulation when the line contains the Tsu allele at the nuclear locus. White boxes are metabolites that were detected but not significantly influenced by the locus and gray boxes are metabolites that were not detected. The specific hotspot metabolomic QTL locus is listed at the top of the page using the nomenclature shown in Figure 2A.
Figure 4 with 8 supplements
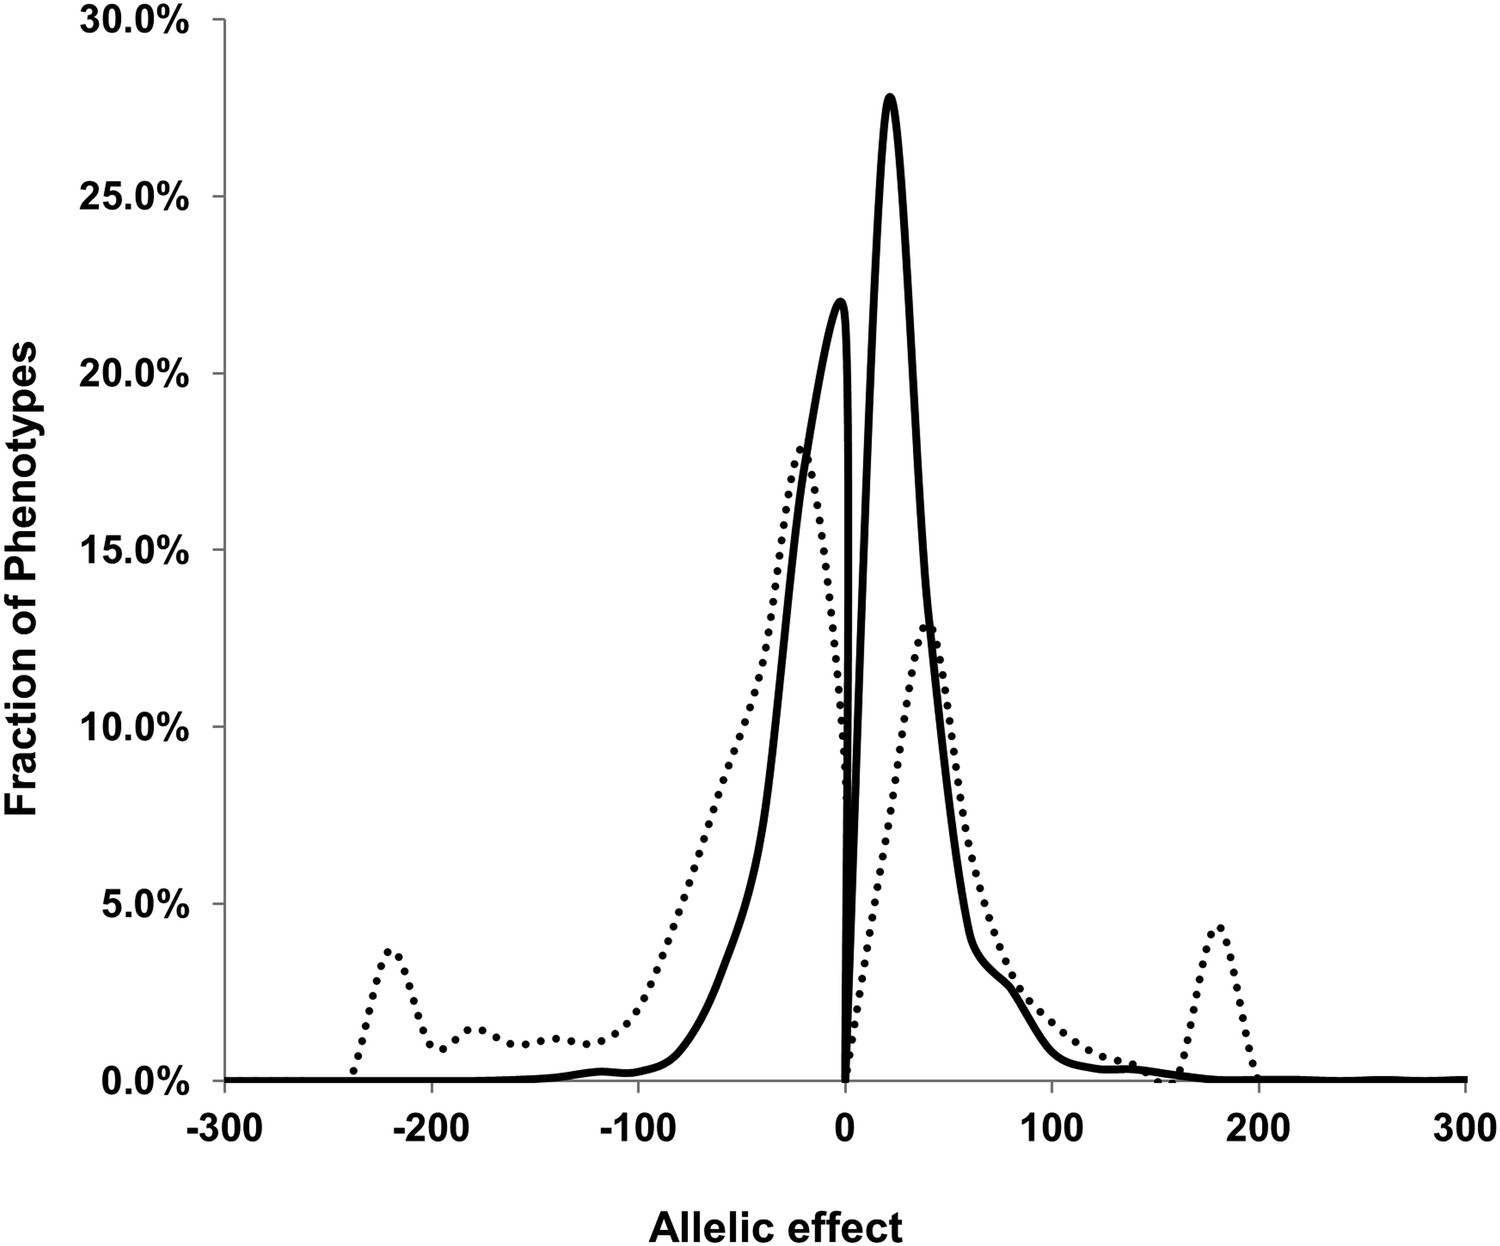
Comparison of estimated QTL allele effects between nuclear and cytoplasmic genetic variation.
The distribution of percent allele effects are shown for all metabolite/loci combinations with positive being the Tsu allele increases the metabolite concentration in comparison to the Kas allele. Solid black line shows the allele effects for all nuclear genomic loci while the dashed line shows cytoplasmic genetic variation allele effects.
Figure 4—figure supplement 1
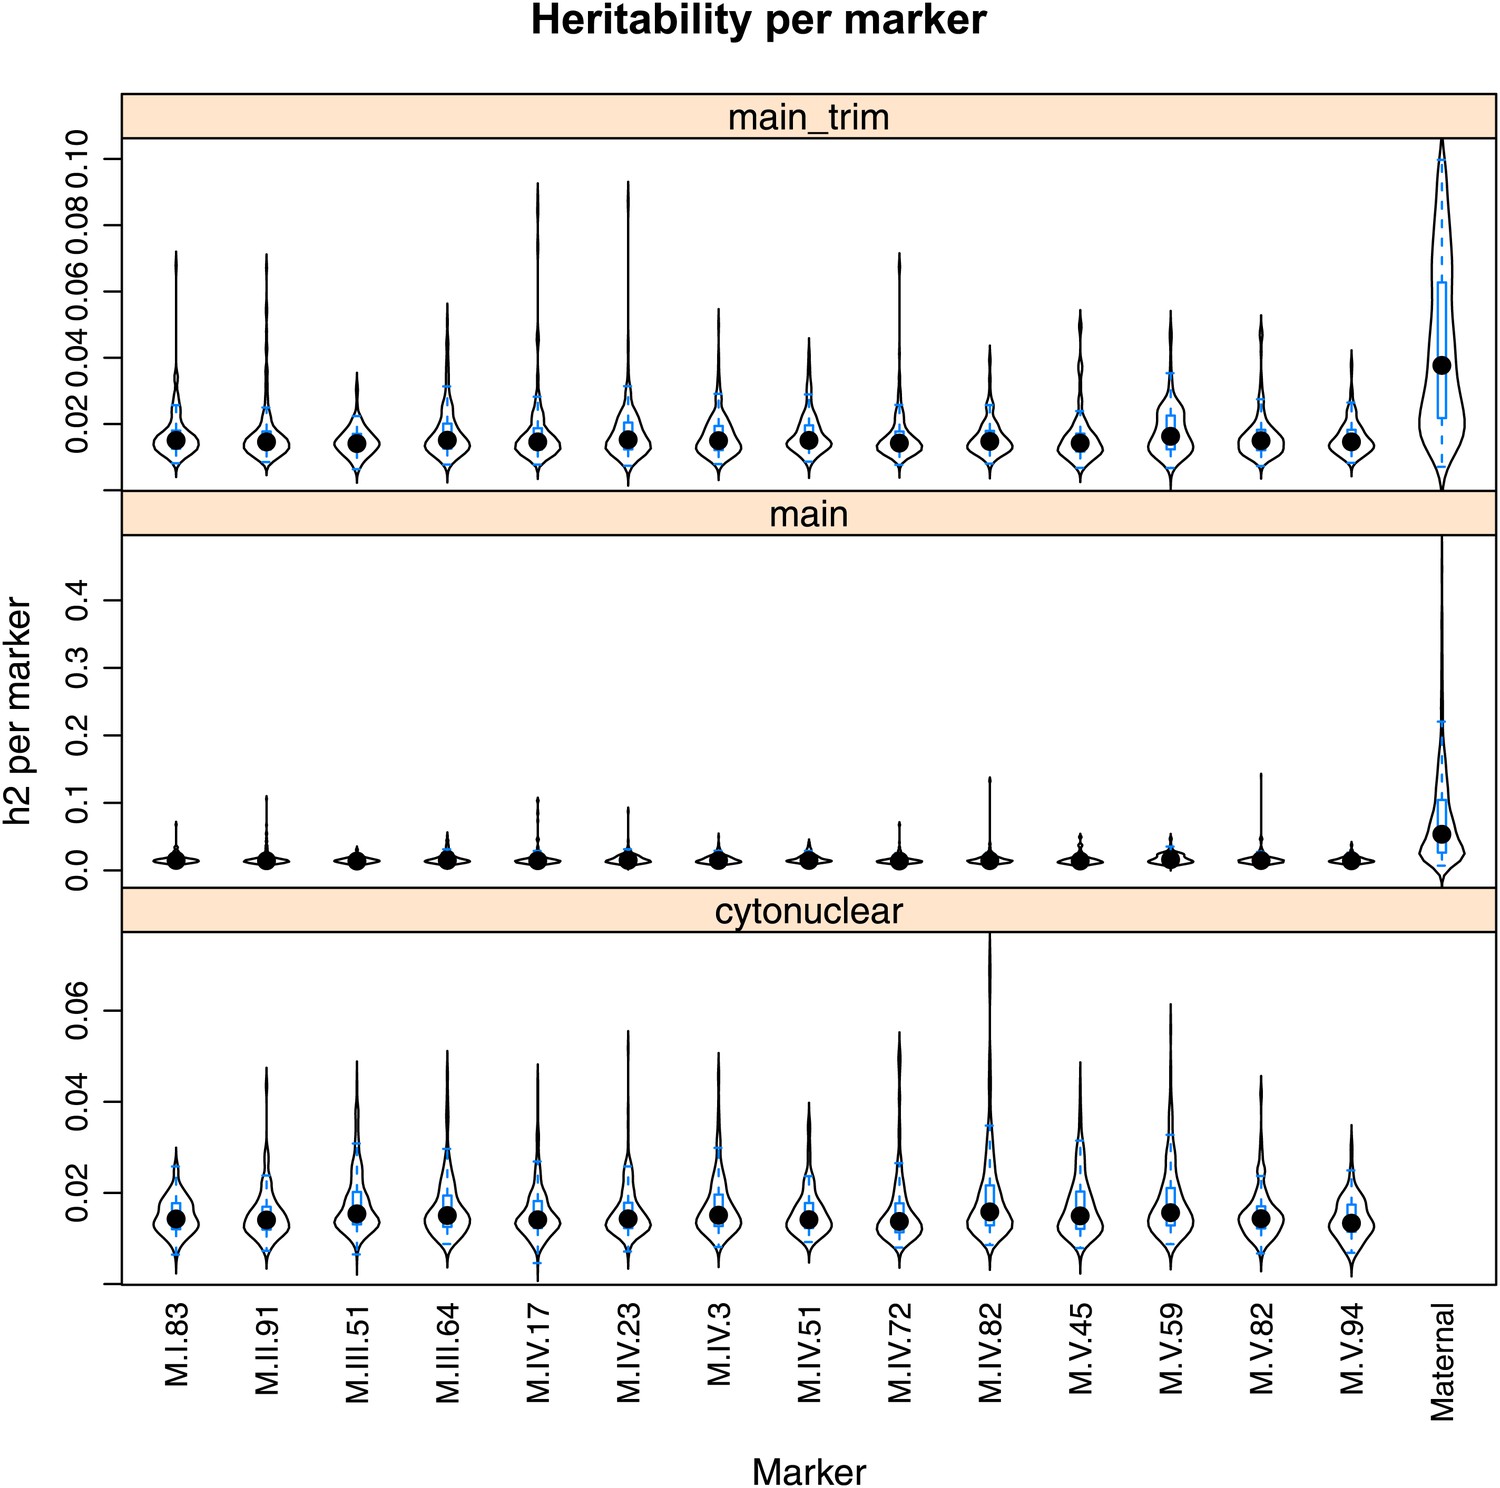
Main effect estimations.
Using pairwise epistasis model run for separately for all metabolites, we identified all significant main effect markers and, epistatic interaction terms. For each metabolite, we identified each significant term and estimated the genetic variance controlled by this term by taking the ratio of the Type III sums of squares (SS) to the total sums of squares (total model SS + Residual SS) for that term. In this figure, we present the distribution of the per marker and per interaction heritability for each marker/interaction based on metabolites that are significant for that marker/interaction. The two plots titled ‘main’ and ‘main trim’ that show the heritability solely attributable to the individual main effect nuclear and cytoplasmic loci. ‘main’ shows the full plot while ‘main_trim’ shows the distribution trimmed to improve the resolution on the nuclear markers. The plot entitled ‘cytonuclear’ shows the distribution of the heritability attributed to all significant interactions between the cytoplasmic genome and the listed nuclear locus. For instance, the plot of M.I.83 in this graph shows the distribution of heritability across all metabolites significant for the cytoplasm × M.I.83 cytonuclear interaction.
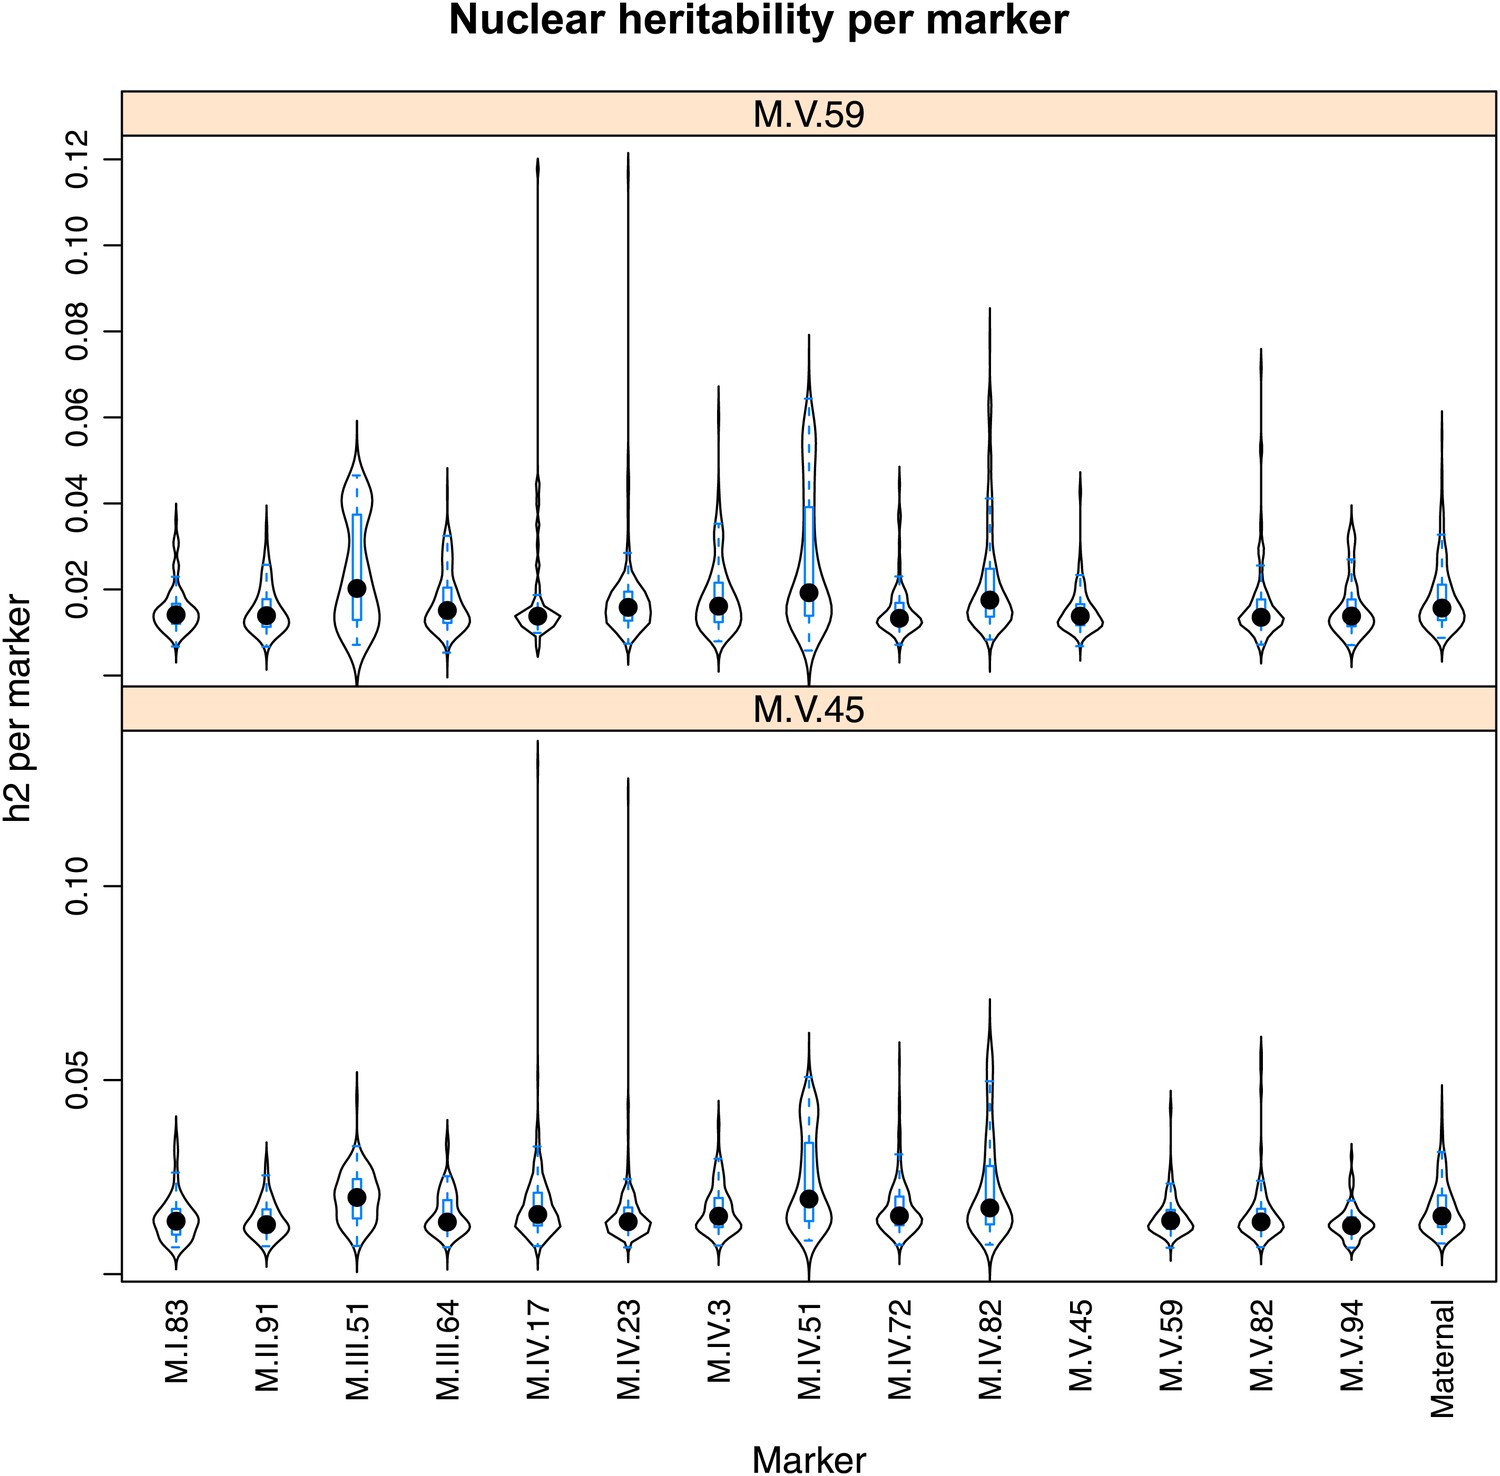
Figure 4—figure supplement 2
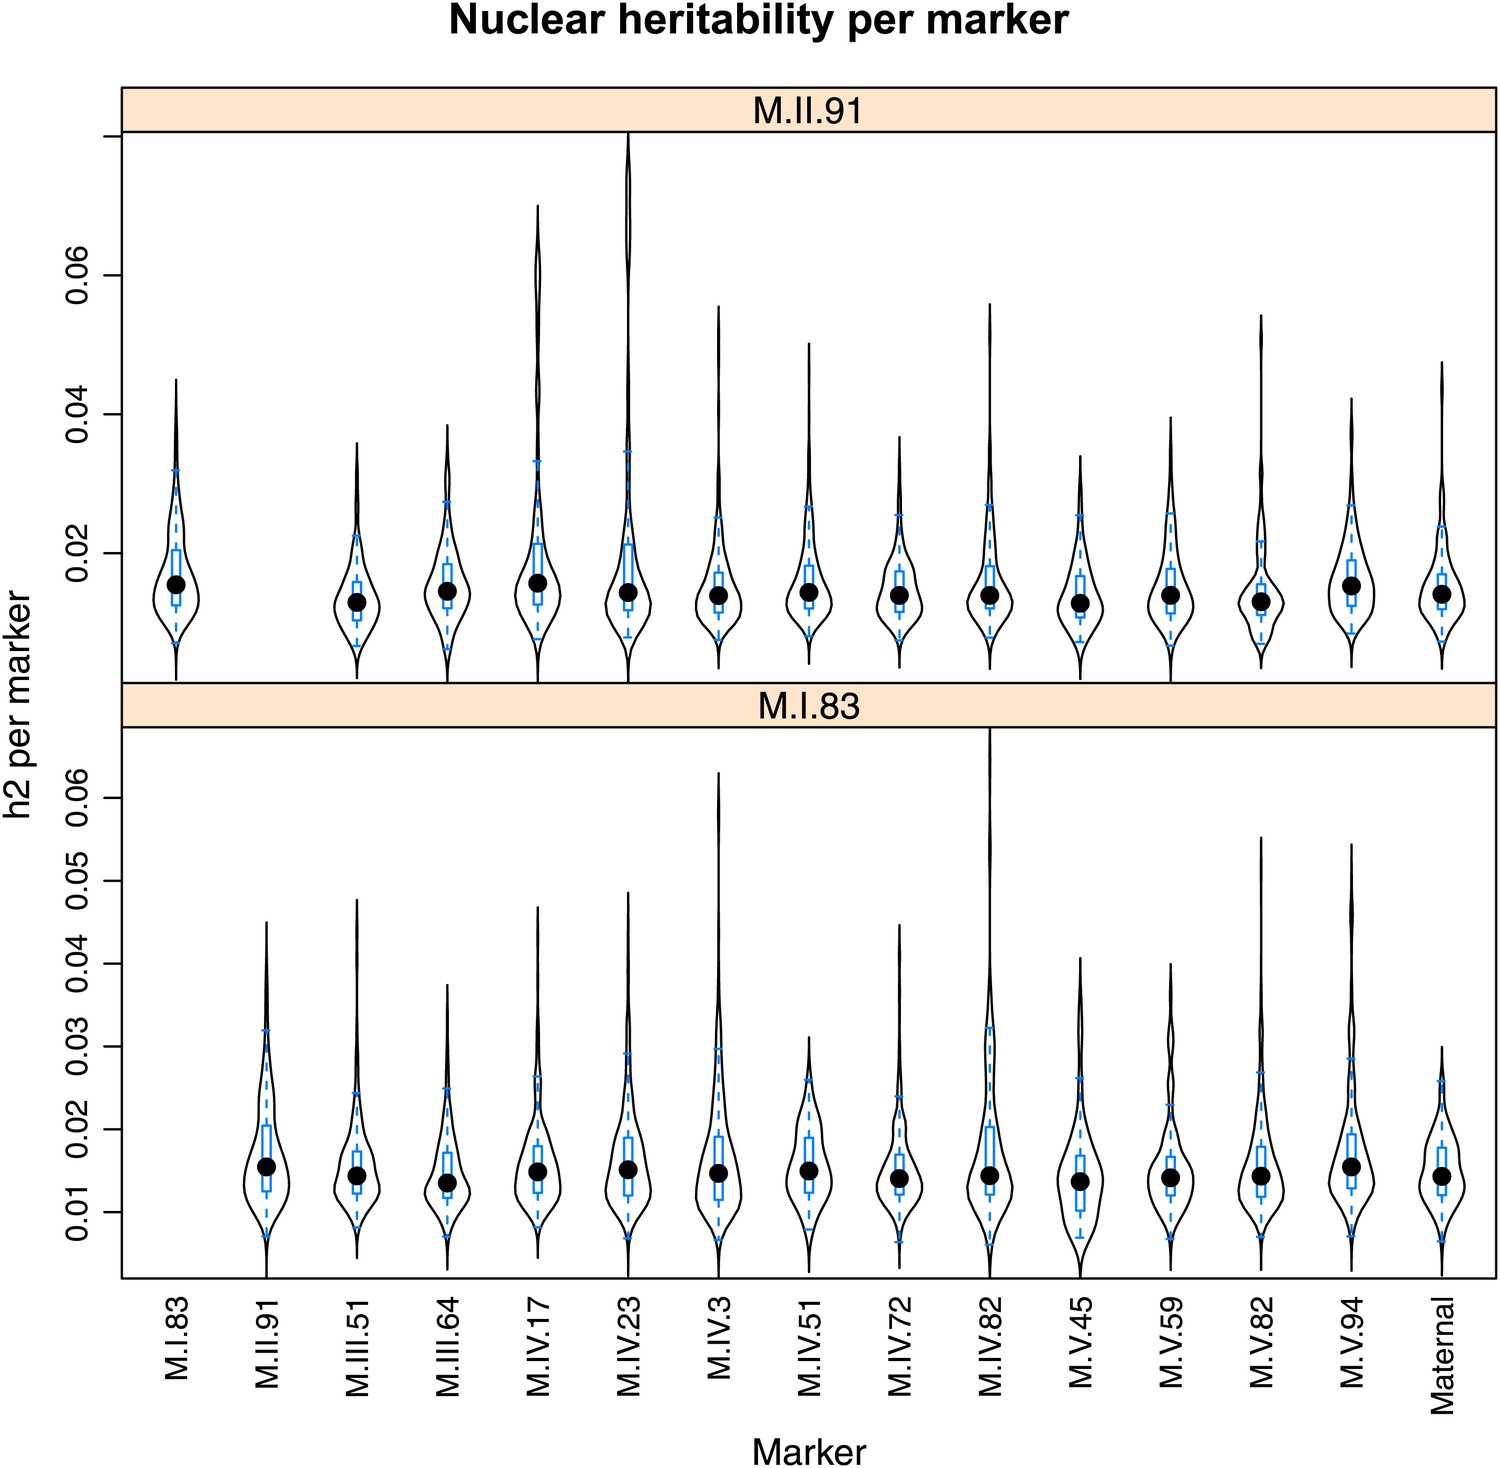
Distribution of heritability of pairwise interaction of nuclear loci M.II.91 and M.I.83.
Using the pairwise epistasis model analysis separately for all metabolites, we identified all significant main effect markers, individual genetic loci, and interactions, epistatic terms. For each metabolite, we identified each significant term and estimated the genetic variance controlled by this term by taking the ratio of the Type III sums of squares (SS) to the total sums of squares (total model SS + Residual SS) for that term from Model III. In this figure, we present the distribution of the per marker and per interaction heritability for each marker/interaction for the metabolites that are significant for that marker/interaction. These plots are titled with specific nuclear locus show the distribution of heritability controlled by interactions between the titled marker and all the other loci in the model. Again this is only for interaction terms that were significant in the individual metabolite models.
Figure 4—figure supplement 3
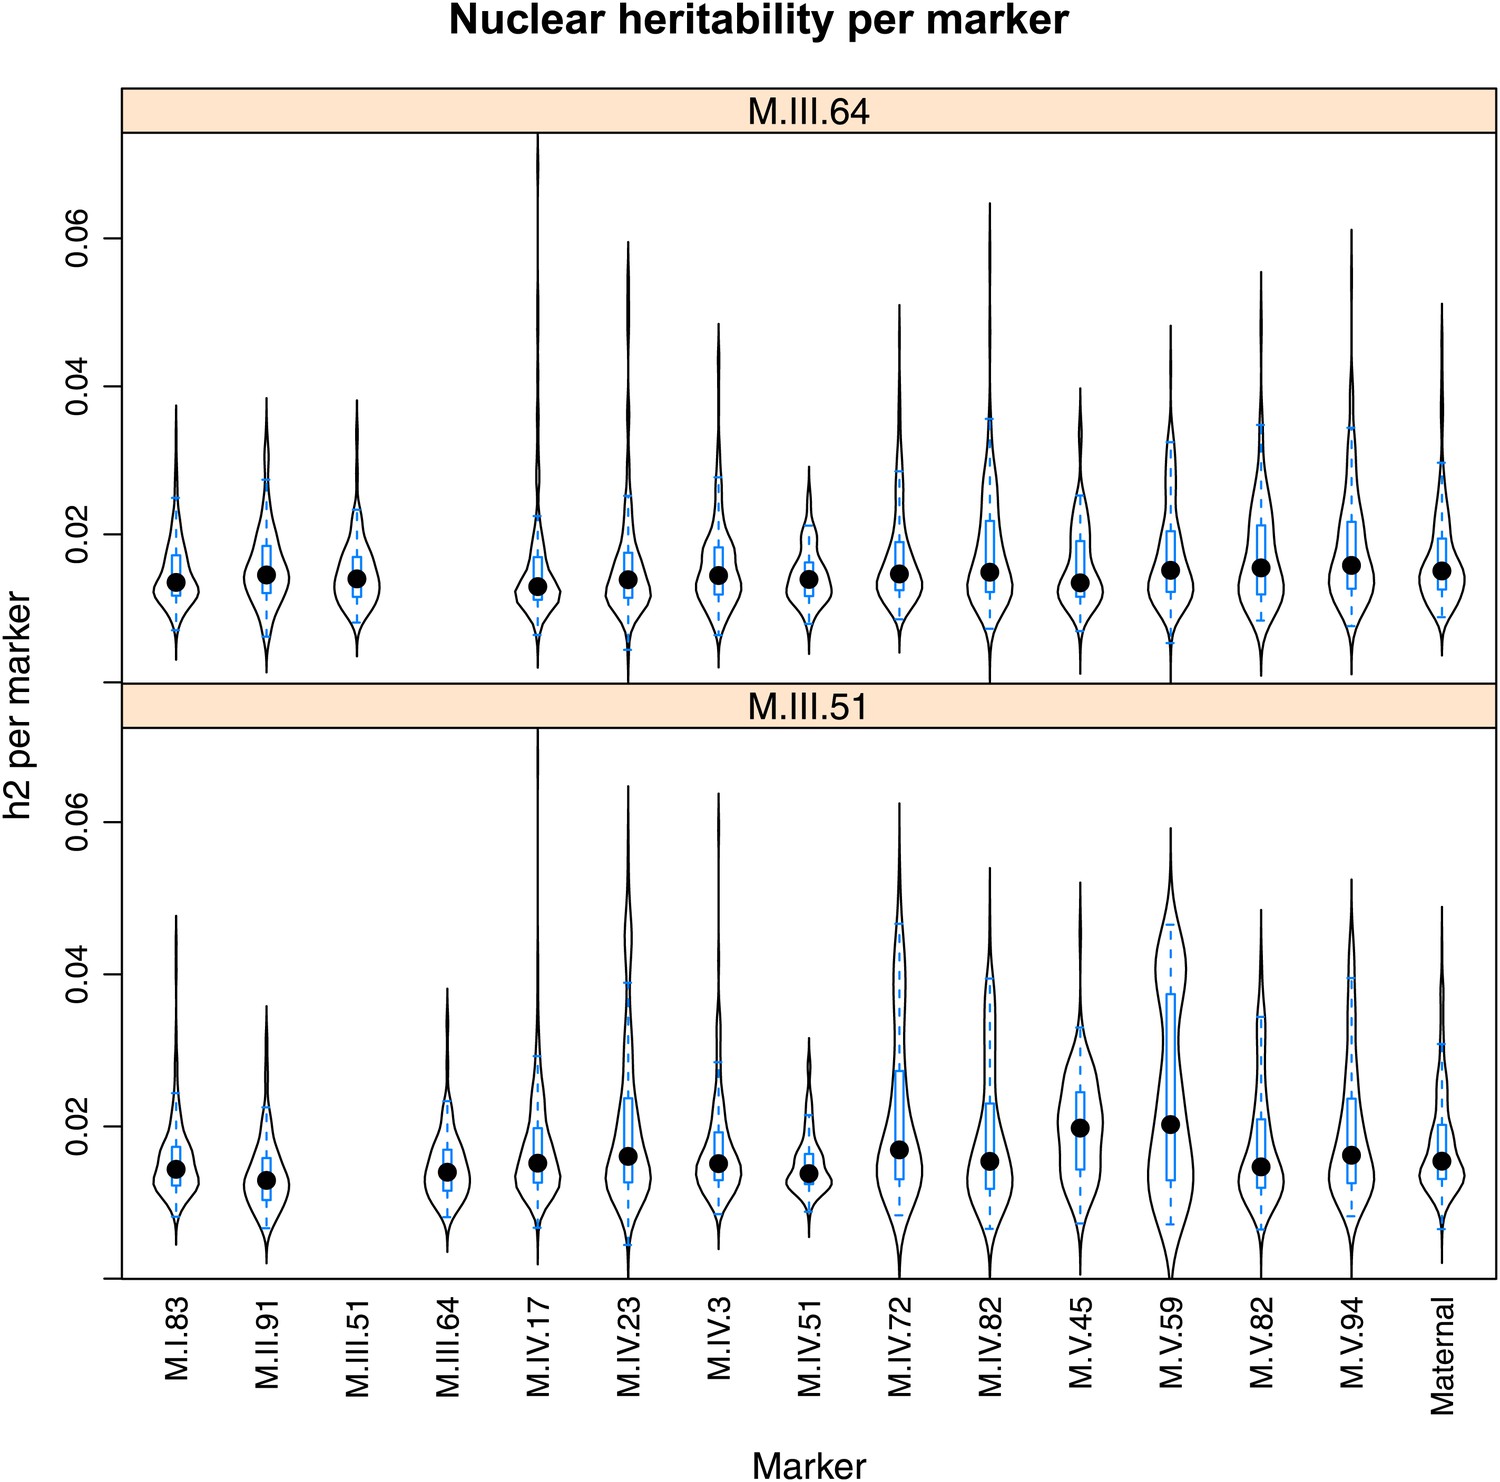
Distribution of heritability of pairwise interaction of nuclear loci M.III.64 and M.III.51.
Using the pairwise epistasis model analysis separately for all metabolites, we identified all significant main effect markers, individual genetic loci, and interactions, epistatic terms. For each metabolite, we identified each significant term and estimated the genetic variance controlled by this term by taking the ratio of the Type III sums of squares (SS) to the total sums of squares (total model SS + Residual SS) for that term from Model III. In this figure, we present the distribution of the per marker and per interaction heritability for each marker/interaction for the metabolites that are significant for that marker/interaction. These plots are titled with specific nuclear locus show the distribution of heritability controlled by interactions between the titled marker and all the other loci in the model. Again this is only for interaction terms that were significant in the individual metabolite models.
Figure 4—figure supplement 4

Distribution of heritability of pairwise interaction of nuclear loci M.IV.23 and M.IV.17.
Using the pairwise epistasis model analysis separately for all metabolites, we identified all significant main effect markers, individual genetic loci, and interactions, epistatic terms. For each metabolite, we identified each significant term and estimated the genetic variance controlled by this term by taking the ratio of the Type III sums of squares (SS) to the total sums of squares (total model SS + Residual SS) for that term from Model III. In this figure, we present the distribution of the per marker and per interaction heritability for each marker/interaction for the metabolites that are significant for that marker/interaction. These plots are titled with specific nuclear locus show the distribution of heritability controlled by interactions between the titled marker and all the other loci in the model. Again this is only for interaction terms that were significant in the individual metabolite models.
Figure 4—figure supplement 5
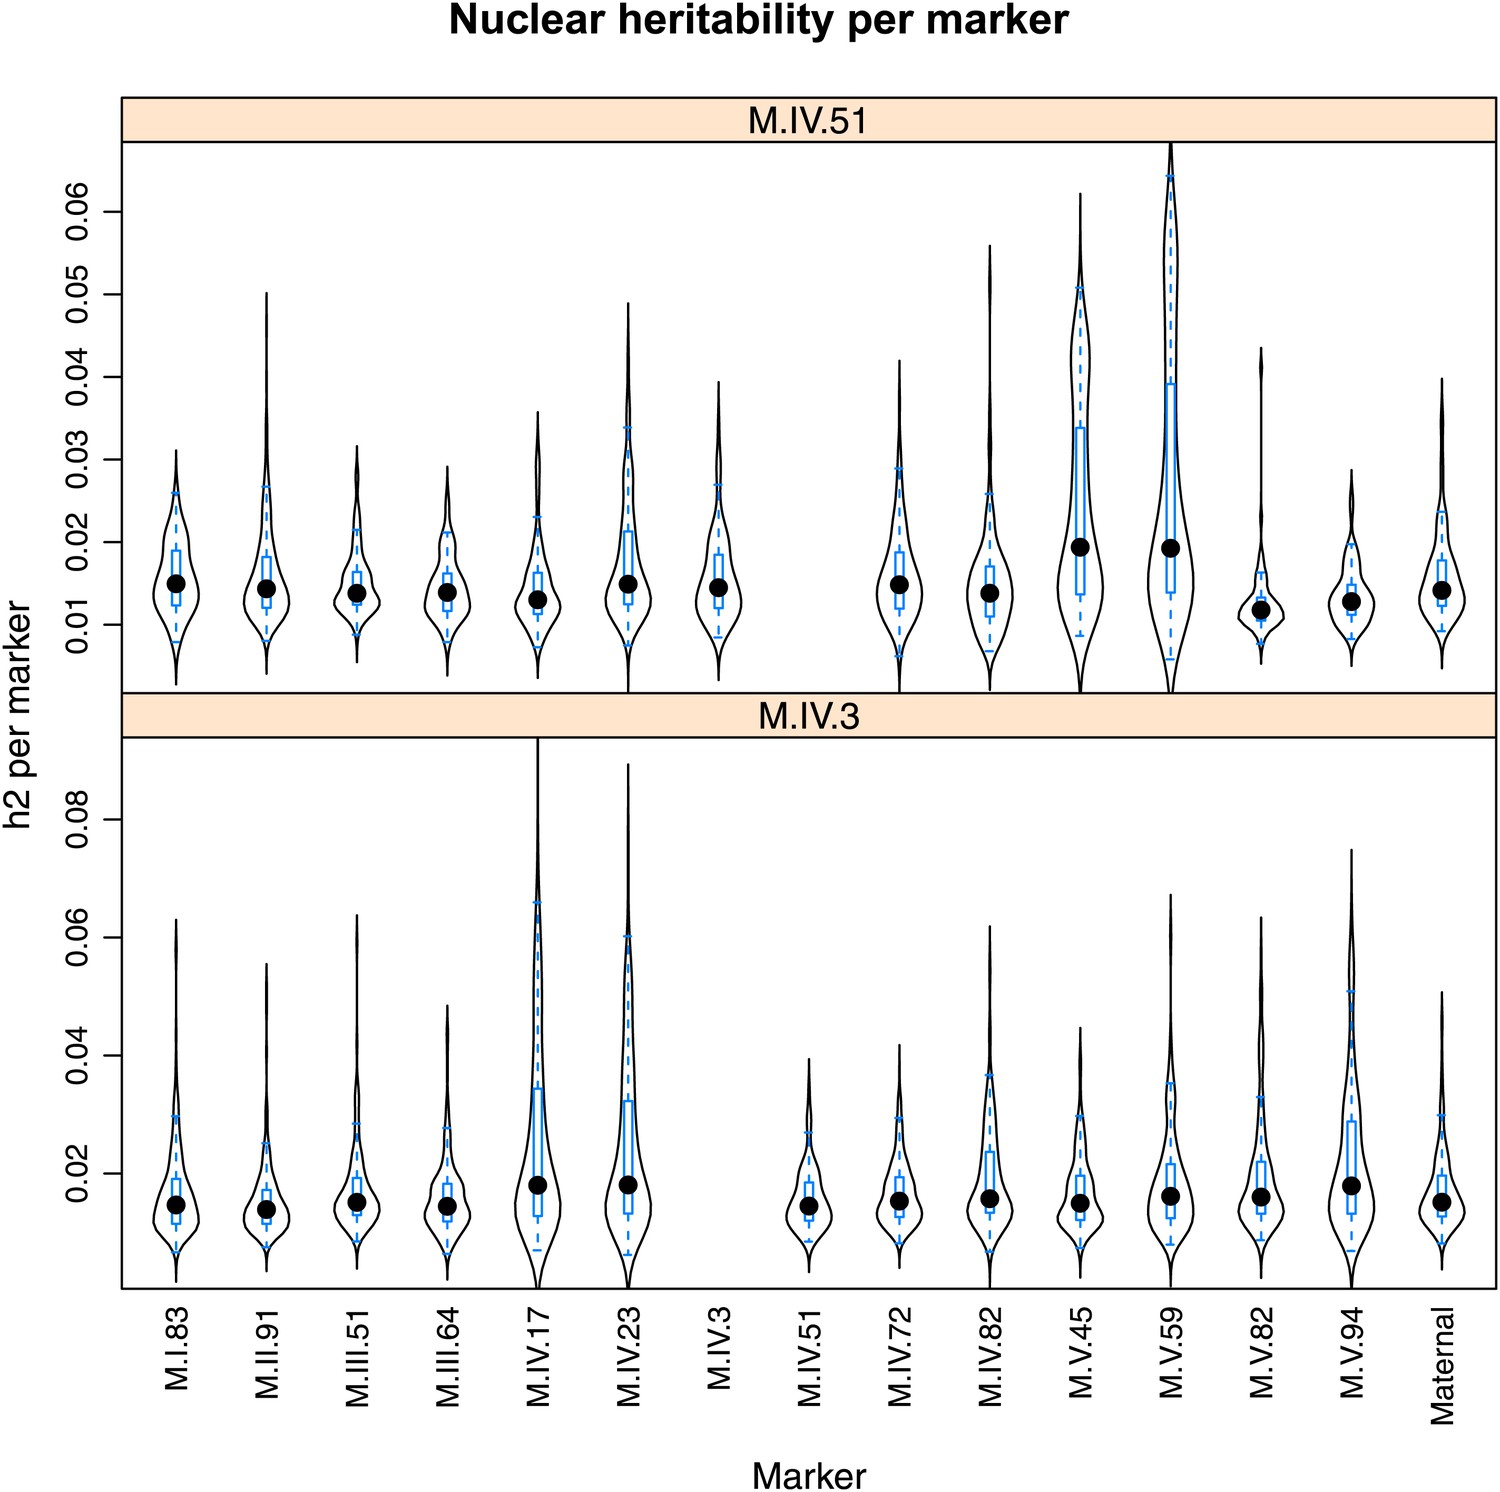
Distribution of heritability of pairwise interaction of nuclear loci M.IV.51 and M.IV.23.
Using the pairwise epistasis model analysis separately for all metabolites, we identified all significant main effect markers, individual genetic loci, and interactions, epistatic terms. For each metabolite, we identified each significant term and estimated the genetic variance controlled by this term by taking the ratio of the Type III sums of squares (SS) to the total sums of squares (total model SS + Residual SS) for that term from Model III. In this figure, we present the distribution of the per marker and per interaction heritability for each marker/interaction for the metabolites that are significant for that marker/interaction. These plots are titled with specific nuclear locus show the distribution of heritability controlled by interactions between the titled marker and all the other loci in the model. Again this is only for interaction terms that were significant in the individual metabolite models.
Figure 4—figure supplement 6

Distribution of heritability of pairwise interaction of nuclear loci M.IV.82 and M.IV.72.
Using the pairwise epistasis model analysis separately for all metabolites, we identified all significant main effect markers, individual genetic loci, and interactions, epistatic terms. For each metabolite, we identified each significant term and estimated the genetic variance controlled by this term by taking the ratio of the Type III sums of squares (SS) to the total sums of squares (total model SS + Residual SS) for that term from Model III. In this figure, we present the distribution of the per marker and per interaction heritability for each marker/interaction for the metabolites that are significant for that marker/interaction. These plots are titled with specific nuclear locus show the distribution of heritability controlled by interactions between the titled marker and all the other loci in the model. Again this is only for interaction terms that were significant in the individual metabolite models.
Figure 4—figure supplement 7
Distribution of heritability of pairwise interaction of nuclear loci M.V.59 and M.V.45.
Using the pairwise epistasis model analysis separately for all metabolites, we identified all significant main effect markers, individual genetic loci, and interactions, epistatic terms. For each metabolite, we identified each significant term and estimated the genetic variance controlled by this term by taking the ratio of the Type III sums of squares (SS) to the total sums of squares (total model SS + Residual SS) for that term from Model III. In this figure, we present the distribution of the per marker and per interaction heritability for each marker/interaction for the metabolites that are significant for that marker/interaction. These plots are titled with specific nuclear locus show the distribution of heritability controlled by interactions between the titled marker and all the other loci in the model. Again this is only for interaction terms that were significant in the individual metabolite models.
Figure 4—figure supplement 8

Distribution of heritability of pairwise interaction of nuclear loci M.V.94 and M.V.82.
Using the pairwise epistasis model analysis separately for all metabolites, we identified all significant main effect markers, individual genetic loci, and interactions, epistatic terms. For each metabolite, we identified each significant term and estimated the genetic variance controlled by this term by taking the ratio of the Type III sums of squares (SS) to the total sums of squares (total model SS + Residual SS) for that term from Model III. In this figure, we present the distribution of the per marker and per interaction heritability for each marker/interaction for the metabolites that are significant for that marker/interaction. These plots are titled with specific nuclear locus show the distribution of heritability controlled by interactions between the titled marker and all the other loci in the model. Again this is only for interaction terms that were significant in the individual metabolite models.
Figure 5

Metabolomic consequences of cytoplasmic genomic variation.
A map of central metabolism was created in cytoscape and this was used to plot the estimated allele effect of genetic variation in the cytoplasmic genomes using the reciprocal sub-populations. Colors are as given in Figure 3.
-
Figure 5—source data 1
Genetic polymorphisms between the Kas and Tsu Organelles.
AGI represents the code for each gene with position being from the +1 of transcription for that gene. The specific base at each site in Col-0, Kas and Tsu are shown.
- https://doi.org/10.7554/eLife.00776.032
Figure 6
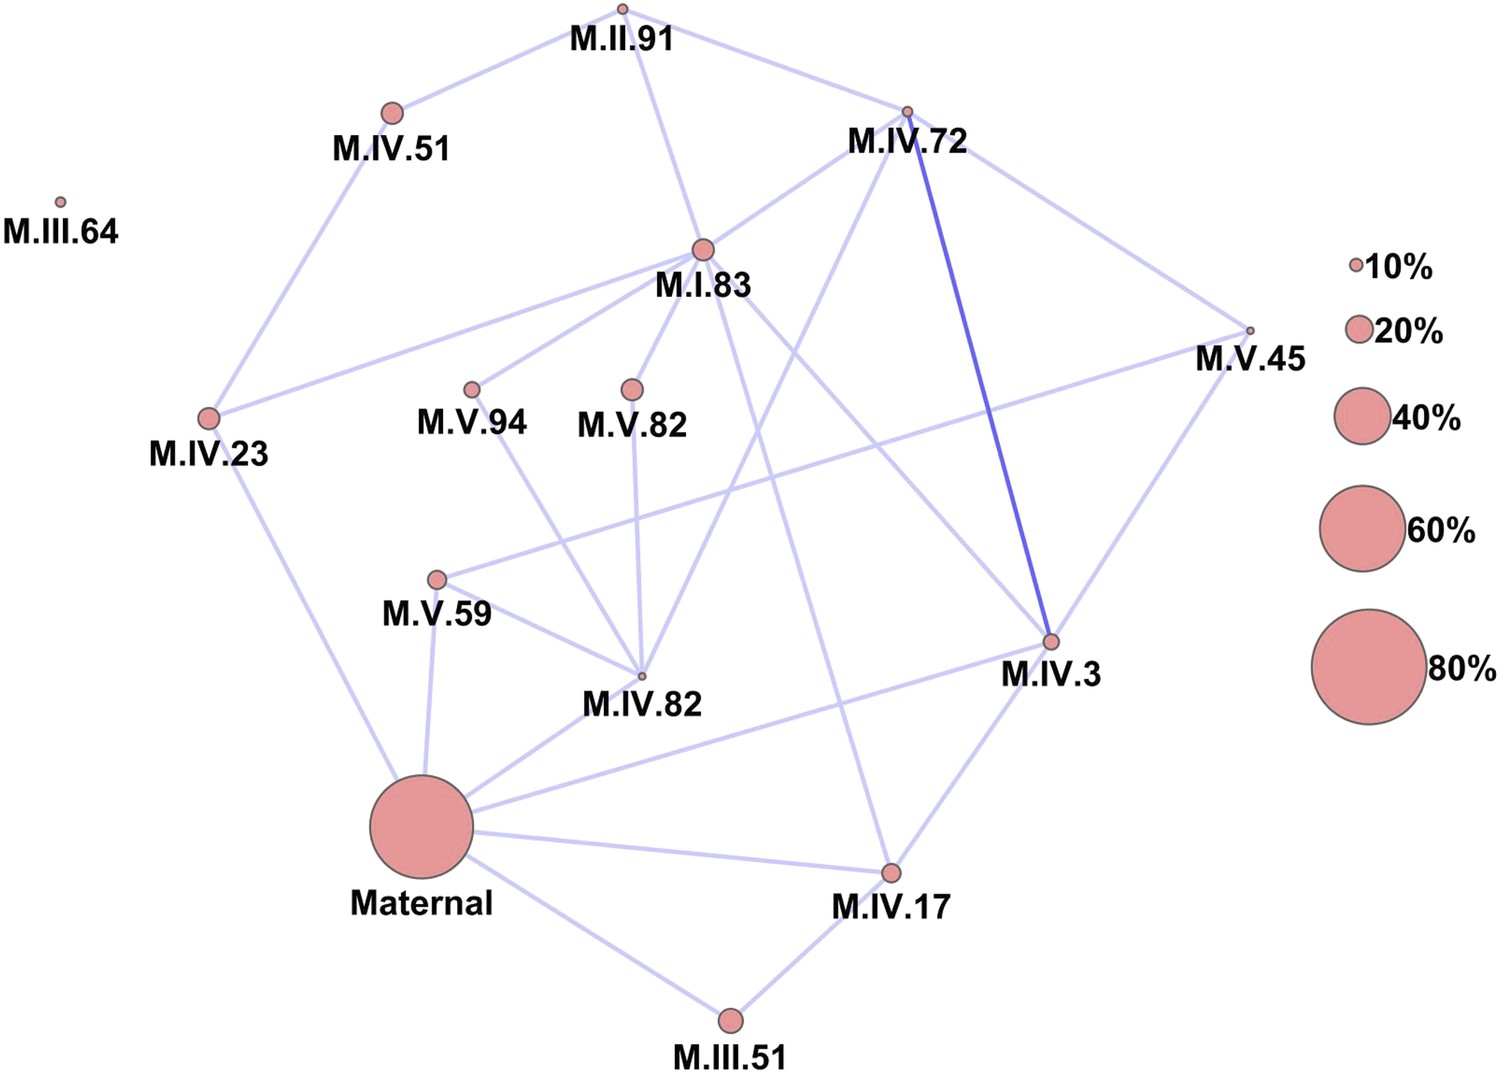
Epistatic networks of metabolism.
All epistatic interactions between the cytoplasmic genomic variation and nuclear loci (as labeled in Figure 2) are plotted as lines connecting the main effect loci as nodes. The size of the main effect nodes represents the fraction of total metabolites affected by the given locus. The color of the lines show the fraction of metabolites linked with this interaction, light blue 10–15% of metabolites, dark blue 15–20% of metabolites.
-
Figure 6—source data 1
Pairwise ANOVA p values.
p values for main effect and interaction terms using hotspot markers.
- https://doi.org/10.7554/eLife.00776.034
-
Figure 6—source data 2
Pairwise ANOVA sums of squares.
The type III sums of squares from the model run in Figure 6—source data 1.
- https://doi.org/10.7554/eLife.00776.035
Figure 7 with 2 supplements
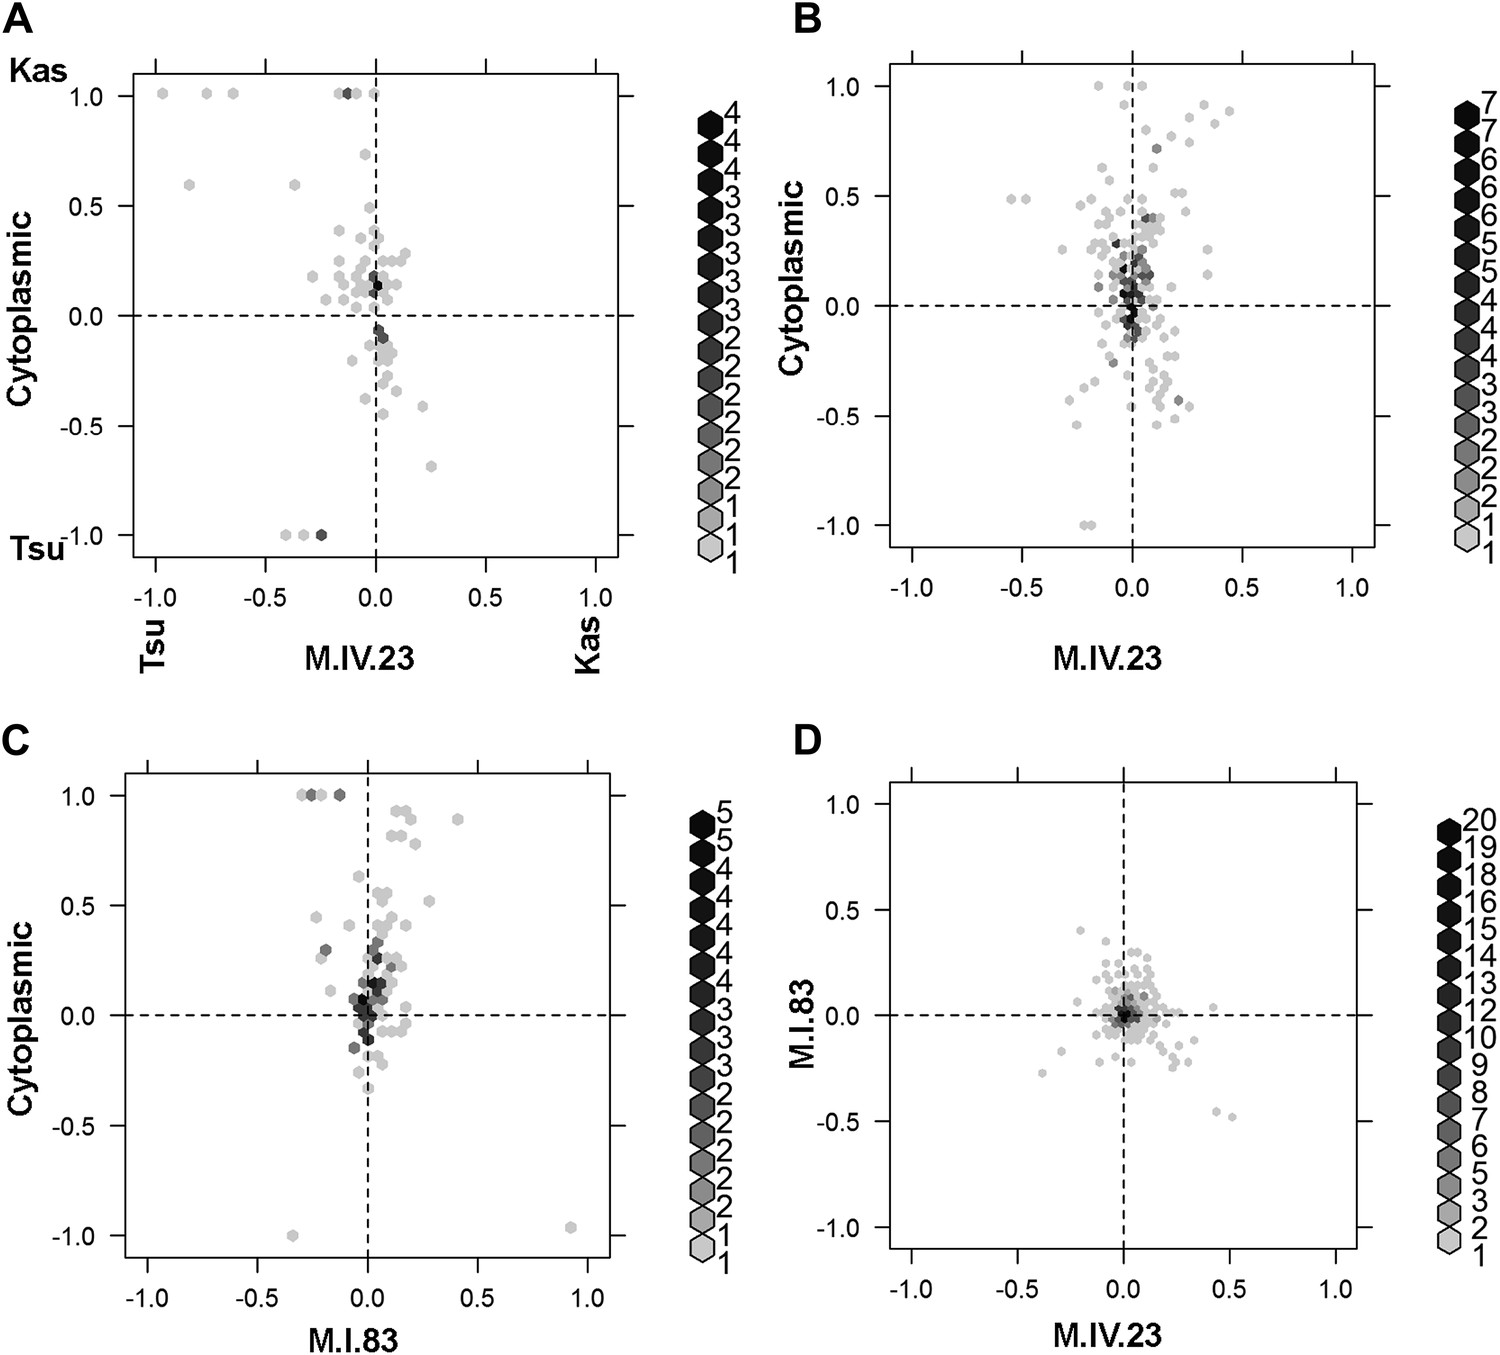
Different epistatic patterns across genotypic combinations.
The center of mass calculations were used to estimate the phenotypic center for each metabolite that was significantly affected by the given combination of loci. The hexbin plots show the distribution of phenotypic centers for all significant metabolites. The number of metabolites per hexbin are shown in the legend to the right of each graph. All other significant epistatic pair combinations are plotted in Figure 7—figure supplement 2. (A) Metabolites that are additive for both the cytoplasmic loci and M.IV.23. (B) Metabolites that are epistatically affected by an interaction between M.IV.23 and the cytoplasmic genotypes. (C) Metabolites that are epistatically affected by an interaction between M.I.83 and the cytoplasmic genotypes. (D) Metabolites that are epistatically affected by an interaction between M.I.83 and M.IV.23 genotypes.
Figure 7—figure supplement 1

Descriptive model of the epistatic center plot.
This is a representative plot showing where the specific modeled metabolites, as presented in the table, are position on the center of phenotype plot. Letters label each modeled metabolite on the plot. The allele at each locus is positioned as the Kas allele at 1 and Tsu allele at −1.
Figure 7—figure supplement 2
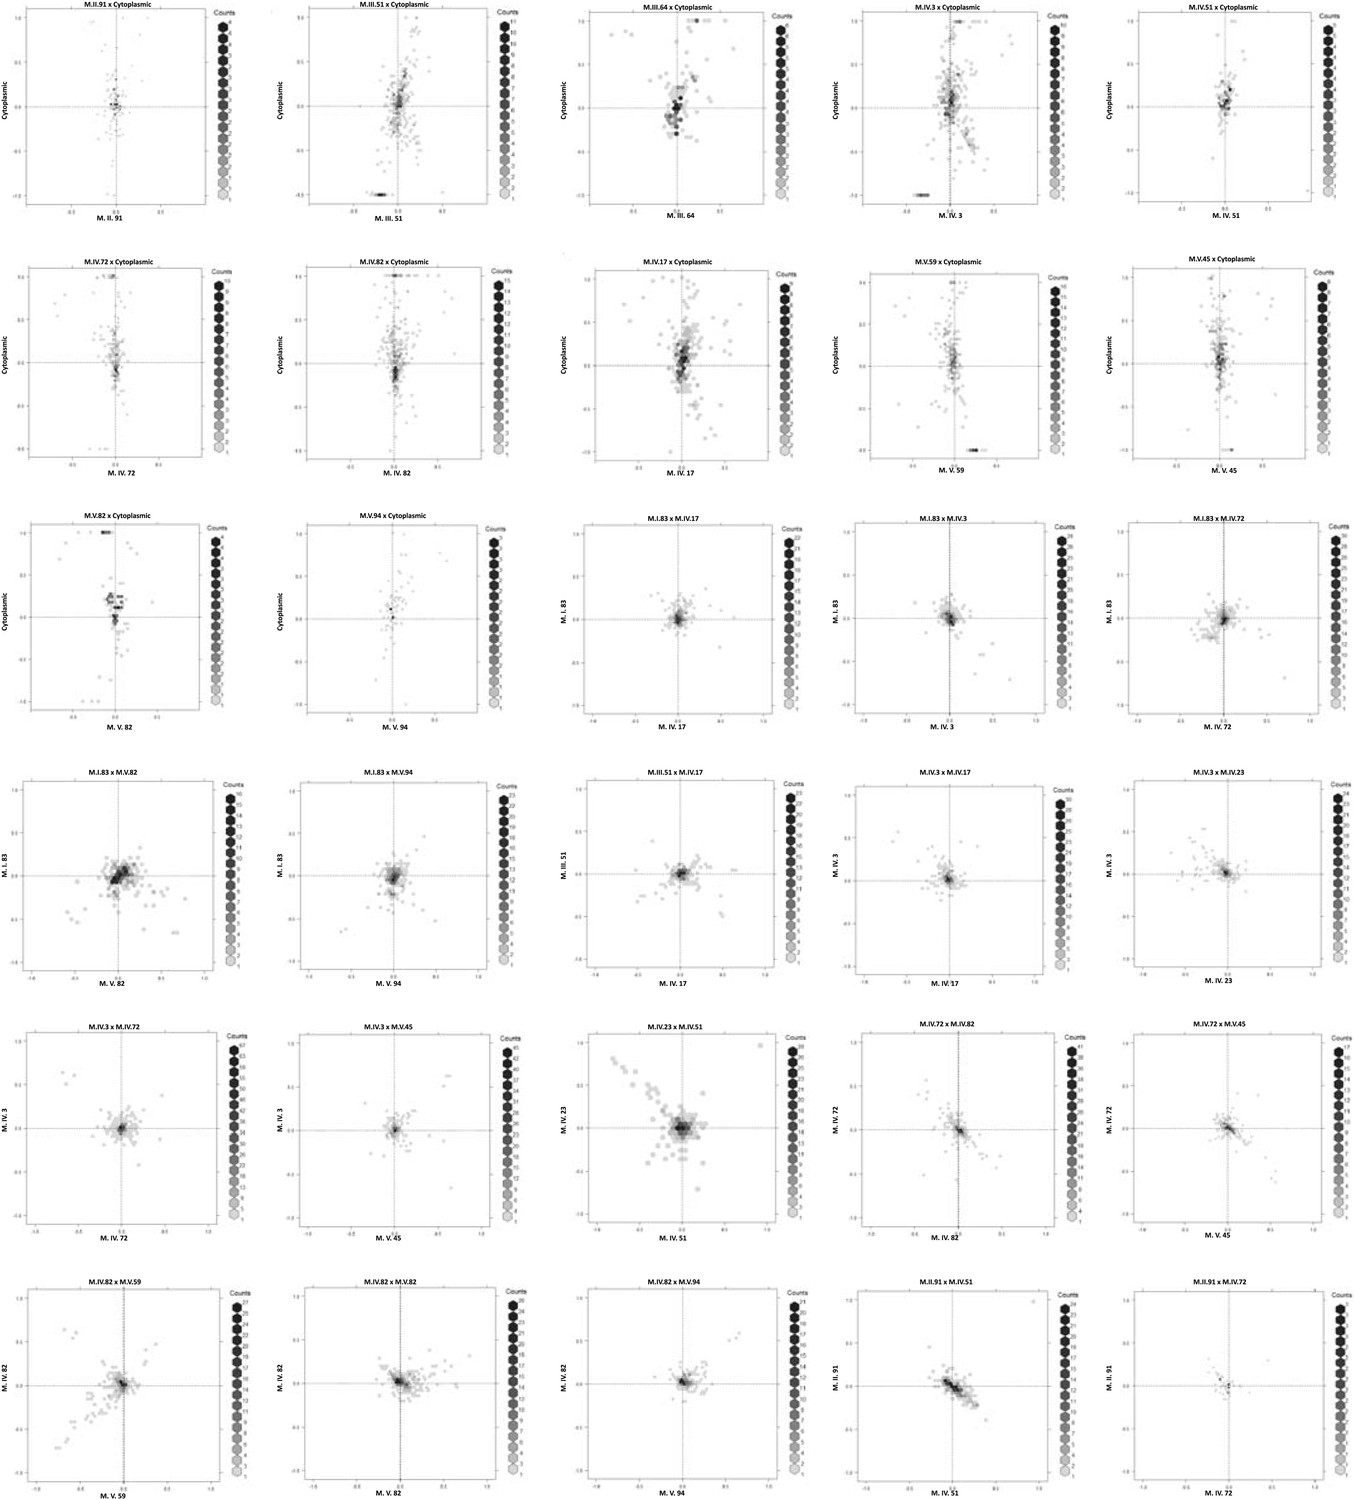
Hexbin plots show the distribution of phenotypic centers for cytoplasmic and nuclear pairwise epistatic interactions.
Only interactions significantly affecting 10% or more of the metabolites are shown. Each interaction is listed at the top of the page and the number of metabolite per hexbin is shown in the legend to the right of each graph. Center of mass calculations were used to estimate the phenotypic center for each metabolite that was significantly affected by the given epistasis interaction. The hexbin plots show the distribution of phenotypic centers for all significant metabolites.
Figure 8
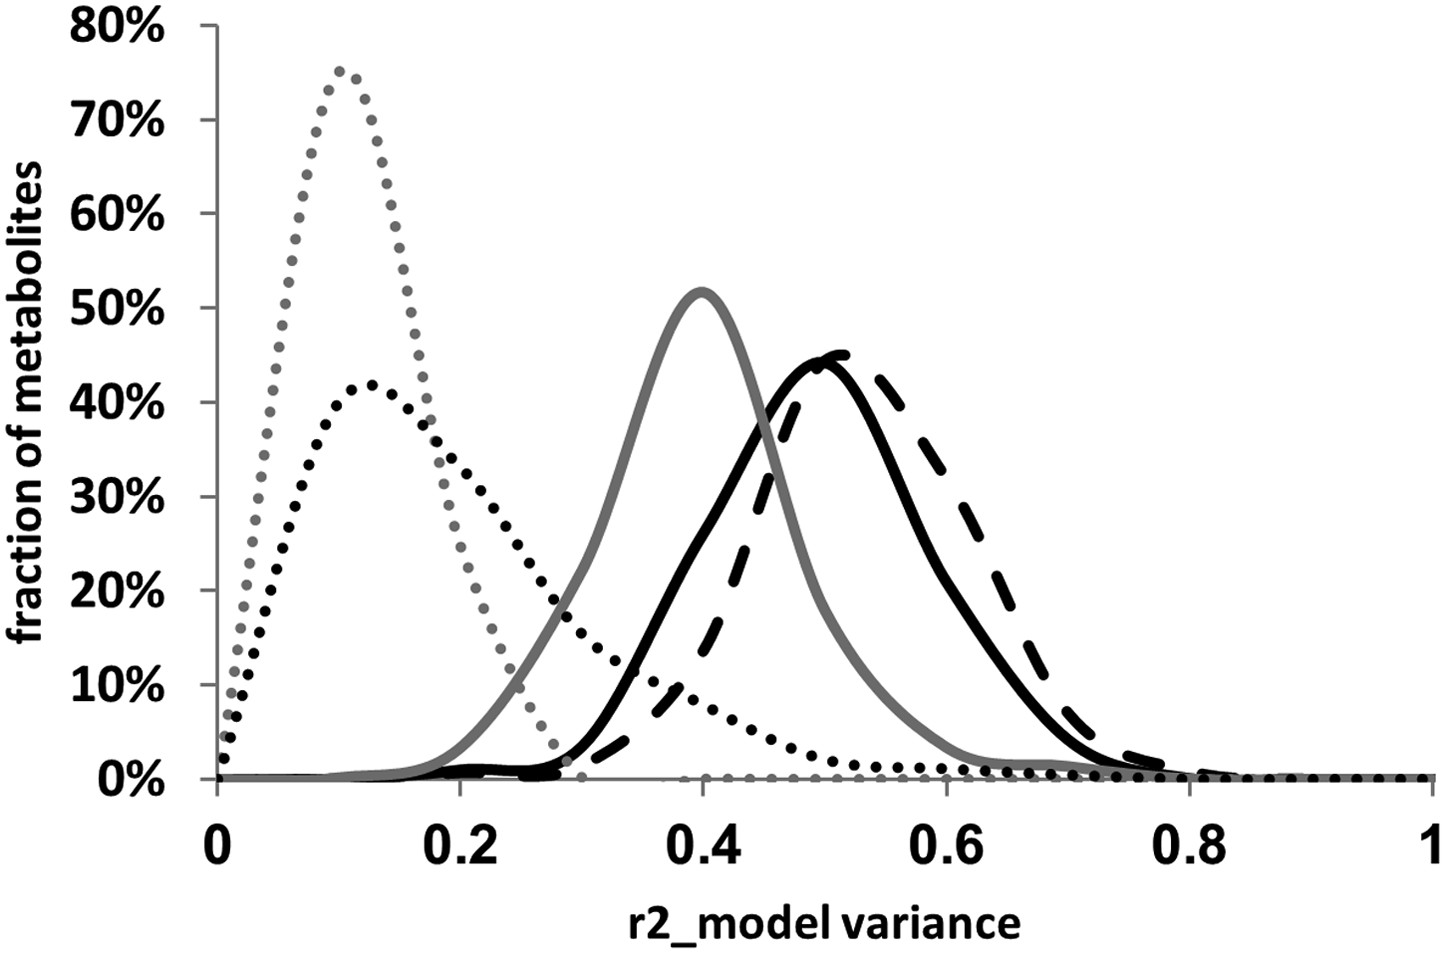
Distribution of estimated variance between main effects and epistatic interactions.
The cytoplasmic term was added or dropped from the different statistical models to compare the total variance explained by each model for each metabolite. Dotted lines show estimated variance using solely the main effect loci without interactions (additive model), solid lines show the distribution of estimated variance across the metabolites using the pairwise epistasis model while the dashed lines are the results for the three-way epistasis model including the most prevalent three-way interactions as indicated by the epistatic network. The gray lines show the models with only the nuclear loci while the black lines show the model with the nuclear and cytoplasmic loci. For the frequency plot, bin size is 0.025 r2.
Figure 9 with 7 supplements
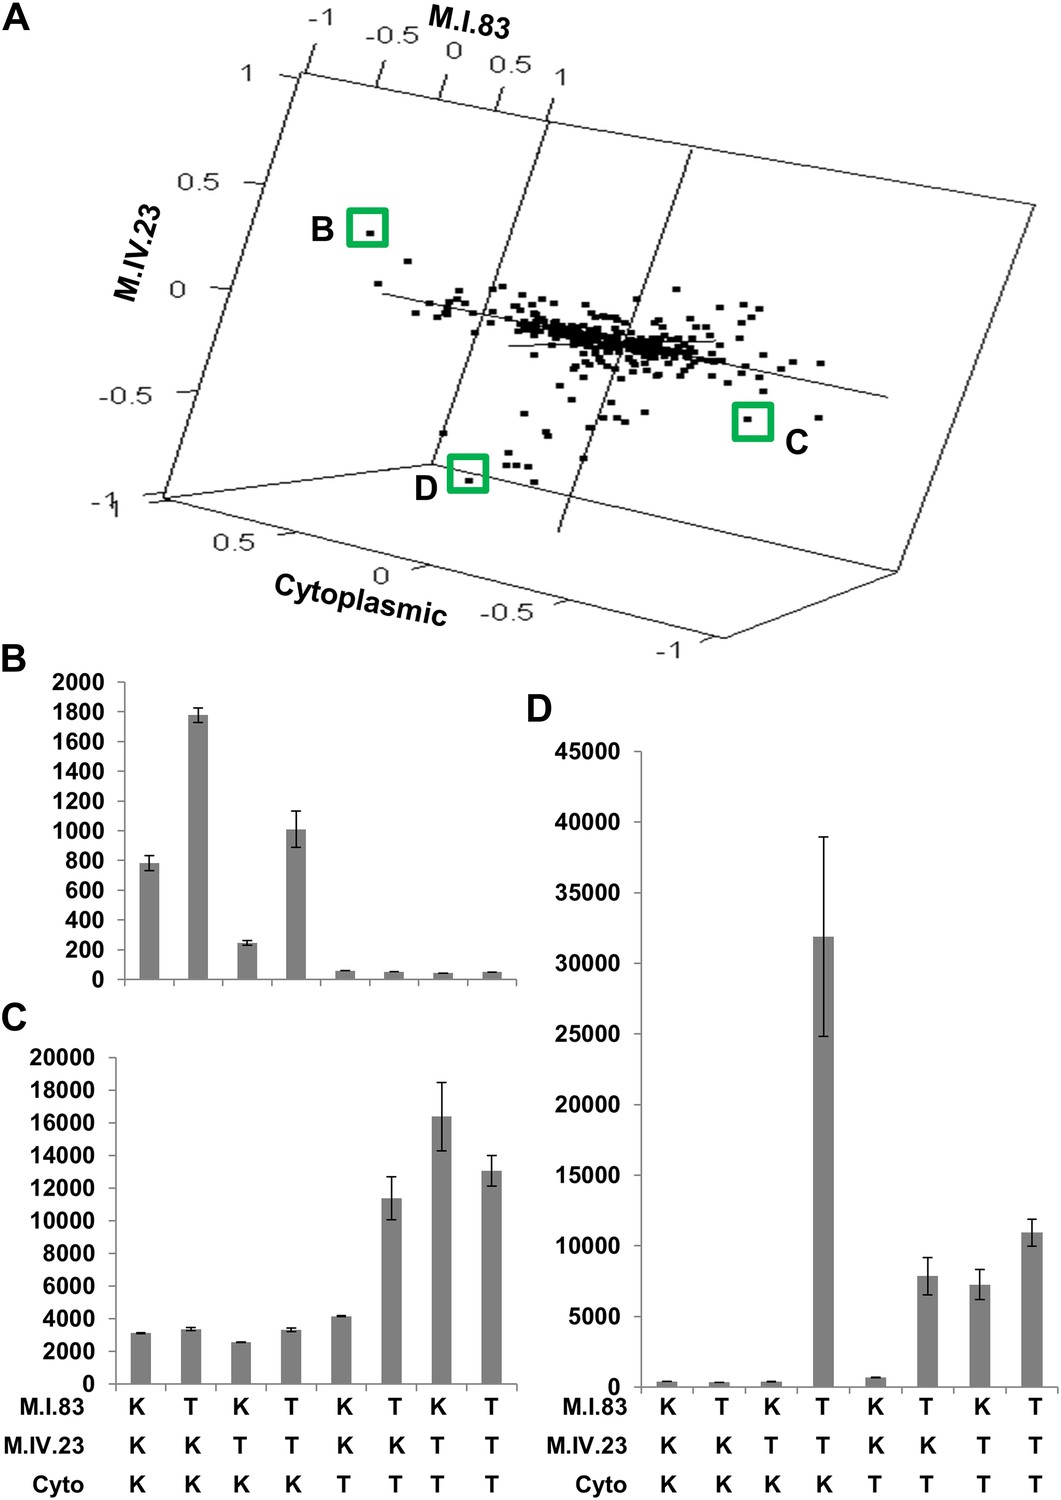
The cytoplasmic background alters nuclear epistatic interactions.
The analysis of the M.IV.23 × M.I.83 × cytoplasmic three-way epistatic interaction is shown for all significantly affected metabolites. All other metabolite distributions for three-way epistatic combinations are plotted in Figure 9—figure supplements 1–3. (A) The center of mass calculations were used to estimate the phenotypic center for each metabolite that shows a significant three-way epistasis with the M.IV.23, M.I.83 and cytoplasmic genetic variation. All significant metabolites are plotted as unique points. The specific metabolites boxed and labeled show the location of the metabolites shown in parts, B, C and D respectively. For each locus, the Kas allele is plotted at 1 while Tsu is −1. (B) Effect of the M.IV.23 × M.I.83 × cytoplasmic epistasis upon the accumulation of unknown 227710. Average and standard error are shown. (C) Effect of the M.IV.23 × M.I.83 × cytoplasmic epistasis upon the accumulation of pyruvate. Average and standard error are shown. (D) Effect of the M.IV.23 × M.I.83 × cytoplasmic epistasis upon the accumulation of salicylic acid. Average and standard error are shown.
Figure 9—figure supplement 1
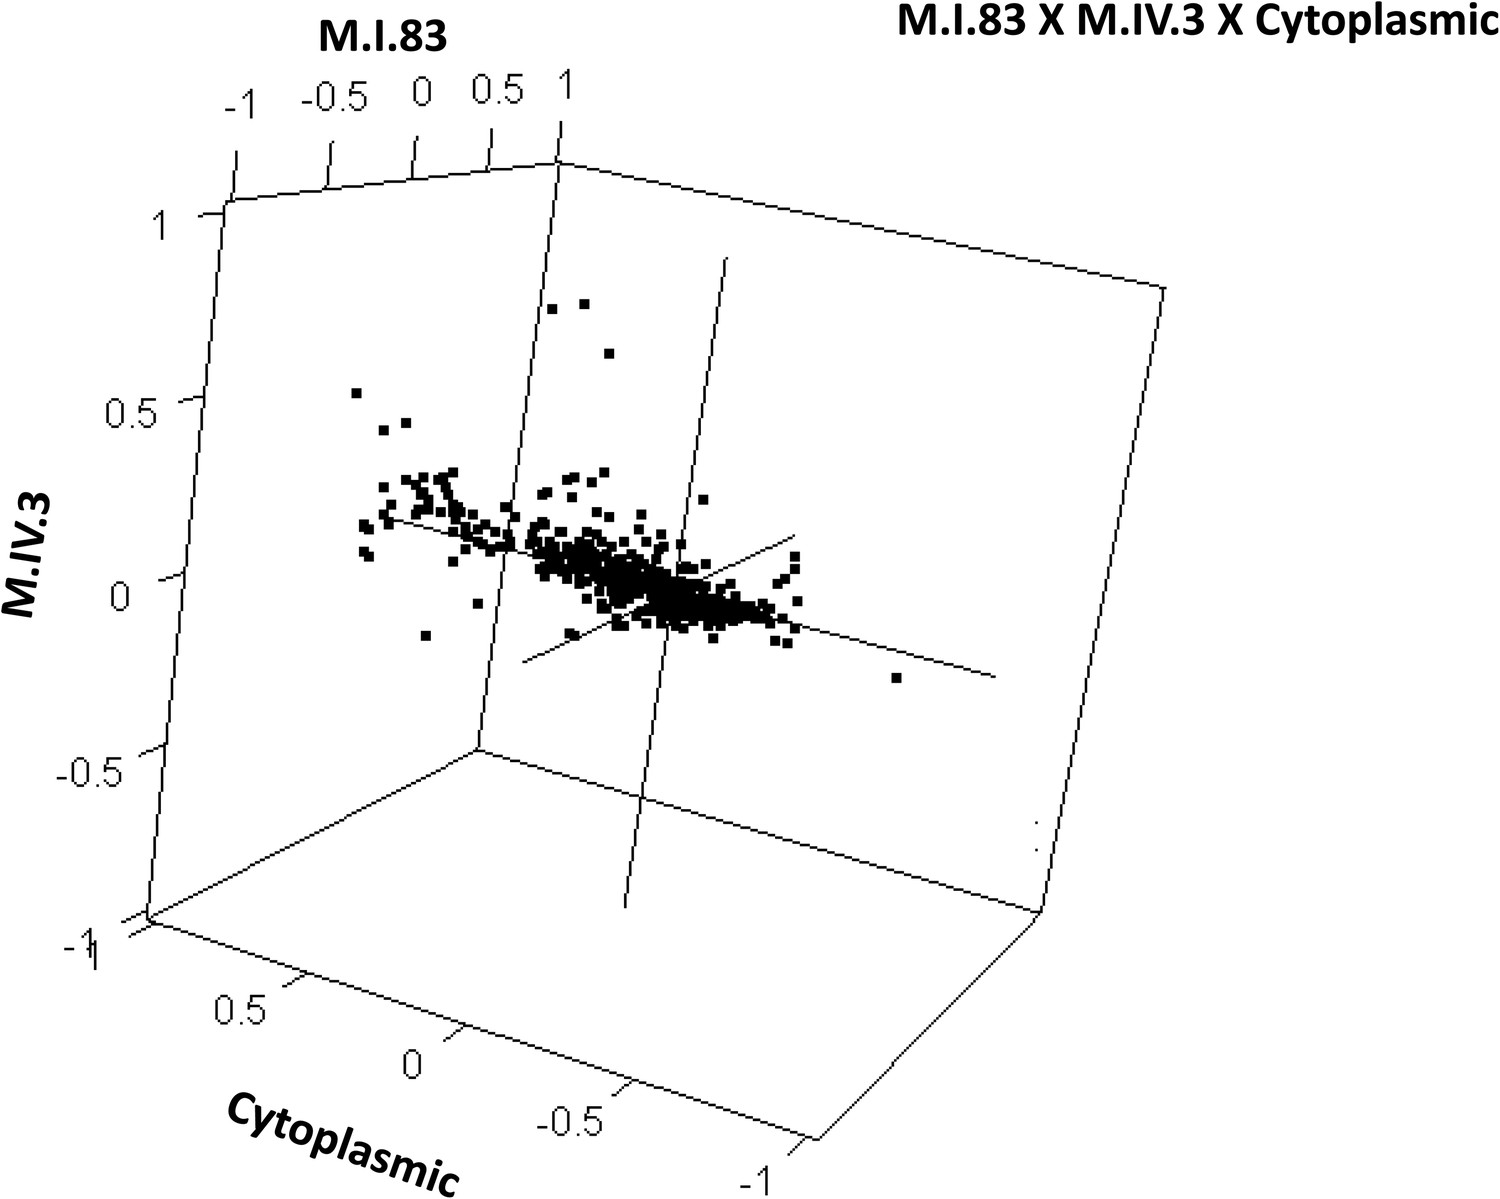
Distribution of phenotypic centers of metabolites significantly affected by M.I.83 × M.IV.3 × cytoplasmic three-way epistatic interaction.
The page shows the distribution of phenotypic centers of metabolites significantly affected by three way epistatic interactions. Of the 10 three-way interactions involving cytoplasmic loci that were tested, only the interactions showing significant epistasis for 10% or more metabolites are shown. All significant metabolites are plotted as unique points. For each locus, the Kas allele is plotted at 1 while Tsu is −1.
Figure 9—figure supplement 2
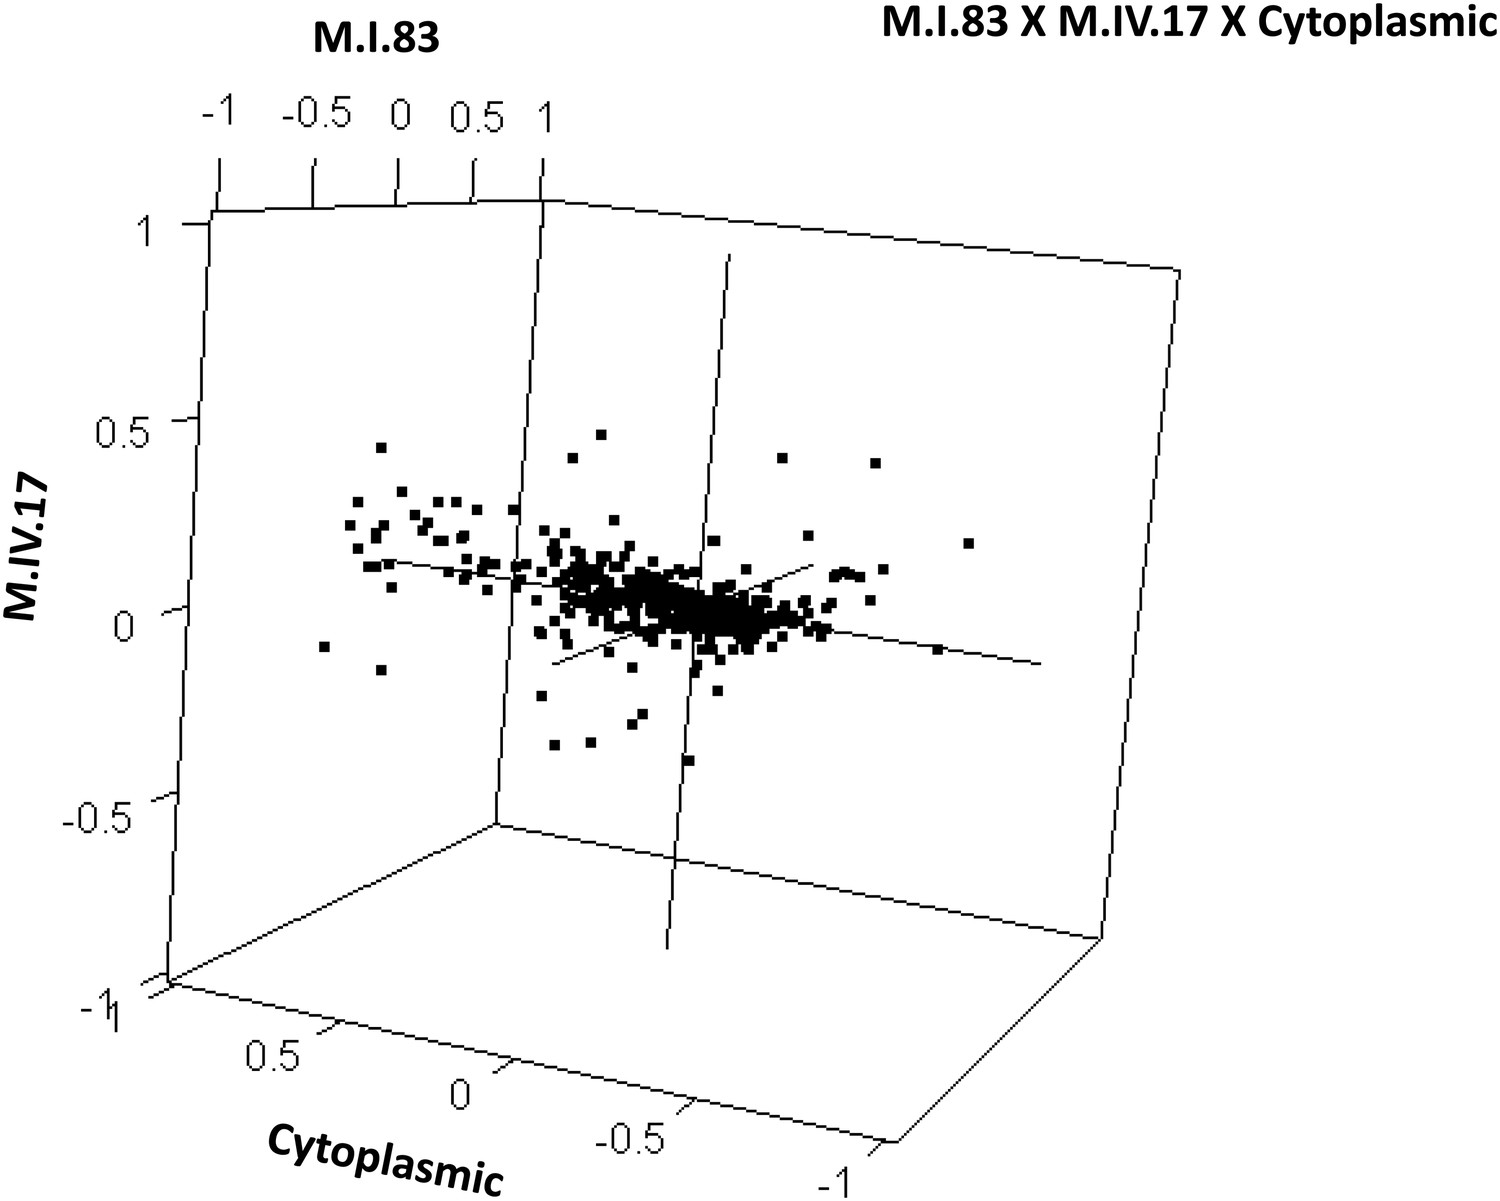
Distribution of phenotypic centers of metabolites significantly affected by M.I.83 × M.IV.17 × cytoplasmic three-way epistatic interaction.
The page shows the distribution of phenotypic centers of metabolites significantly affected by three-way epistatic interactions. Of the 10 three-way interactions involving cytoplasmic loci that were tested, only the interactions showing significant epistasis for 10% or more metabolites are shown. All significant metabolites are plotted as unique points. For each locus, the Kas allele is plotted at 1 while Tsu is −1.
Figure 9—figure supplement 3

Distribution of phenotypic centers of metabolites significantly affected by M.I.83 × M.V.82 × cytoplasmic three-way epistatic interaction.
For all metabolites that were epistatically affected by M.I.83 × M.IV.23 × cytoplasmic three-way interaction, hexbin plot showing change in the distribution of phenotypic centers corresponding interaction of nuclear loci M.I.83 × M.IV.23 as compared to the distribution shown in Figure 7D. The number of metabolite per hexbin is shown in the legend to the right of the graph. Center of mass calculations were used to estimate the phenotypic center for each metabolite that was significantly affected by the given interaction. The hexbin plots show the distribution of phenotypic centers for all significant metabolites.
Figure 9—figure supplement 4
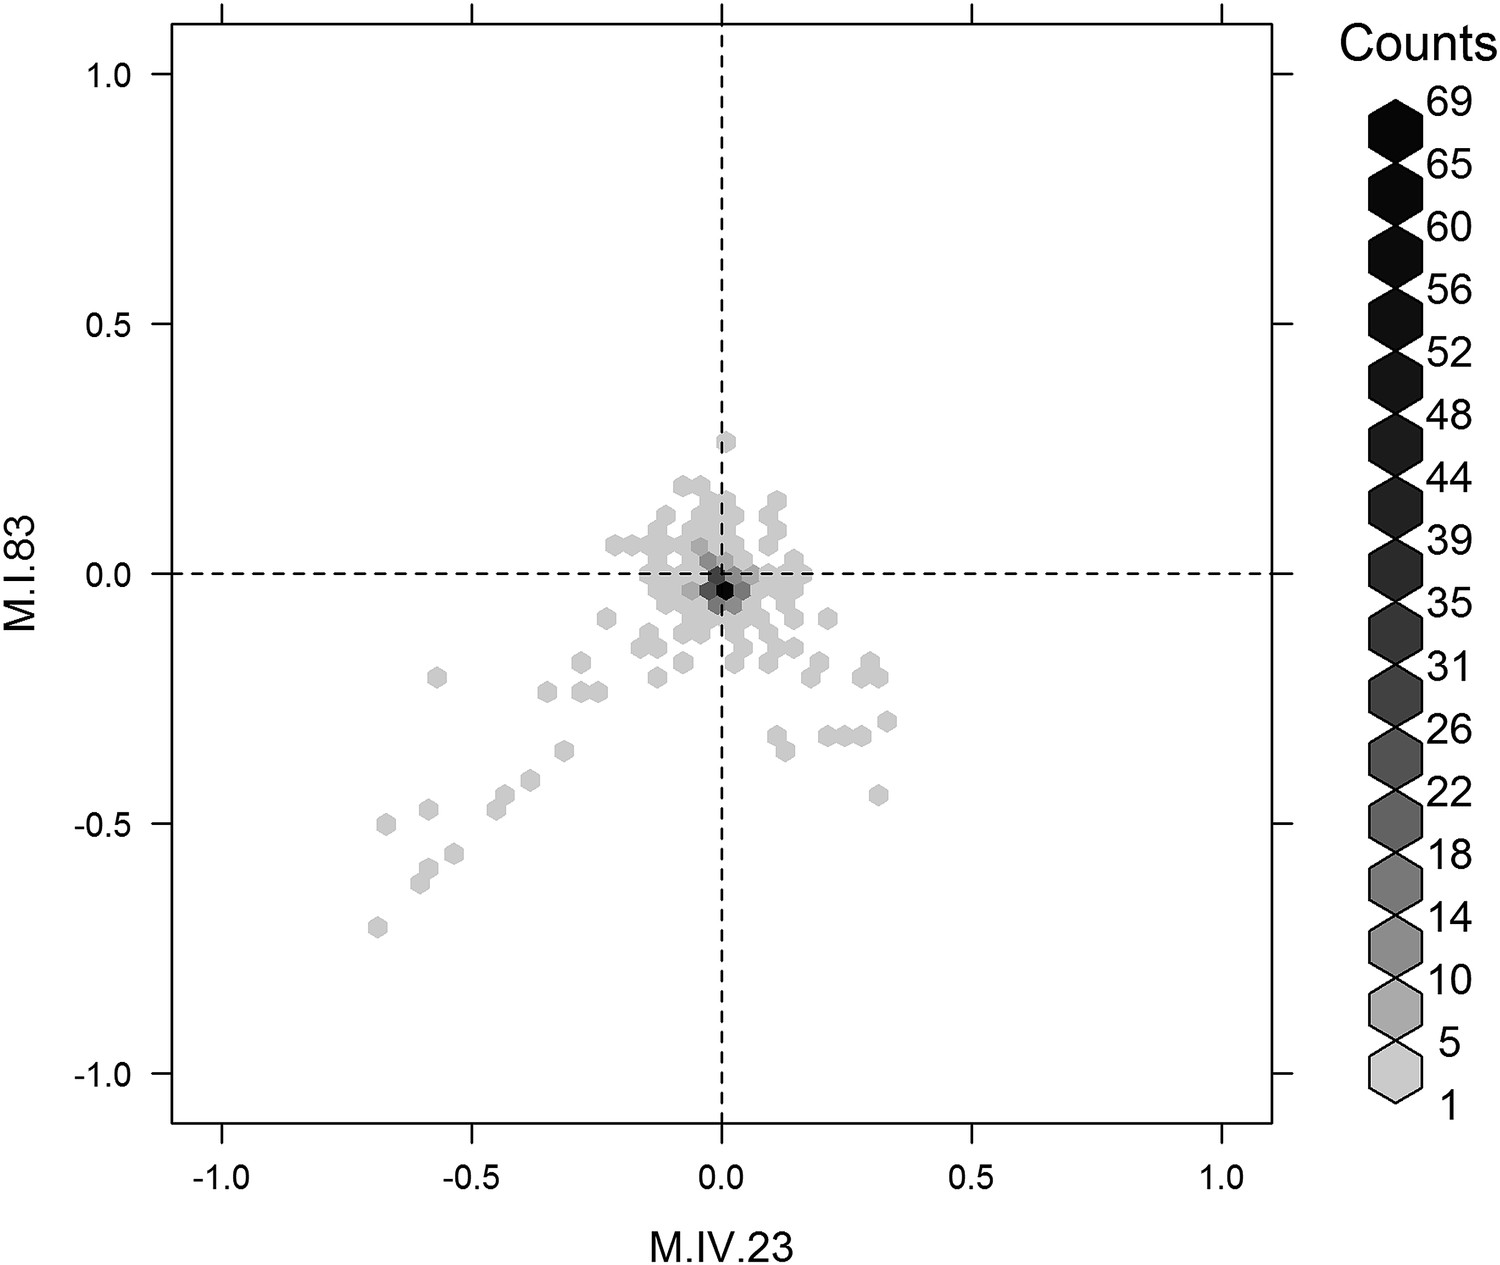
Distribution of phenotypic centers of metabolites significantly affected by M.I.83 × M.IV.23 × cytoplasmic three-way epistatic interaction.
For all metabolites that were epistatically affected by M.I.83 × M.IV.23 × cytoplasmic three-way interaction, hexbin plot showing change in the distribution of phenotypic centers corresponding interaction of nuclear loci M.I.83 × M.IV.23 as compared to the distribution shown in Figure 7D. The number of metabolite per hexbin is shown in the legend to the right of the graph. Center of mass calculations were used to estimate the phenotypic center for each metabolite that was significantly affected by the given interaction. The hexbin plots show the distribution of phenotypic centers for all significant metabolites.
Figure 9—figure supplement 5

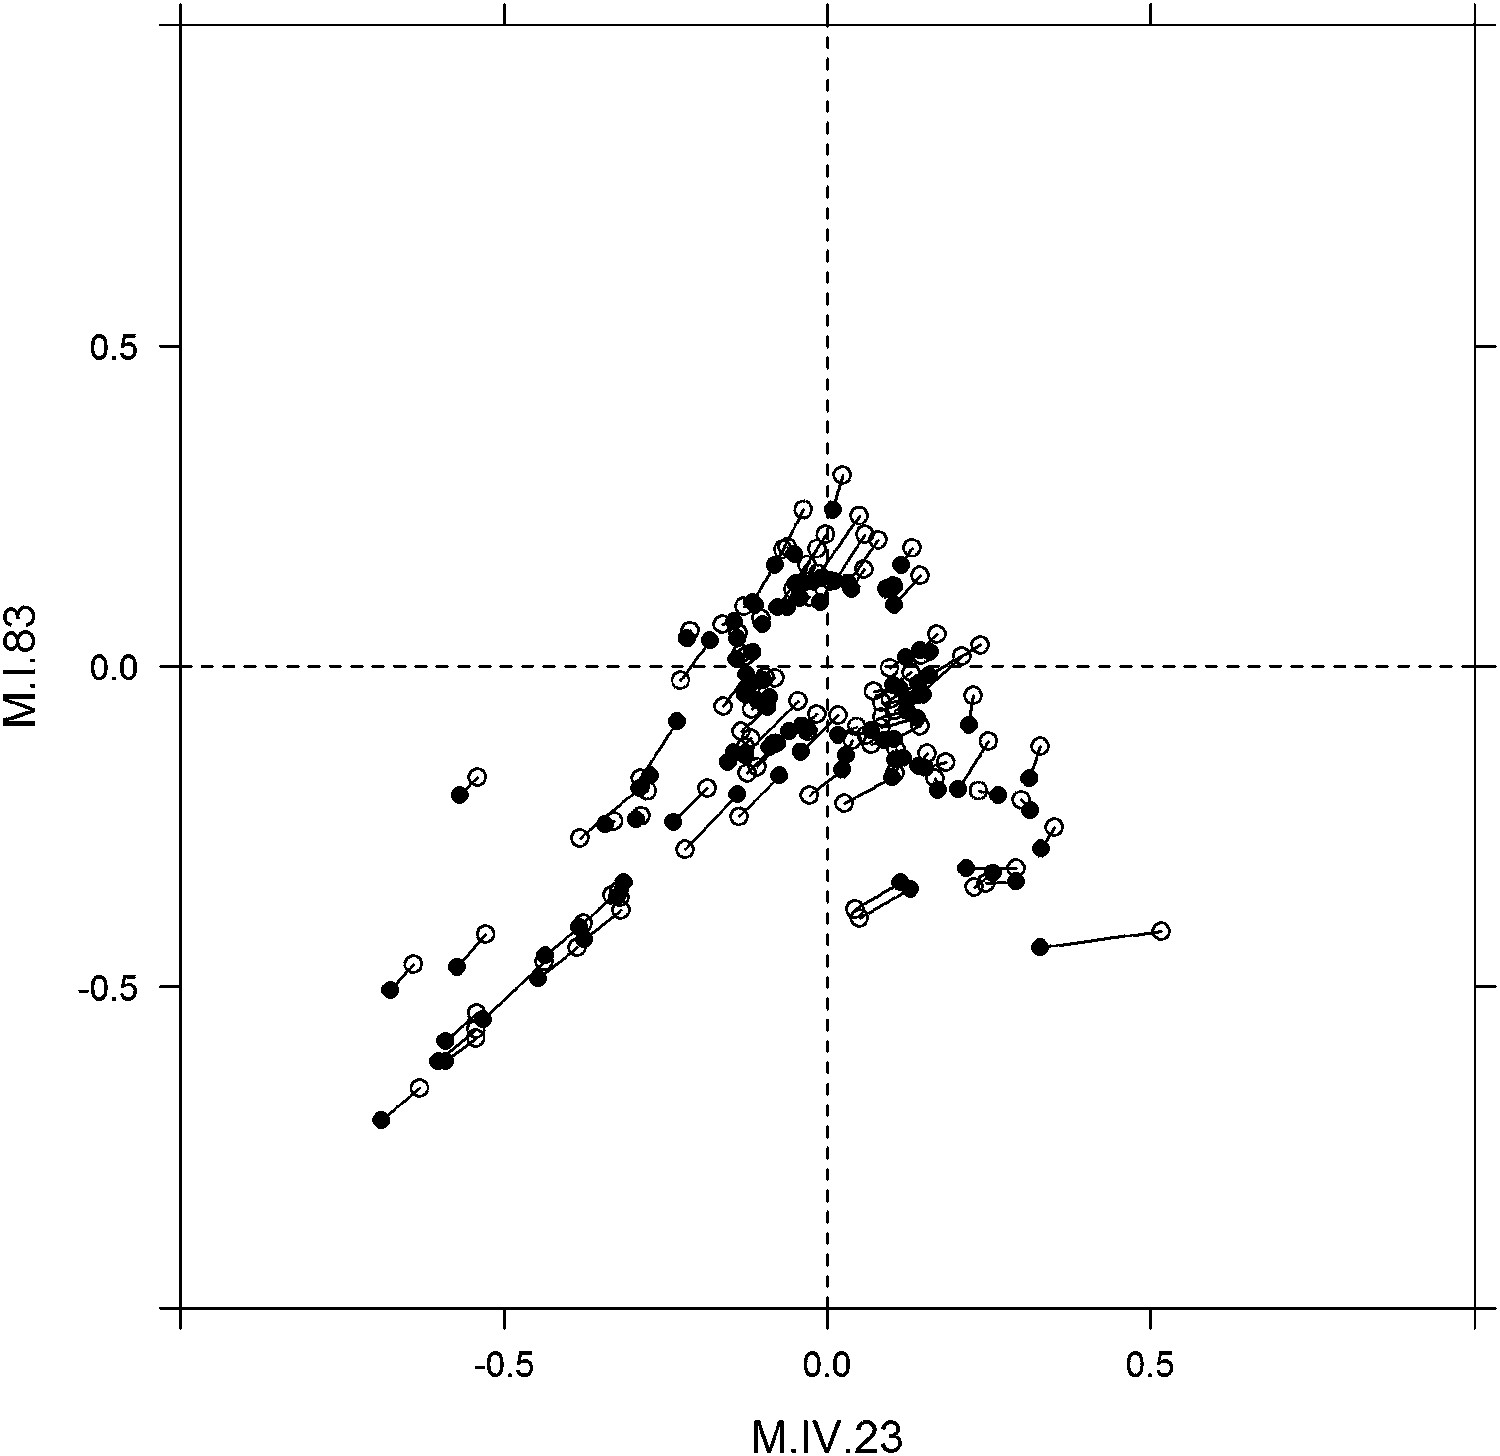
Movement of phenotypic centers of metabolites significantly affected by M.I.83 × M.IV.23 × cytoplasmic three-way epistatic interaction.
For metabolites epistatically affected by M.I.83 × M.IV.23 × cytoplasmic three-way interaction, we plotted the center of phenotypes corresponding to interaction of nuclear loci M.I.83 × M.IV.23 as estimated using the three-way epistasis and pairwise epistasis models. For each metabolite, open diamonds indicate the center of phenotype estimated using the pairwise epistasis model while closed diamonds indicate the estimated location using the three-way epistasis model. For each metabolite the pairwise and three-way center of phenotypes are connected by a line to indicate the change in location.
Figure 9—figure supplement 6
Long range movement of phenotypic centers of metabolites significantly affected by M.I.83 × M.IV.23 × cytoplasmic three-way epistatic interaction.
For metabolites epistatically affected by M.I.83 × M.IV.23 × cytoplasmic three-way interaction, we plotted the center of phenotypes corresponding to interaction of nuclear loci M.I.83 × M.IV.23 as estimated using the three-way epistasis and pairwise epistasis models. For each metabolite, open diamonds indicate the center of phenotype estimated using the pairwise model while closed diamonds indicate the estimated location using the three-way model. For each metabolite the pairwise and three-way center of phenotypes are connected by a line to indicate the change in location. Only those metabolites whose centers of phenotypes are located farther than 0.1 from the origin are provided to increase visual resolution.
Figure 9—figure supplement 7
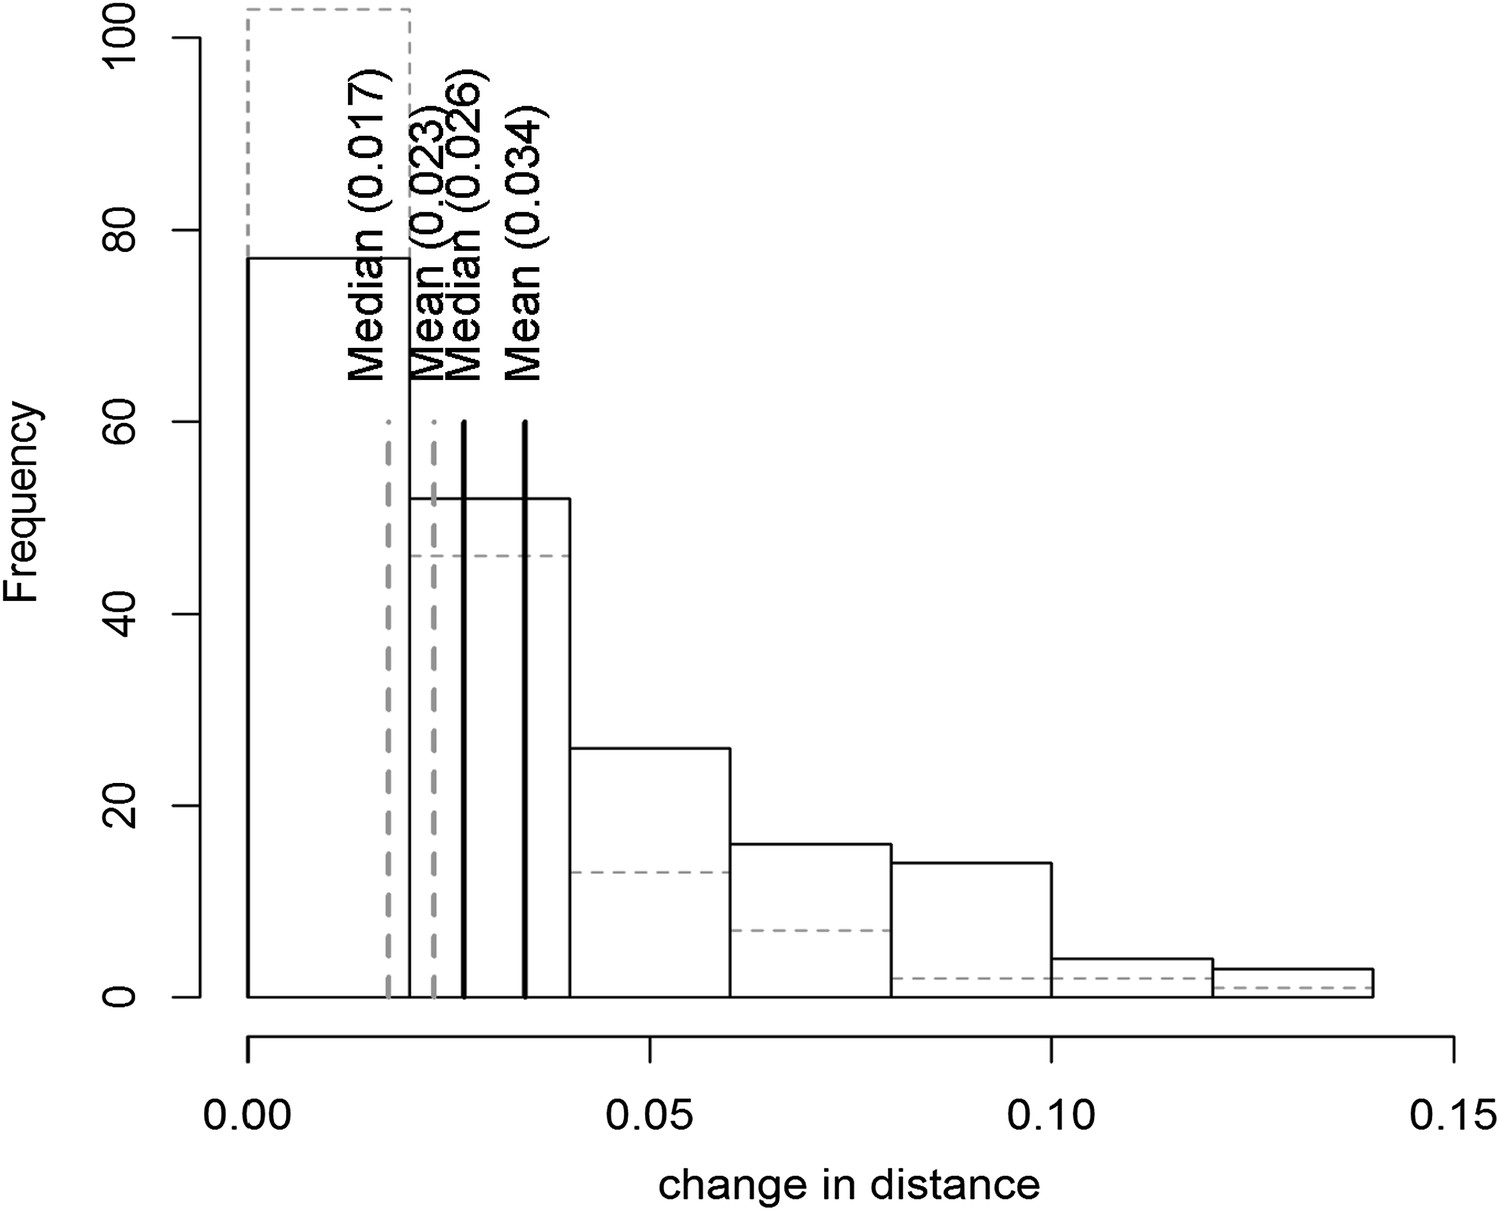
Distribution of phenotypic center of metabolites significantly affected by M.I.83 × M.IV.23 × cytoplasmic three-way epistatic interaction.
For metabolites epistatically affected by M.I.83 × M.IV.23 × cytoplasmic three-way interaction, we measured the change in distance from the (1,1) point to test if the inclusion of the cytoplasmic genotype has a uniform shift upon the phenotype of the affected metabolites. The histogram with the gray dashed border shows the frequency distribution of metabolites that decreased the distance from the point (1,1) when comparing the three-way to pairwise position. The histogram with black solid border shows the frequency distribution of metabolites that increased the distance. The respective mean and median for each class are shown in the respective lines.
Download links
A two-part list of links to download the article, or parts of the article, in various formats.
Downloads (link to download the article as PDF)
Open citations (links to open the citations from this article in various online reference manager services)
Cite this article (links to download the citations from this article in formats compatible with various reference manager tools)
Cytoplasmic genetic variation and extensive cytonuclear interactions influence natural variation in the metabolome
eLife 2:e00776.
https://doi.org/10.7554/eLife.00776


