Distinct and separable roles for EZH2 in neurogenic astroglia
- University of California, San Francisco, United States
- Veterans Affairs Medical Center, University of California, San Francisco, USA
- University of California, San Francisco, USA
Figures
Figure 1 with 1 supplement
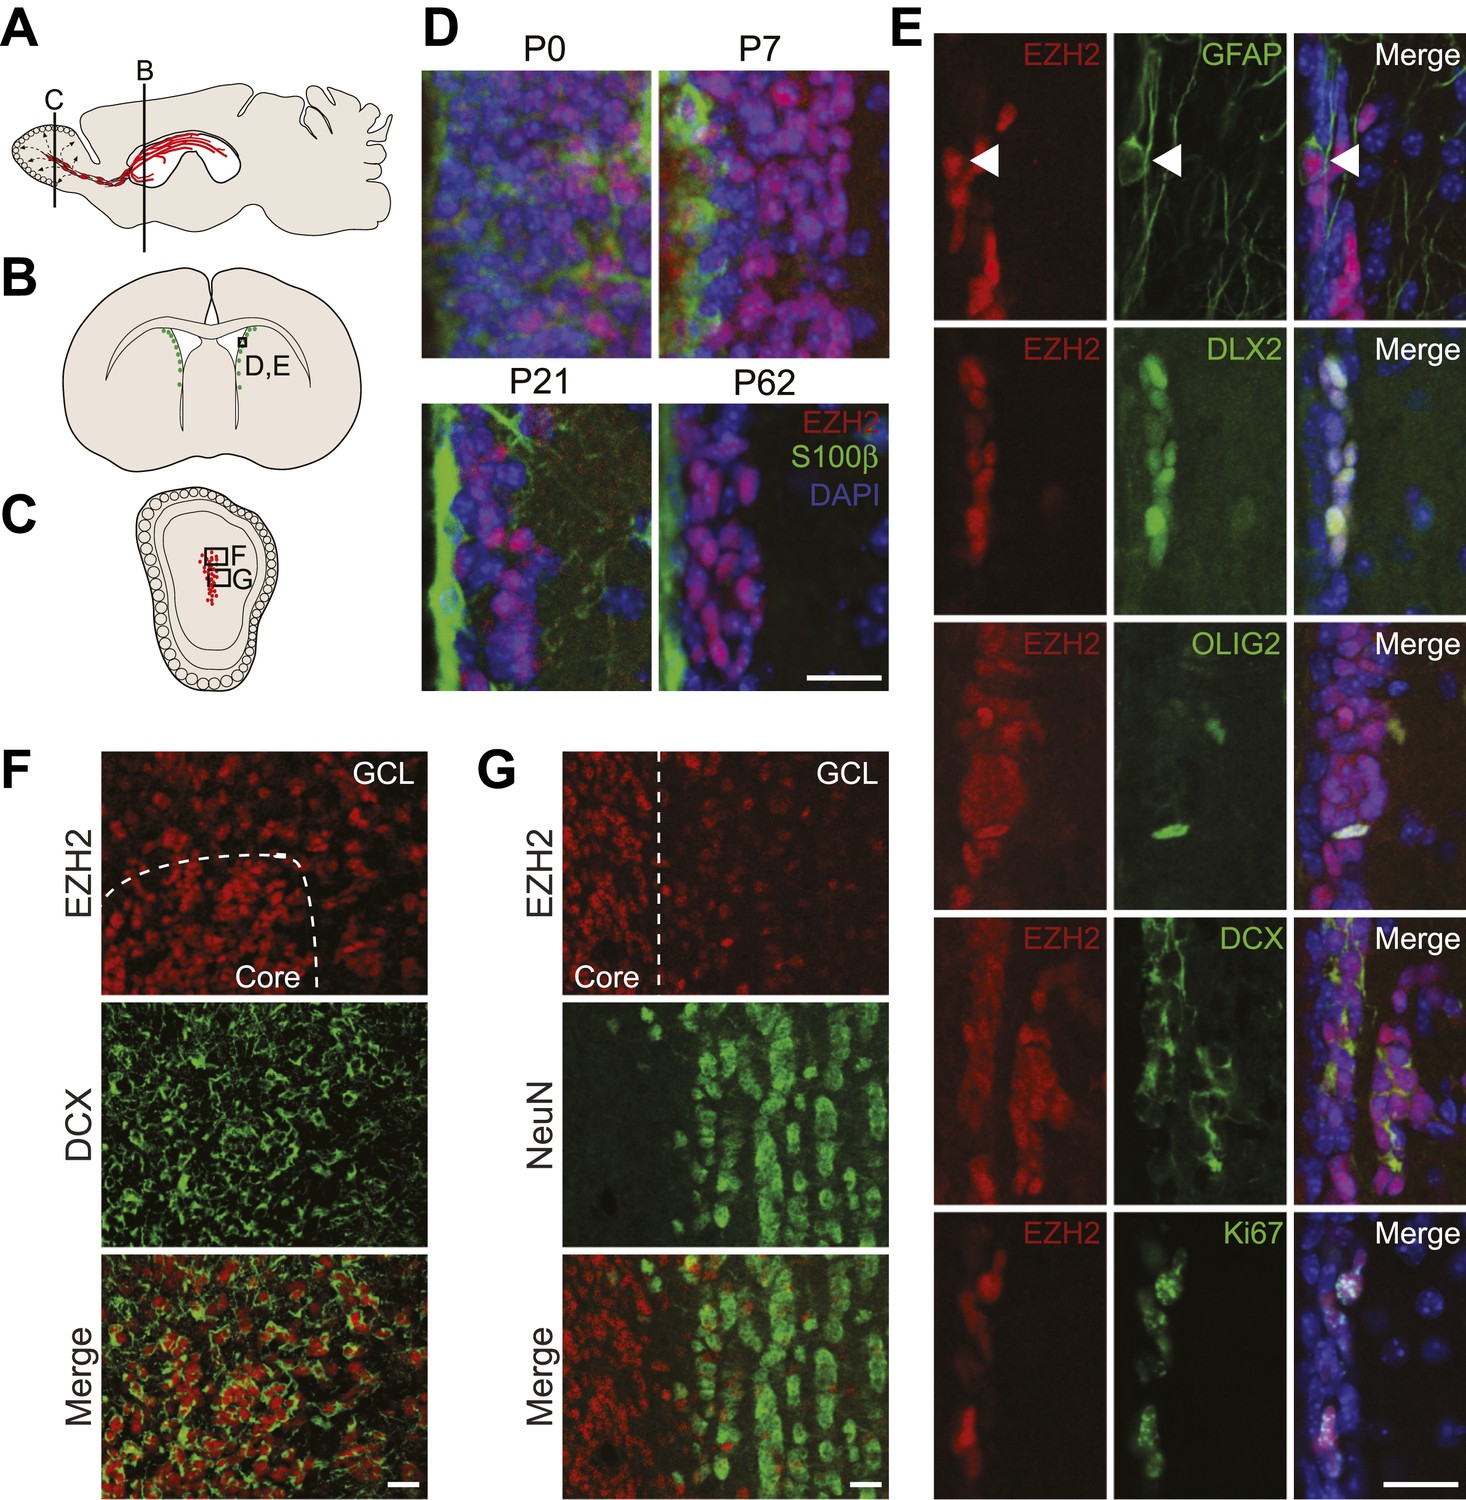
EZH2 is specifically expressed in the neurogenic SVZ lineage.
(A) Schematic of sagittal brain section depicting the RMS (red) that connects the SVZ to the OB. Lines indicate locations of Figure 1B,C. (B and C) Schematic of coronal sections through the SVZ (B) and OB (C) depicting the location of cells in the SVZ neurogenic lineage. Boxes indicate the location of subsequent images. (D) IHC analysis of the SVZ (ventricle–left; striatum–right) staining for EZH2 (red), S100β (green), and 4,6- diamidino-2-phenylindole (DAPI; blue) to label nuclei from birth (P0) through adulthood (P62). (E) Co-localization of EZH2 (red) in the SVZ (ventricle–left; striatum–right) by IHC with various markers of the SVZ neurogenic lineage (green) in P21 coronal brain sections of control animals (DAPI; blue). Arrowheads highlight a GFAP+ EZH2+ cell. (F and G) IHC co-localization of EZH2 with DCX+ neuroblasts (F) and NeuN+ neurons (G) in the OB. Dotted line indicates the boundary between the OB core and granular cell layer (GCL). Scale bars, 20 µM.
Figure 1—figure supplement 1
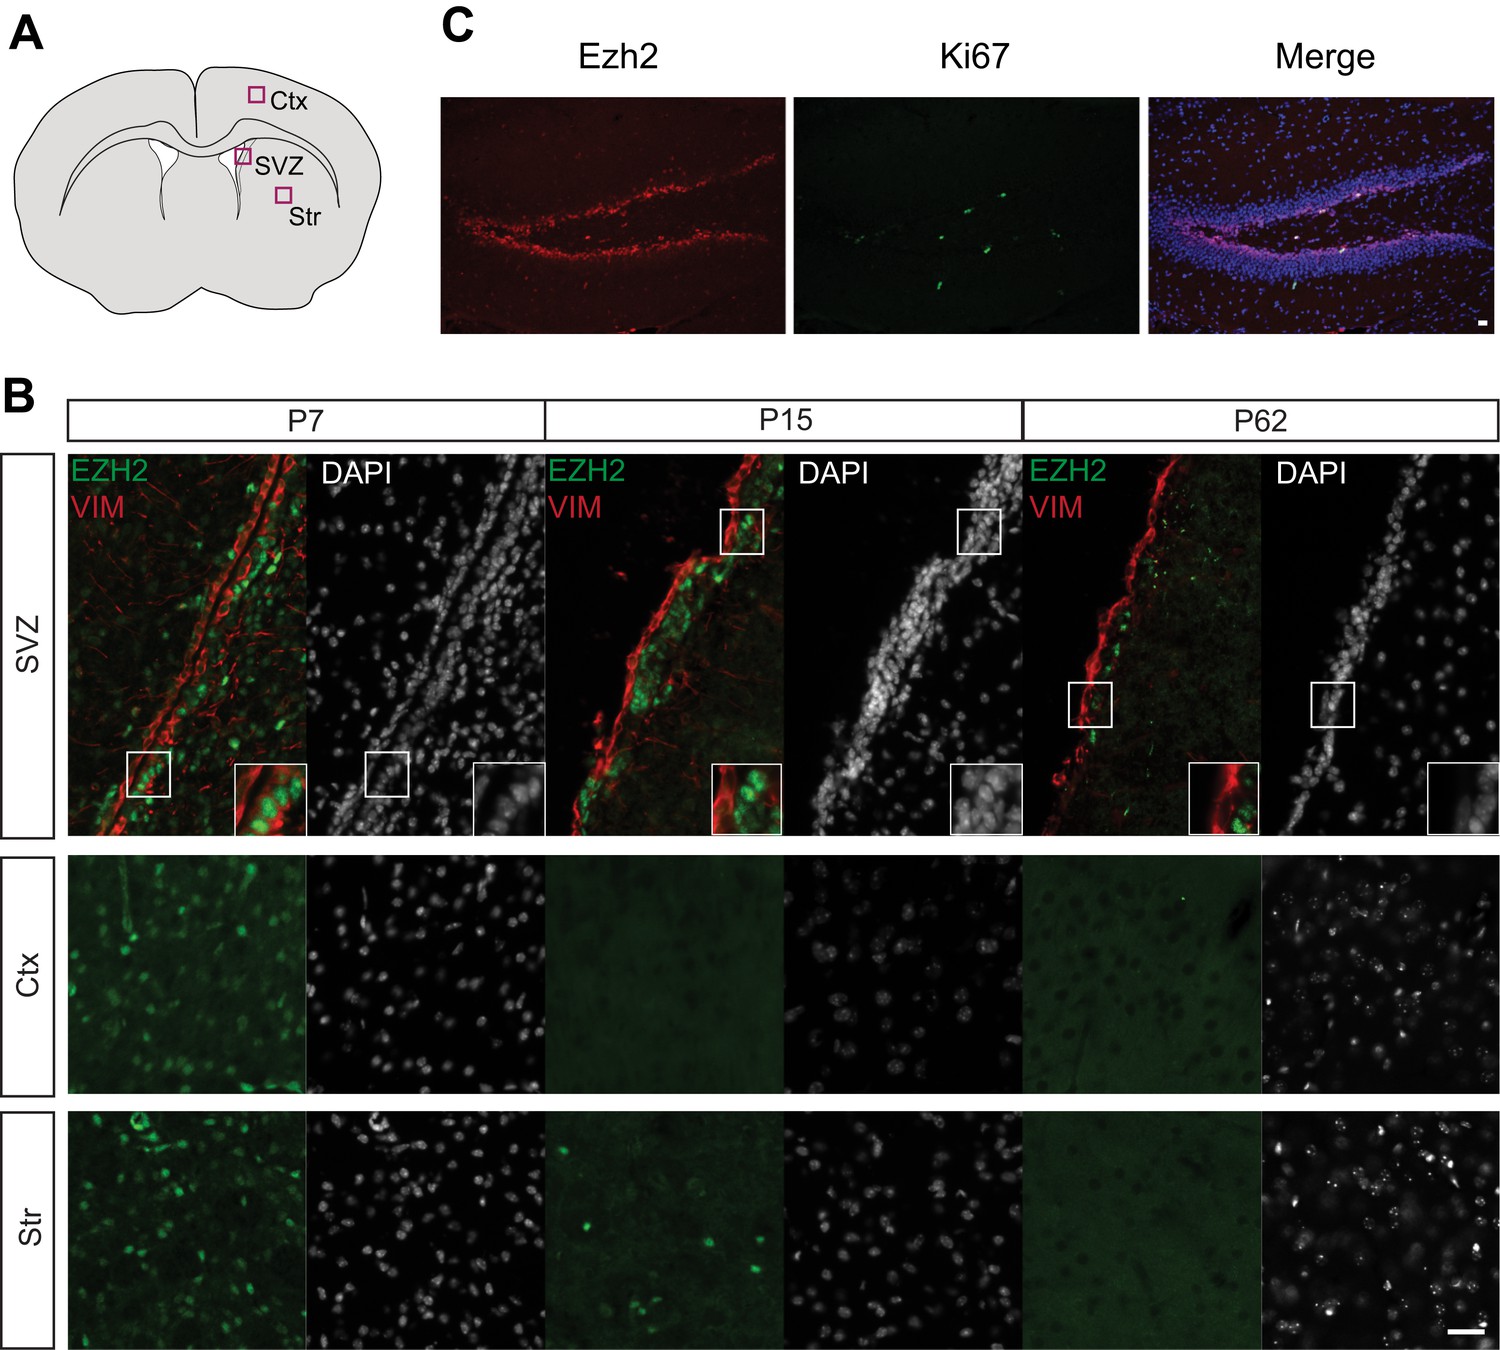
EZH2 Expression is maintained in the SVZ and SGZ but not the cortex and striatum postnatally.
(A) Schematic of coronal brain section depicting the location of images in (B). Ctx = Cortex, Str = Striatum. (B) IHC analysis of the SVZ, cortex, and striatum staining for DAPI, EZH2 and Vimentin (VIM), a marker for radial glial cells in early postnatal periods and ependymal cells from at P7, P15, and P62. (C) Co-localization of EZH2 (red) with the proliferation marker Ki67 (green) merged with DAPI (blue) in the hippocampus of P21 coronal brain sections of control animals. Scale bars, 20 µM.
Figure 2 with 3 supplements
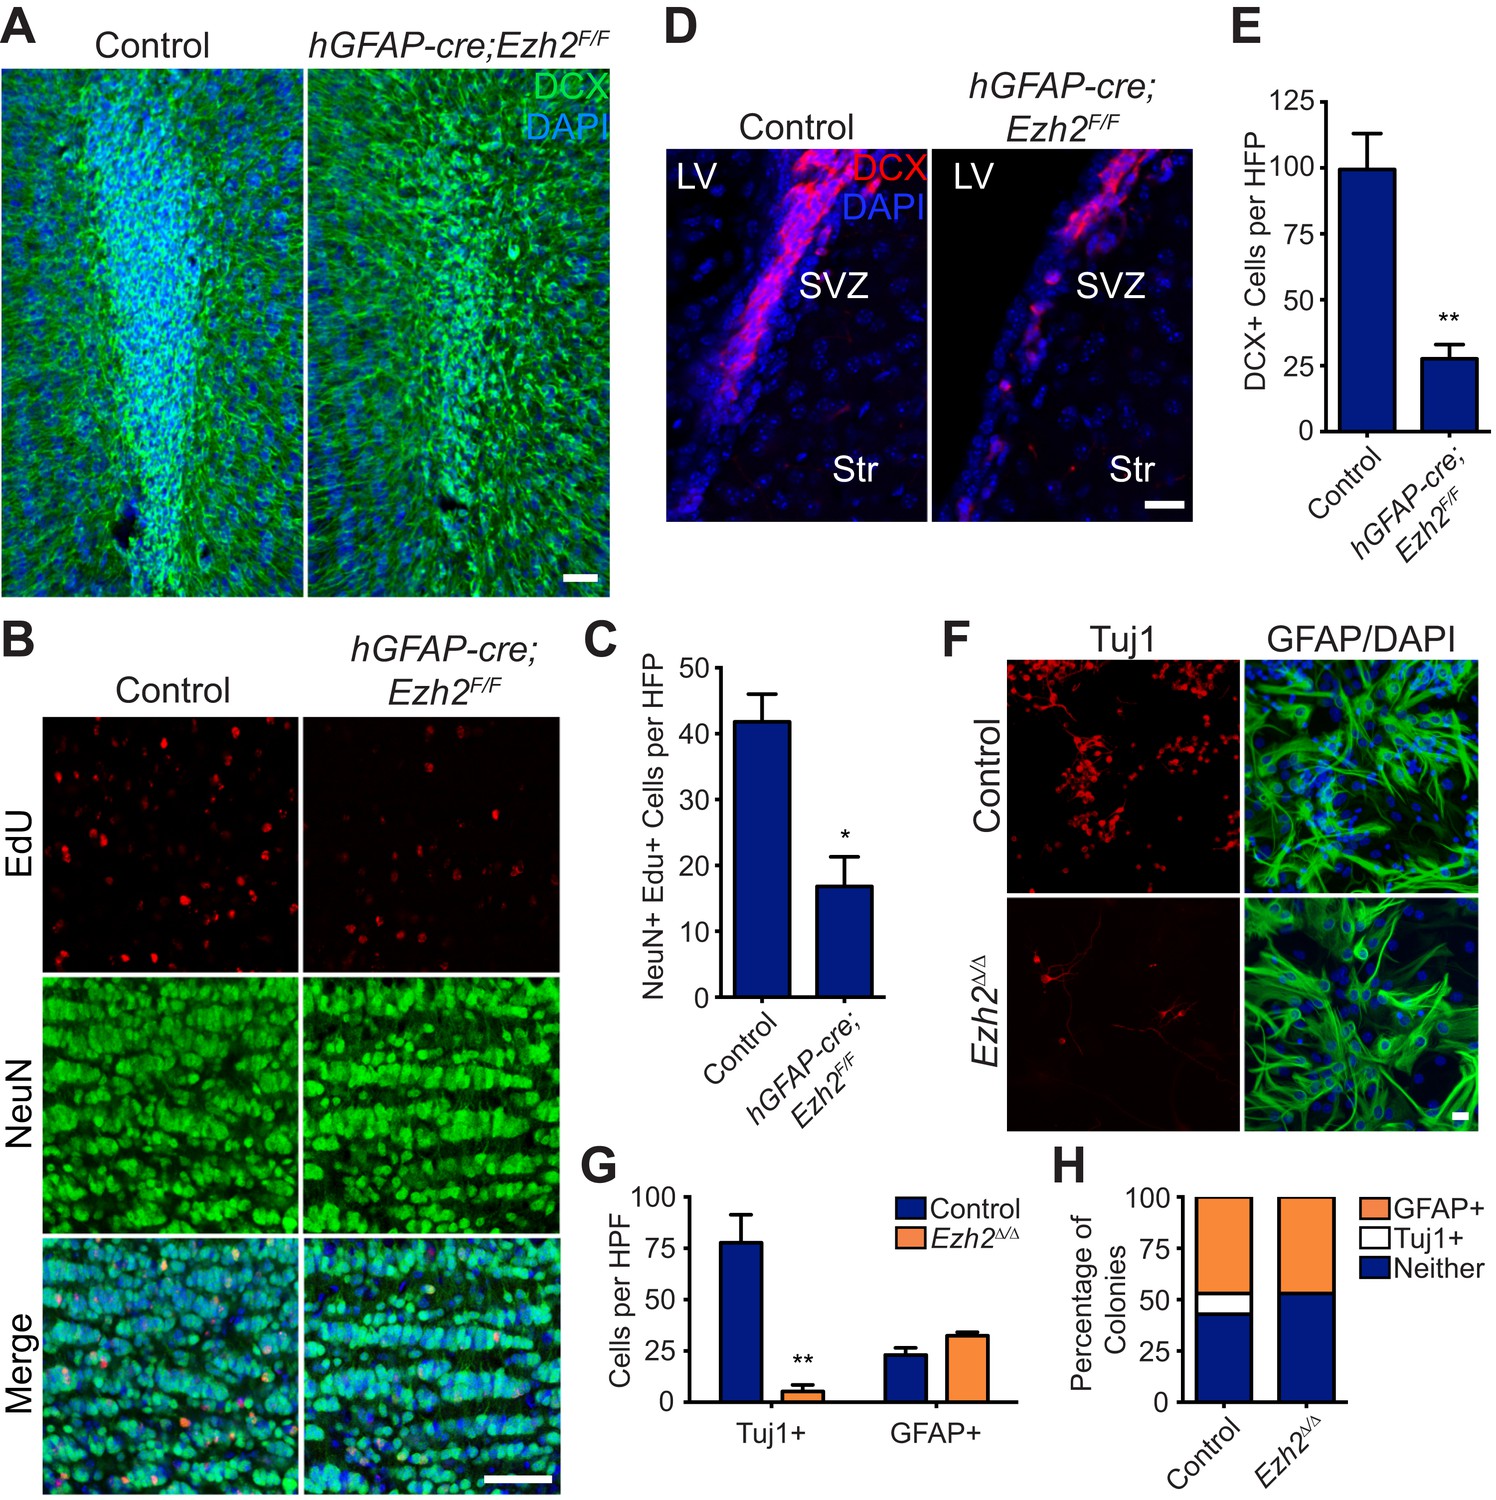
Conditional deletion of Ezh2 in SVZ NSCs both in vivo and in vitro inhibits neurogenesis.
(A) IHC for the neuroblast marker DCX (green) in P21 OB coronal sections comparing Control to hGFAP-Cre;Ezh2F/F slices. (DAPI; blue). (B and C) IHC for NeuN+ EdU+ cells in the granule cell layer of the OB (B) and quantification (C) comparing slices from P21 control to hGFAP-Cre;Ezh2F/F animals injected with Edu 10 days prior to sacrifice (*p=0.0153, n = 3). (D and E) IHC for DCX + cells in the SVZ (D) and quantification (E) comparing slices from P21 control to hGFAP-Cre;Ezh2F/F animals (**p=0.0079, n = 3). (F) ICC for the neuronal marker Tuj1 and the astrocyte marker GFAP of SVZ NSC control and Ezh2Δ/Δ cultures after 7 days of differentiation. (G) Quantification of Tuj1+ and GFAP+ cells in Ezh2-deleted (orange) and Control (blue) SVZ cultures (**p=0.0063, n = 3). (H) Quantification of ICC experiment co-staining for GFP and either GFAP (orange), Tuj1 (white), or GFP-only (blue) colonies that are established from GFP+ Control or Ezh2Δ/Δ SVZ NSCs seeded at a low density amongst wildtype, GFP- SVZ NSCs. Data are represented as ± SEM. Scale bars, 20 µM.
Figure 2—figure supplement 1

Loss of EZH2 and H3K27me3 upon conditional deletion of Ezh2 in vivo and in vitro.
(A) IHC co-localization of EZH2 (green) and H3K27me3 (red) merged with DAPI (blue) in P21 control and hGFAP-cre;Ezh2F/F animals at the SVZ, RMS, and OB. Scale bars, 50µM. (B) ICC co-localization of EZH2 (green) and H3K27me3 (red) merged with DAPI (blue) in Control and Ezh2Δ/Δ SVZ NSC cultures. Scale bars, 20 µM.
Figure 2—figure supplement 2
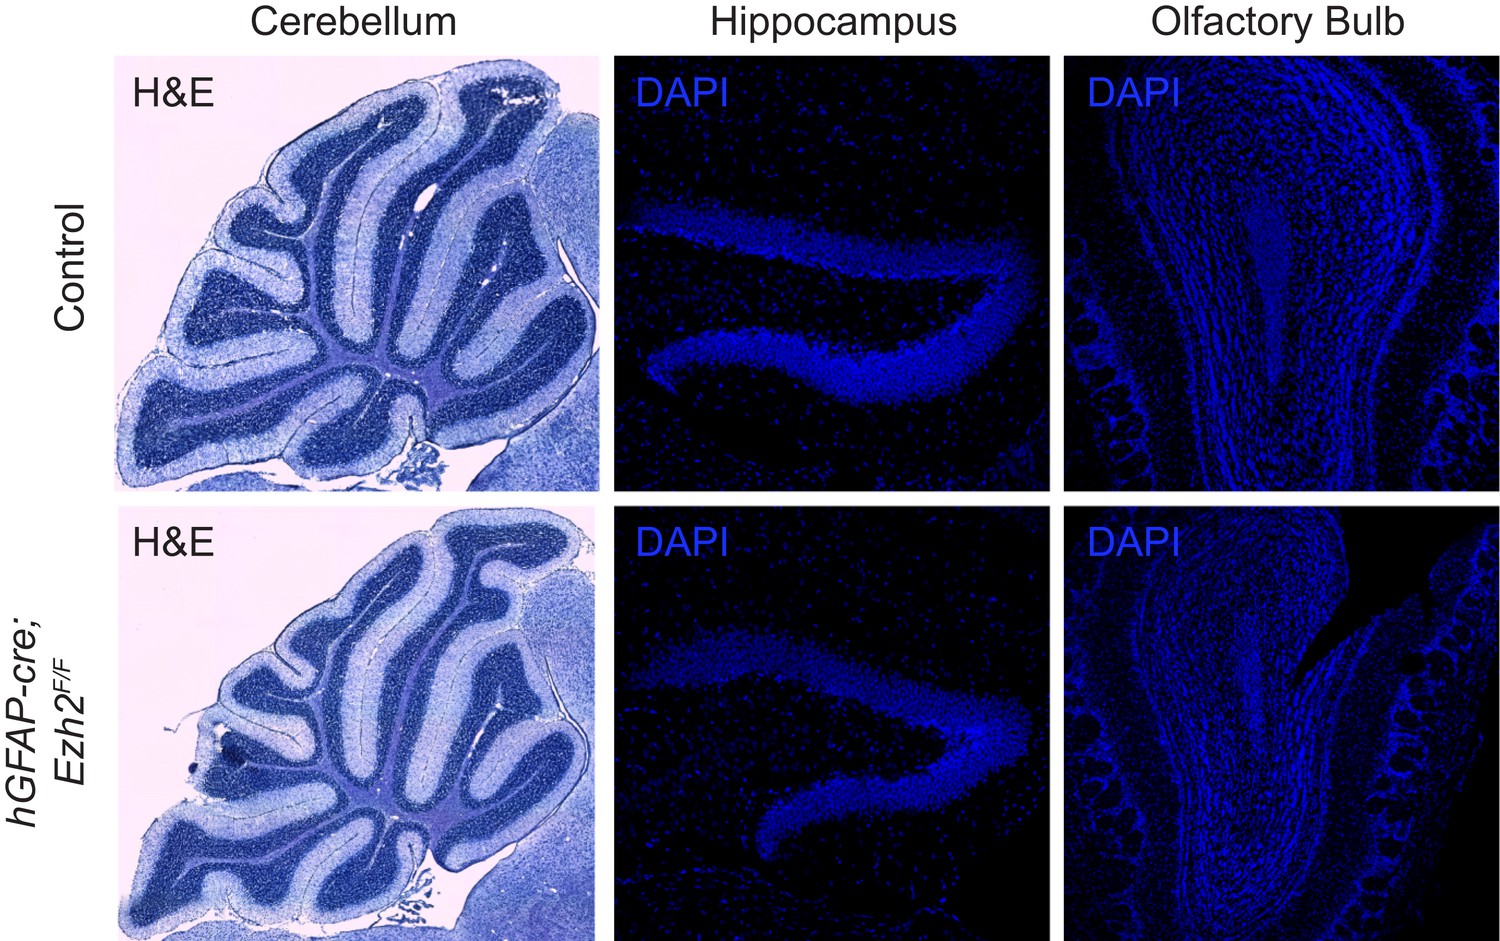
Morphology of neurogenic brain regions in Control and hGFAP-cre;Ezh2F/F animals.
Hematoxylin and eosin (H&E) or DAPI staining of brain slices from the cerebellum, hippocampus, and olfactory bulb in P21 control and hGFAP-cre;Ezh2F/F animals.
Figure 2—figure supplement 3
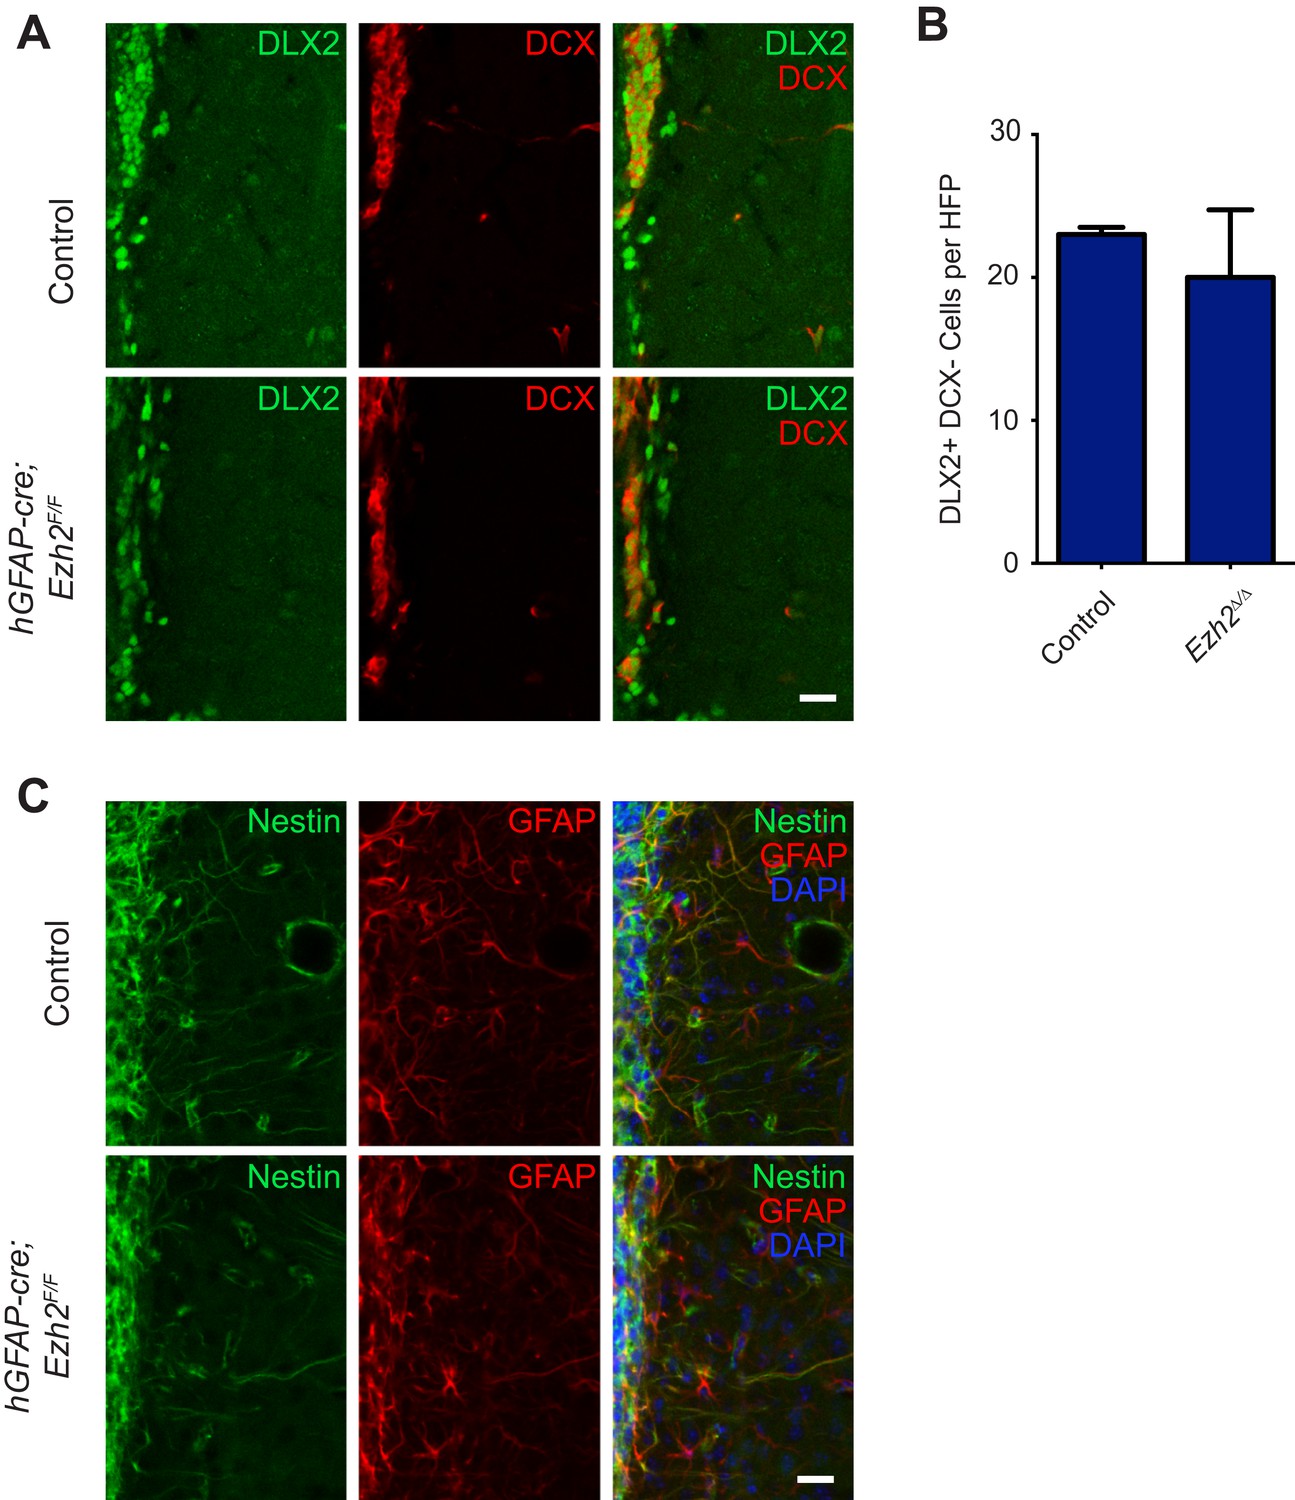
Conditional deletion of Ezh2 in SVZ NSCs does not cause defects in type C or B cells in the SVZ.
(A) IHC for the type C/A marker DLX2 (green) or type A neuroblast marker DCX (red) in P21 OB coronal sections comparing Control to hGFAP-Cre;Ezh2F/F slices. Type C cells are DLX2+ DCX−. (B) Quantification of DLX2 DCX- type C cells per hpf comparing slices from P21 control to hGFAP-Cre;Ezh2F/F animals (n = 3). (C) IHC for the type B cell markers Nestin (green) and GFAP (red) along with DAPI in P21 OB coronal sections comparing Control to hGFAP-Cre;Ezh2F/F slices. Data are represented as ± SEM. Scale bars, 20 µM.
Figure 3 with 1 supplement
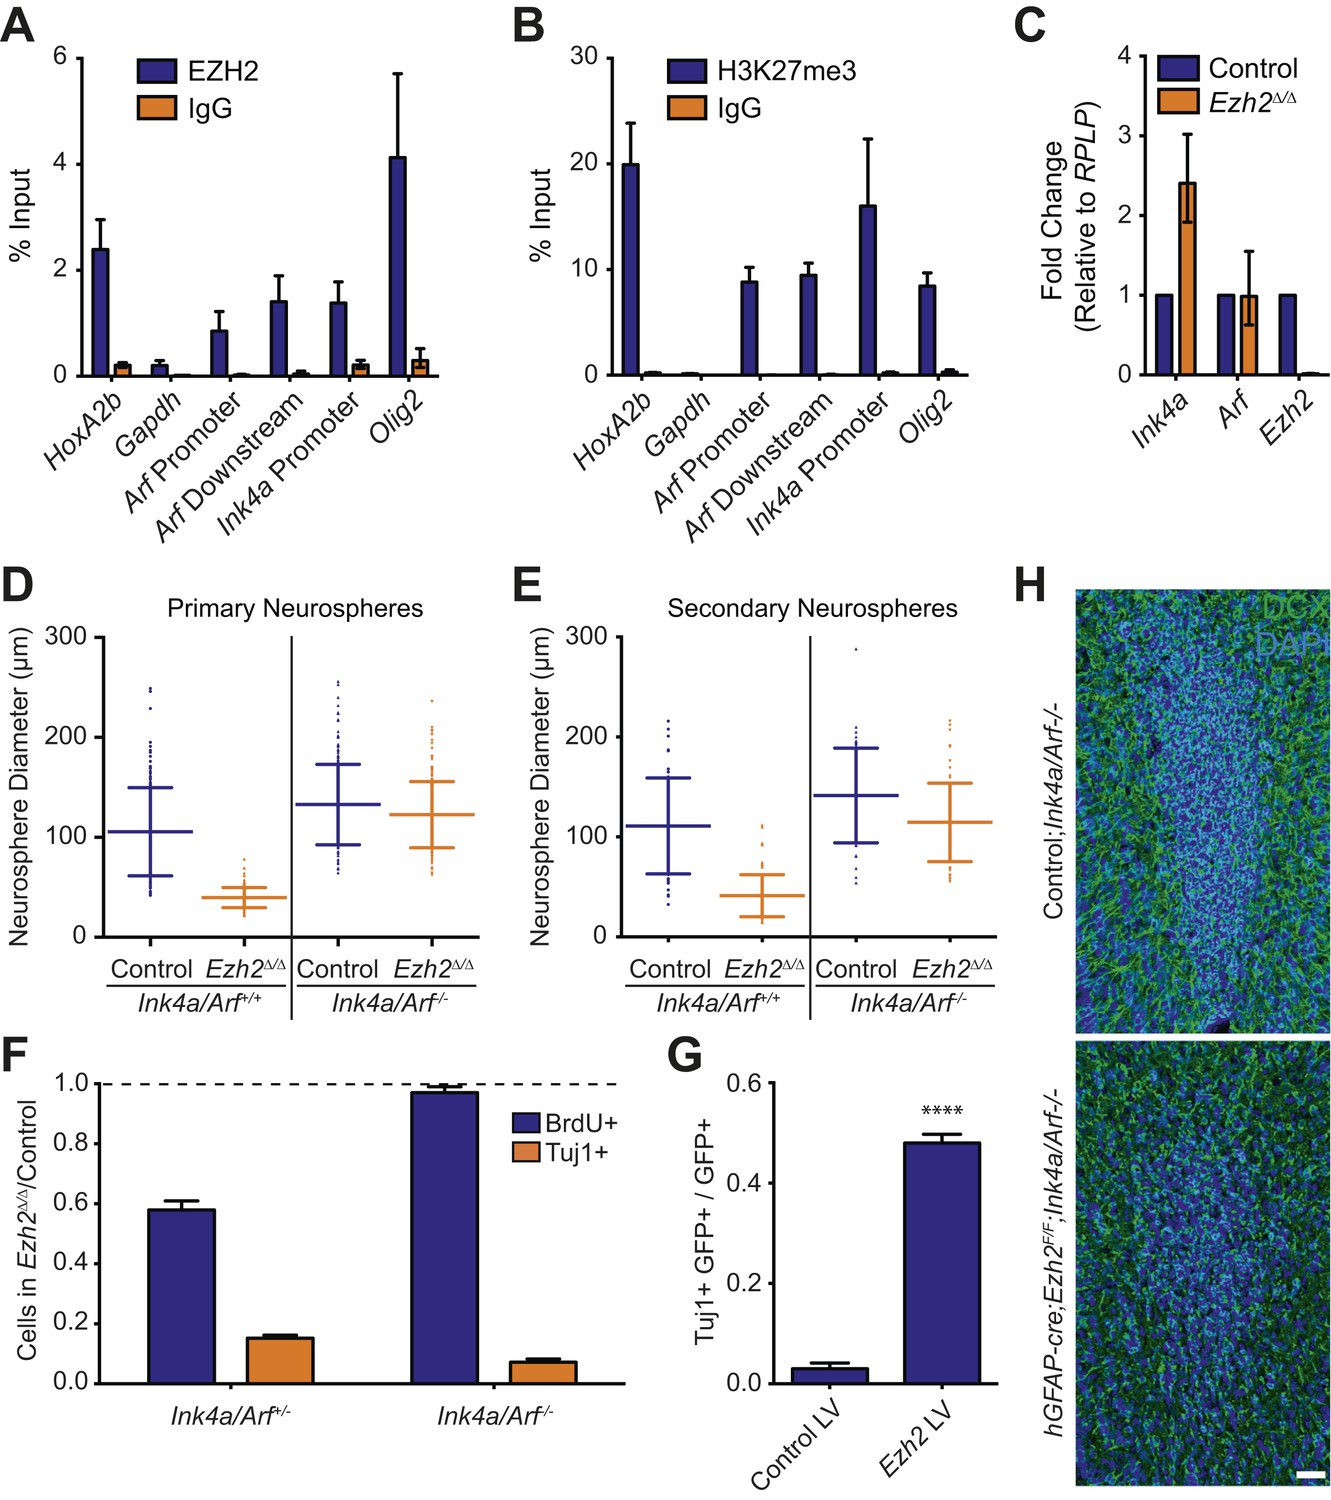
Deletion of the Ink4a/Arf locus rescues proliferation but not neurogenesis in Ezh2Δ/Δ SVZ NSCs.
(A and B) ChIP-qPCR analysis of HoxA2b (positive control), Gapdh (negative control), Arf, Ink4a, and Olig2 genomic loci pulled down by either IgG (non-specific control) or antibodies to EZH2 (A) and H3K27me3 (B) relative to input. (C) qPCR analysis of the expression levels of Ink4a, Arf, and Ezh2 relative to the expression of the RPLP control transcript in Control vs Ezh2Δ/Δ SVZ NSC cultures. (D and E) Quantification of either primary (D) or secondary (E) NS sizes grown in soft agar generated from control or Ezh2Δ/Δ SVZ NSCs in either an Ink4a/Arf+/+ or Ink4a/Arf−/− background with each dot representing a measured NS. (F) Quantification of BrdU+ and Tuj1+ cells in control and Ezh2Δ/Δ SVZ NSCs in either an Ink4a/Arf+/− or null background. Data is represented as the number of cells with a positive stain in Ezh2Δ/Δ divided by the Control with the dotted line at 1.0 representing no change between Ezh2Δ/Δ and Control SVZ NSCs (n = 3). (G) Quantification of Tuj1+ GFP+ cells as a fraction of all GFP+ cells in Ezh2Δ/Δ;Ink4a/Arf−/− SVZ NSCs infected with a lentivirus (LV) containing GFP and a control gene encoding for alkaline phosphatase compared to a LV expressing GFP and Ezh2 (****p<0.0001, n = 3). (H) IHC staining for DCX (green) and DAPI (blue) of P14 coronal OB slices from Control;Ink4a/Arf−/− animals compared to hGFAP-cre;Ezh2F/F;Ink4a/Arf−/− demonstrating a decrease in DCX+ cells in the OB core. Data are represented as ± SD.
Figure 3—figure supplement 1
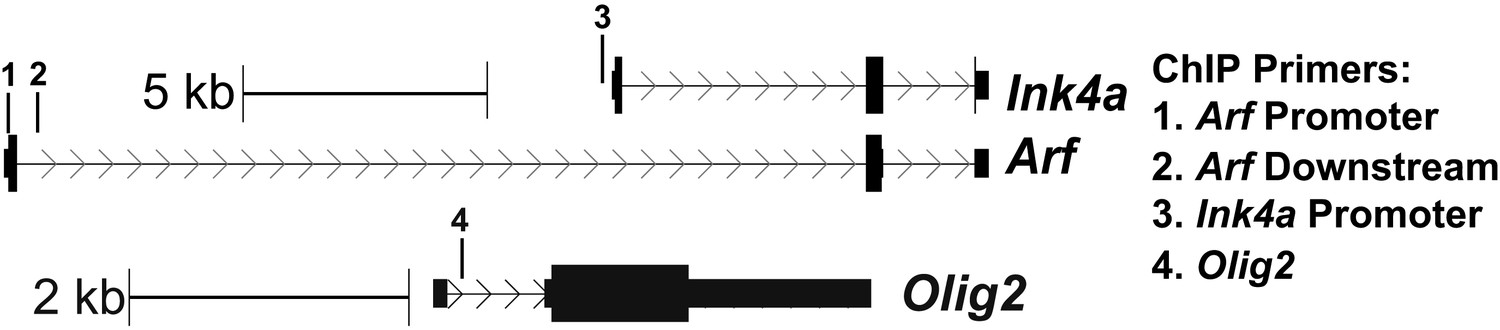
Schematic of the location of ChIP primers to Ink4a/Arf and Olig2 used in Figure 3A,B.
https://doi.org/10.7554/eLife.02439.010
Figure 4 with 5 supplements
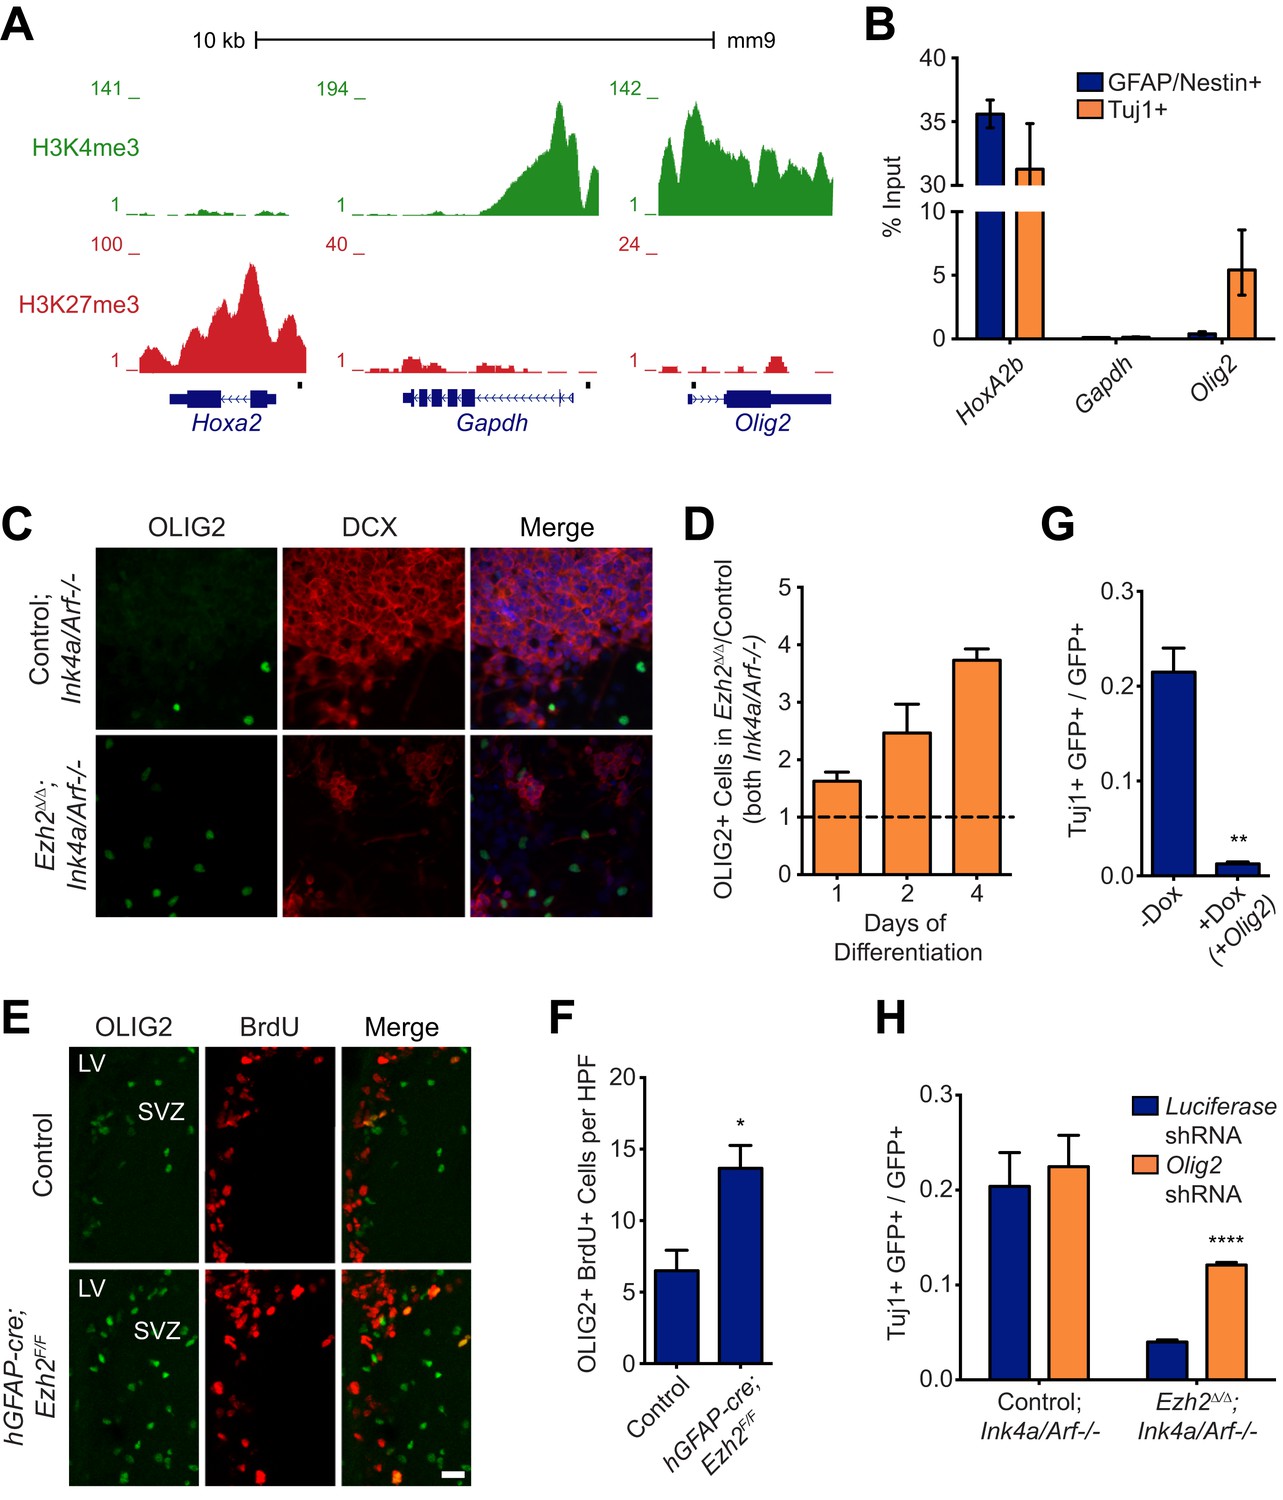
Aberrant expression of OLIG2 in Ezh2Δ/Δ;Ink4a/Arf−/− SVZ NSCs inhibits neuronal differentiation.
(A) ChIP-seq analysis of proliferating SVZ NSCs in vitro with an H3K4me3 or H3K27me3 antibody at the Hoxa2, Gapdh, and Olig2 genomic loci. (B) ChIP-qPCR analysis of FACS-sorted Tuj1+ and GFAP/Nestin + cells after 4 days in differentiation media with an H3K27me3 antibody using primer sets spanning the promoter regions of Hoxa2, Gapdh, and Olig2 (black boxes in (A)). (C) Representative images of ICC analysis comparing Control;Ink4a/Arf−/− and Ezh2Δ/Δ;Ink4a/Arf−/− SVZ NSCs after four days of differentiation with DCX and OLIG2 antibodies (Merge includes DAPI). (D) Quantification of ICC experiment described in (C) after 1, 2, and 4 days of differentiation. (E) Representative images of IHC analysis of the dorsal SVZ with BrdU and OLIG2 antibodies comparing control and hGFAP-cre;Ezh2F/F P17 slices. (F) Quantification of IHC experiment described in (E) demonstrating a significant increase of OLIG2+ BrdU+ cells in hGFAP-cre;Ezh2F/F vs Control slices (*p=0.0289, n = 3). (G) Quantification of ICC images generated from a differentiation timecourse analysis (Figure 4—figure supplement 2B) demonstrating significant decrease of Tuj1+ cells in Ezh2Δ/Δ;Ink4a/Arf−/− SVZ NSC 7 d post-differentiation cultures infected with GFP-expressing lentiviruses that can conditionally express OLIG2 with exposure to Dox (**p=0.0014, n = 3). (H) Quantification of ICC images generated from a differentiation timecourse analysis (Figure 4—figure supplement 2E) demonstrating significant increase of Tuj1+ cells in Ezh2Δ/Δ;Ink4a/Arf−/− SVZ NSC Day 3 post-differentiation cultures infected with GFP-expressing lentiviruses expressing shRNAs specific to Olig2 compared to those expressing Luciferase as a control (****p<0.0001, n = 3). Data are represented as ± SEM.
Figure 4—figure supplement 1
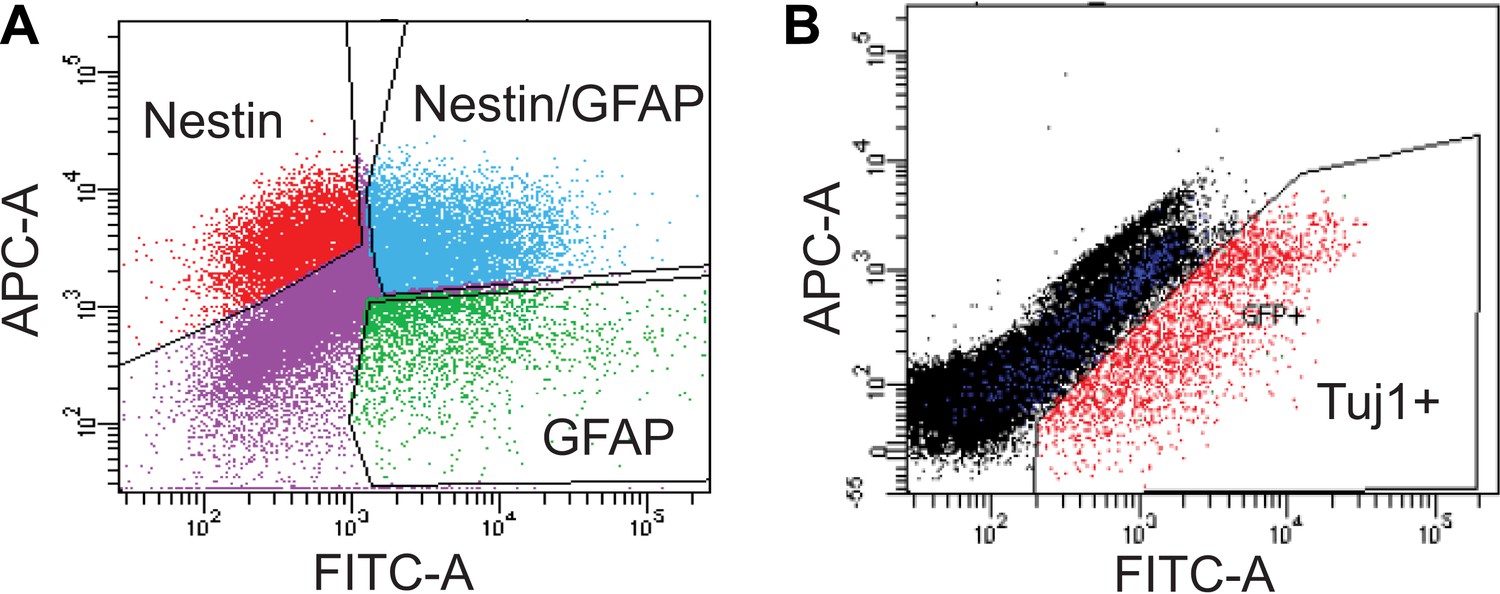
FACS analysis of SVZ NSCs after 0 or 4 days of differentiation.
(A) Scatter plot of FACS performed on undifferentiated SVZ NSCs using GFAP and Nestin antibodies. (B) Scatter plot of FACS performed on SVZ NSCs after 4 days in differentiation conditions using a Tuj1 antibody.
Figure 4—figure supplement 2
Aberrant expression of OLIG2 in Ezh2Δ/Δ;Ink4a/Arf−/− SVZ NSCs inhibits neuronal differentiation.
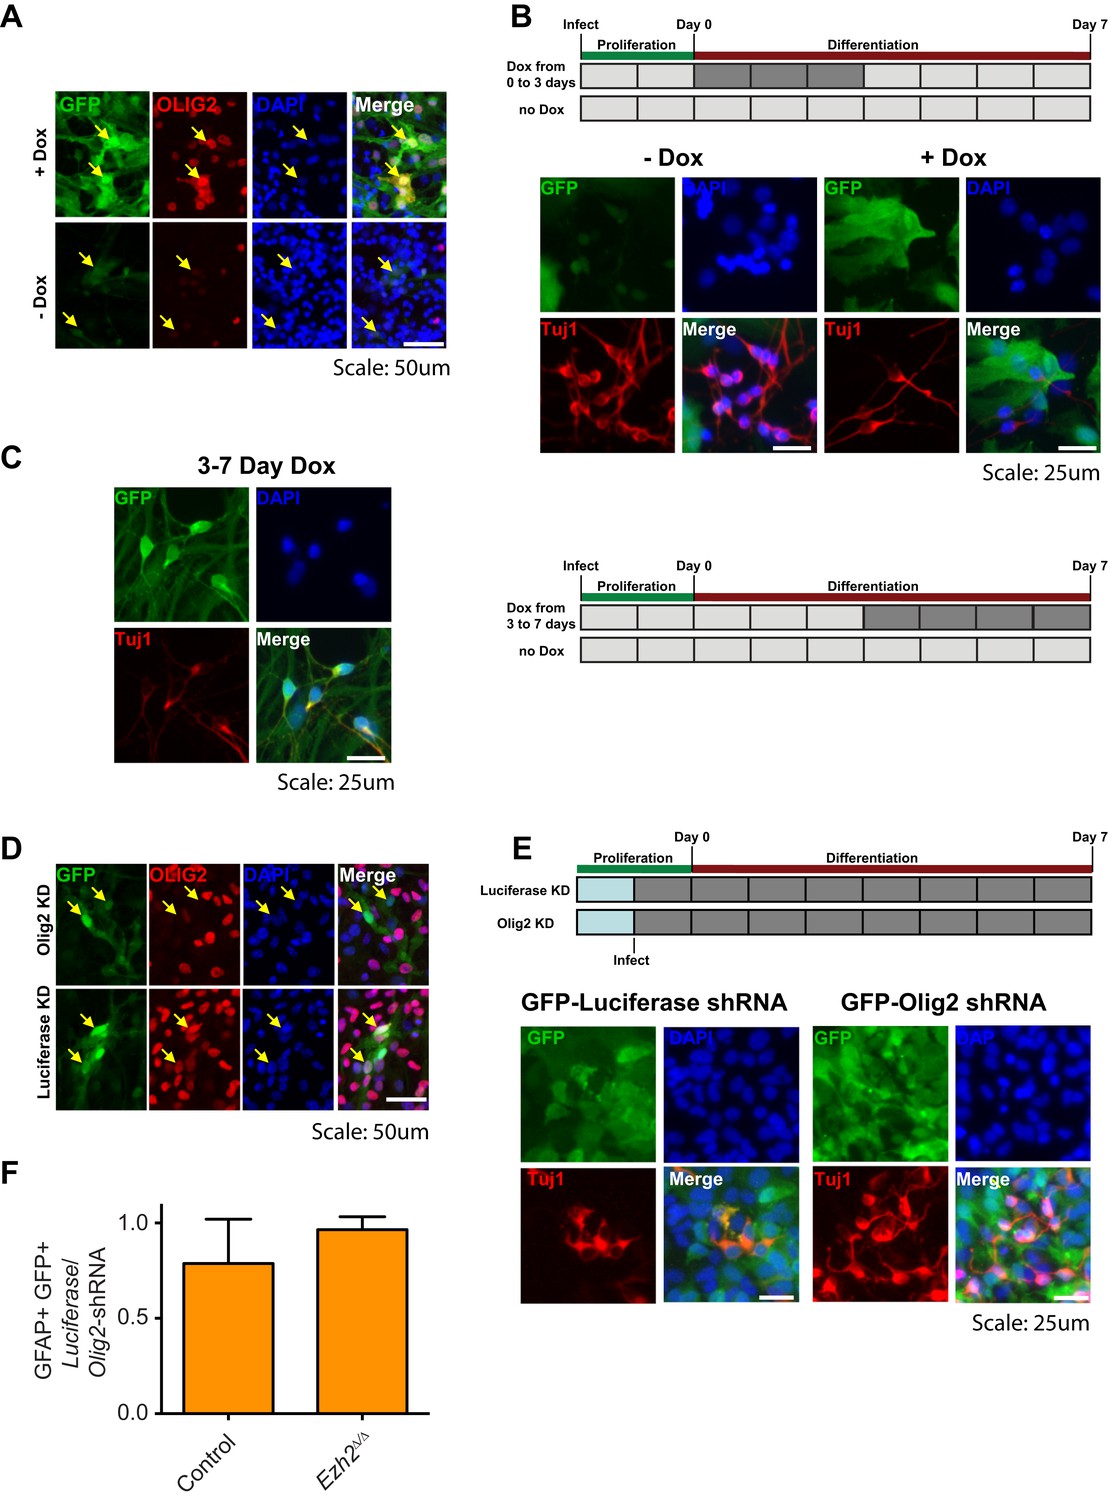
(A) Images of differentiating rtTA-expressing SVZ NSCs infected with a LV expressing GFP and encoding tetO-Olig2. Arrows point to GFP+ cells expressing OLIG2 upon addition of Dox in top panel. (B) Schematic of experimental setup with infection of rtTA-expressing SVZ NSC with LV two days prior to differentiation. OLIG2 is induced by treatment of cultures with Dox from Day 0 to 3 in differentiation conditions by addition of Dox to the media. Images show representative fields from quantification in Figure 4G. (C) Representative images and schematic showing Tuj1+ GFP+ cells when OLIG2 was induced by Dox treatment from Day 3 to 7 after differentiation induction. (D) Images of proliferating SVZ NSCs infected with a LV expressing GFP and either an Olig2 knockdown (KD) or Luciferase KD construct. Arrows point to GFP+ cells expressing OLIG2 in Luciferase KD but not Olig2 KD LV infected cells. (E) Schematic of experimental setup with infection of KD LV a day prior to differentiation. Images show representative fields from quantification in Figure 4H. (F) Quantification of the proportion of GFAP+ cells infected with Luciferase-KD virus compared to those infected with Olig2-KD virus in Control;Ink4a/Arf−/− or Ezh2Δ/Δ;Ink4a/Arf−/− SVZ NSCs (n = 3).
Figure 4—figure supplement 3
Identification of transcriptional modules that require EZH2 for proper downregulation during differentiation.
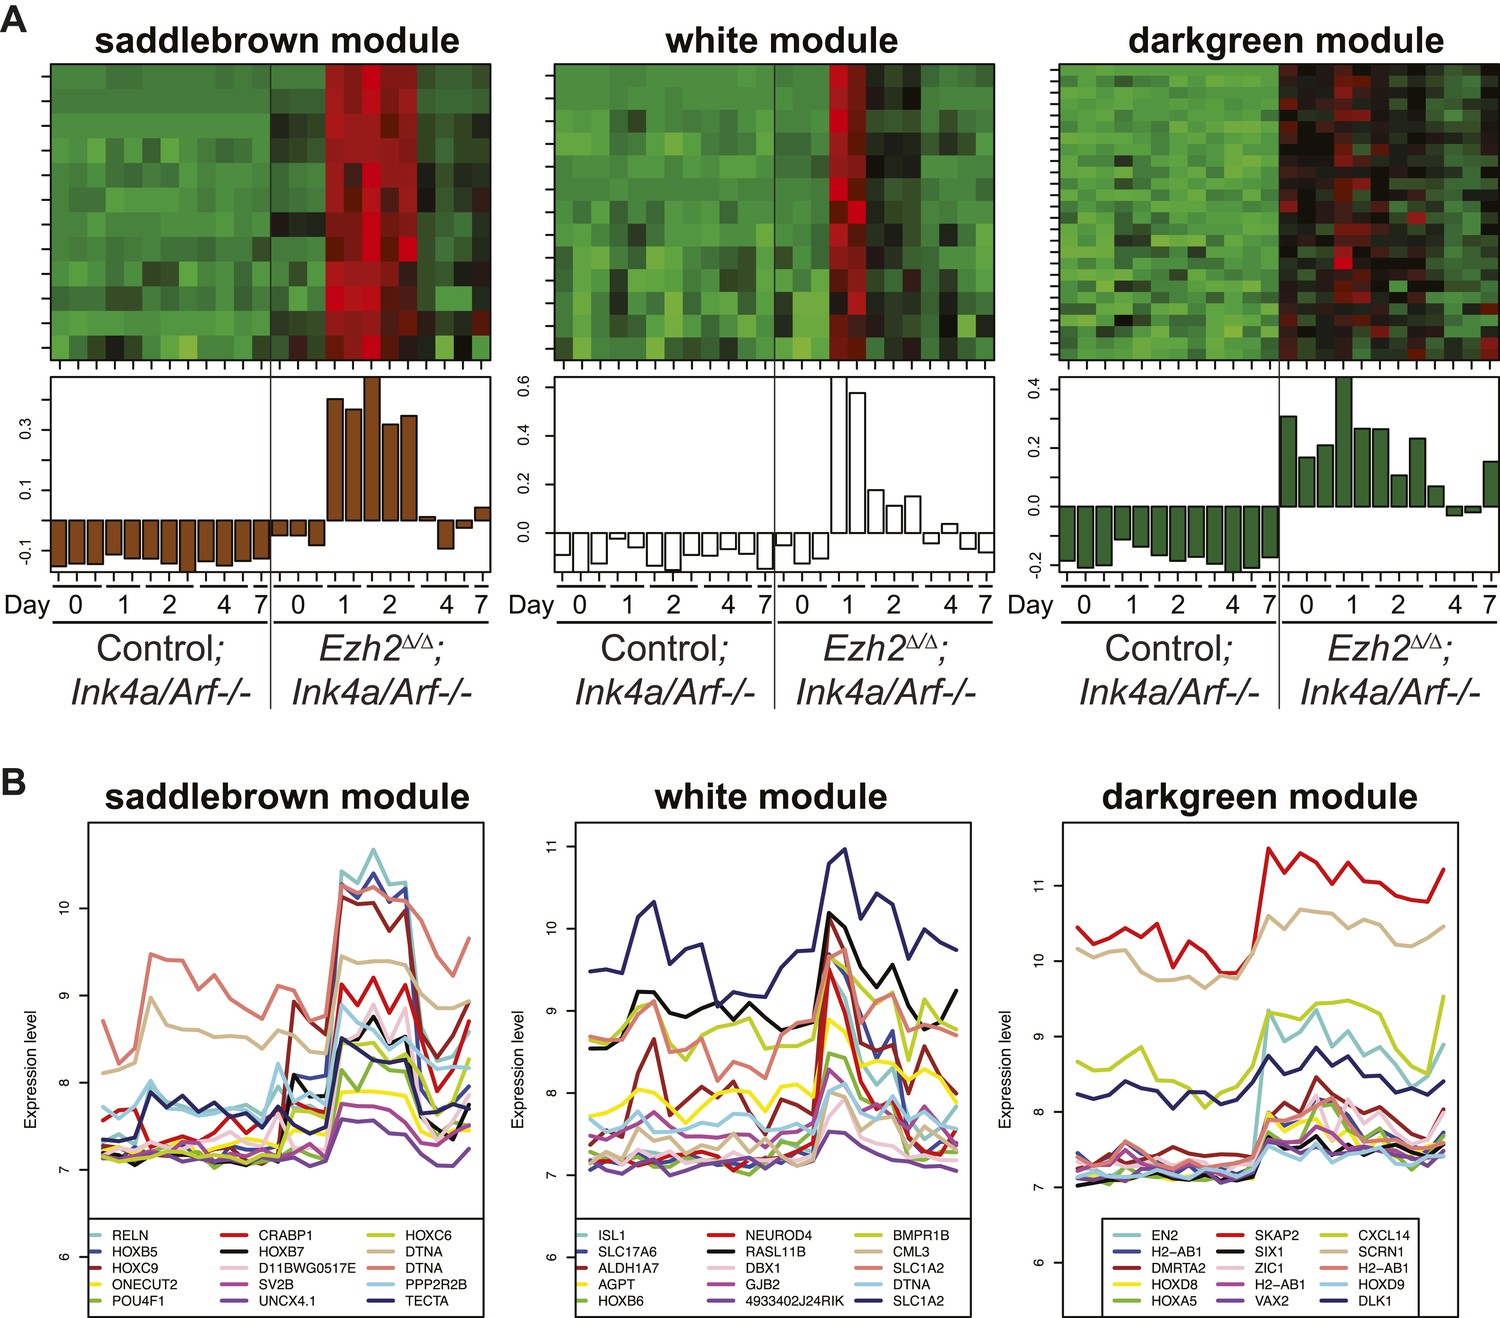
To identify other potential targets of Ezh2-dependent gene repression besides Olig2 that are related to SVZ NSC neurogenesis, we analyzed by expression microarray the transcriptional profiles of Ezh2Δ/Δ;Ink4a/Arf−/− and Control;Ink4a/Arf−/− SVZ NSCs across a differentiation timecourse (0, 1, 2, 4, and 7 d after differentiation). We used gene co-expression analysis (Zhang and Horvath, 2005; Oldham et al., 2008; Ramos et al., 2013), which organizes genes into modules that exhibit similar expression patterns, to analyze the expression data. (A) Top panels contain heatmaps representing the expression levels for three modules (saddlebrown, white, and darkgreen) of 46 co-expressed transcripts that, like Olig2, require Ezh2 for repression during neuronal lineage specification and would be expected to exhibit increased expression in Ezh2Δ/Δ;Ink4a/Arf−/− cells early in the differentiation time course, as compared to control cultures. Red = increased expression, Green = decreased expression, Black = no change. Bottom panels contain plots of the eigengene values in each module representing the first principal component of each module (‘Materials and methods’ for details of analysis). (B) Expression patterns for the top 15 genes ranked by their Pearson correlation to the first principal component of each coexpression module (Oldham et al., 2008) are shown. Samples on the x-axis correspond to those depicted in (A).
Figure 4—figure supplement 4
Ezh2-dependent genes during early differentiation are enriched for homeobox-containing neuronal transcriptional regulators and H3K27me3.
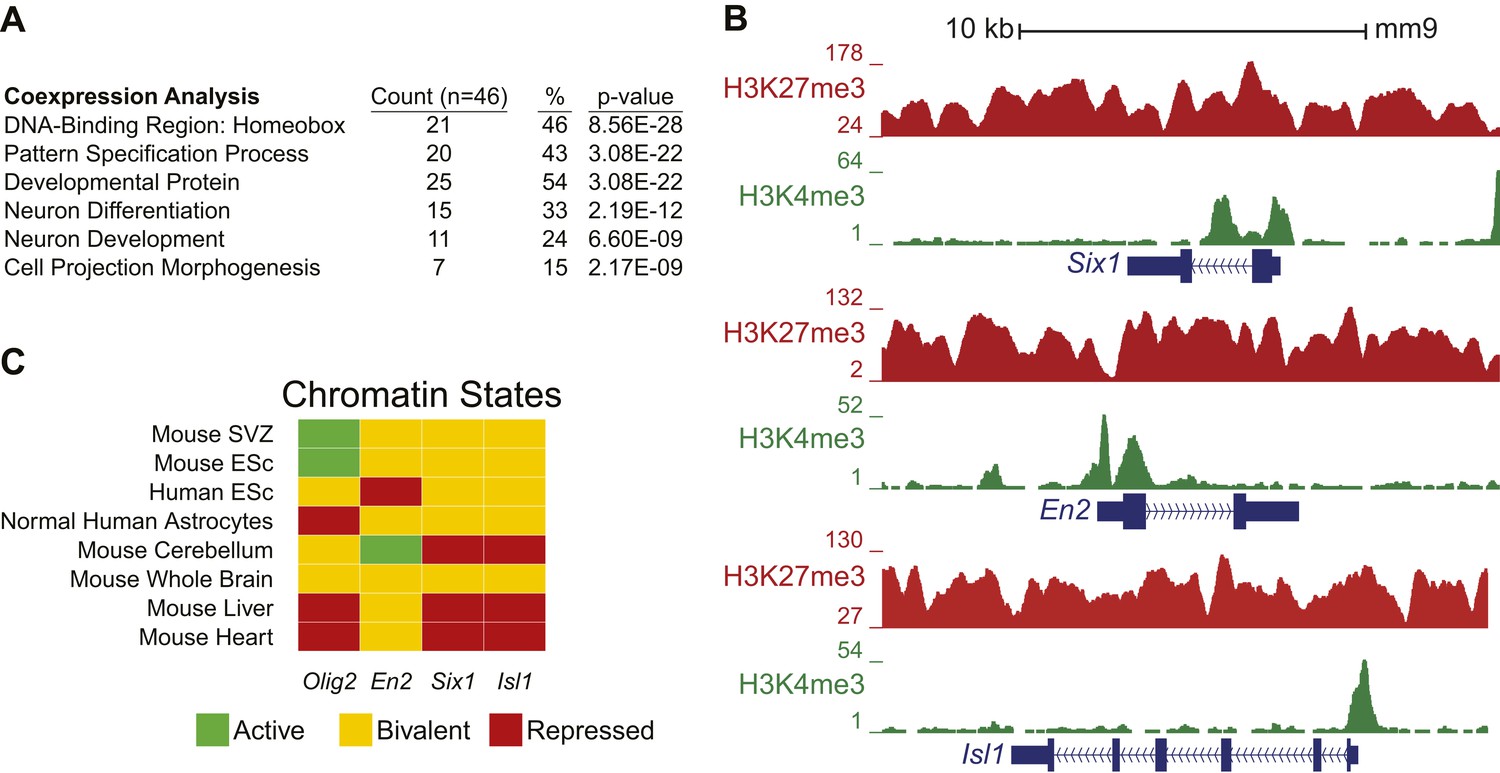
(A) Selected functional categories of the combined genes identified from the saddlebrown, white, and darkgreen modules that are significantly enriched after DAVID analysis (Huang da et al., 2009). (B) ChIP-seq analysis of proliferating SVZ NSCs with antibodies to H3K4me3 (green) and H3K27me3 (red) demonstrating bivalency at three genomic loci identified from the module analysis (Six1, En2, and Isl1). Note that the majority of genes (74%, 34/46) in these modules had H3K27me3 enrichment within 1 kb of their transcriptional start site, versus only 7% (381/5566) of genes across all modules, indicating that most of these dysregulated genes are likely direct targets of EZH2. (C) Comparison of our ChIP-seq profiles (Mouse SVZ) for selected loci to published ChIP-seq profiles from other mouse and human tissues (Rosenbloom et al., 2013). Note the predominance of the repressive H3K27me3 mark on Olig2 in human astrocytes, consistent with our observation of direct EZH2 repression of Olig2 upon differentiation in the mouse SVZ. In addition, genes encoding homedomain-containing transcription factors are marked with chromatin states that correlate with their activity in various tissues (e.g., En2 active but Six1 and Isl1 repressed in cerebellum), suggesting that epigenetic regulation by factors like EZH2 may be necessary to prevent their inappropriate expression.
Figure 4—figure supplement 5

List of genes identified in the saddlebrown, white, and darkgreen modules.
Interestingly, many of the genes that exhibited Ezh2-dependent transcriptional repression encode for homeodomain transcription factors involved in the production of neuronal subtypes that are temporally and spatially distinct from OB interneurons. Examples include Six1, En2, and Isl1, which are involved in the embryonic development of olfactory receptor, midbrain dopaminergic, and sensory neurons, respectively (Simon et al., 2001; Ikeda et al., 2007; Sun et al., 2008); these loci were ‘bivalent’ for both H3K27me3 and H3K4me3, consistent with a ‘poised’ transcriptional state (Figure 4—figure supplement 4B), which is typical of key developmental genes in stem cell populations (Bernstein et al., 2006). Taken together, these data support a model in which Ezh2-dependent H3K27me3 is required to repress specific sets of homeodomain-containing transcription factors in SVZ NSCs, preventing their inappropriate expression to potentially enable proper neuronal lineage specification.
Figure 5
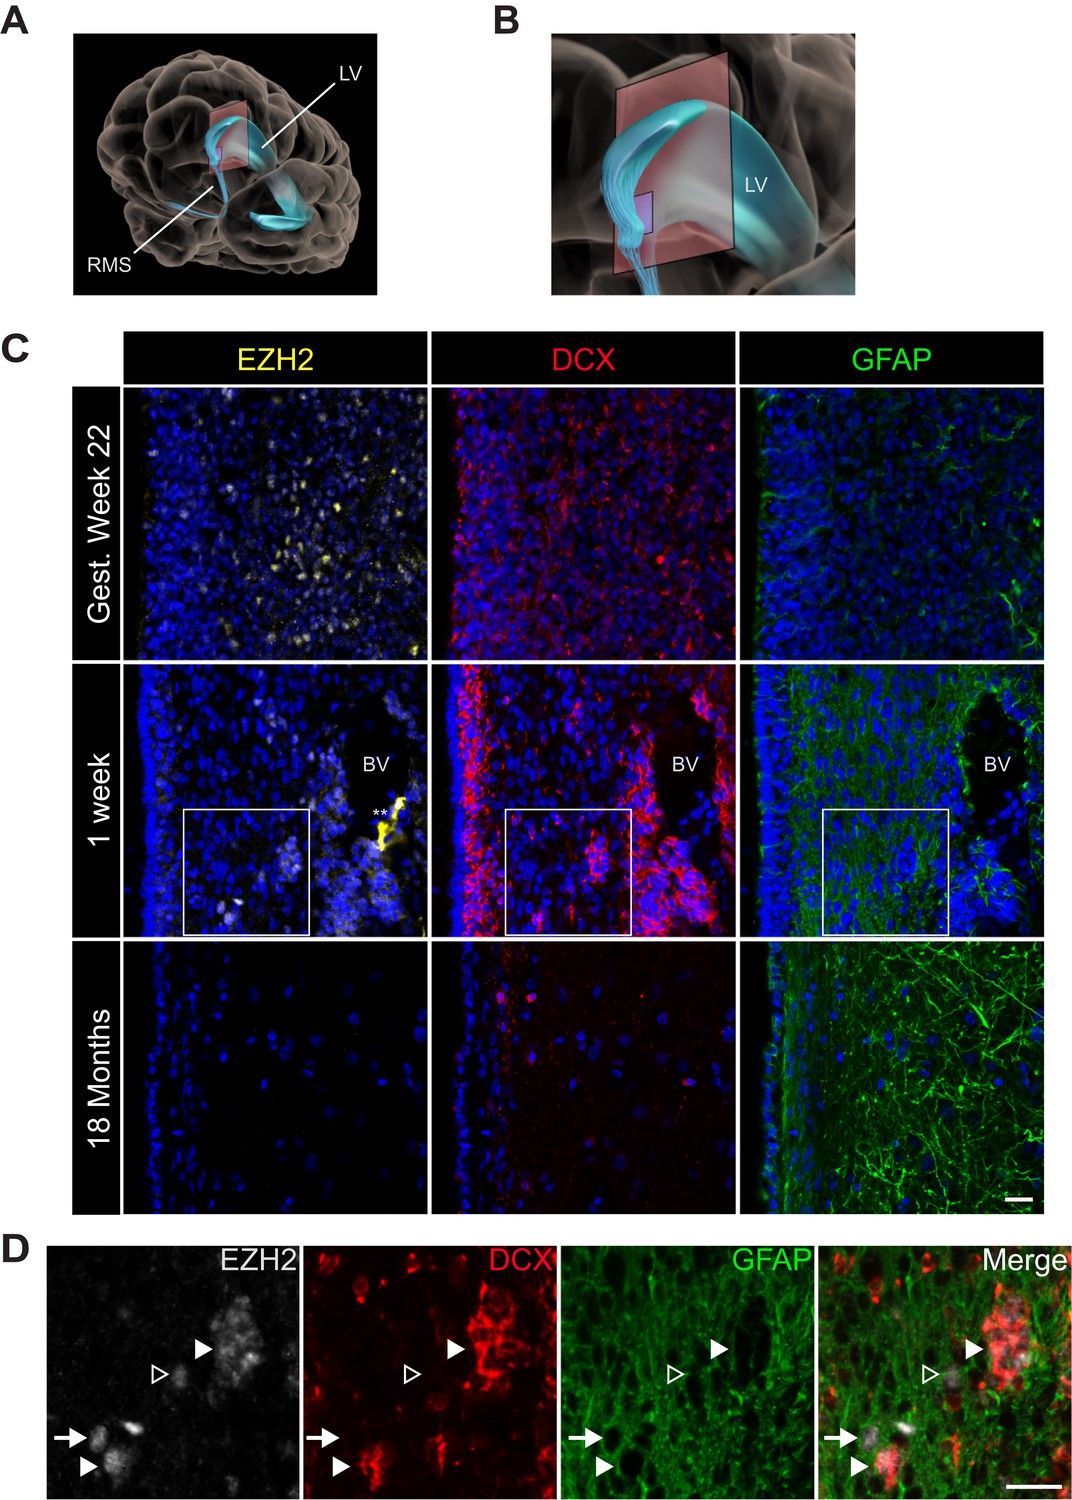
EZH2 expression in the infant human subventricular zone decreases post-birth.
(A) Schematic illustrating the location of the 30 µm thick sections of the anterior subventricular zone stained in (C) and (D). RMS = rostral migratory stream; LV = lateral ventricle. (B) Magnification of the lateral ventricle region and sectioned region. (C) IHC co-staining with DAPI (blue) of sections from varying ages of early human development (gestational week 22, 1 week, and 18 month timepoints) with antibodies to EZH2 (yellow), DCX (red), and GFAP (green). Note the presence of a blood vessel (BV) surrounded by DCX + cells in the 1 week timepoint (** indicates non-specific signal from EZH2 staining). Boxes in the 1 week timepoint indicate the region examined in (D). (D) Magnified view of a region of the 1 week section in (C) co-stained by IHC with antibodies to EZH2 (grey), DCX (red) and GFAP (green) demonstrating EZH2+ cells that are either DCX+ (closed arrowhead), GFAP+ (arrow), or negative for both DCX and GFAP (open arrowhead). Scale bars, 20 µM.
Figure 6
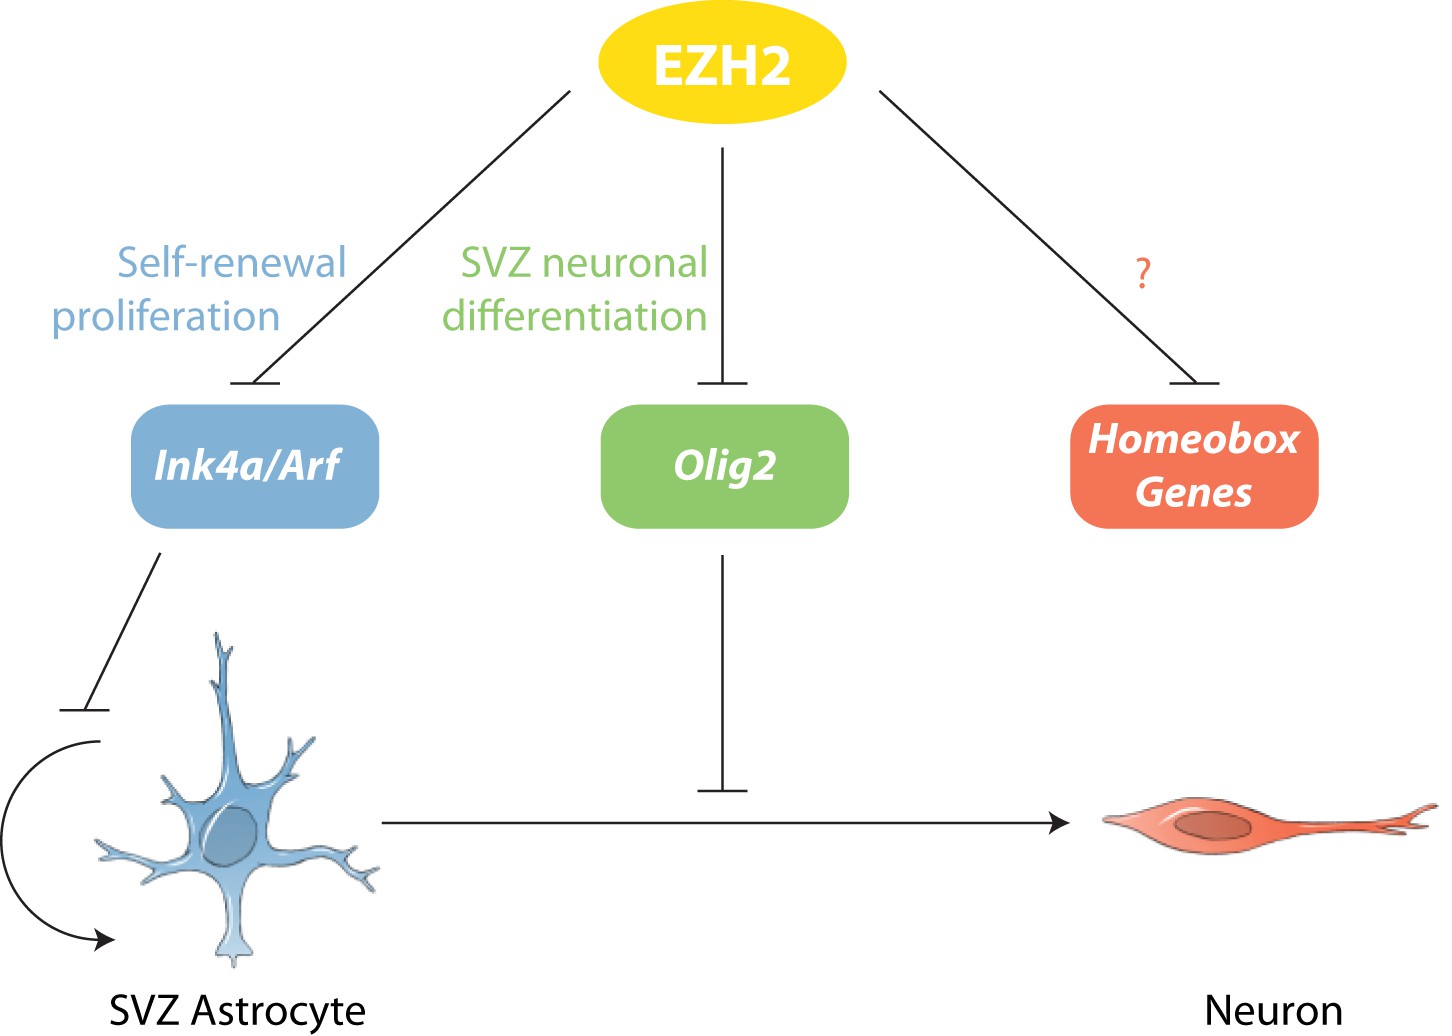
Model of EZH2 function in maintaining the neurogenic potential of SVZ astroglia.
EZH2 represses multiple targets to promote distinct and separable aspects of adult SVZ neurogenesis.
Additional files
-
Supplementary file 1
Quantity and dilution ratios of the primary antibodies used in this study.
- https://doi.org/10.7554/eLife.02439.019
-
Supplementary file 2
Primers used for ChIP-qPCR experiments in this study.
- https://doi.org/10.7554/eLife.02439.020
Download links
A two-part list of links to download the article, or parts of the article, in various formats.
Downloads (link to download the article as PDF)
Open citations (links to open the citations from this article in various online reference manager services)
Cite this article (links to download the citations from this article in formats compatible with various reference manager tools)
Distinct and separable roles for EZH2 in neurogenic astroglia
eLife 3:e02439.
https://doi.org/10.7554/eLife.02439


