Assessing long-distance RNA sequence connectivity via RNA-templated DNA–DNA ligation
- Howard Hughes Medical Institute, University of Massachusetts Medical School, United States
- University of Massachusetts Medical School, United States
- University of Connecticut Health Center, United States
Figures
Figure 1 with 2 supplements
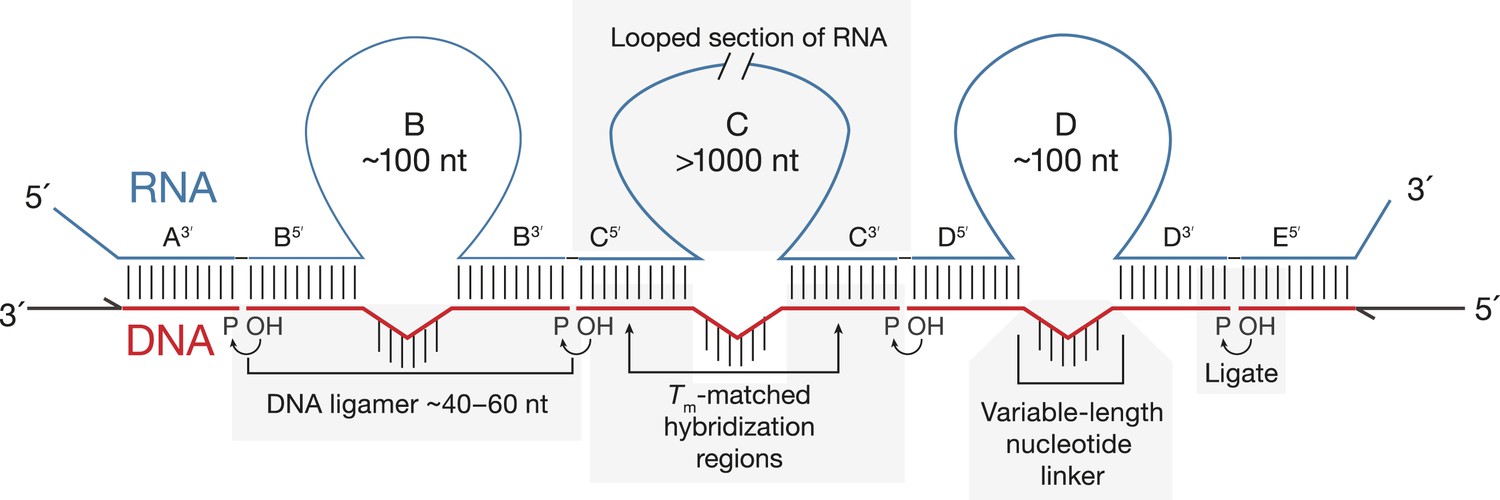
Principles of SeqZip.
The target RNA is hybridized with a set of DNA oligonucleotides (‘ligamers’). Ligamers targeting outermost sequences contain one region of complementarity and primer sequences for subsequent amplification. Internal ligamers contain two regions of complementarity separated by a spacer sequence. Hybridization of the internal ligamers causes the RNA between the hybridization sites to loop out. Hybridized ligamers are ligated, amplified, and analyzed.
Figure 1—figure supplement 1
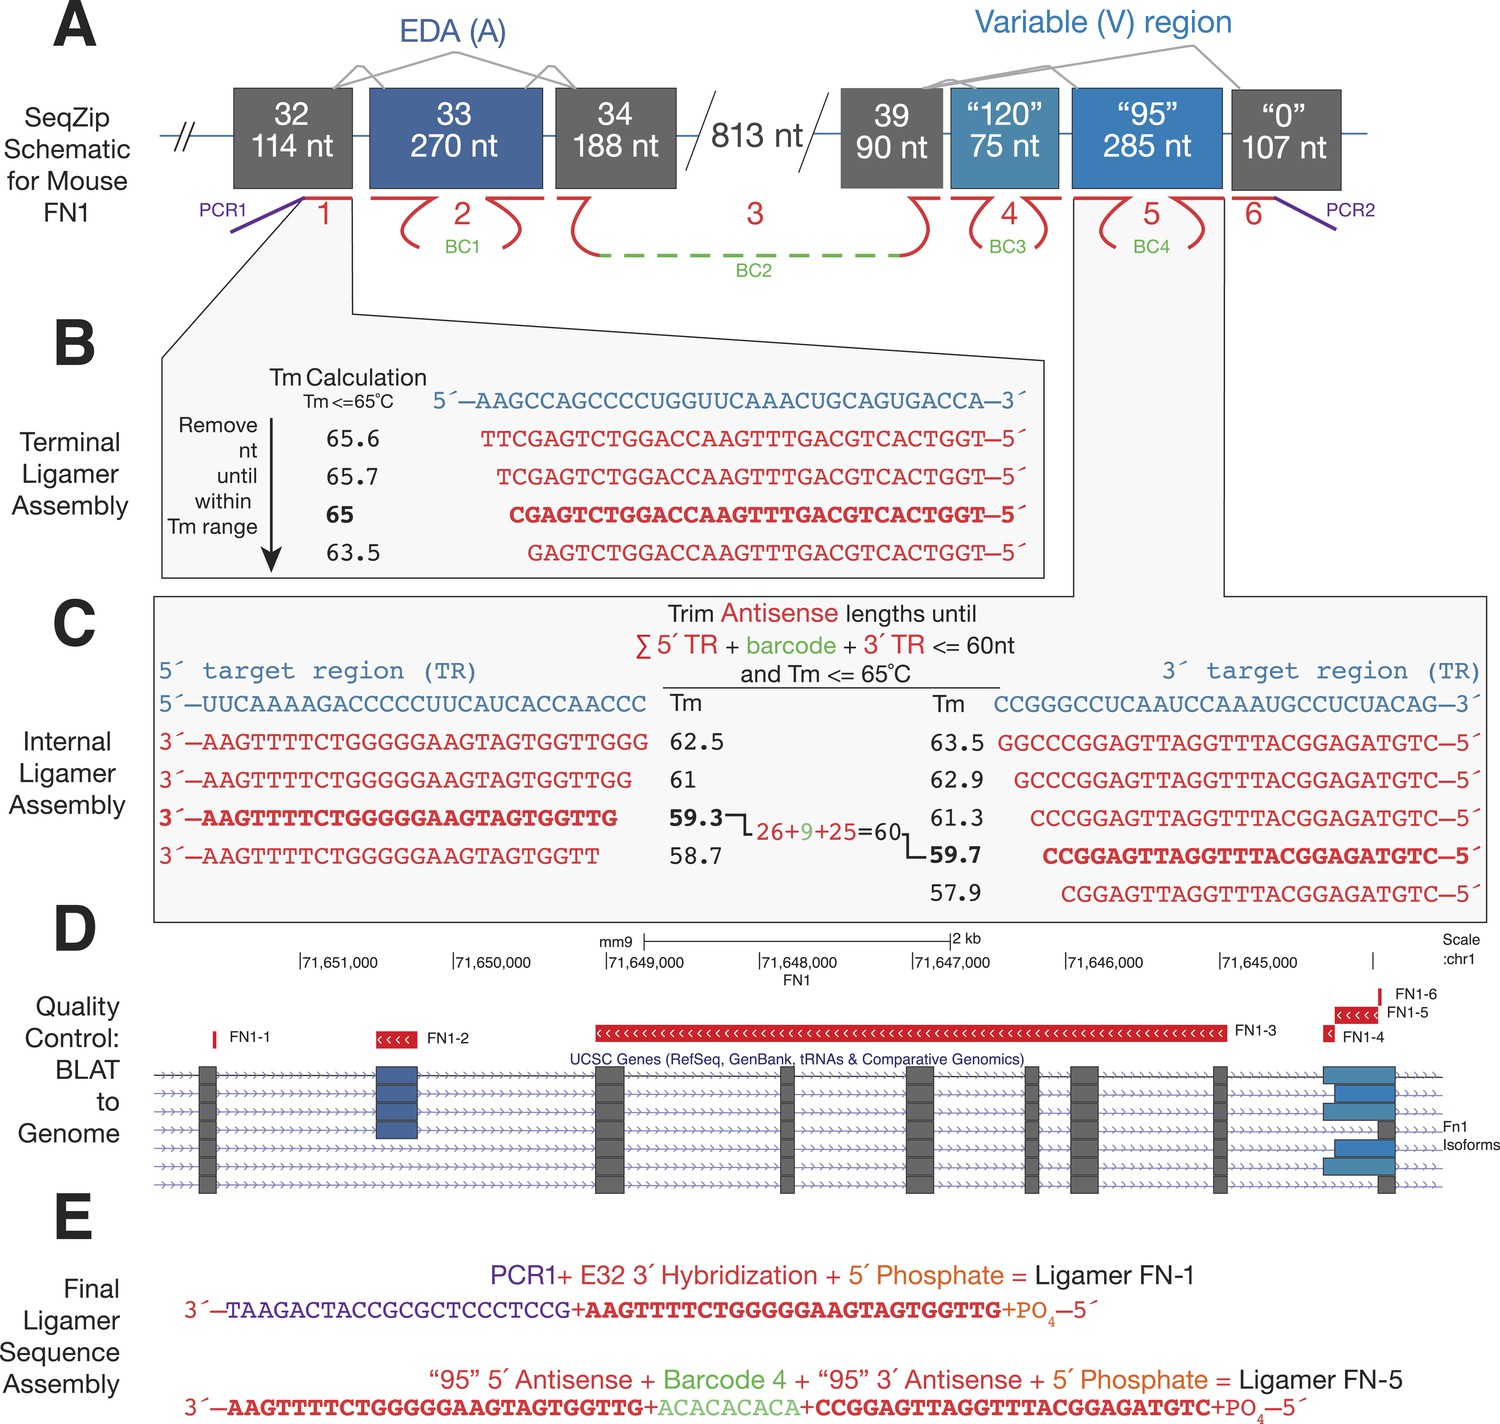
Ligamer design workflow.
(A) Schematic of mouse FN1 characterization using SeqZip. A total of six ligamers (1–6) are required to profile alternative splicing at the EDA and variable exons. Internal ligamer-specific barcodes (BC1–4) are variable length unique sequences inserted in between exon-specific complementarity regions. (B) Design of a terminal ligamer specific to the 3′ end of FN1 exon 32. The complementary strand of the genomic sequence for this region was trimmed from its 3′ end, measuring the Tm after each nt is removed, until the Tm is ≤65°C. (C) Design of an internal ligamer specific to the ‘95’ variation of the variable exon of mouse FN1. This ligamer hybridizes to the beginning and end of the exon. Genomic sequence complementary to the 5′ and 3′ ends of the exon is trimmed from the inside of the exon out until the sequences meet two criteria: (1) each region has a Tm of ≤65°C and (2) the sum of the two region's lengths plus that of the desired barcode is ≤60 nt. (D) After the regions of complementary are trimmed for Tm and length, the sequences are BLATted against the target genome to ensure correct transcript and exon targeting. (E) Once regions of hybridization have been tested for specificity, the different components of each ligamer are assembled into a continuous sequence and the ligamer synthesized. Individual ligamer components can include: (1) one or two regions of complementarity to target RNA, (2) PCR priming sequence or internal barcode, and (3) 5′ phosphosphate for ligation.
Figure 1—figure supplement 2
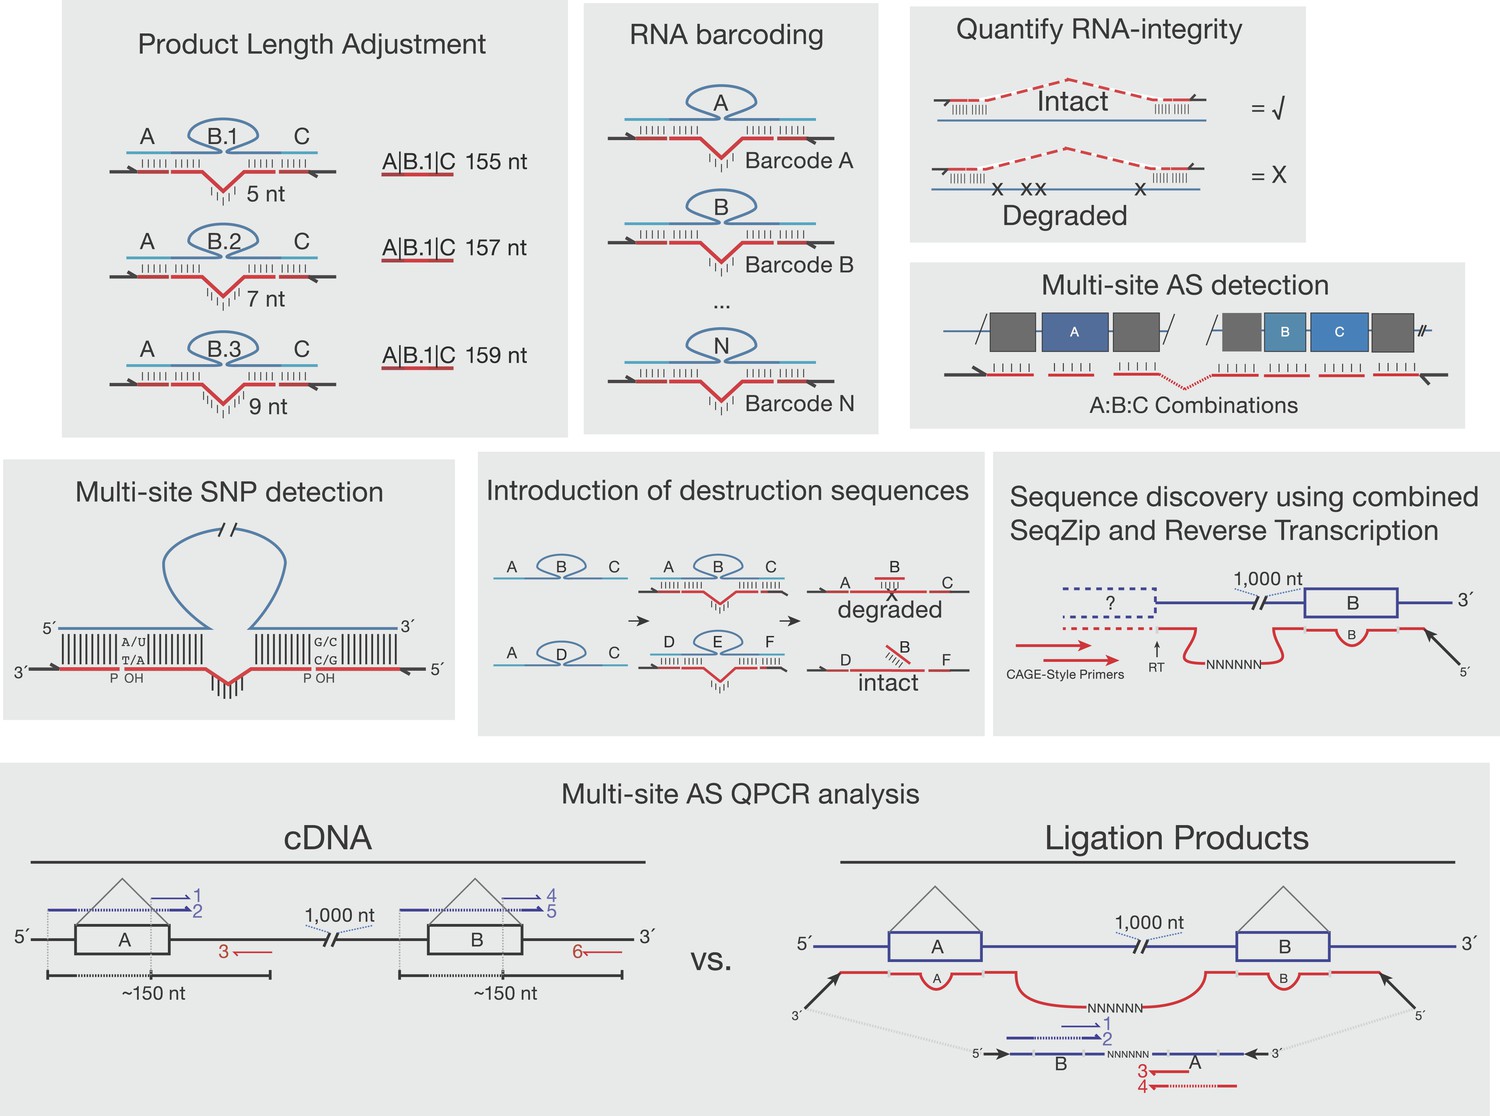
Other proposed uses of SeqZip.
Shown are various uses of SeqZip toward multi-site sequence investigation of RNA. ‘Product Length Adjustment’ has applications similar to those shown in Figure 3E, where isoform discrimination solely on the basis of size separation of RT-PCR products would be ambiguous; with SeqZip, the lengths of individual products can be adjusted through ligamer design. ‘RNA barcoding’ depicts the introduction of randomized rather than static barcodes, allowing for molecular indexing or amplification bias estimation. ‘Quantify RNA-integrity’ relies on the requirement of molecular continuity between sites of ligamer hybridization in order to obtain a SeqZip product (check mark). If the intervening sequences are not intact, no product is obtained (X). Thus, SeqZip can be used to monitor the integrity of long RNAs. ‘Multi-site SNP detection’ is described in the ‘Discussion’ section ‘SeqZip uses and limitations’. The panel depicting ‘Introduction of destruction sequences’ illustrates how short DNA oligos targeting ligamer-specific barcodes between hybridization regions (in this case ‘B’) could be useful in the selective cleavage and destruction of particular ligation products. In the example shown, the ABC ligamer product would be cleaved with a restriction enzyme targeting the double-stranded oligo:barcode, while DEF would be left intact for downstream applications. ‘Sequence discovery using combined SeqZip and Reverse Transcription’ illustrates 5′ end sequence discovery using Cap Analysis of Gene Expression combined with SeqZip ligamers. This allows one to investigate novel 5′ end sequence connections to distant 3′ sequences. ‘Multi-site AS QPCR analysis’ is also described in the ‘Discussion’ section ‘SeqZip uses and limitations’. The essential benefit over a conventional QPCR workflow is that SeqZip compresses distant sequences into a QPCR-friendly amplicon size and reduces the number of required primers.
Figure 2 with 1 supplement
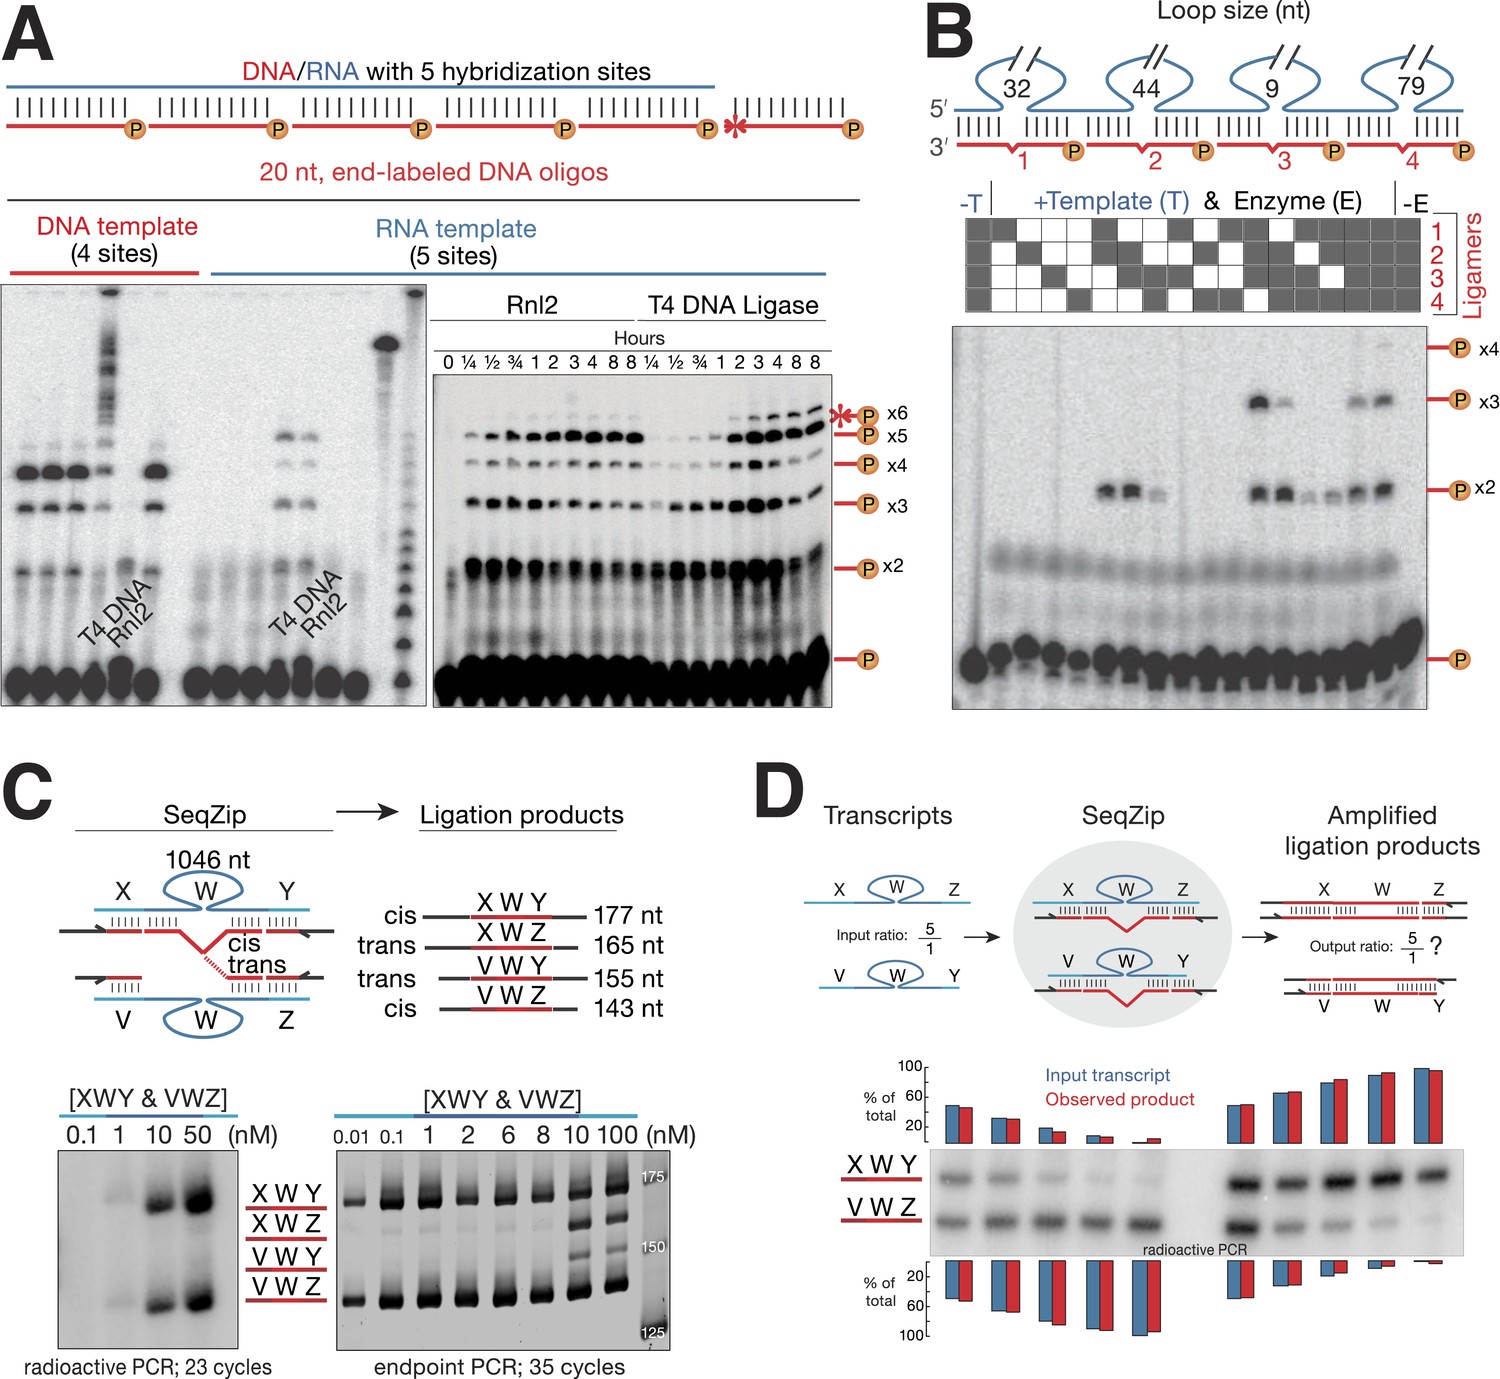
T4 RNA Ligase 2 catalyzes RNA-templated DNA-to-DNA ligation.
(A) Left panel: ligase screen for RNA-templated DNA–DNA ligation activity. Ligases were incubated with an unlabeled single-stranded DNA (left) or RNA (right) template hybridized to a common pool of 5′ end 32P-labeled (circled P) DNA oligonucleotides for 1 hr. Both T4 DNA ligase and T4 RNA ligase 2 (Rnl2) catalyze RNA-templated DNA–DNA ligation. Also note the inability of Rnl2 to ligate >2 oligos on the DNA template. For both templates, ligases are left to right: Tth DNA ligase (Thermo), Tsc DNA ligase (Prokaria), Thermostable DNA ligase (Bioline), T4 DNA ligase (NEB), T4 Rnl2 (NEB), E. coli DNA ligase (NEB). The three rightmost lanes are 32P-oligos only, 32P-labeled RNA template, and a 32P-labeled low-molecular weight DNA ladder (NEB, N3233S). Right panel: Rnl2 and T4 DNA ligase time course for oligos hybridized to the RNA template. Templated ligation products (–x2 through –x5); non-templated ligation product (*–x6). (B) Rnl2 can join multiple 32P-labeled ligamers each looping out sections of the template but only when they are adjacently hybridized. Gray or white square: ligamer present or absent, respectively. No template (-T); no enzyme (-E). (C) Cis- and trans-transcript hybridization and ligation using a ligamer (W) spanning 1046 nt common to two RNAs (XWY and VWZ). Template concentrations (nM) were as indicated above each lane (ranging from 0.01 to 100 nM), ligamers were held constant at 10 nM. Left panel, phosphoimage; right panel, SybrGold stained. (D) The ability of SeqZip to accurately report on relative input RNA concentrations was investigated using various ratios of two RNAs (XWZ and VWY) and a six ligamer pool. Observed product ratios were calculated from radioactive PCR band intensities.
Figure 2—figure supplement 1
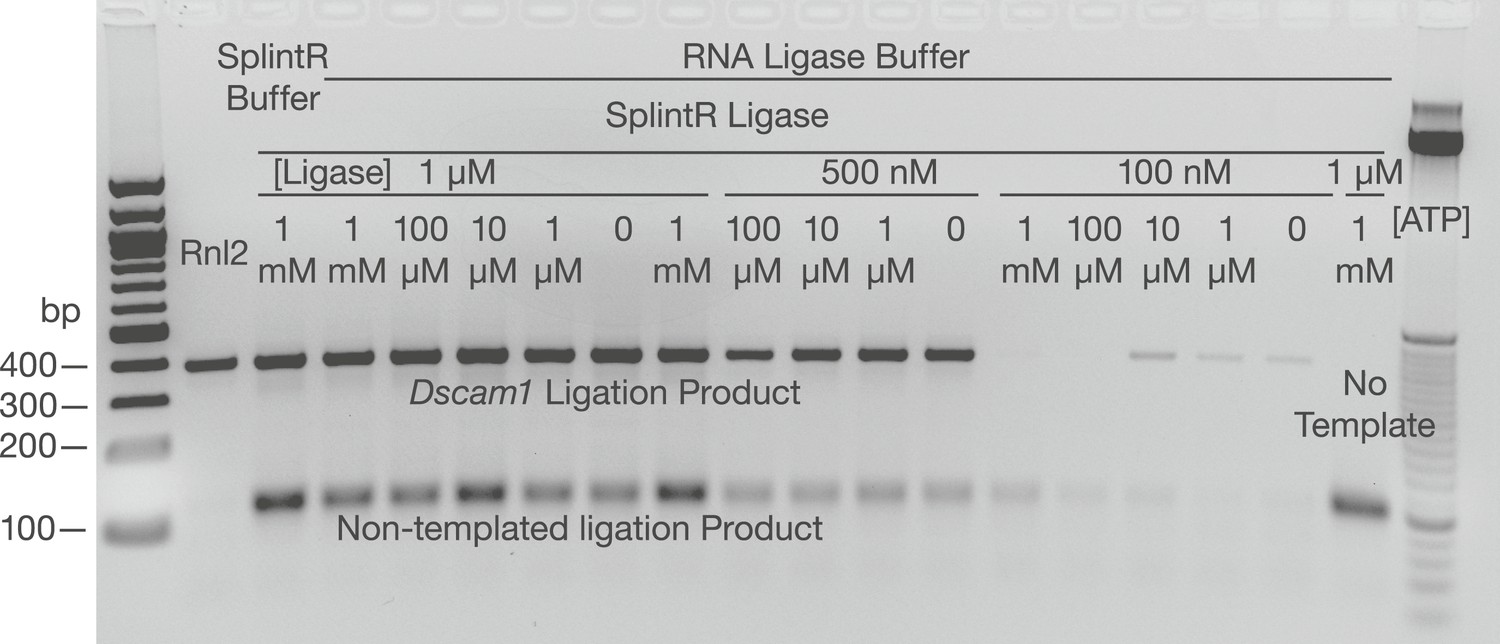
Examination of SplintR ligase in the SeqZip assay.
Various concentrations of SplintR ligase and ATP were used to generate ligation products using Dscam1 ligamers and S2 cell RNA. Dscam1 ligation products appear as a ∼400 nt band, non-templated products as a ∼120 nt band.
Figure 3
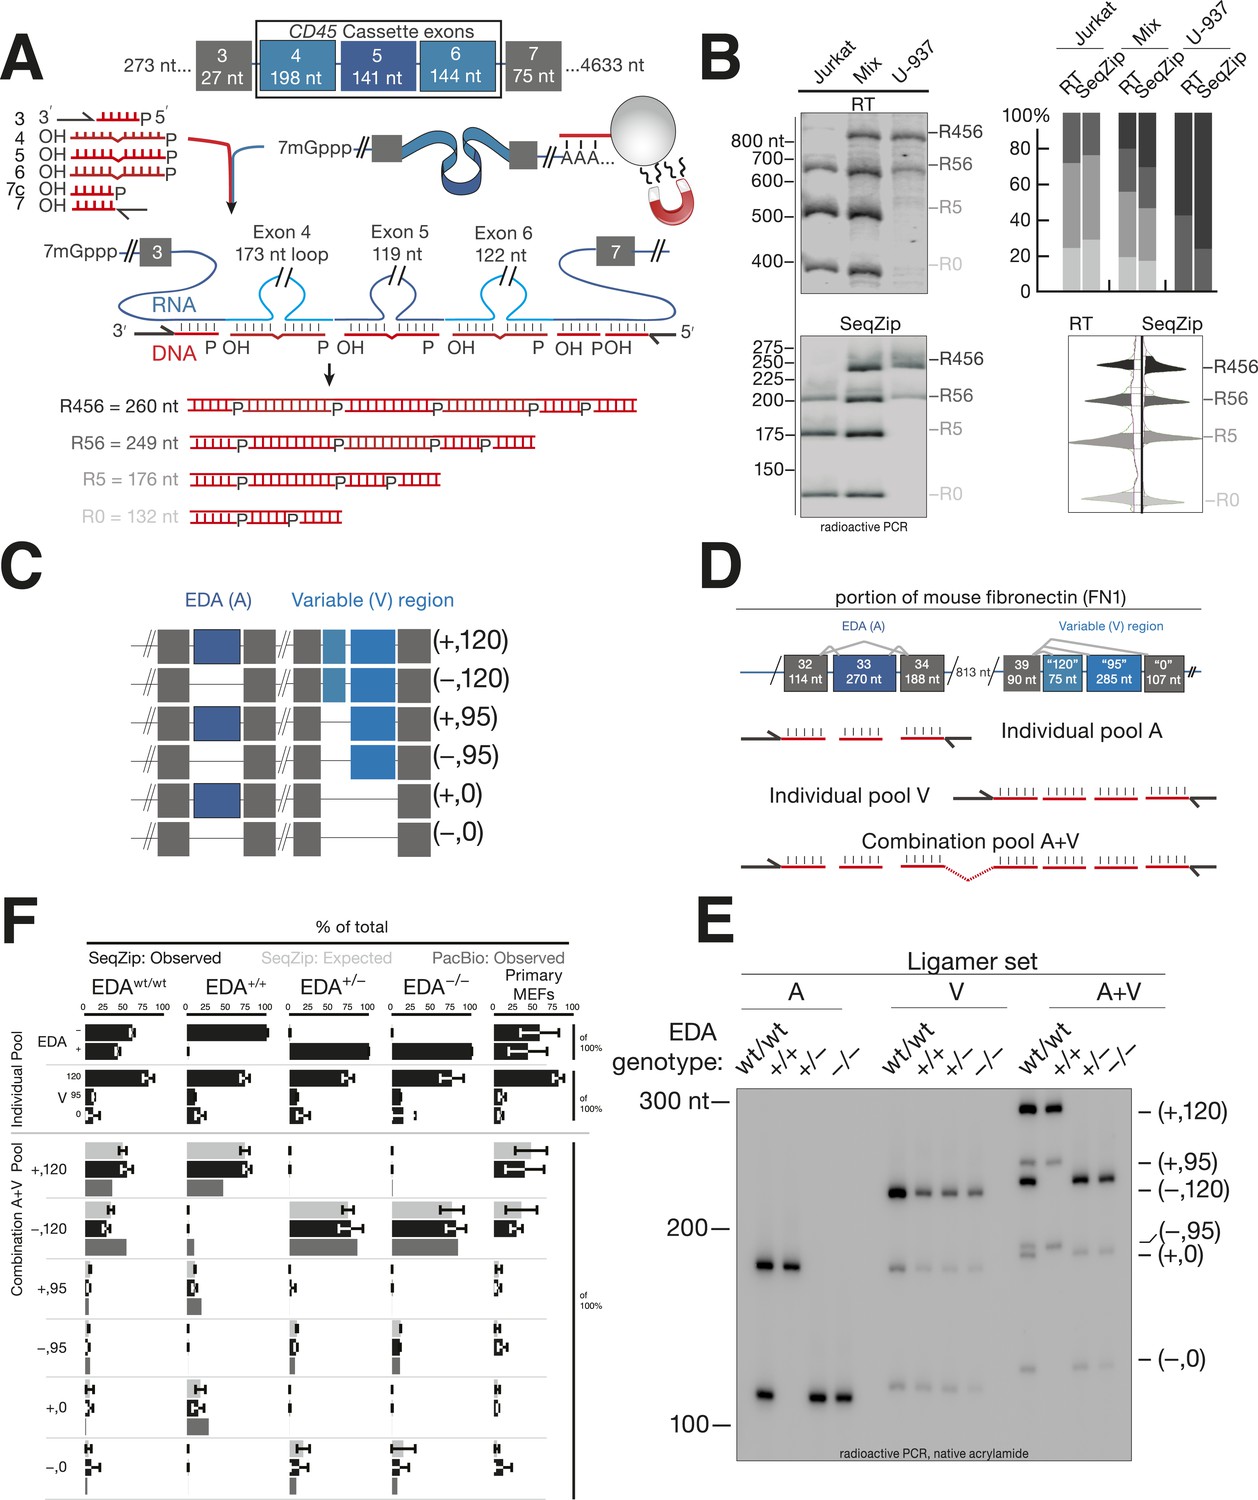
SeqZip assay to measure endogenous mRNA isoform expression.
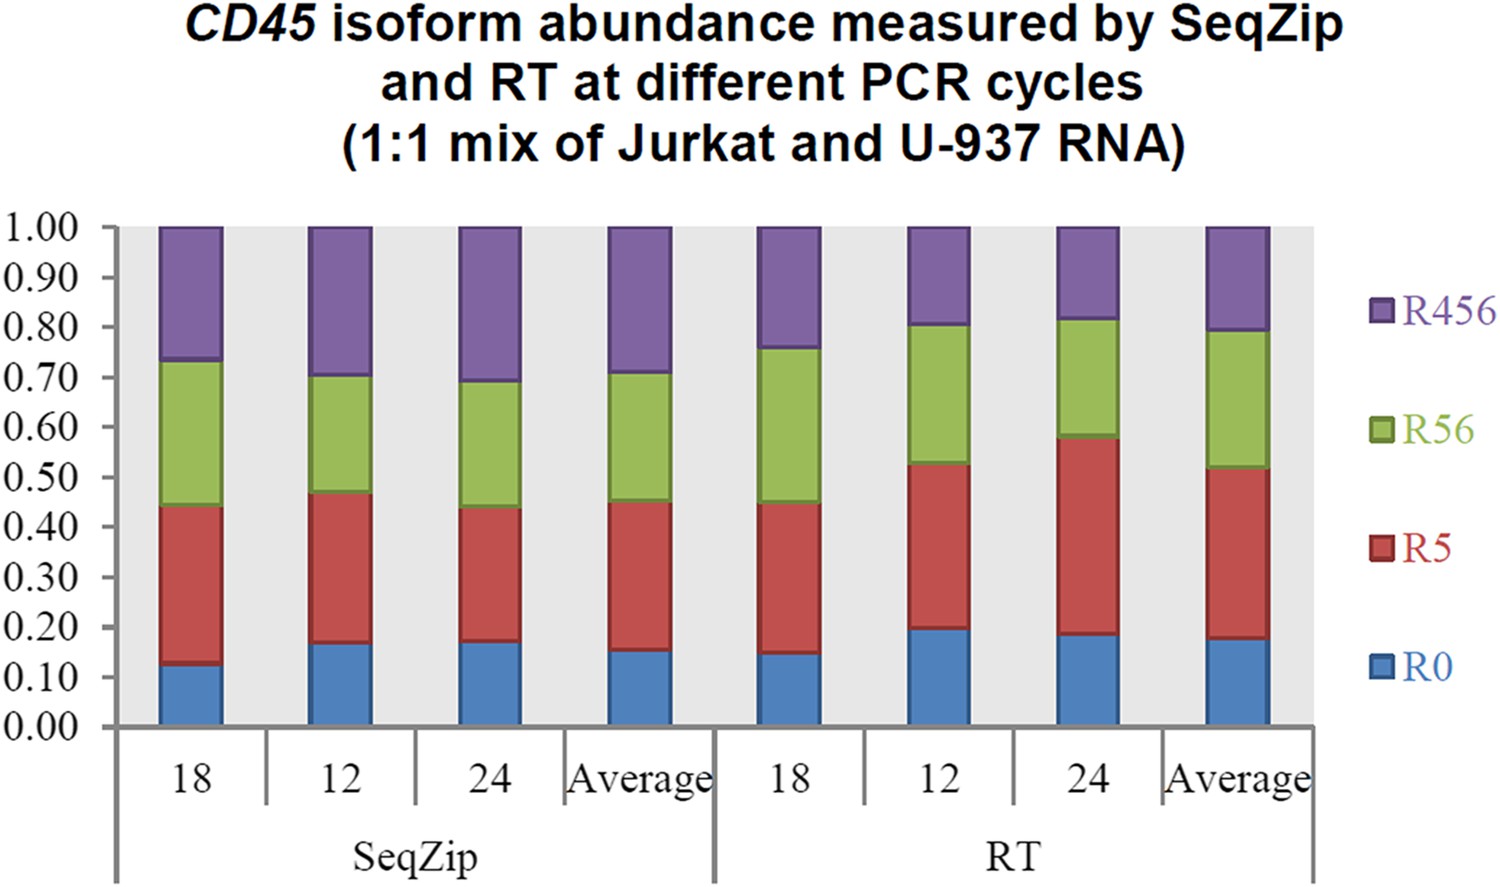
(A) The SeqZip strategy to detect human CD45 mRNA isoforms. (B) Denaturing PAGE gels showing products of reverse transcriptase (RT) (top left) or SeqZip (bottom left) CD45 mRNA obtained from two different human Jurkat and U-937 T-cell lines, or a 1:1 mixture of the two. Top right: quantified band intensities from gels at left. Bottom right: mirrored lane profiles from the mix lanes (RT—left; SeqZip—right). (C) The six possible combinations of EDA (blue; + or −) and V (light blue; 120, 95 and 0) alternative splicing within mouse Fn1 transcripts. Filled boxes depict exons, diagonal lines indicate isoform sequences not shown, and straight lines show absence of exon(s) in the final mRNA. (D) Detailed schematic of ligamer pools used to analyze indicated regions of Fn1 RNA. (E) SeqZip ligation products from immortalized MEFs with indicated Fn1 genotypes. Radioactive PCR separated on a native acrylamide gel. (F) Fn1 isoform abundance measured by SeqZip and PacBio. Black bars indicate observed individual exon (‘Individual Pool’; EDA, V) or combination frequencies (‘Combination A + V pool’, [EDA, V]). Shown in light gray are expected combination isoform intensities, and where available, the frequency of PacBio reads (mid-gray, lower bars).
Figure 4 with 1 supplement
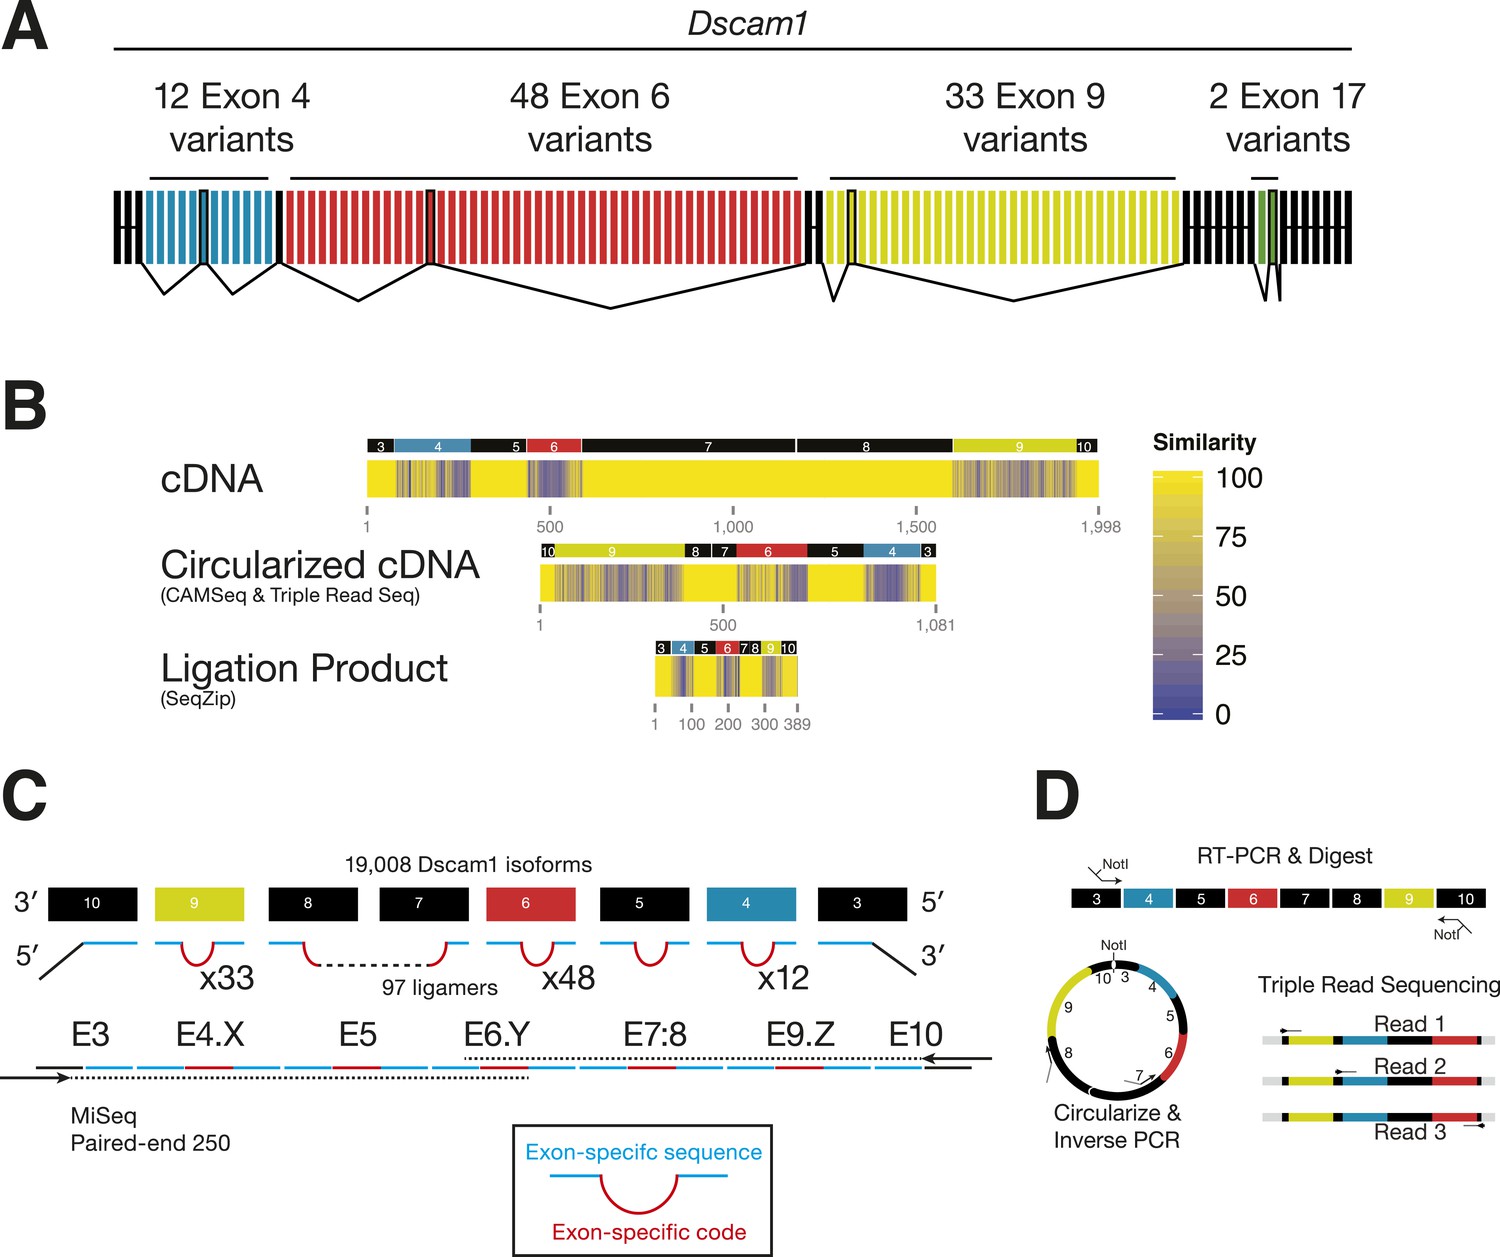
Analysis of Dscam1 isoforms via high-throughput sequencing.
(A) Architecture of Dscam1. Black: constitutively included exons; colors: variant exons. Only one cassette exon per variant region is included in the mRNA. (B) Sequence similarity between 1000 random isoforms of Dscam1 in cDNA, circularized cDNA, and SeqZip ligation product form. All lengths are shown to scale. (C) Strategy to measure Dscam1 isoform diversity using SeqZip on the MiSeq platform. (D) Strategy to measure Dscam1 isoform diversity by triple-read sequencing on the Illumina MiSeq platform.
Figure 4—figure supplement 1
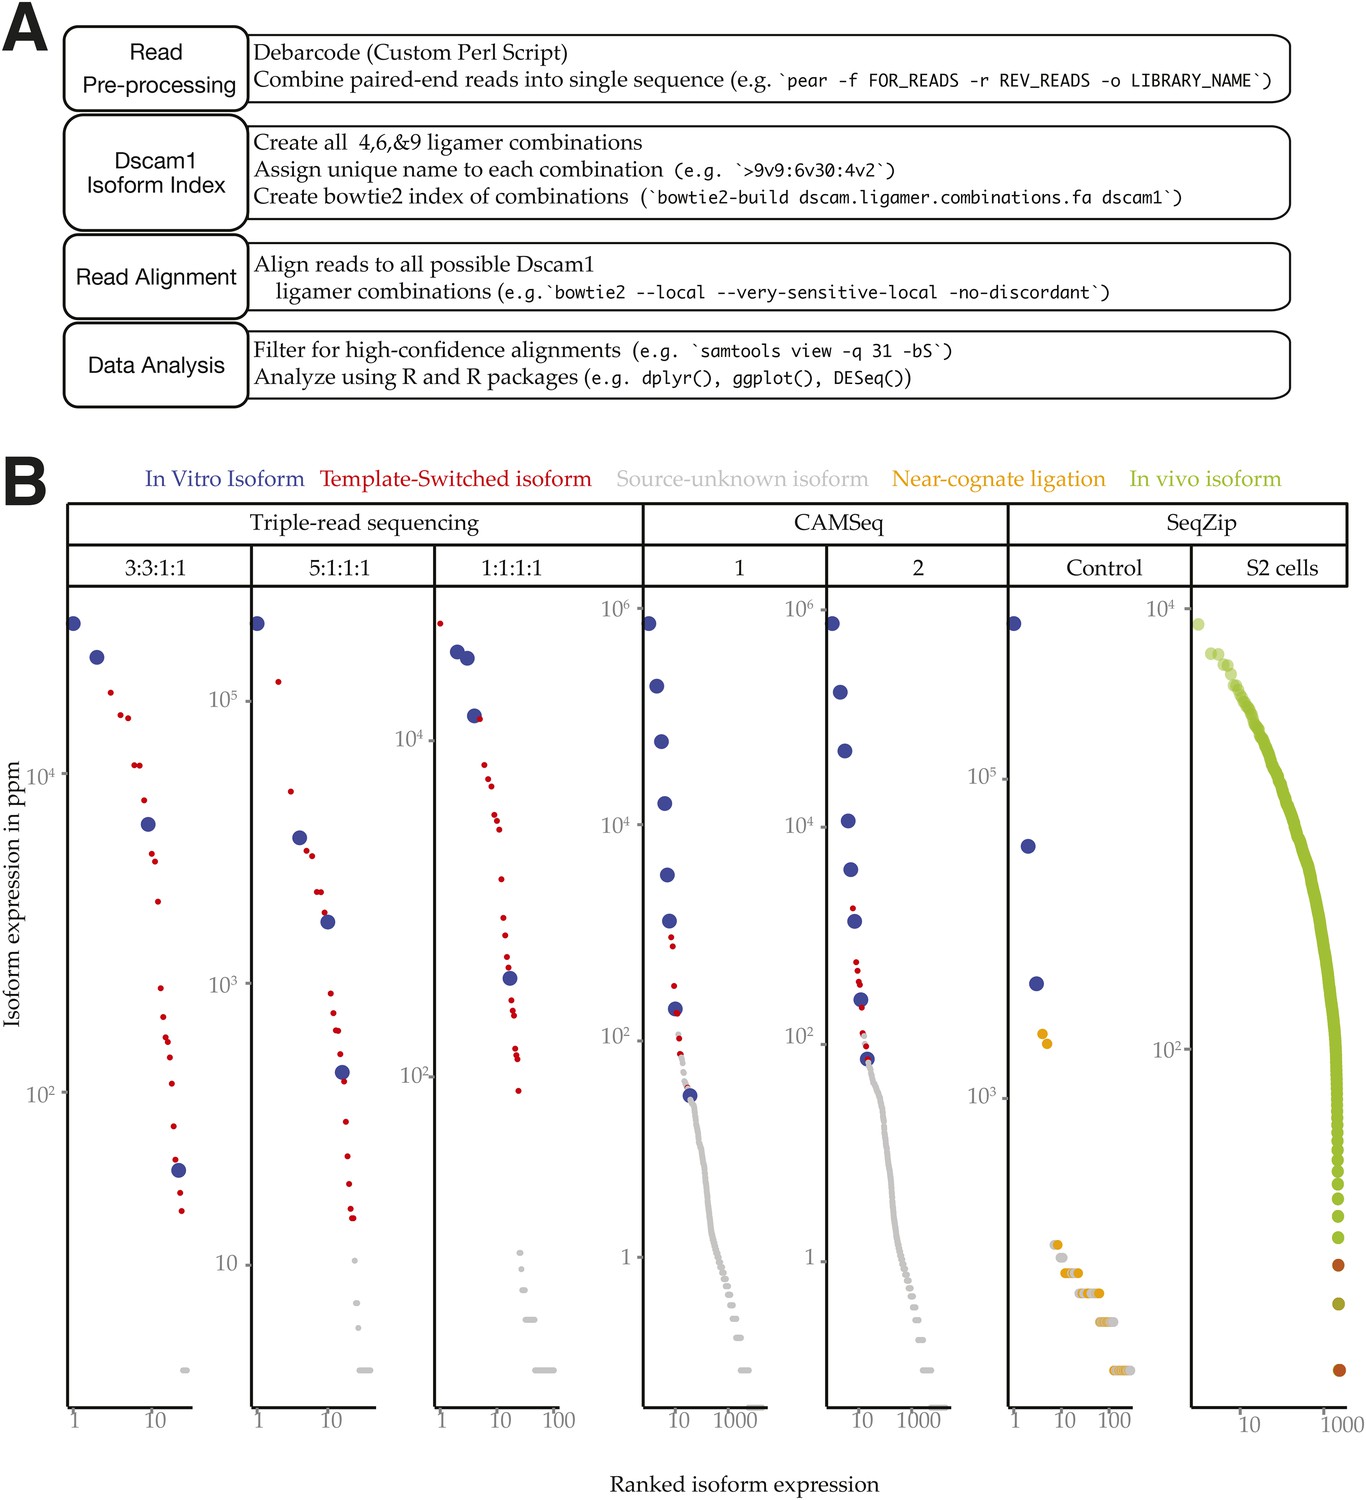
Dscam1 in vitro transcript measurement.
(A) Workflow schematic of Dscam1 ligation product sequence and alignment procedure. (B) Rank-order abundances for different Dscam1 isoforms detected in control reactions. Blue: input in vitro isoforms; red: template-switched isoforms; yellow: ligation products containing near-cognate ligamers; green: in vivo isoforms detected in S2 cell total RNA.
Figure 5 with 1 supplement
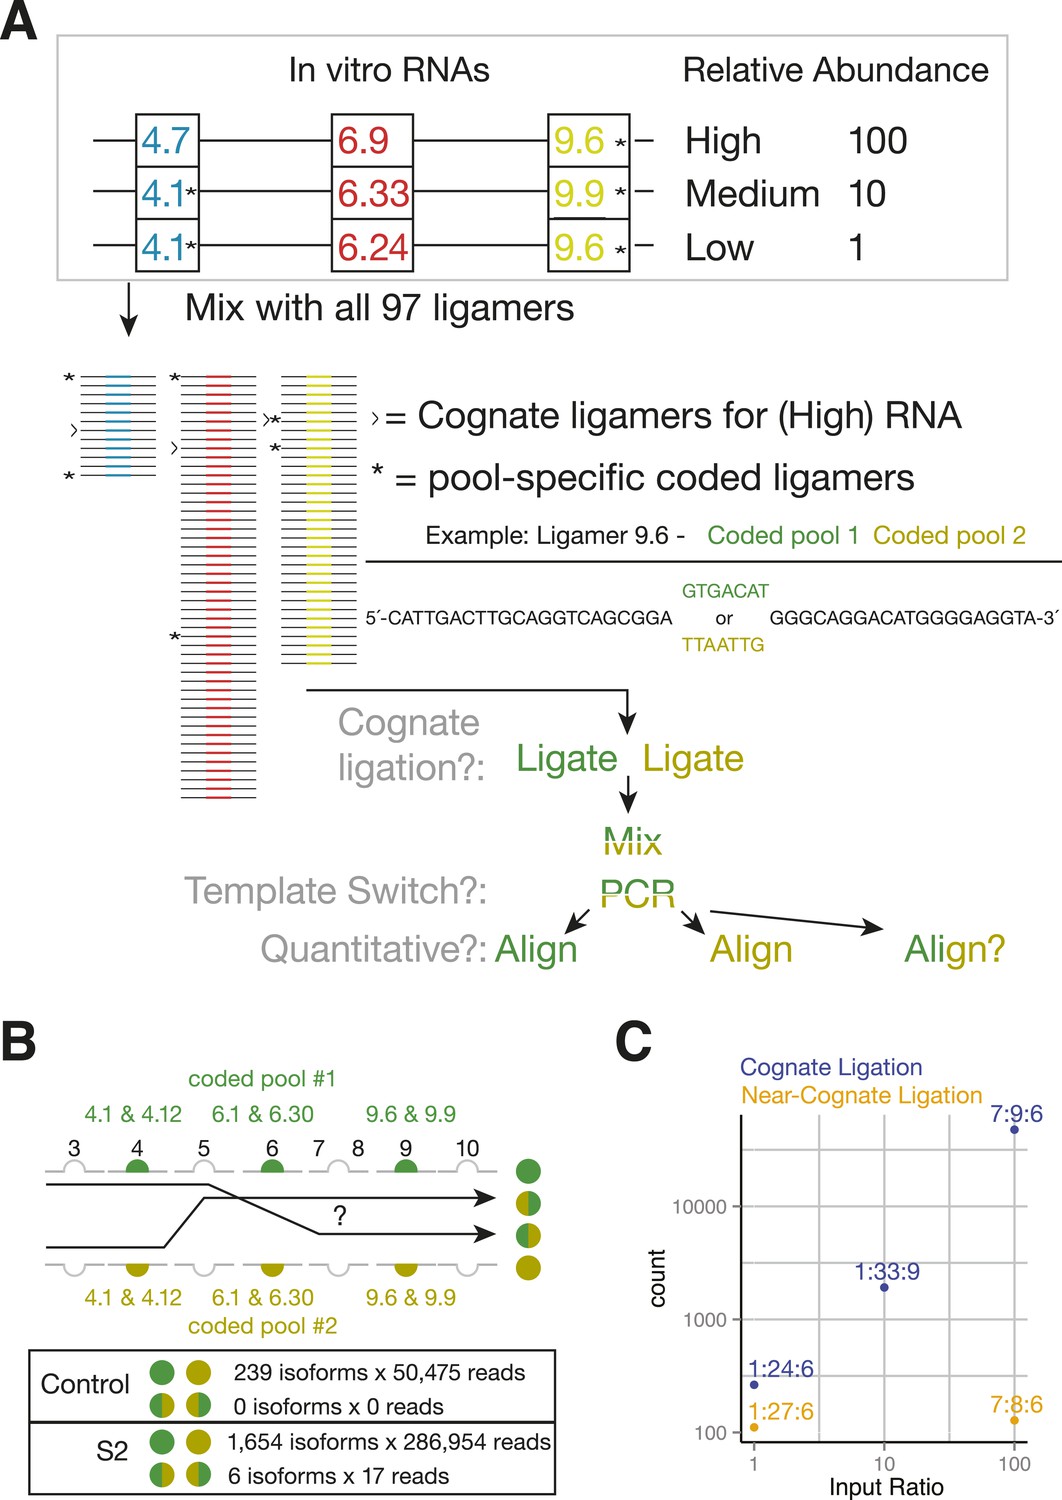
SeqZip Dscam1 control experiments.
(A) Three in vitro-transcribed cDNAs used as controls containing the exon variants indicated and mixed in a 100:10:1 relative ratio. Also shown are a schematic of the ligamer pool, with each ligamer targeting a different variant exon, the six ligamers (*) containing having different codes in pool 1 and pool 2, and a workflow for identifying near-cognate ligation and template-switching events. (B) Schematic showing how template-switched isoforms were identified as an incorrect combination of barcodes unique to the differentially coded pools shown in (A). Also shown are the observed numbers of un-switched and template-switched reads and isoforms for controls in (A) and S2 cellular RNA. (C) Quantification of in vitro-transcribed control cDNAs analyzed by SeqZip according to the workflow shown in (A).
Figure 5—figure supplement 1
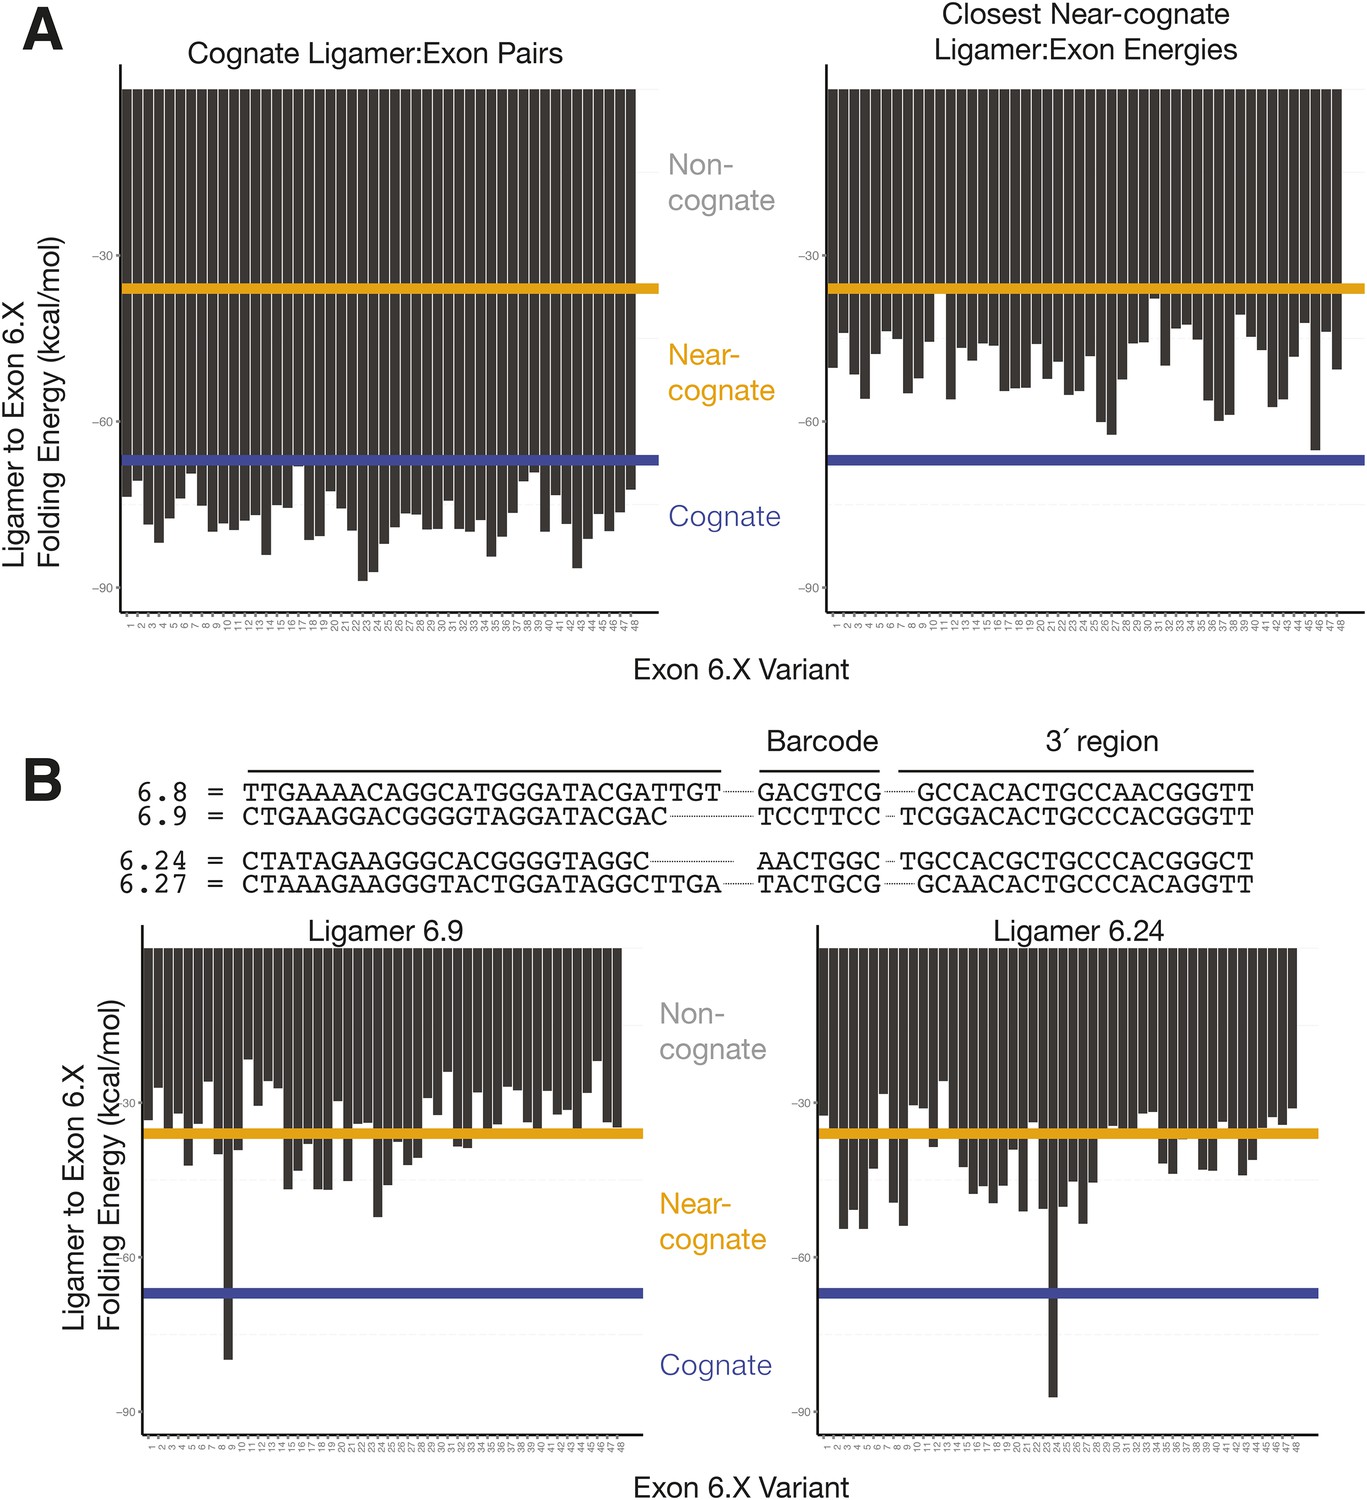
Cognate and nearest near-cognate folding energies for Dscam1 Exon 6 variant ligamers.
(A) Left: folding energies between all exon 6 variants and their cognate ligamer. Right: folding energies for all exon 6 variants and their closest near-cognate ligamer. Yellow line = −36 kcal/mol; blue line = −67 kcal/mol. (B) Comparison of 6.8 and 6.24 ligamer sequences to their closest near-cognate ligamer and folding energies between ligamers 6.9 and 6.24 to all exon 6.X sequences. Yellow line = −36 kcal/mol; blue line = −67 kcal/mol.
Figure 6 with 1 supplement
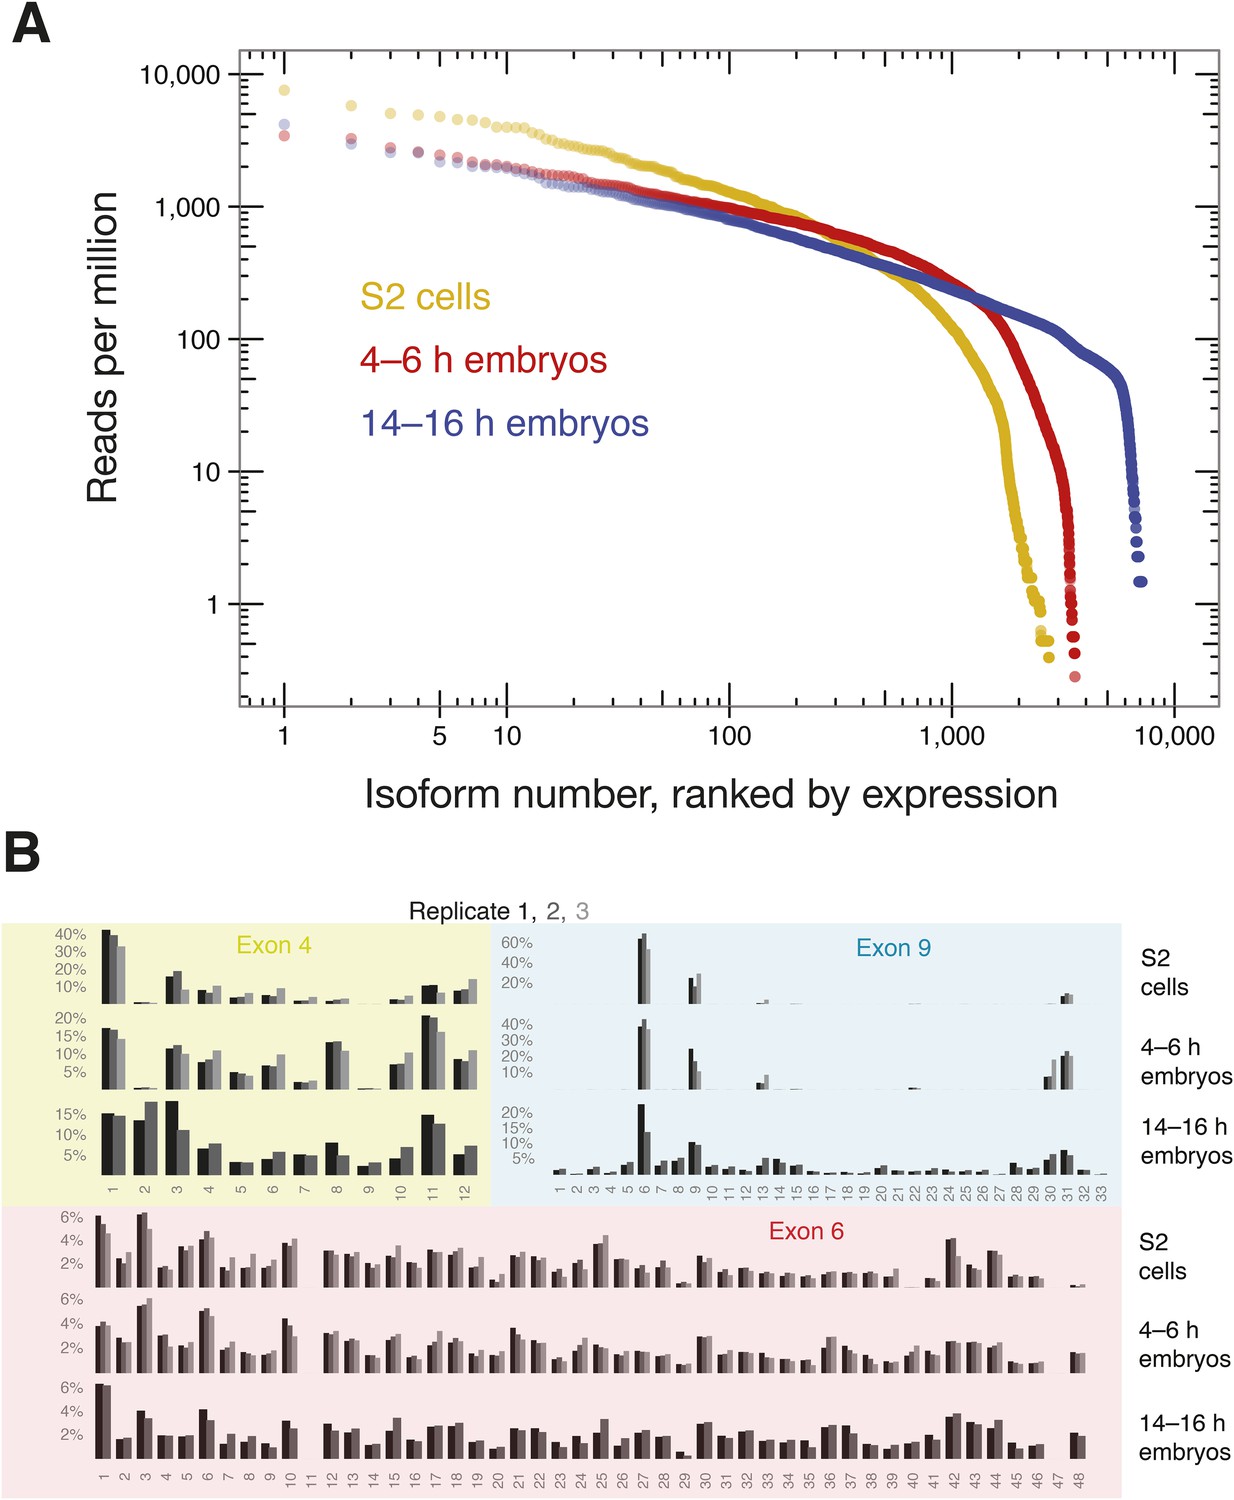
SeqZip captures diverse Dscam1 isoform expression and exon use.
(A) Rank-order of isoform expression by sample type (S2, 4–6 hr, 14–16 hr). (B) Individual exon usage per library for each replicate (differently shaded bars).
Figure 6—figure supplement 1
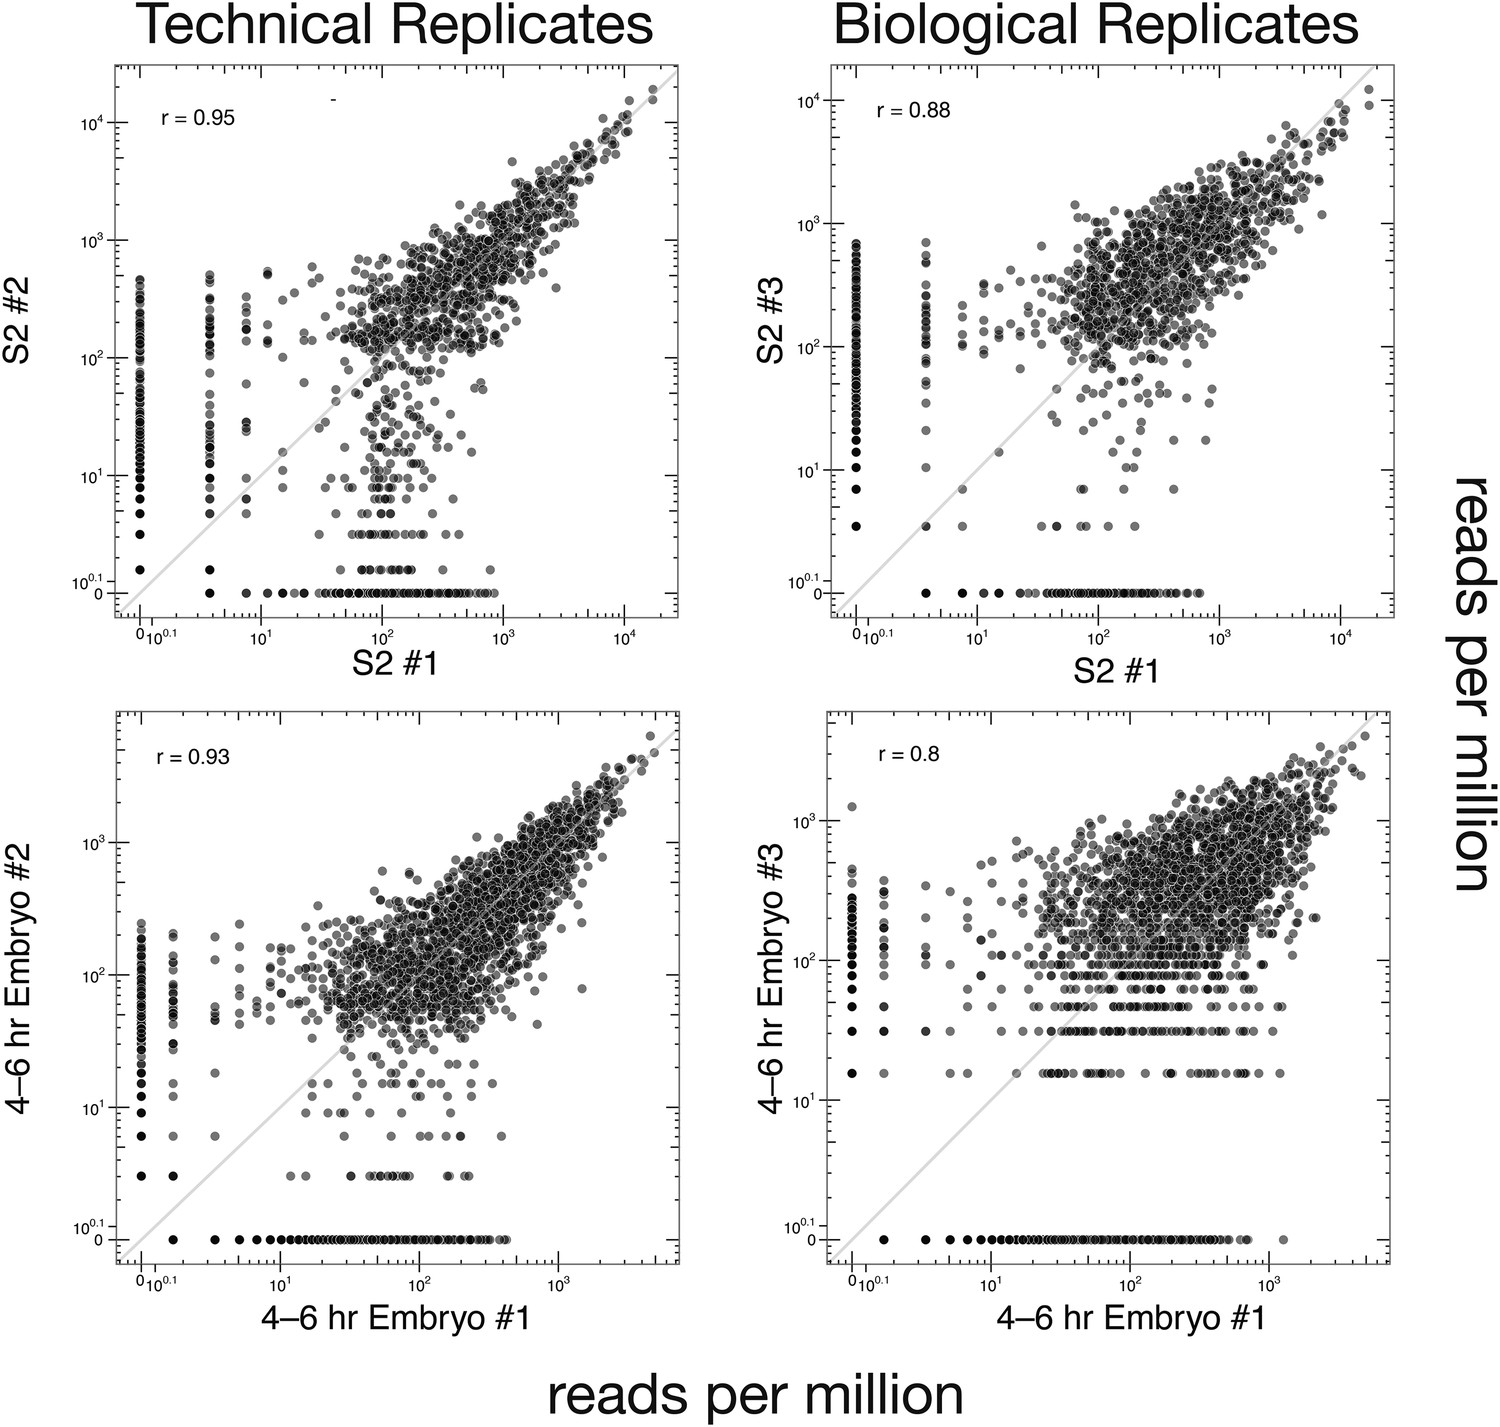
Technical and biological reproducibility of SeqZip Dscam1 isoform quantification.
Technical and biological replicates for S2 cells and 4–6 hr embryos using SeqZip.
Figure 7 with 1 supplement
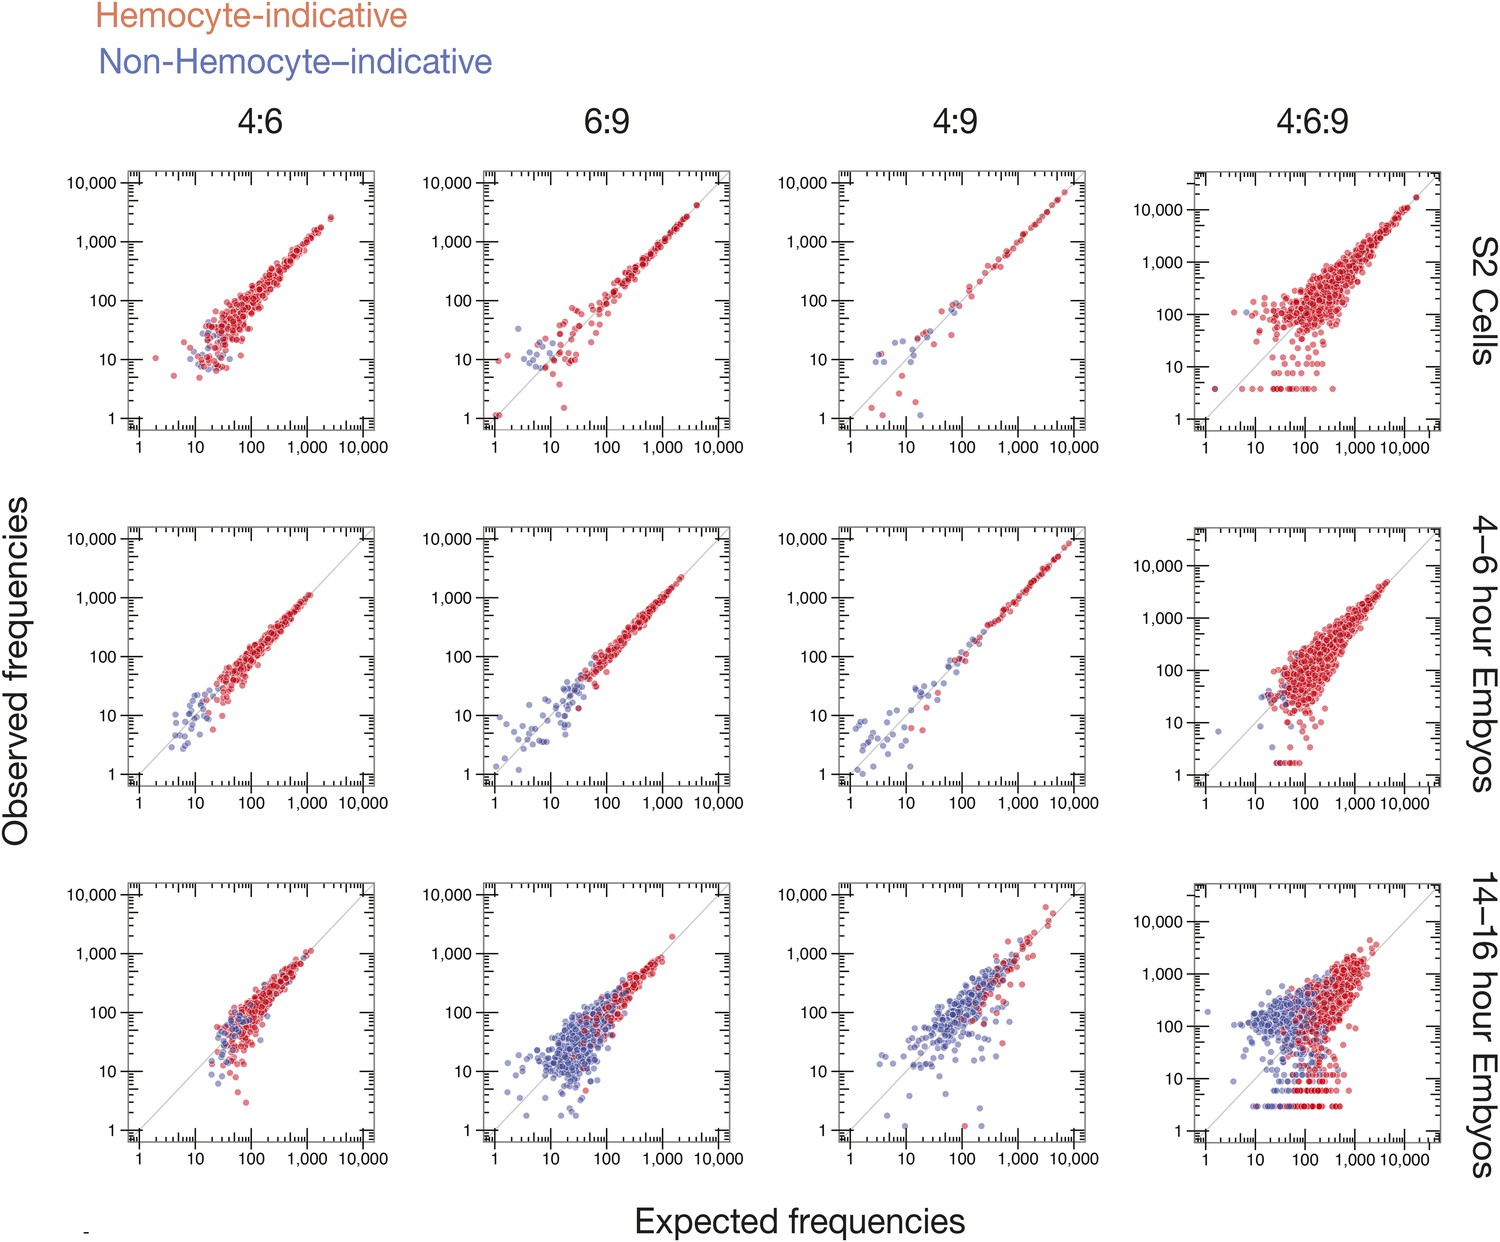
Observed vs expected Dscam1 isoform abundance.
Two-way (4:6, 6:9, and 4:9) and three-way (4:6:9) expected isoform abundances, calculated from the individual inclusion frequency for each variant exon (Figure 6B) in indicated sample type (S2 cells, 4–6, or 14–16 hr embryos), plotted against observed isoform abundances in that sample type. Isoforms are colored according to hemocyte-indicative (red) or non-hemocyte-indicative (blue) exon variants.
Figure 7—figure supplement 1
Comparison of RT-PCR and ligation-based Dscam1 isoform analysis techniques.
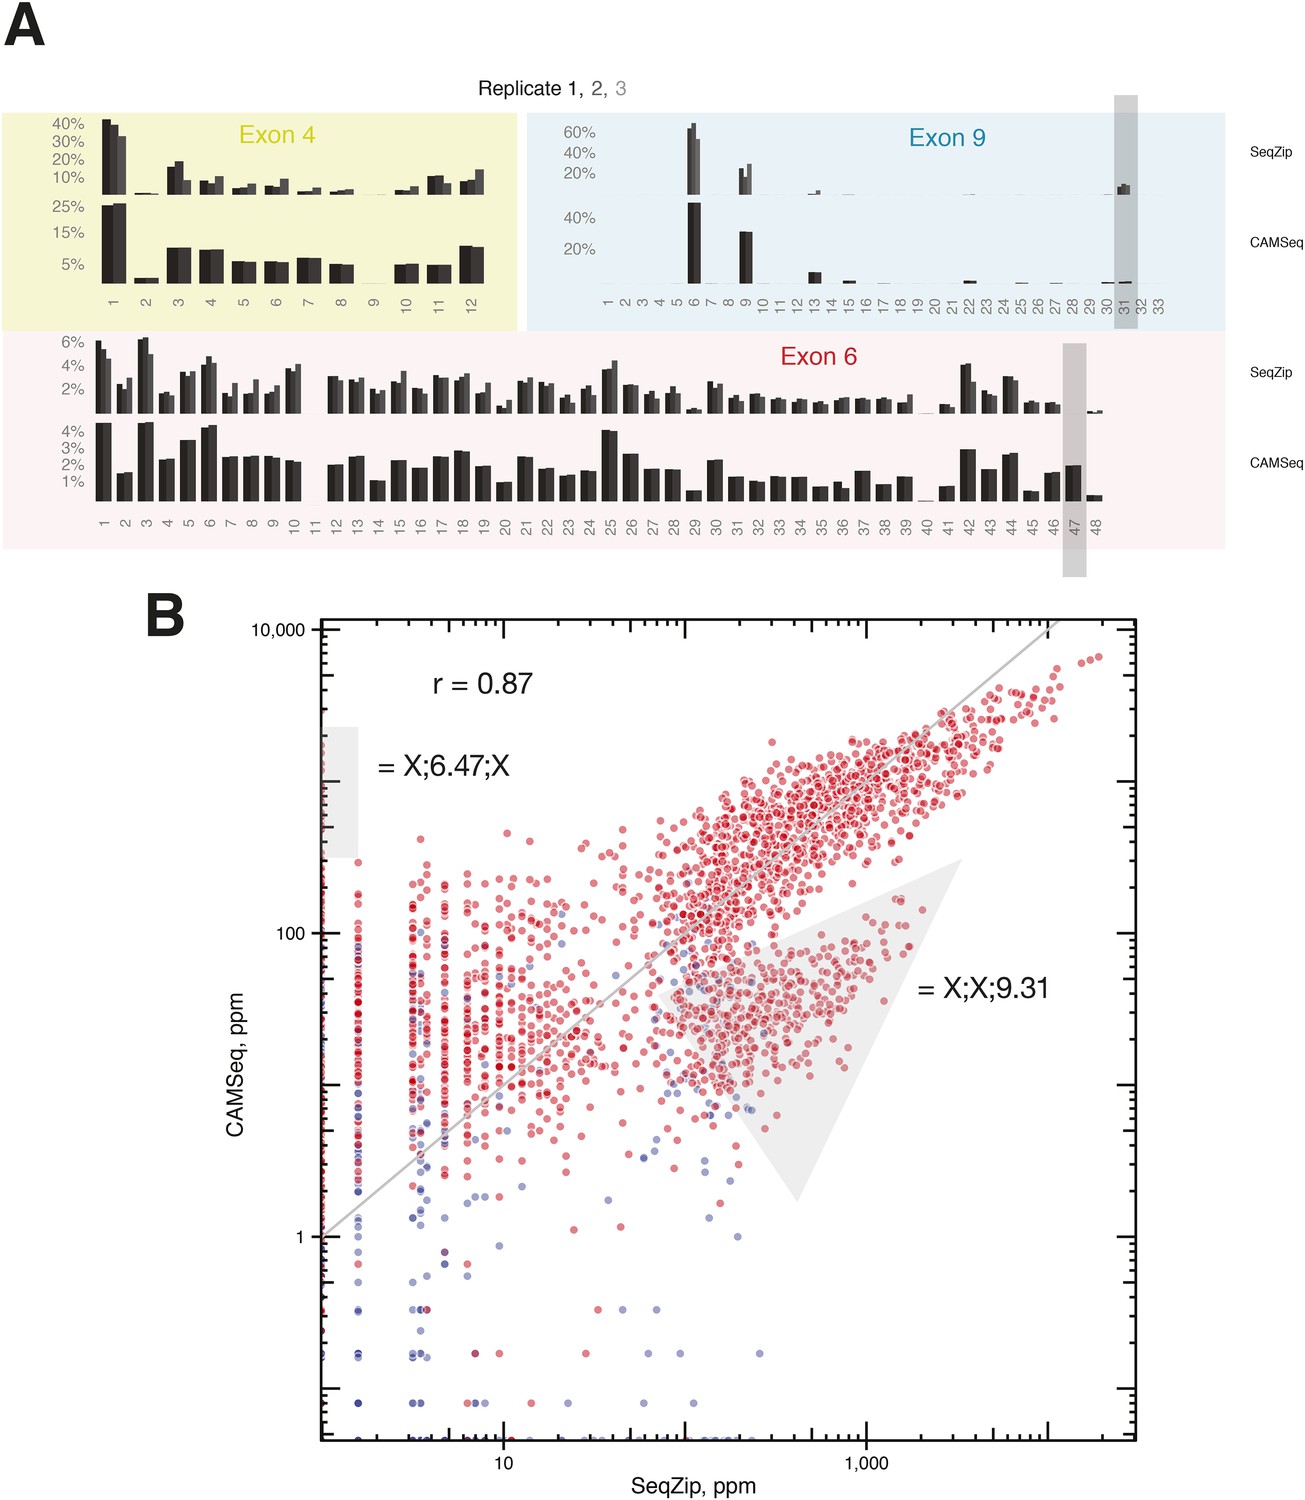
(A) Individual exon usage in S2 cells as measured by SeqZip and CAMSeq. Gray rectangles indicate exon variants (6.47 and 9.31) whose apparent inclusion frequency was substantially different between SeqZip and CAMSeq. (B) Scatter plot of isoform expression measured by SeqZip and CAMSeq. Gray areas indicate the off-axis populations containing exon variants 6.47 and 9.31.
Author response image 1
Author response image 2

Author response image 3
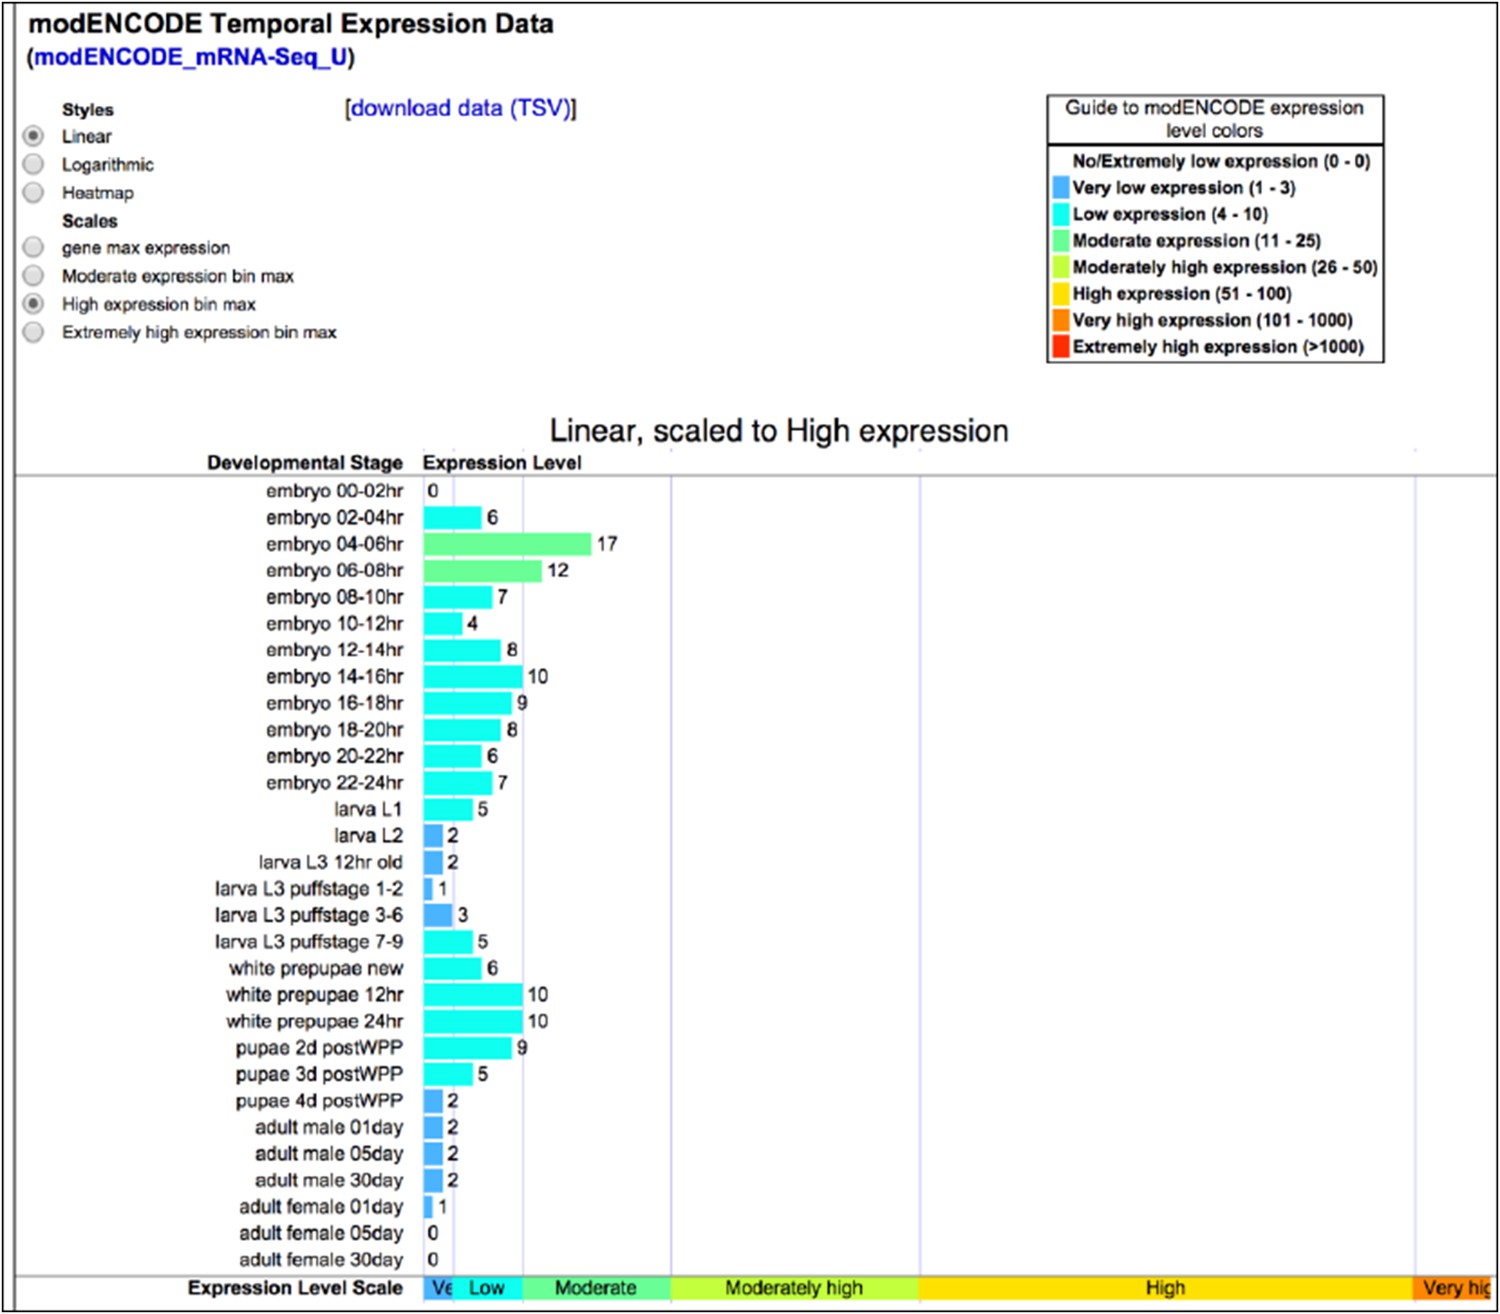
Dscam1 expression as measured by ENCODE high-throughput sequencing. Accessed 2014-10-12 via http://flybase.org/reports/FBgn0033159.html
Additional files
-
Supplementary file 1
Ligamer sequences and other information.
- https://doi.org/10.7554/eLife.03700.017
-
Supplementary file 2
Sequencing statistics.
- https://doi.org/10.7554/eLife.03700.018
-
Supplementary file 3
Ligamer folding energies.
- https://doi.org/10.7554/eLife.03700.019
-
Supplementary file 4
Dscam1 isoforms with observed expression significantly different from expected.
- https://doi.org/10.7554/eLife.03700.020
Download links
A two-part list of links to download the article, or parts of the article, in various formats.
Downloads (link to download the article as PDF)
Open citations (links to open the citations from this article in various online reference manager services)
Cite this article (links to download the citations from this article in formats compatible with various reference manager tools)
Assessing long-distance RNA sequence connectivity via RNA-templated DNA–DNA ligation
eLife 4:e03700.
https://doi.org/10.7554/eLife.03700


