Sequential conformational rearrangements in flavivirus membrane fusion
- Harvard Medical School, United States
- Boston Children's Hospital, United States
- Howard Hughes Medical Institute, Harvard Medical School, United States
Figures
Figure 1
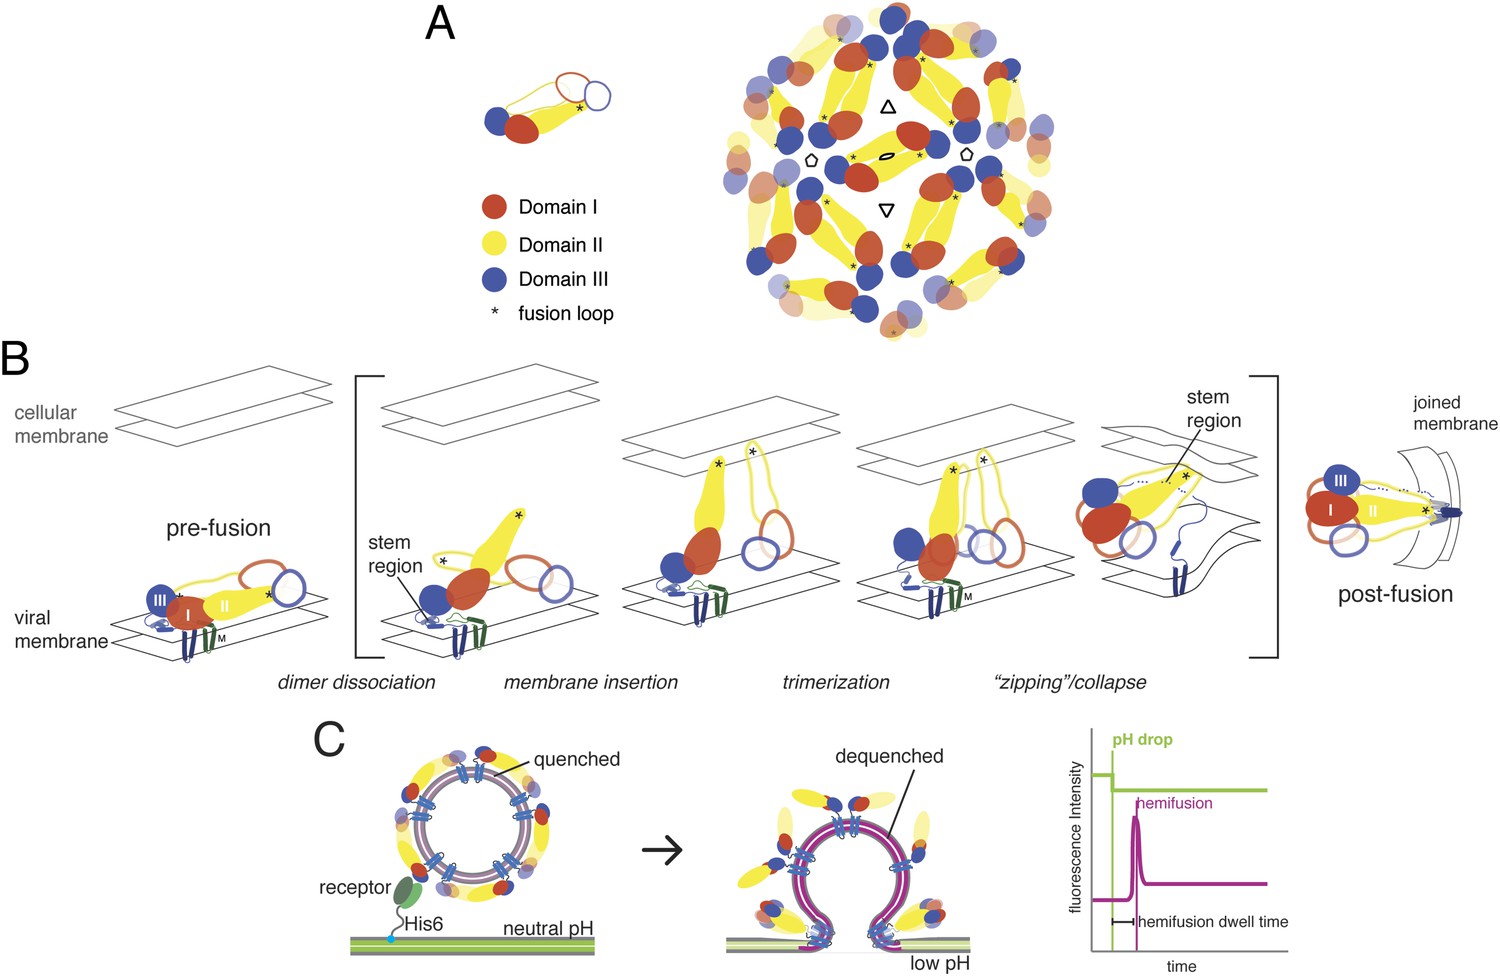
Molecular structure and conformational rearrangements in flavivirus membrane fusion.
(A) Left: domains of flavivirus E protein in the dimer on the surface of a mature virion or virus-like particle (VLP), monomers shown in solid and outline forms. right: arrangement of dimers on a small (60-subunit) VLP. (B) Schematic diagram of the low-pH induced, fusogenic transition in E, with postulated intermediates enclosed in brackets. The steps illustrated are: dissociation of the dimer and outward projection of each monomer, membrane engagement of the fusion loops (asterisks), trimerization of membrane-interacting monomers, collapse of trimer into the postfusion conformation. (C) Schematic diagram of the single-particle fusion assay used in these studies. Left: DiD-labeled VLPs are captured on the supported bilayer at neutral pH through a surrogate receptor (Fab) anchored to Ni2+/NTA-headgroup lipids; center: low-pH induced fusion and DiD dequenching; right: idealized plots of DiD fluorescence within the diffraction limited zone of the captured VLP, in which lateral diffusion and loss of intensity follows an initial burst when dequenching reports merger of proximal leaflets of the two membranes; a pH-dependent fluorophore in the membrane reports the time of pH drop.
Figure 2
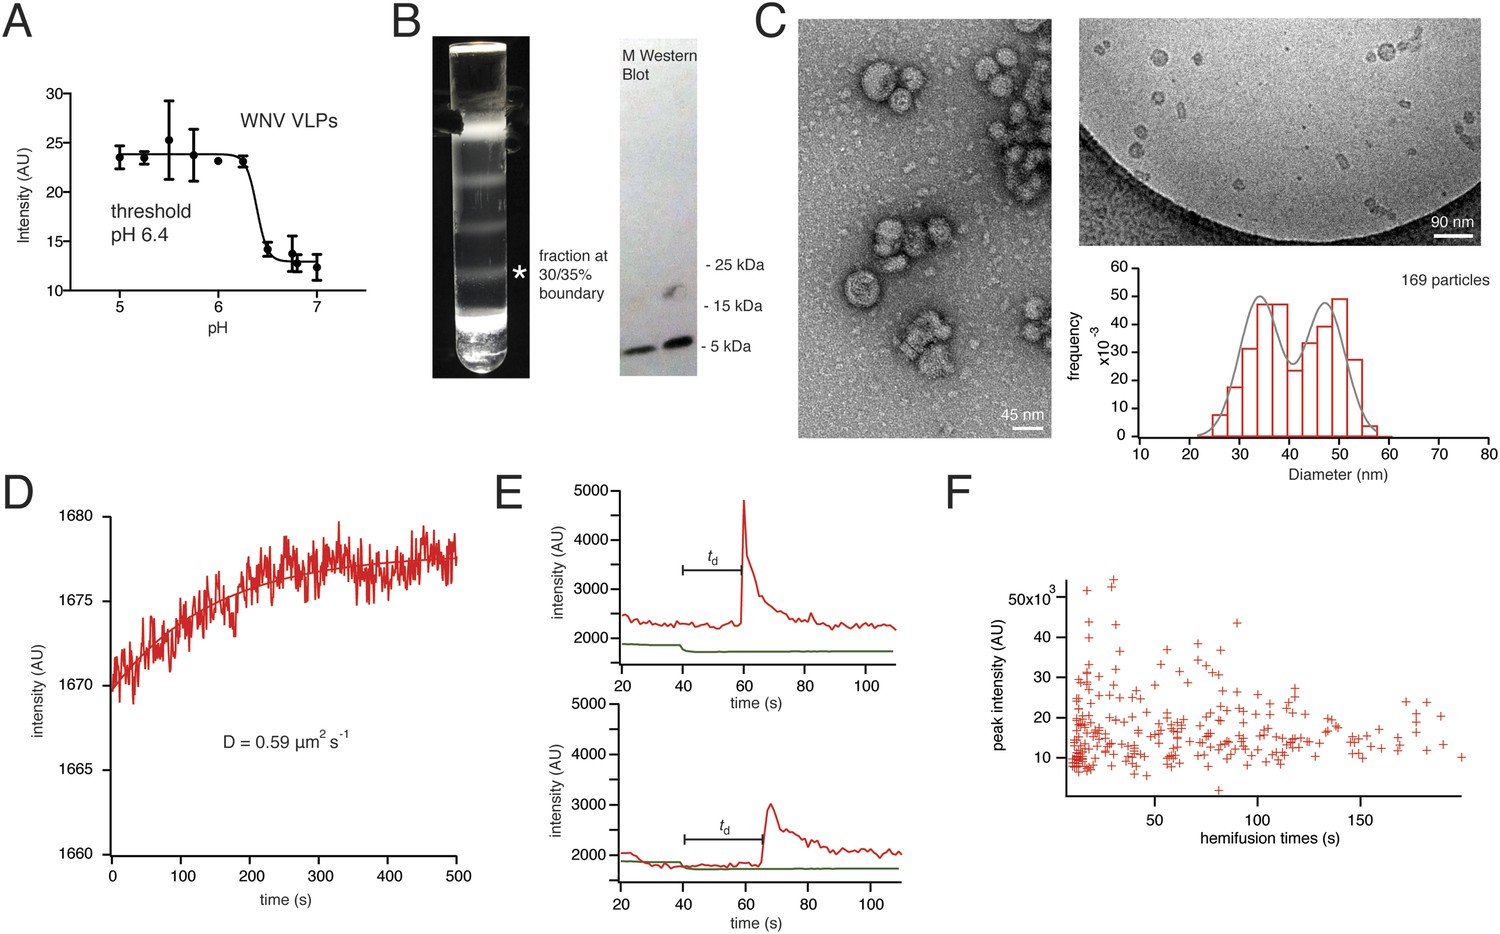
Characterization of VLPs and single-particle fusion.
(A) Bulk liposome fusion activity of purified WNV VLPs as function of pH, measured by DiD dequenching upon fusion with liposomes. (B) Discontinuous Optiprep gradient of WNV VLPs. Immunoblot at right (left lane, 25/30% fraction; right lane, 30/35% fraction), showing >95% cleavage of prM to M. (C) Negative-stain (left) and cryo- (right) electron microscopy of WNV VLPs, with histogram of size distribution of cryo-electron micrograph particles. The smaller size corresponds to 60-subunit VLPs; the larger, to 180-subunit, virion-size VLPs. (D) Fluorescence recovery after photobleaching for a region of supported bilayer, showing recovery with a diffusion constant D = 0.59 μm2/s, consistent with a fluid bilayer, calculated from D = 0.22 R2/t (Takamori et al., 2006), where R is radius of photobleached area. (E) Representative single-particle traces for fluorescein bleaching upon pH decrease (green) and DiD dequenching and diffusion (red). The bar shows the lag time (or ‘dwell time’, td) between pH drop and time of half-maximal dequenching. (F) The peak intensity of the hemifused particles does not correlate with the hemifusion lag time.
Figure 3
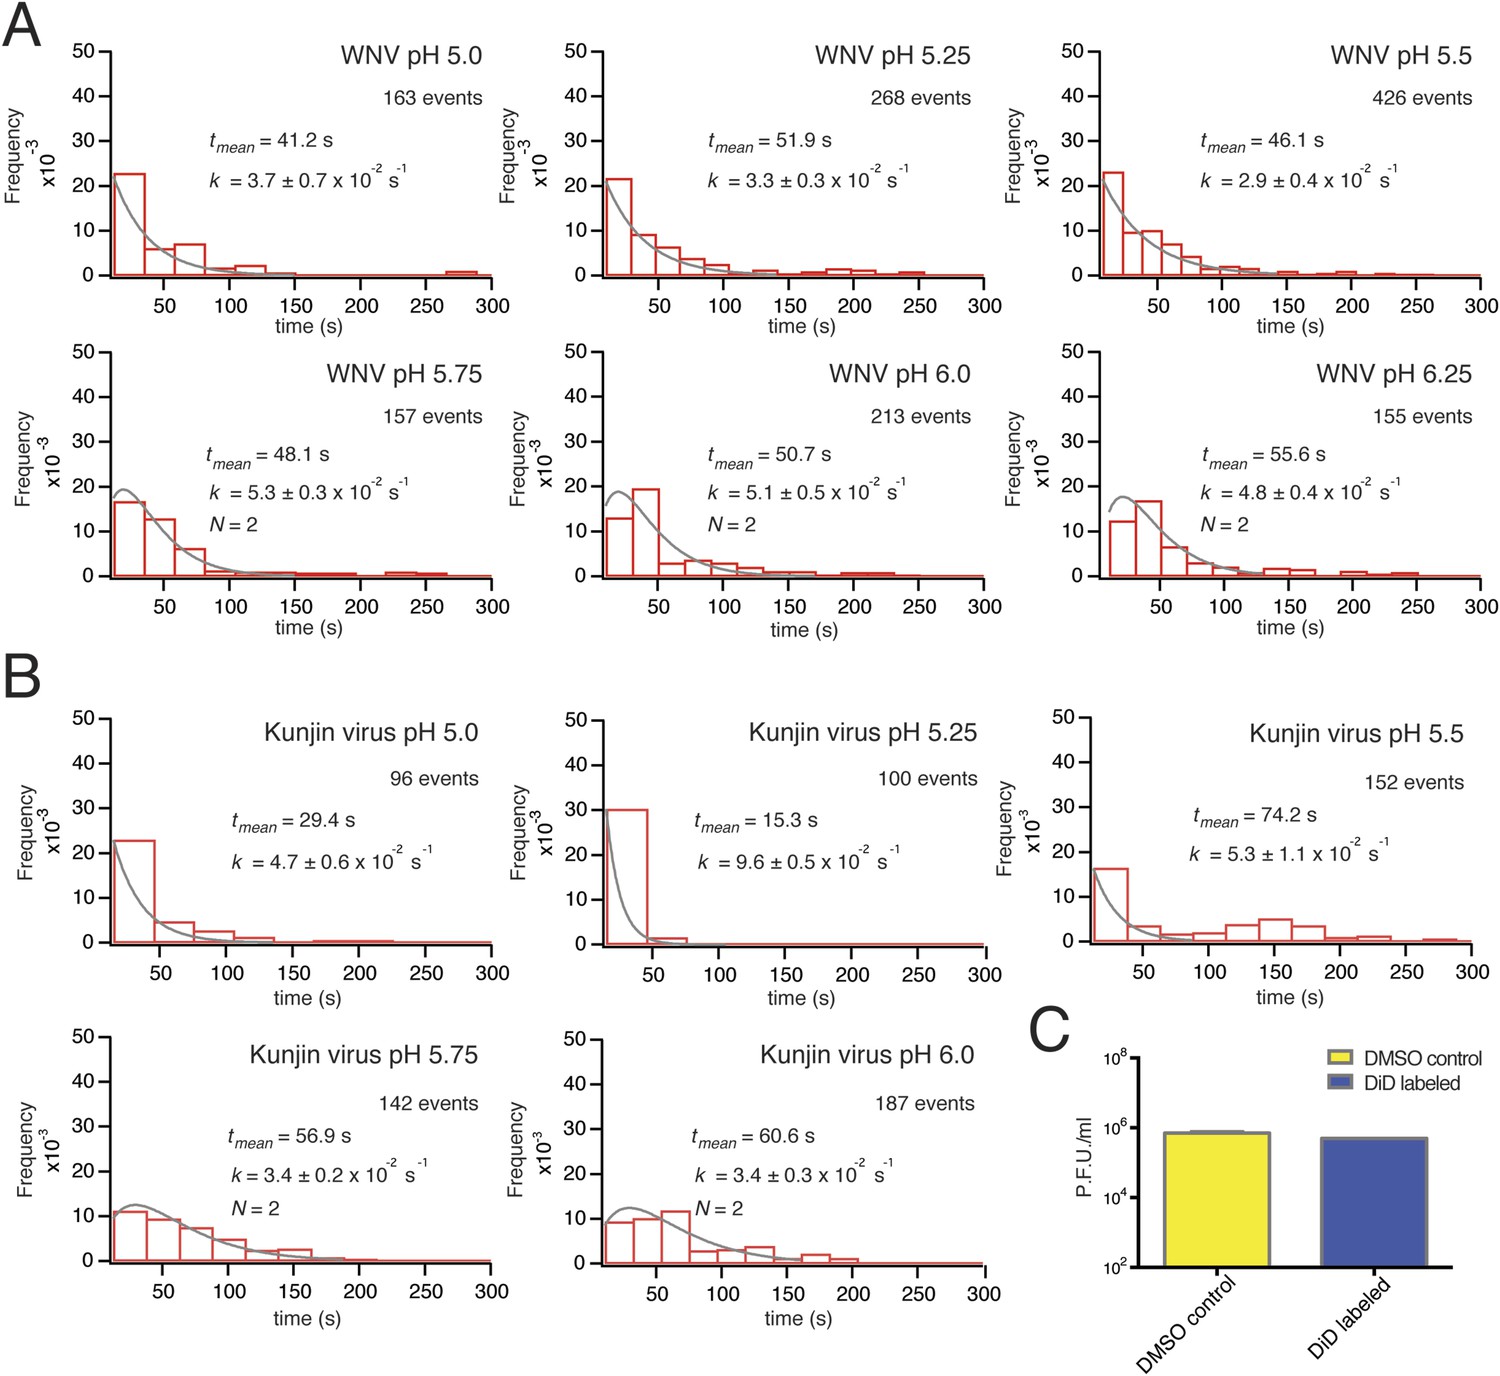
Single-particle WNV VLP and Kunjin virus hemifusion.
(A) Histograms of single-particle dwell times for WNV VLPs, pH 5.0 to 6.25, with fitted curves calculated for a process with a single exponential decay (pH 5.0–5.5) or a gamma distribution with two sequential or parallel steps (N = 2, pH 5.75–6.25) (fits calculated over the first 150 s of the data). The number of events detected and the mean dwell time (tmean) are noted (mean dwell time determined from all data). (B) Histograms of single-particle dwell times of Kunjin virus particles, with fits to a single exponential decay (pH 5.0–5.5) or a gamma distribution with two sequential or parallel steps (N = 2, pH 5.75–6.25). (C) Comparison of infectivity of carrier (DMSO) and DiD-treated Kunjin virus.
Figure 4

Data for temperature dependence, receptor dependence, and sensitivity to fusion-loop mutation for fusion of WNV VLPs.
(A) Kinetics of bulk hemifusion for WNV VLPs. Left: time to hemifusion as a function of temperature between 20°C and 36°C; right: Arrhenius plot and calculated activation energy. (B) Overall bulk fusion activity for WNV and Dengue serotype 4 (DV4) VLPs produced at 28°C and 37°C. (C) Single-particle kinetics of WNV VLP fusion with DCSIGN-R as receptor at pH 5.5; compare with Figure 3A, upper right-hand panel. (D) Single-particle fusion kinetics (left) and fusion yield (right) for WNV VLPs containing a 1:2 mixture of mutant (W101A) and wild-type E; compare with Figure 7D.
Figure 5
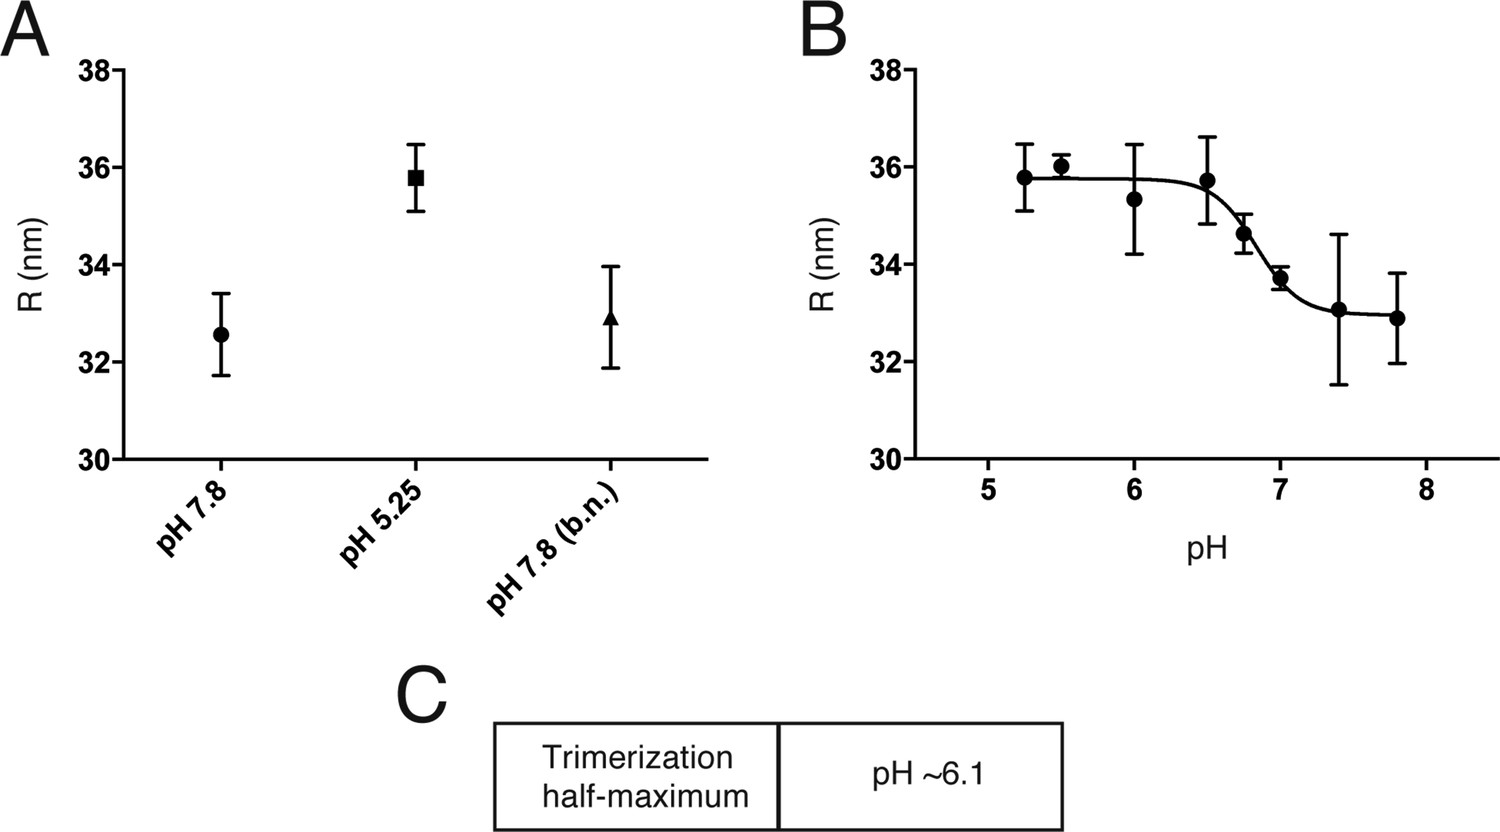
An initial reversible pH-dependent transition.
(A) Reversible increase in hydrodynamic radius of Kunjin virus upon treatment with a low pH buffer (pH 5.25). The back-neutralized (to pH 7.8) sample shows the same initial radius. (B) Hydrodynamic radius measurements of Kunjin virus over a pH range 5.25–7.8. Half maximal extension observed at pH 6.8. The transition has a Hill coefficient of ∼3.0. (C) pH half-maximal point of soluble, West Nile virus, E-protein trimerization as measured by liposome co-floatation.
Figure 6
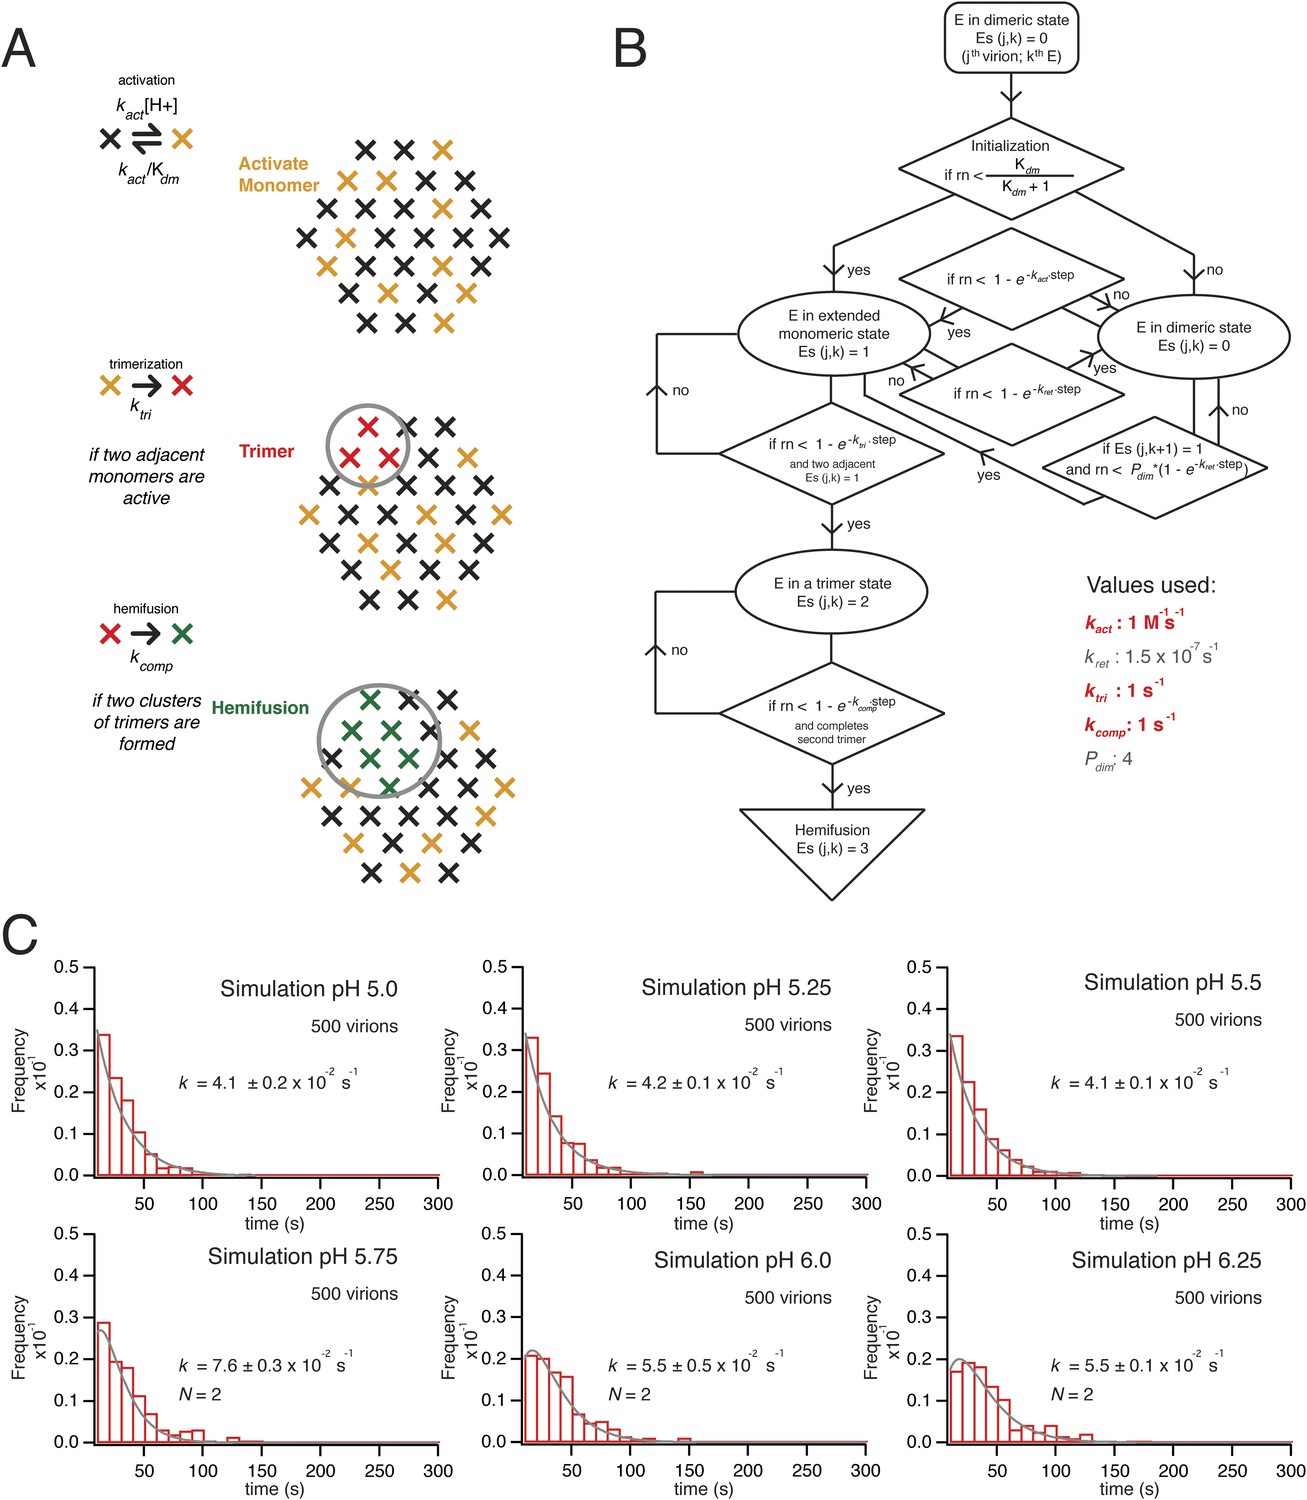
Simulation of time course to hemifusion.
(A) Schematic for simulation of a flavivirus contact patch. E monomers are arranged in a hexagonal lattice (an idealization of the more complex arrangement on the virion surface). Each monomer can be in one of four different states: inactive monomer, active monomer, trimer member (with the condition that two adjacent monomers are active; if the condition holds, all three become trimer members), hemifusion mediator (with the conditions that it completes a trimer adjacent to another trimer). Dimers are defined explicitly as adjacent monomers in the lattice. The dimer-monomer transition is reversible; the trimerization and hemifusion steps are irreversible. The forward rate constant, kact, reflects the dimer to monomer transition, while the reverse rate constant, kret, reflects the monomer to dimer transition. The pH-dependent equilibrium constant is Kdm = (kact/kret)[H+]. The assumption of reversibility in the dimer-monomer transition is based on dynamic light scattering observations (Figure 5A). Cooperativity of dimer activation is described by a factor, Pdim, by which the probability for dimer-to-monomer transition is multiplied. The rate ktri is the rate constant for completing one trimer. The rate constant kcomp reflects the transition to hemifusion upon completion of the defined number of adjacent trimers. (B) Flow diagram of simulation, with final values optimized to the mean dwell time and fit over the experimental range of pH indicated in the figure. Free parameters shown in bold and red; fixed parameters, in gray. (C) Histograms for simulations of virions with kact, ktri and kcomp set to values shown in panel B, over the pH range 5.0–6.5. The curves for each histogram are a single exponential for pH 5.0–5.5 and a gamma distribution with N = 2 for pH 5.75–6.25.
Figure 7
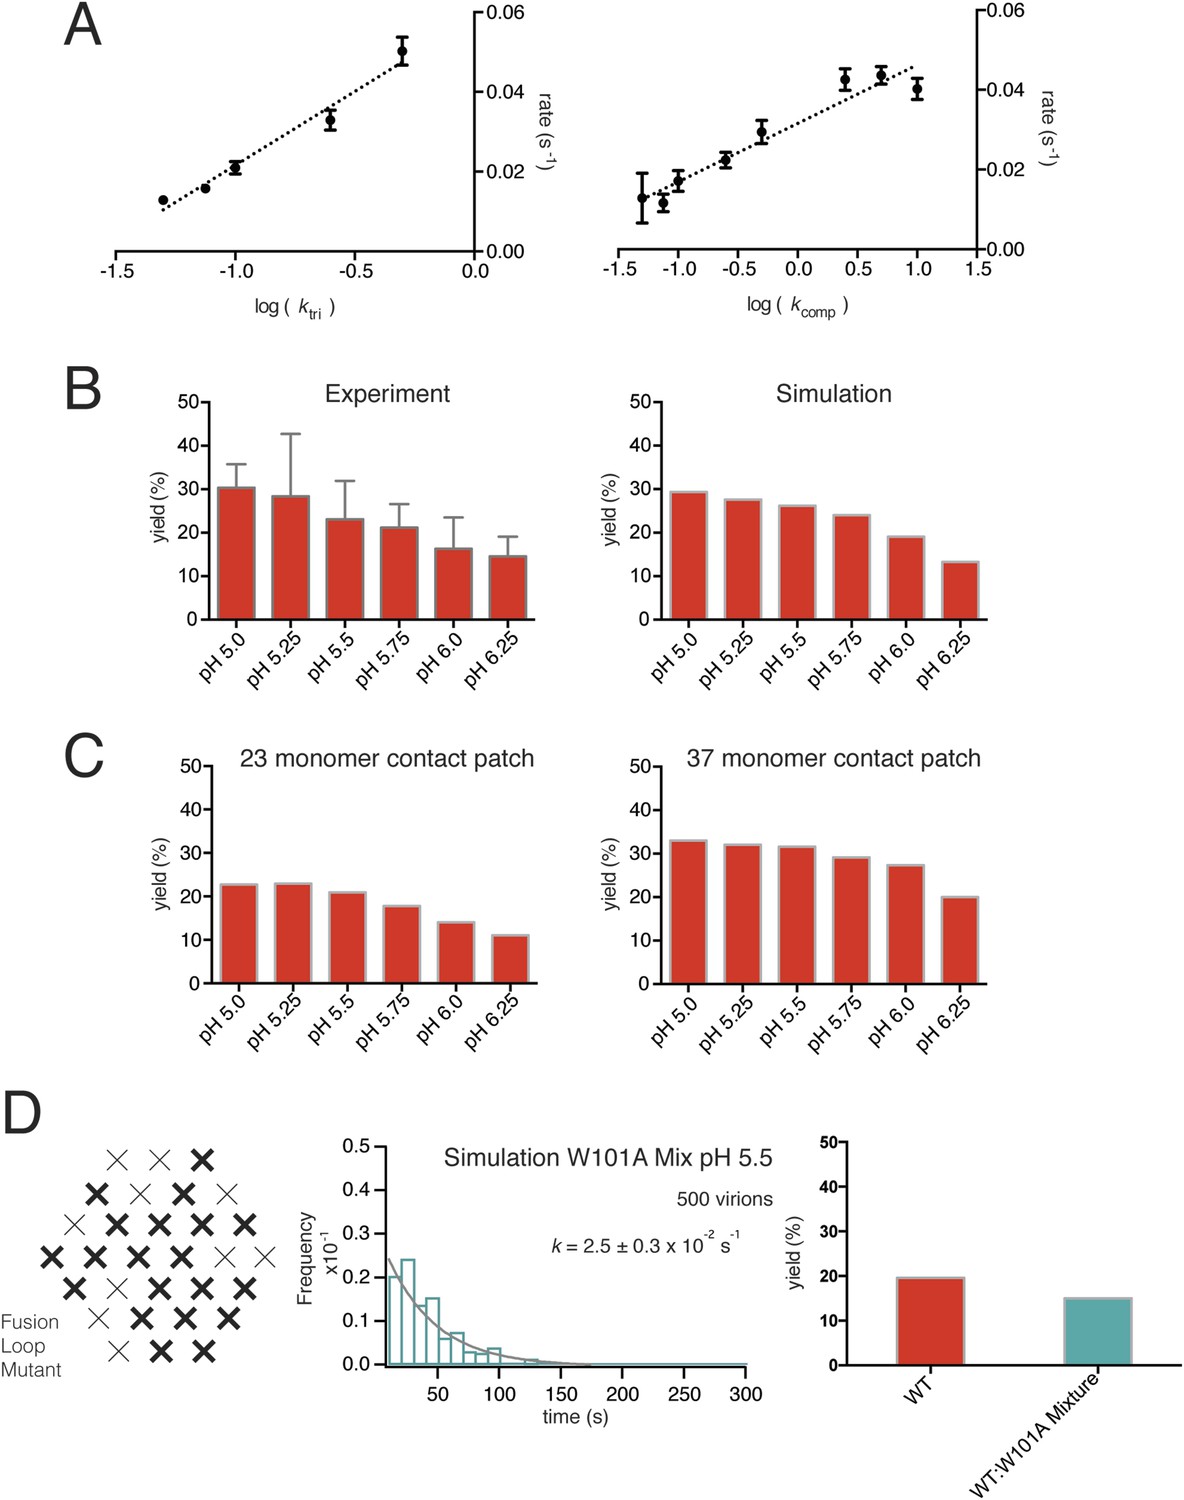
Simulations varying rate constants and contact-patch size and including mixture of wild-type and mutant E.
(A) Overall hemifusion rate at pH 5.5 from simulations with all parameters fixed at values shown in Figure 6B except for ktri or kcomp (left and right panels, respectively). (B) Yield of single particle hemifusion events (total number of fusion events/total number of identified particles in the field) as measured at different pH (left) and simulated with a 31-monomer contact patch (right), with Kdm set at 6.8 and ktri set with a pH 6.1 half-maximal transition point. (C) Yield in simulations with 23-monomer and 37-monomer contact patches. (D) Simulation of time course and yield for mixed particles in which one-third of the E monomers could not stably engage the membrane but could be part of a trimer. One third was chosen for the proportion of dead subunits in simulation, because it is expected that the proportion of the mixed particles in the experiment with predominantly W101A subunits in their contact area would flow away upon pH drop and not be recorded. We assumed that trimers with one inactive monomer could participate in induction of a hemifusion stalk but that trimers with two or three inactive monomers could not. Compare with Figure 4D.
Figure 8
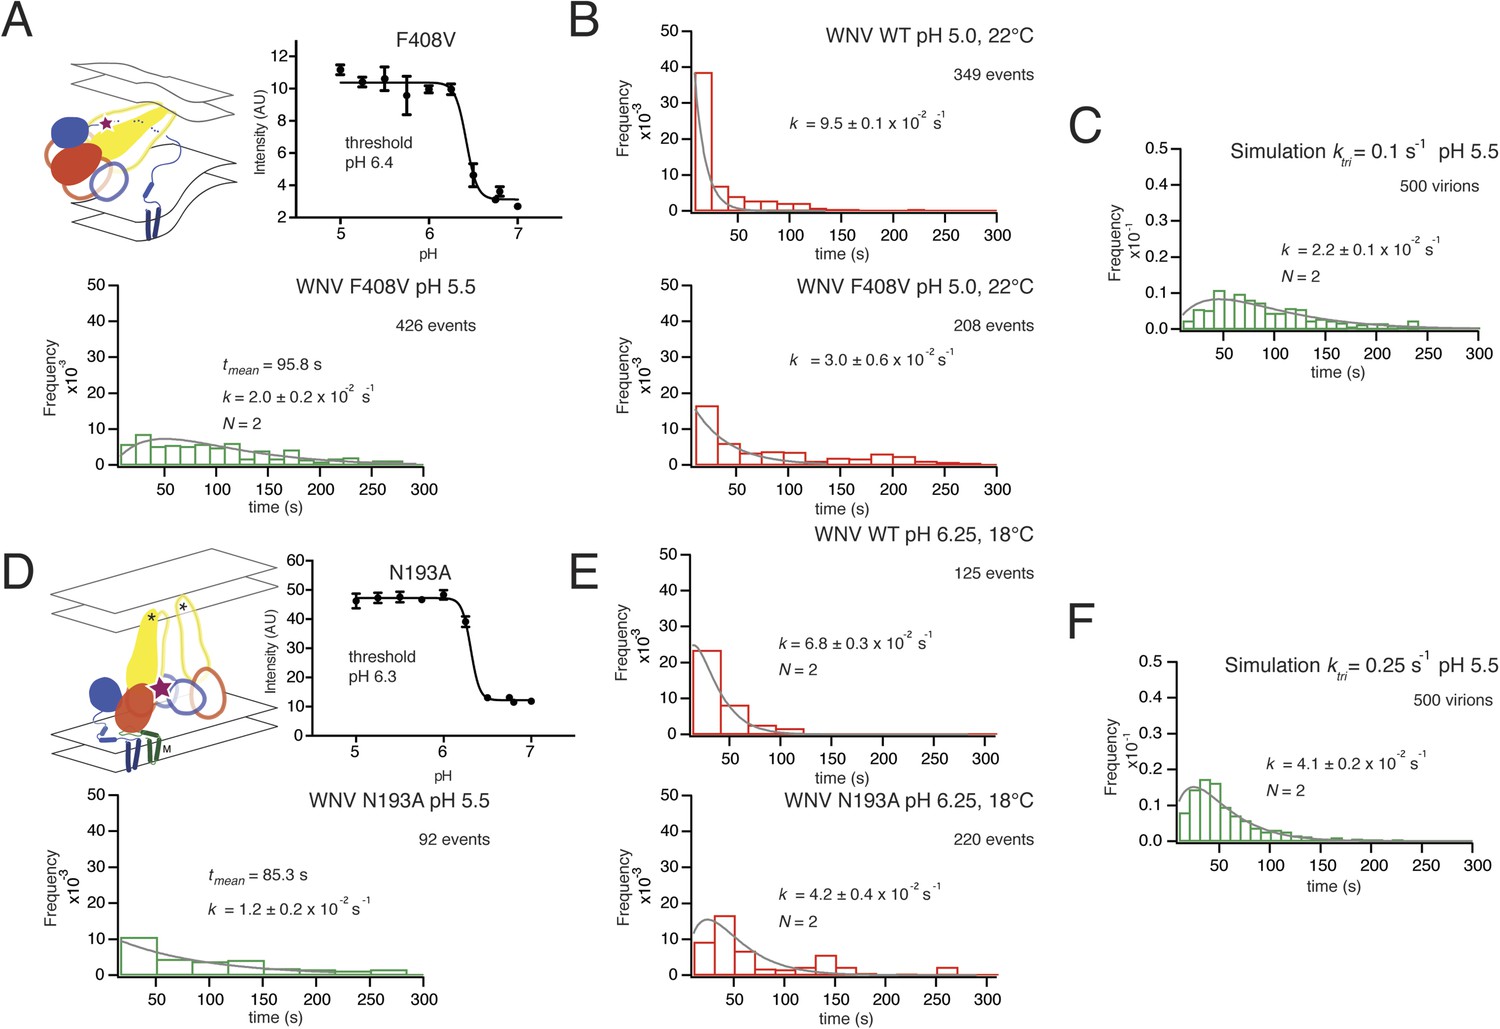
Effects of mutations in E on VLP hemifusion.
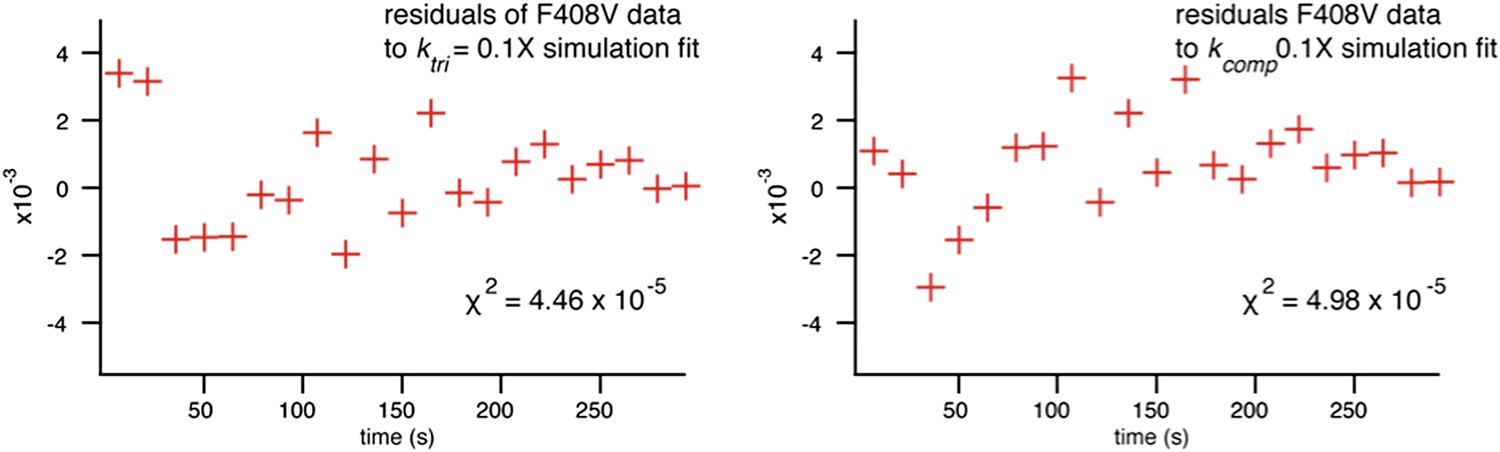
(A) Schematic of conformational state targeted by F408V mutation (residue mutated indicated by star), bulk hemifusion titration and the single particle data histogram; compare with Figure 3A, upper right-hand panel. (B) Single particle data for wild type and F408V WNV VLPs under conditions to accelerate the hemifusion reaction (pH 5.0, 22°C) (C) Simulation of WNV fusion with ktri parameter reduced to 0.1 s−1. (D) Schematic of N193A conformational rearrangement (residue mutated indicated by star), bulk hemifusion data and single particle data; compare with Figure 3A, upper right-hand panel. (E) Single particle data for wild type and N193A under conditions to further slow the reaction (pH 6.25, 18°C). (F) Simulation of WNV fusion with ktri parameter reduced to 0.25 s−1.
Figure 9
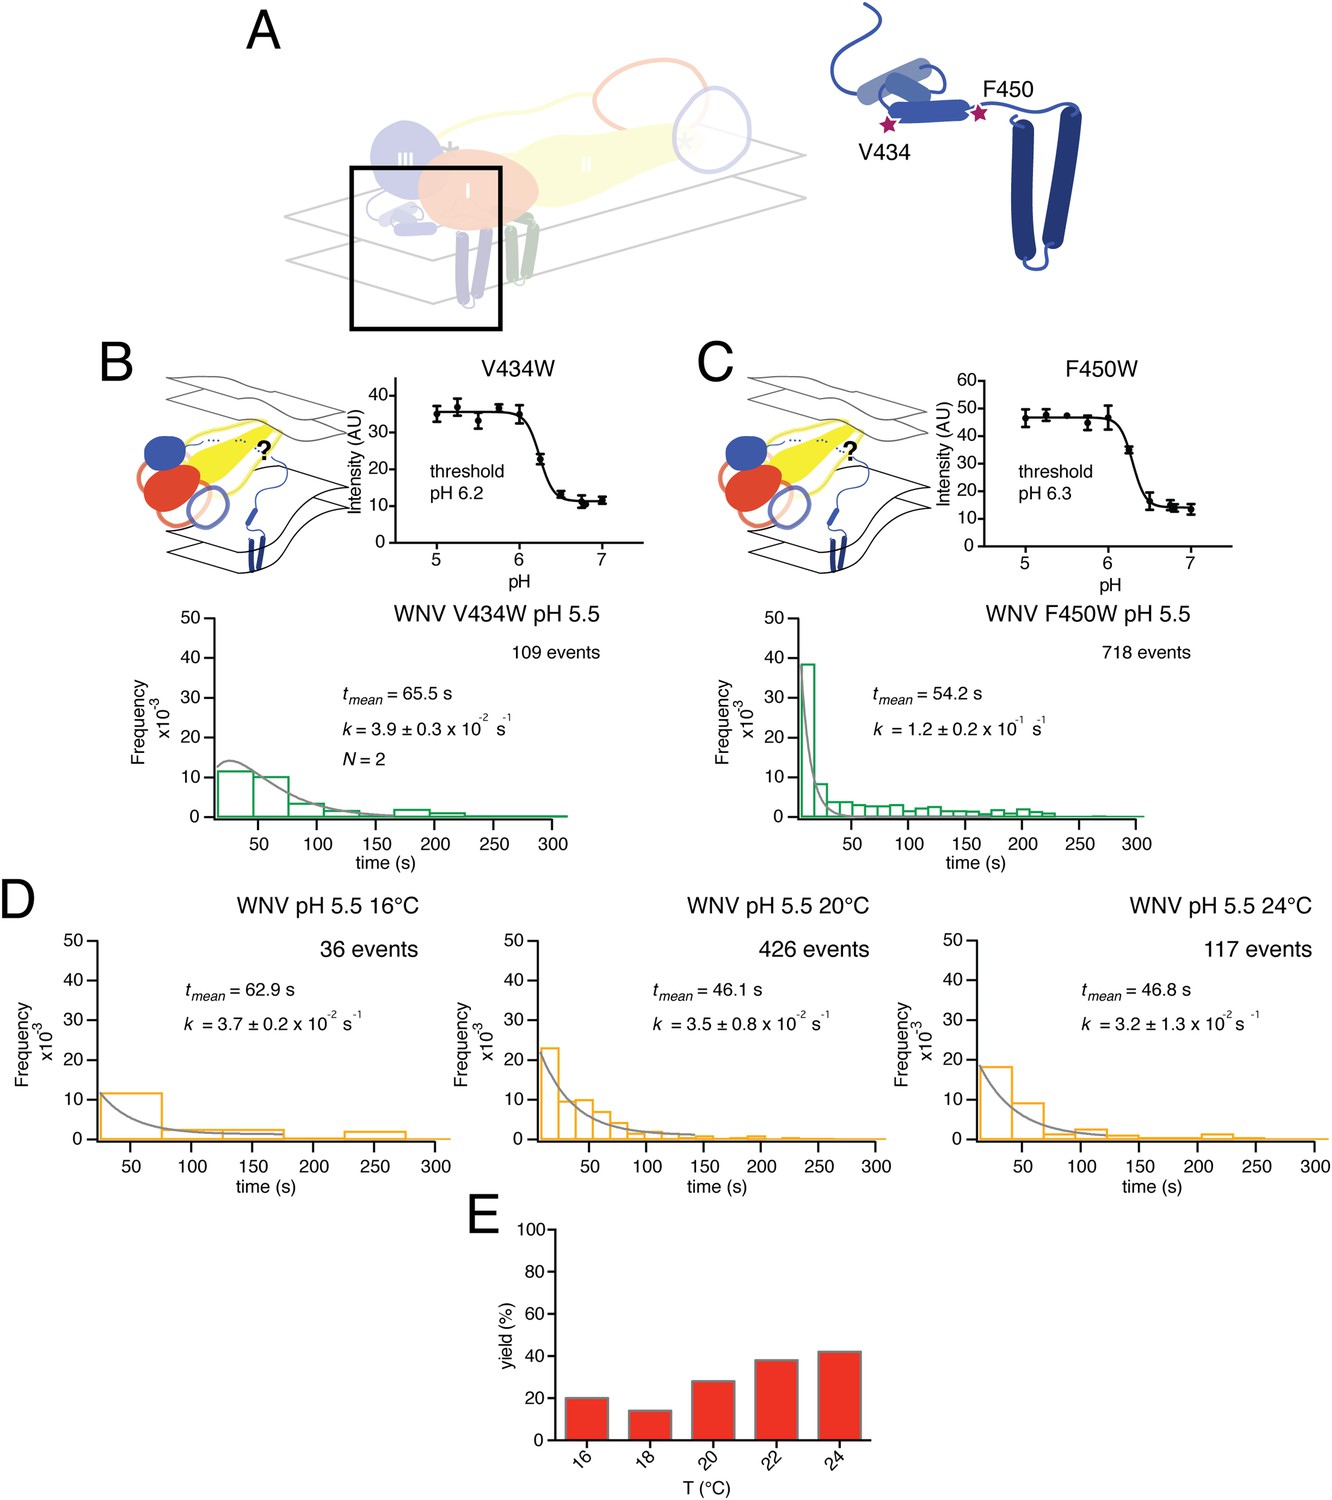
Effects of mutations in membrane-proximal segment of E and temperature on VLP hemifusion.
(A) Schematic of stem region in pre-fusion state with mutations indicated by stars. (B) Schematic, bulk fusion data, and single particle data for V434W mutant at pH 5.5, 20°C; compare with Figure 3A, upper right-hand panel. (C) Schematic, bulk fusion data, and single particle data for F450W mutant; compare with Figure 3A, upper right-hand panel. (D) Single particle WNV VLP data at 22 and 24°C fit to a single exponential. (E) Yield of single particle events from 16 to 24°C.
Figure 10
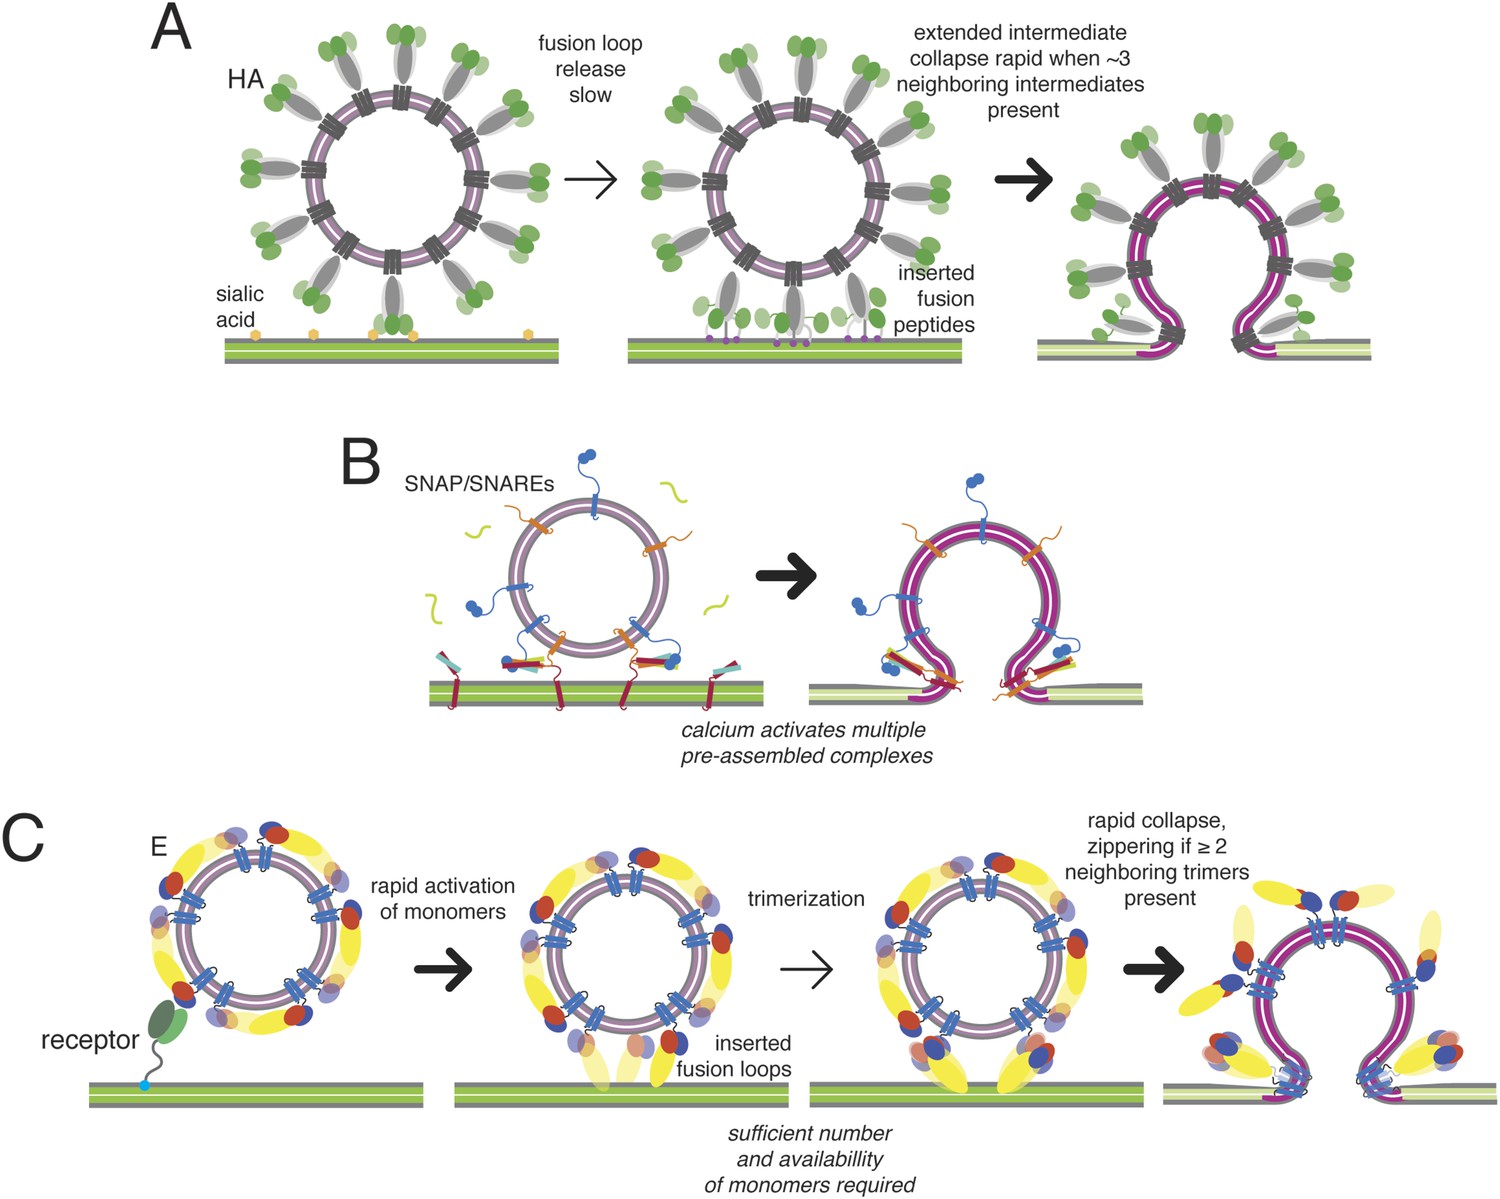
Kinetic mechanisms of membrane fusion.
Darker arrows indicate faster steps. (A) Model of the sequence of events in influenza hemagglutin-mediated fusion. A representative schematic cross-section is shown (an actual contact zone will include 100 or more trimers). Stochastic release of a sufficient minimum number of fusion peptides is rate limiting. (B) Schematic of calcium-triggered SNAP/SNARE-mediated fusion. Rapid triggering and activation of a minimum number of assembled complexes by calcium. (C) Schematic of flavivirus fusion: monomer activation is fast (defined by pH), trimerization is rate limiting, and final collapse step is fast.
Author response image 1

Author response image 2
Author response image 3

Videos
Video 1
Video of WNV VLP hemifusion events at pH 6.25, recorded at 640 nm channel sped up 20 times actual speed.
https://doi.org/10.7554/eLife.04389.005Tables
Table 1
Summary of mutant kinetic fits and rates
| tmean (s) | fit | k (s) | |
|---|---|---|---|
| WT | 46.1 | single exponential | 2.9 ± 0.4 × 10⁻² |
| 1:1 WT W101A Mix | 53.4 | single exponential | 2.2 ± 0.4 × 10⁻² |
| F408V | 95.8 | gamma N = 2 | 2.0 ± 0.2 × 10⁻² |
| N193A | 85.3 | single exponential | 1.2 ± 0.2 × 10⁻² |
| V434W | 65.5 | gamma N = 2 | 3.9 ± 0.3 × 10⁻² |
| F450W | 54.2 | single exponential | 1.2 ± 0.2 × 10⁻¹ |
Additional files
-
Source code 1
Matlab code for simulations. File flavi_hemi.m contains the simulation for a flavivius E protein contact patch of 30 protomers.
- https://doi.org/10.7554/eLife.04389.015
Download links
A two-part list of links to download the article, or parts of the article, in various formats.
Downloads (link to download the article as PDF)
Open citations (links to open the citations from this article in various online reference manager services)
Cite this article (links to download the citations from this article in formats compatible with various reference manager tools)
Sequential conformational rearrangements in flavivirus membrane fusion
eLife 3:e04389.
https://doi.org/10.7554/eLife.04389


