Rapid epigenetic adaptation to uncontrolled heterochromatin spreading
- Columbia University, United States
Figures
Figure 1 with 1 supplement
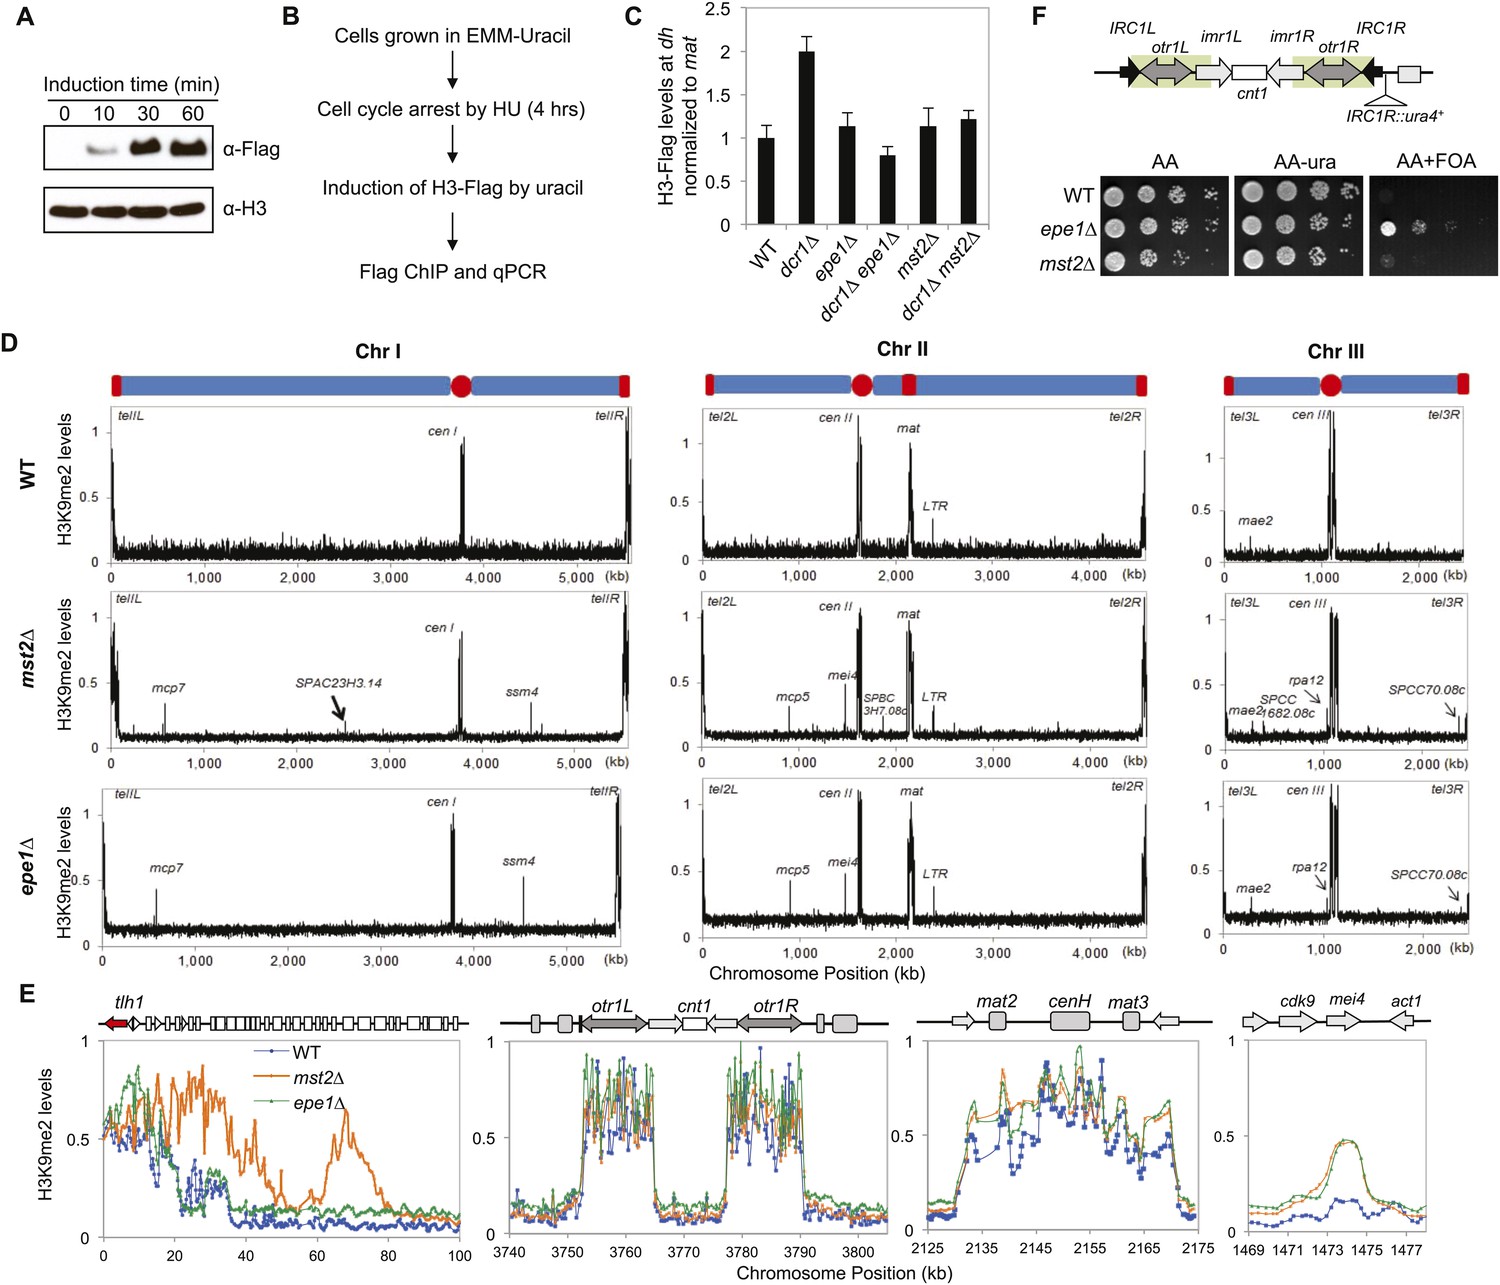
Mst2 counteracts heterochromatin assembly.
(A) Western blot analysis of H3-Flag levels. Samples were taken at indicated times after the addition of uracil, and Western blot analyses were performed with Flag and H3 antibodies. (B) Schematic diagram of the histone turnover assay. (C) Enrichment of H3-Flag at pericentric dh sequence as an indicator of histone turnover rates. The values are normalized to a region within the silent mating-type locus with background histone turnover (Aygun et al., 2013). Error bars represent standard deviation of three experiments. (D) ChIP–chip analyses of H3K9me2 levels across the genome. (E) ChIP–chip data of H3K9me2 levels around the telomere IL, centromere I, the silent mating-type region, and the mei4+ locus. (F) Mst2 is not required for boundary function at IRC1R. Serial dilution analysis were performed to measure the expression of IRC1R::ura4+ reporter.
Figure 1—figure supplement 1
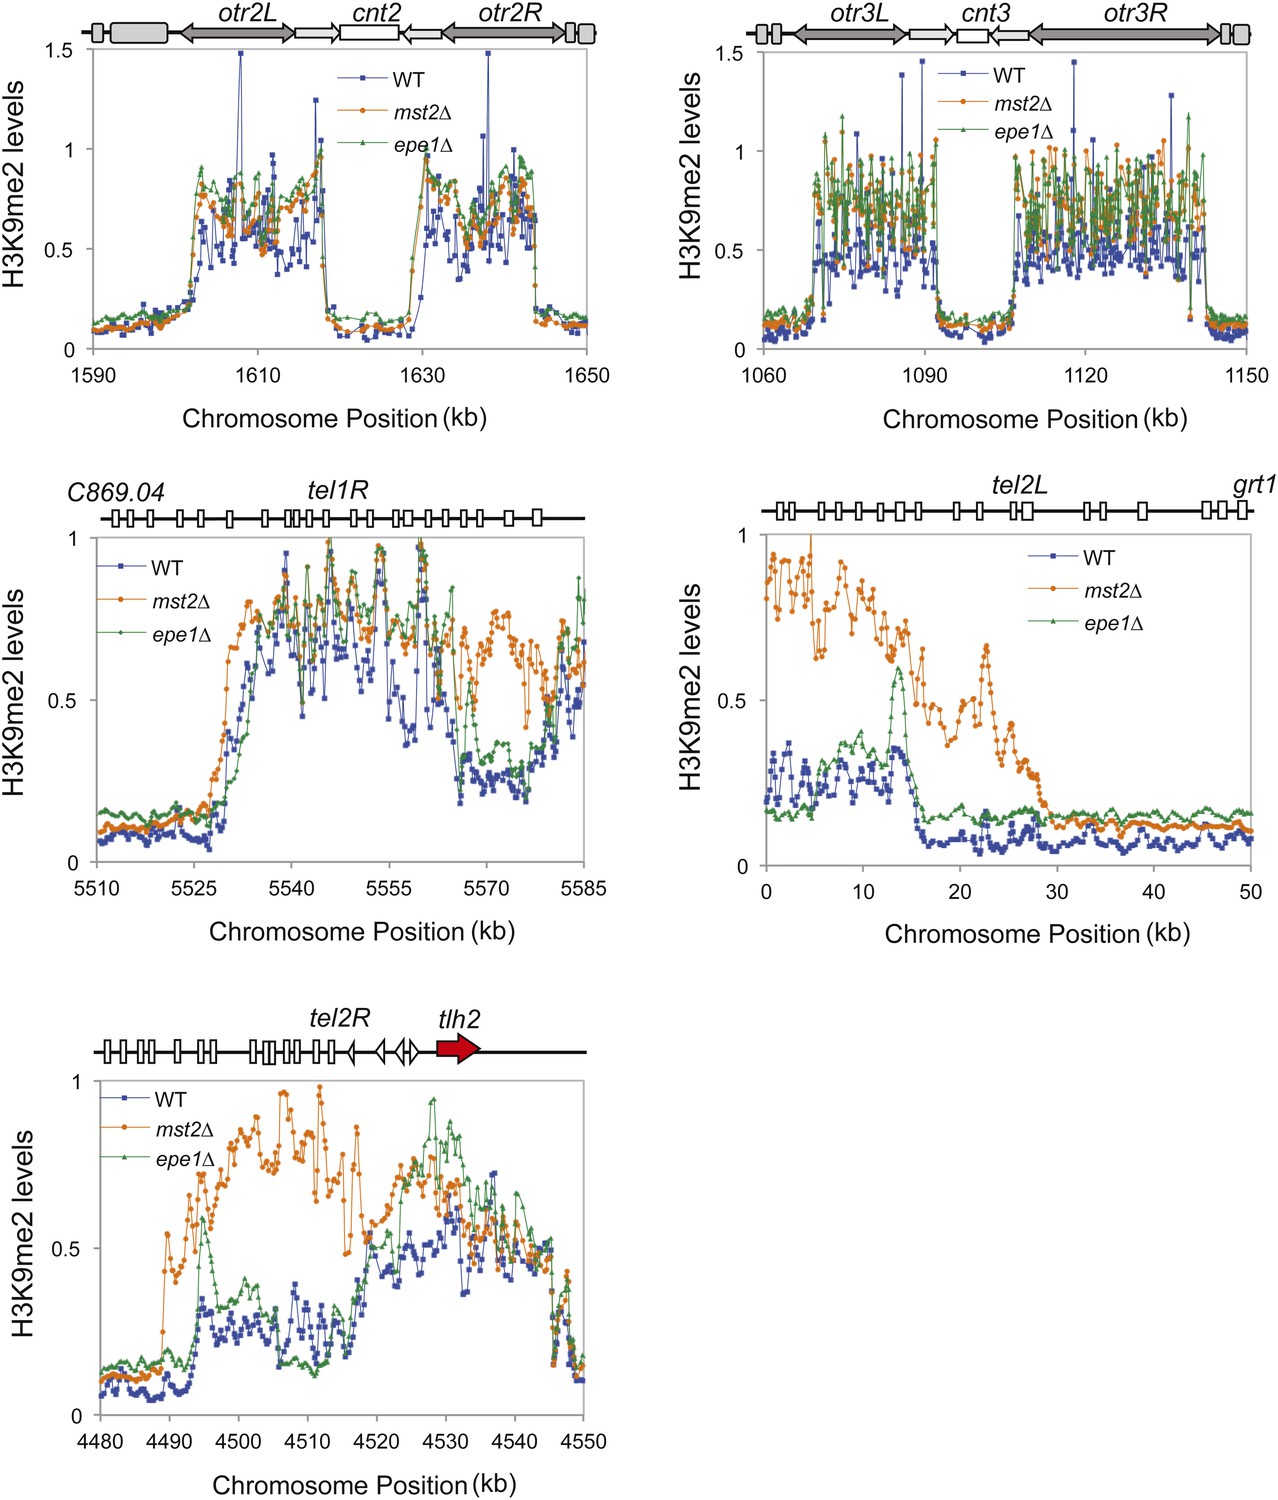
ChIP–chip data of H3K9me2 levels around centromere II, centromere III, telomere 1R, telomere 2L, and telomere 2R.
https://doi.org/10.7554/eLife.06179.004
Figure 2 with 2 supplements

A suppressor mutation confers normal growth of mst2∆ epe1∆ cells.
(A, D, E, H) Tetrad dissection analysis of the indicated genetic crosses. Pictures are examples of colonies derived from the same tetrad containing all individual genotypes, after one replication for a total of 6 days growth. (B) Serial dilution analysis of indicated strains. Cells were grown in rich medium overnight before dilution analyses were performed. (C) The growth curve of indicated strains. (F) Workflow to introduce mst2∆ and epe1∆ into the deletion library. (G) Left, a representative image of colony growth was shown. Middle, colonies were assigned scores between 0 and 3, as indicated. Right, list of identified heterochromatin mutants that confer fast growth.
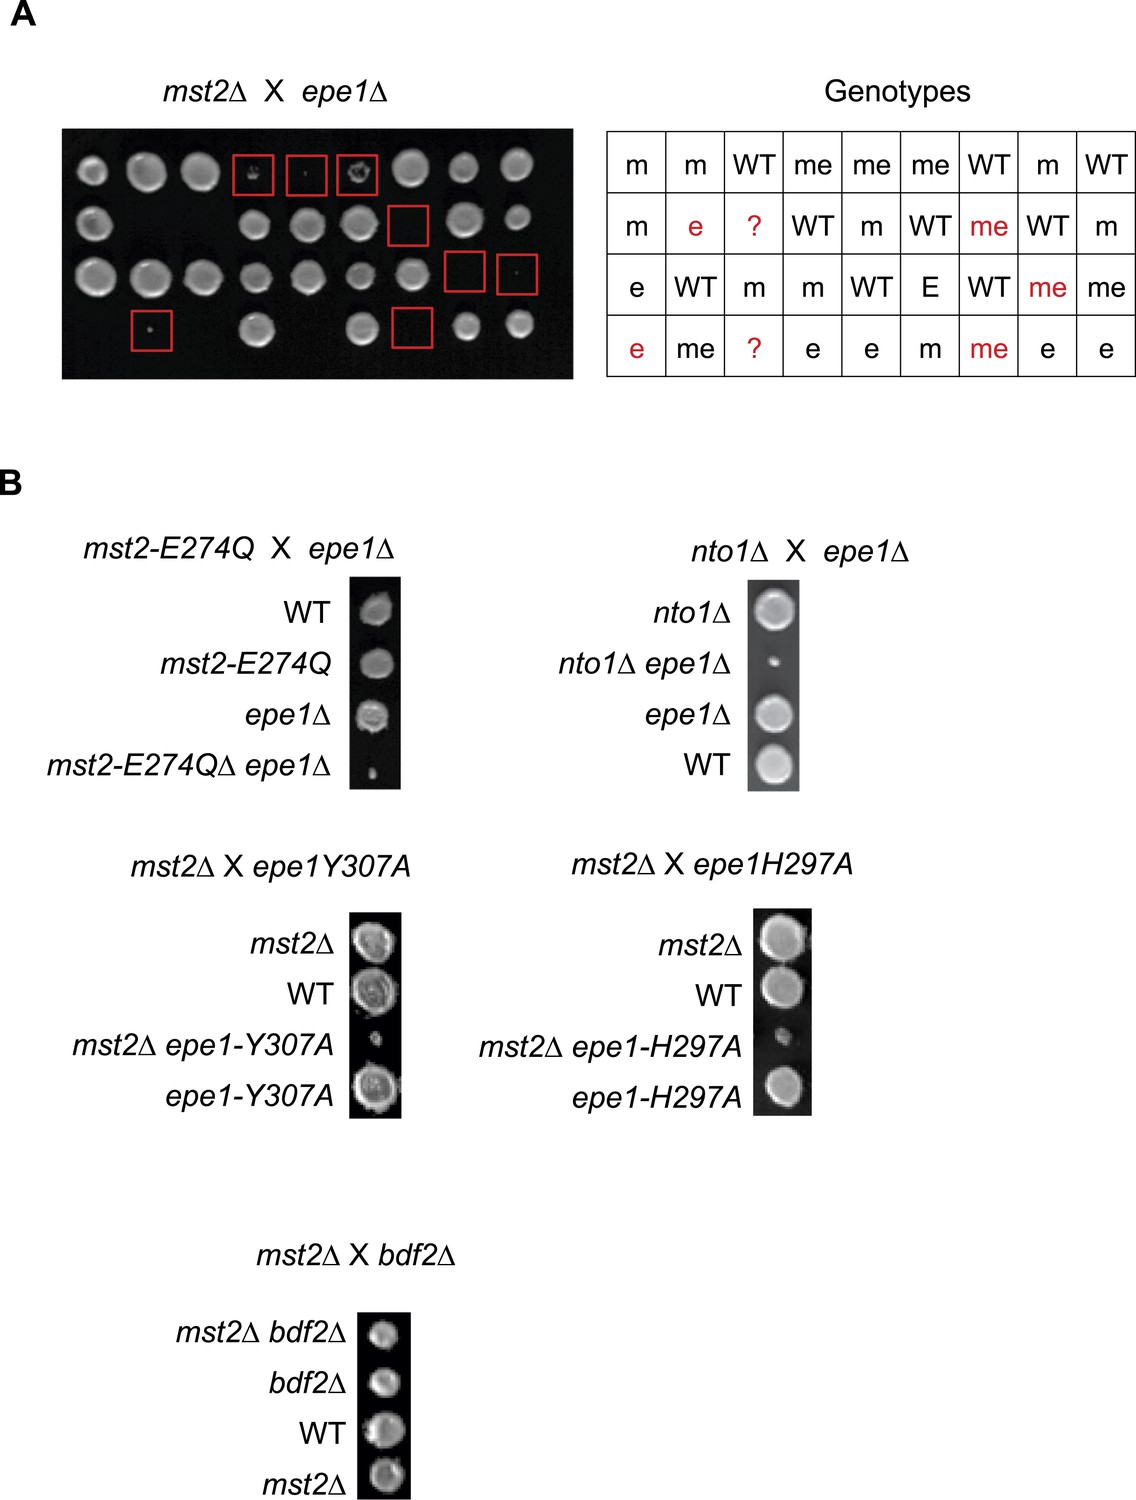
Figure 2—figure supplement 1
Tetrad dissection analysis of the indicated genetic crosses.
(A) Genetic cross between mst2∆ and epe1∆ to show the frequency of mst2∆ epe1∆ colonies (red boxes). Each column is a tetrad. Genotypes are indicated on the right. WT, wild type; m, mst2∆; e, epe1∆; me, mst∆ epe1∆; ?, genotype can not be assigned. Red letters indicate no colony growth detected. (B) Representative examples of colonies derived from the same tetrad containing all individual genotypes.
Figure 2—figure supplement 2
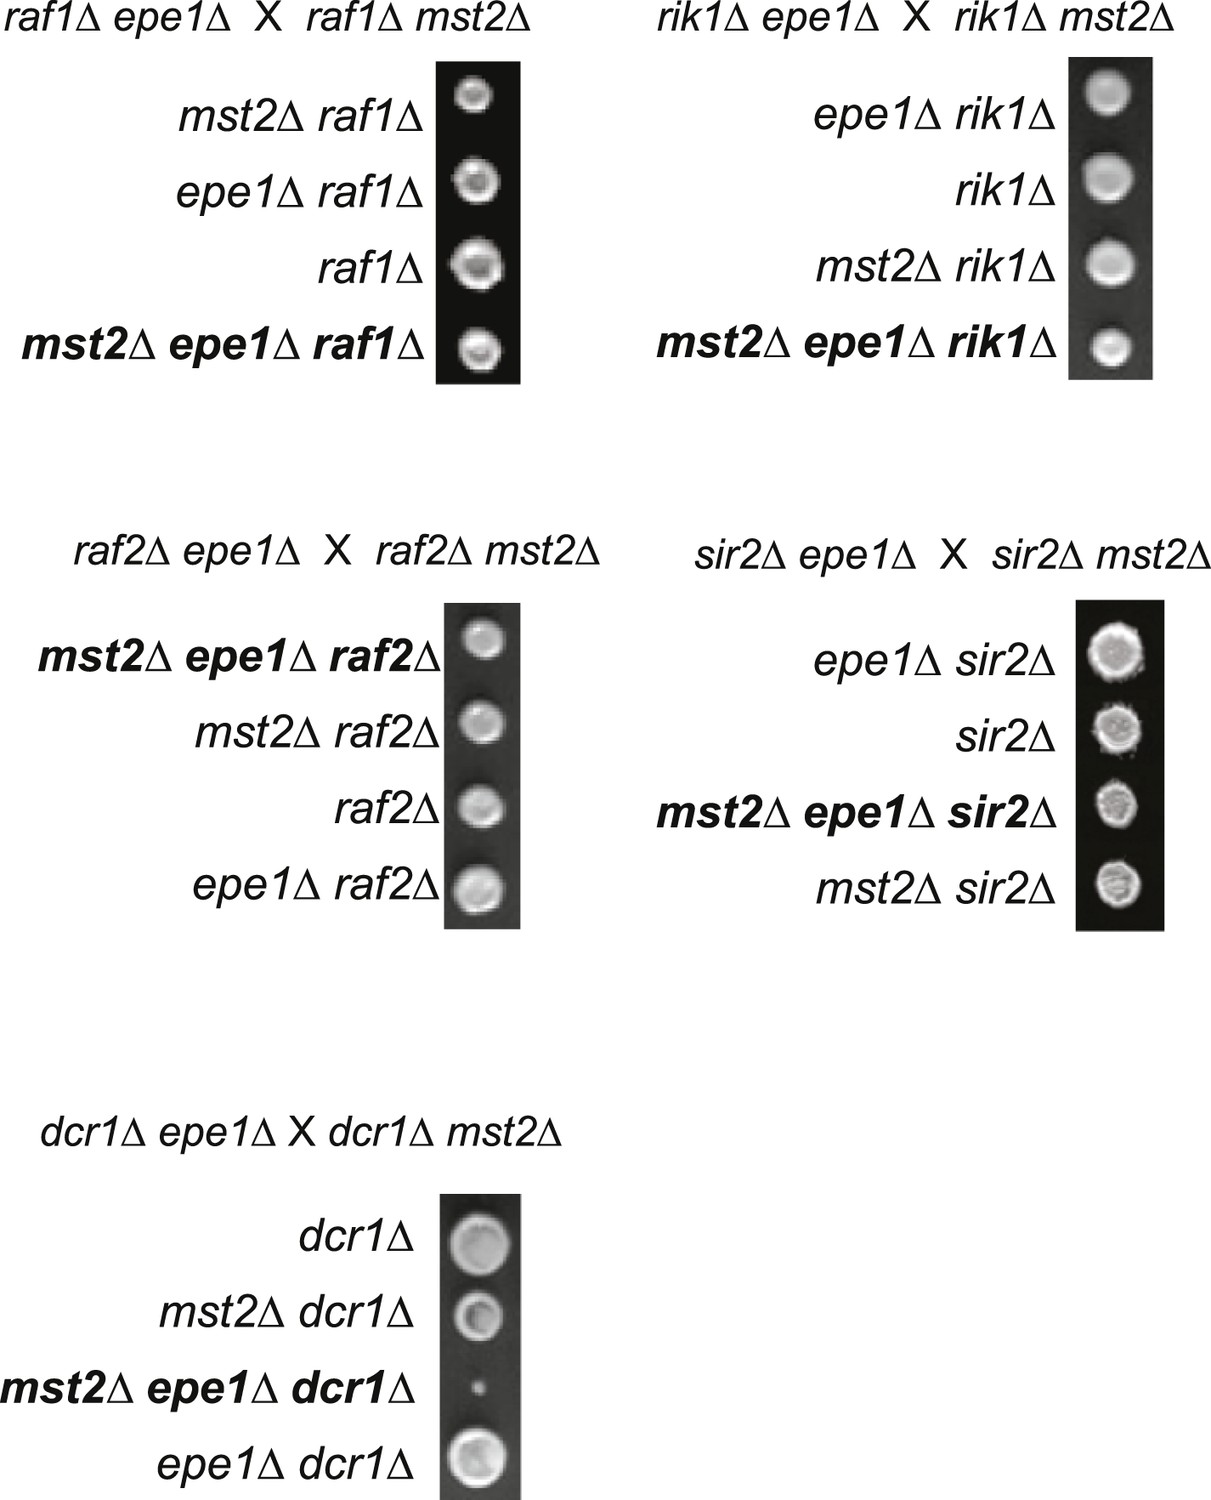
Tetrad dissection analysis of indicated genetic crosses.
Pictures are representative examples of colonies derived from the same tetrad containing all individual genotypes.
Figure 3 with 1 supplement
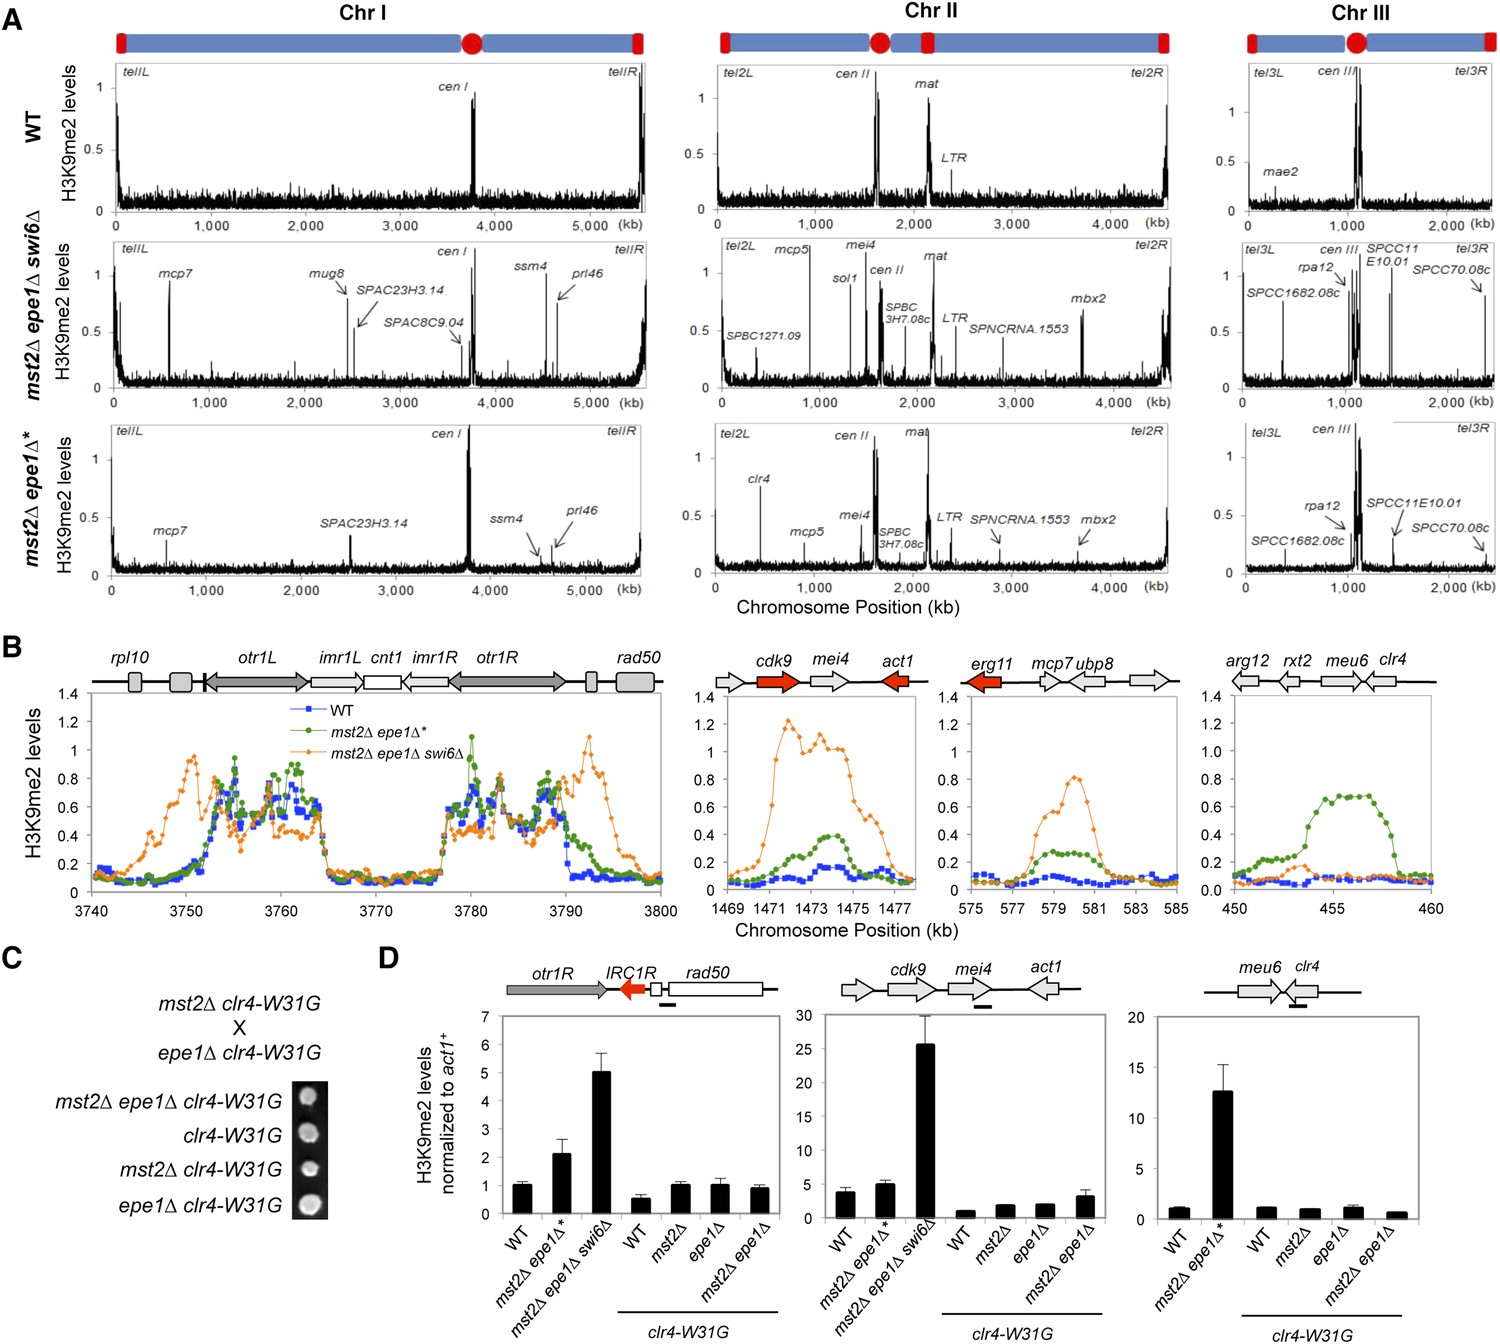
Increased heterochromatin spreading in mst2∆ epe1∆ cells leads to growth defects.
(A) ChIP–chip analyses of H3K9me2 levels across the genome. (B) ChIP–chip data of H3K9me2 levels at centromere I, mei4+, mcp7+, and clr4+ locus. (C) Tetrad dissection analysis of the indicated genetic cross. (D) ChIP-qPCR analysis of H3K9me2 levels at indicated locations, normalized against act1+. Error bars represent standard deviation of three experiments.
Figure 3—figure supplement 1
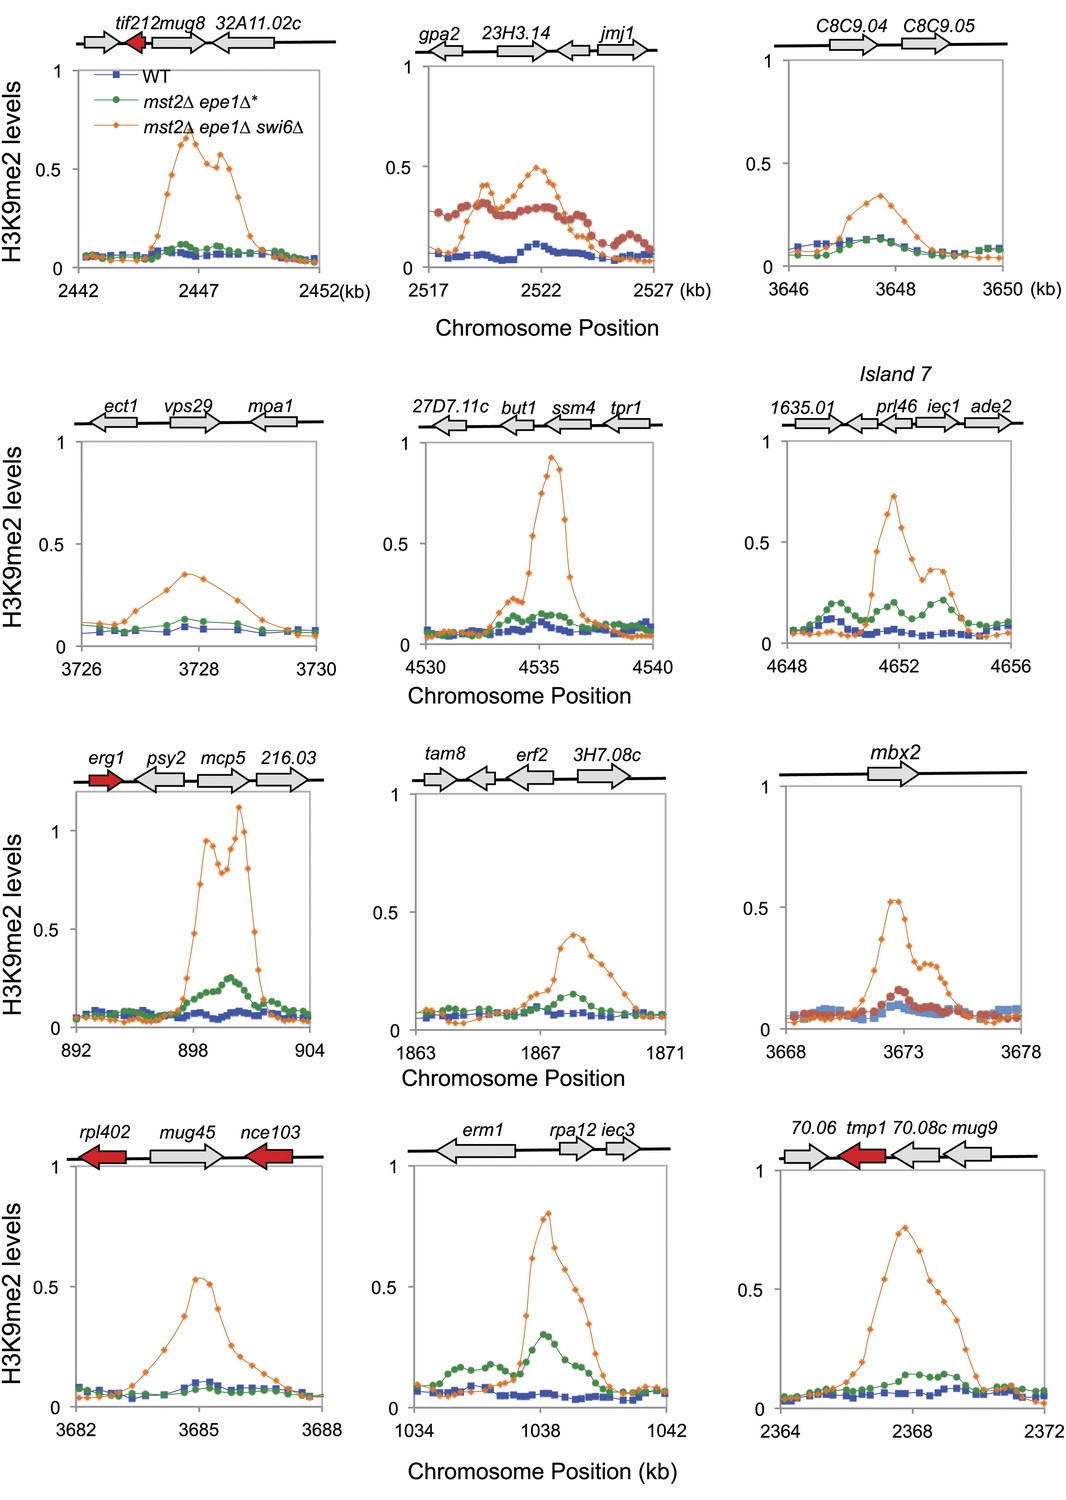
ChIP–chip data of H3K9me2 levels at heterochromatin islands.
https://doi.org/10.7554/eLife.06179.009
Figure 4

Inheritance of ectopic heterochromatin at the meu6-clr4 locus.
(A, E) ChIP-qPCR analysis of H3K9me2 levels at the clr4+ coding region, normalized against act1+. Error bars represent standard deviation of three experiments. (B, F) qRT-PCR analysis of clr4+ mRNA levels, normalized against act1+. Error bars represent standard deviation of three experiments. (C) Western blot analyses of Flag-Clr4 and Tubulin protein levels. (D) Tetrad dissection analysis of indicated genetic crosses. (G) Serial dilution analysis to measure the expression of otr::ura4+ reporter.
Figure 5 with 3 supplements

Blocking heterochromatin formation at the clr4+ locus in mst2∆ epe1∆ cells results in ectopic heterochromatin assembly at the rik1+ locus.
(A) RNA sequencing data of the meu6-clr4 region. (B) Schematic diagram of the meu6∆::kanMX6 construct. (C, I) ChIP-qPCR analysis of H3K9me2 levels at the clr4+ or rik1+ coding region, normalized against act1+. Error bars represent standard deviation of three experiments. (D, J) qRT-PCR analysis of clr4+ or rik1+ mRNA levels, normalized against act1+. Error bars represent standard deviation of three experiments. (E) Western blot analyses of Flag-Clr4 protein levels. (F) The growth curve of indicated strains. (G) ChIP–chip analyses of H3K9me2 levels across the genome in recovered mst2∆ epe1∆ meu6∆* cells. (H) ChIP–chip data of H3K9me2 levels at clr4+ and rik1+ loci.
Figure 5—figure supplement 1
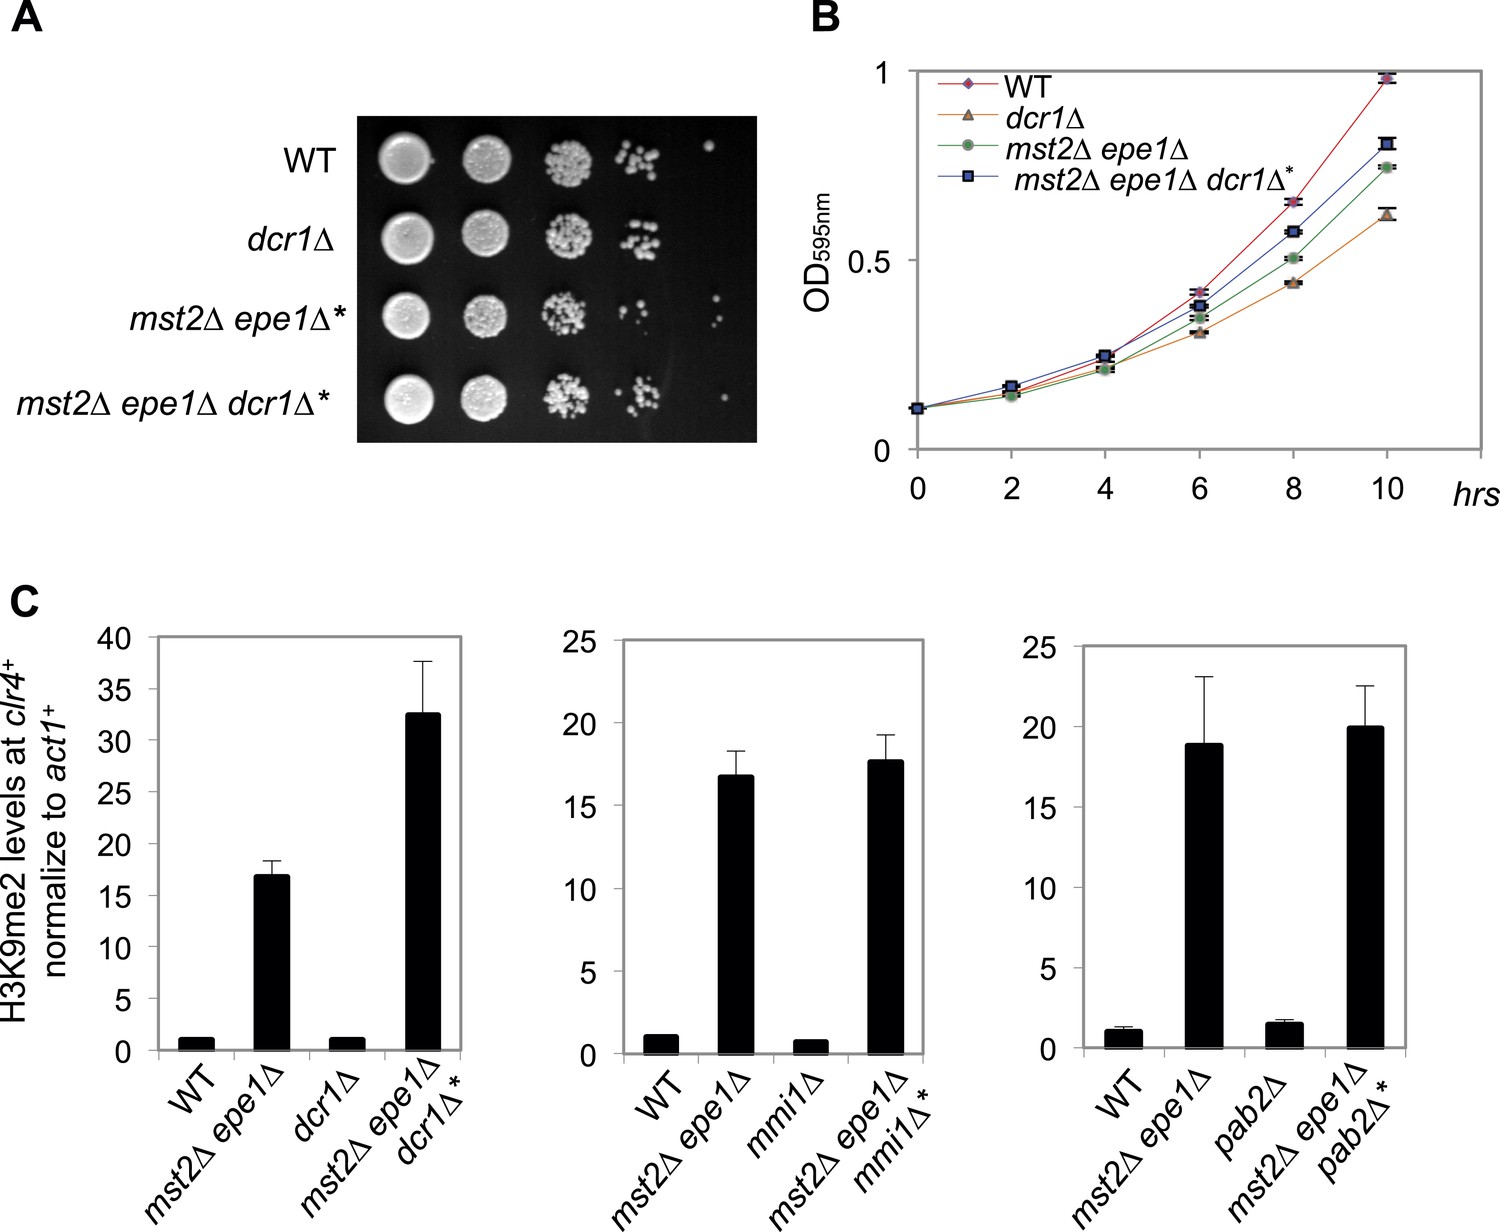
Dcr1, Mmi1 and Pab2 are not required for heterochromatin assembly at the clr4+ locus in mst2Δ epe1Δ* cells.
(A) Serial dilution analysis of indicated strains. Cells were grown in rich medium overnight before dilution analyses were performed. (B) The growth curve of indicated strains. (C) ChIP-qPCR analysis of H3K9me2 levels at the clr4+ coding region, normalized against act1+. Error bars represent standard deviation of three experiments.
Figure 5—figure supplement 2
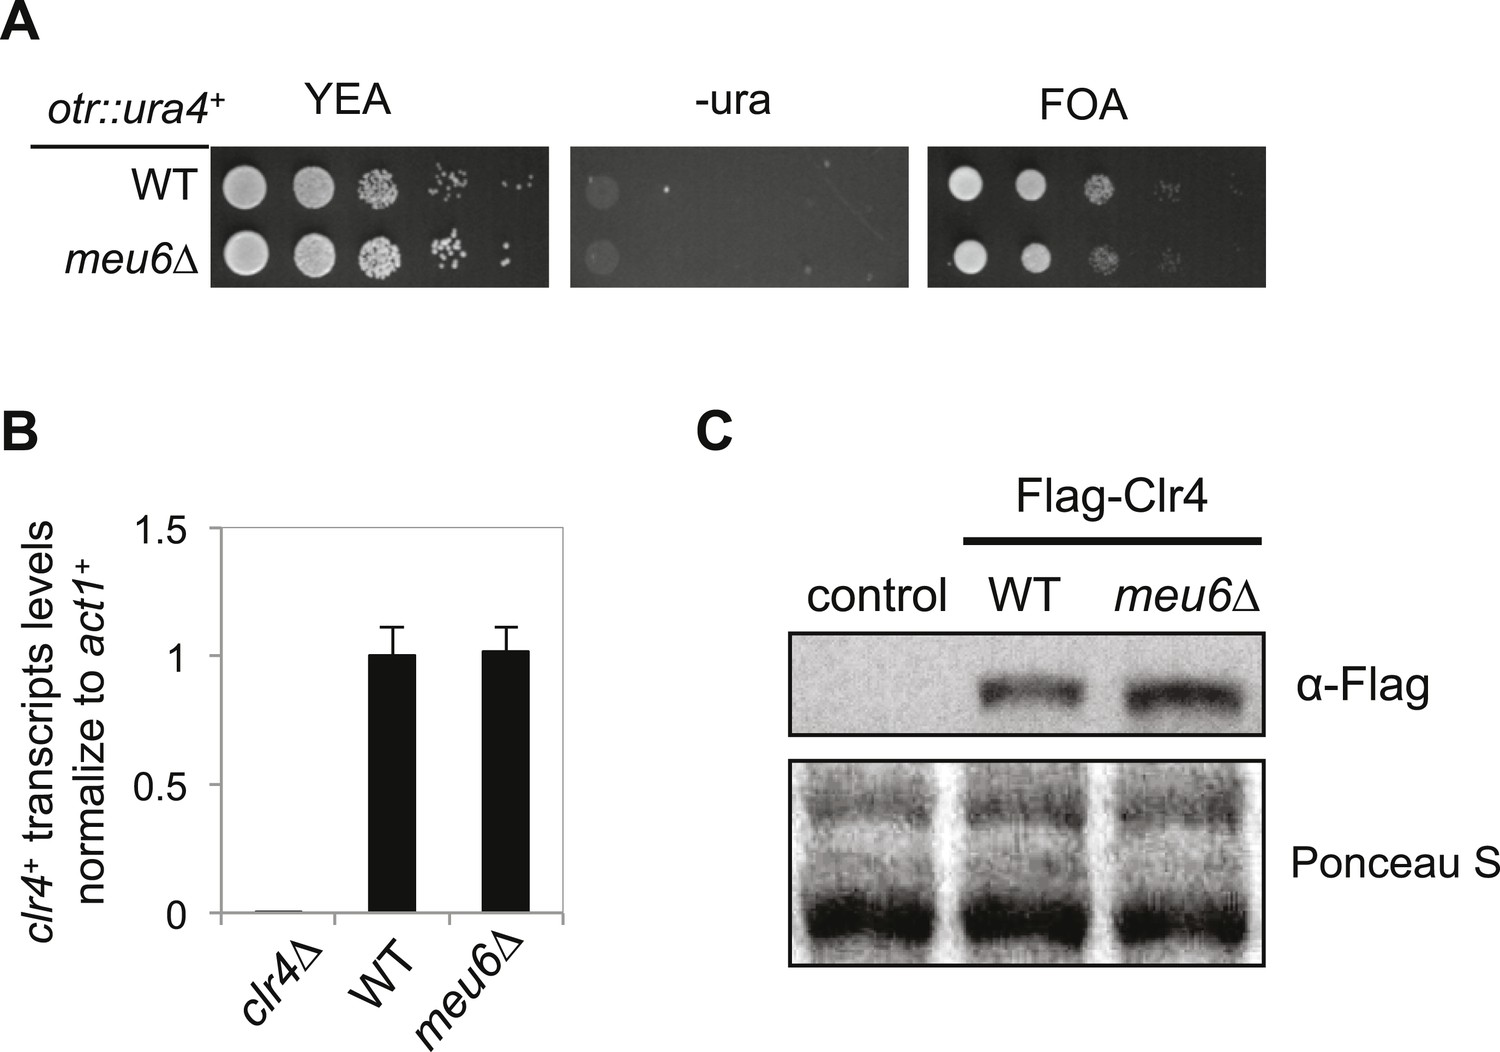
meu6∆ has no effect on clr4+ expression under normal conditions.
(A) Serial dilution analysis was performed to measure the expression of otr::ura4+. (B) qRT-PCR analysis of clr4+ mRNA levels, normalized against act1+ mRNA. Error bars represent standard deviation of three experiments. (C) Western blot analysis to measure Flag-Clr4 protein levels.
Figure 5—figure supplement 3
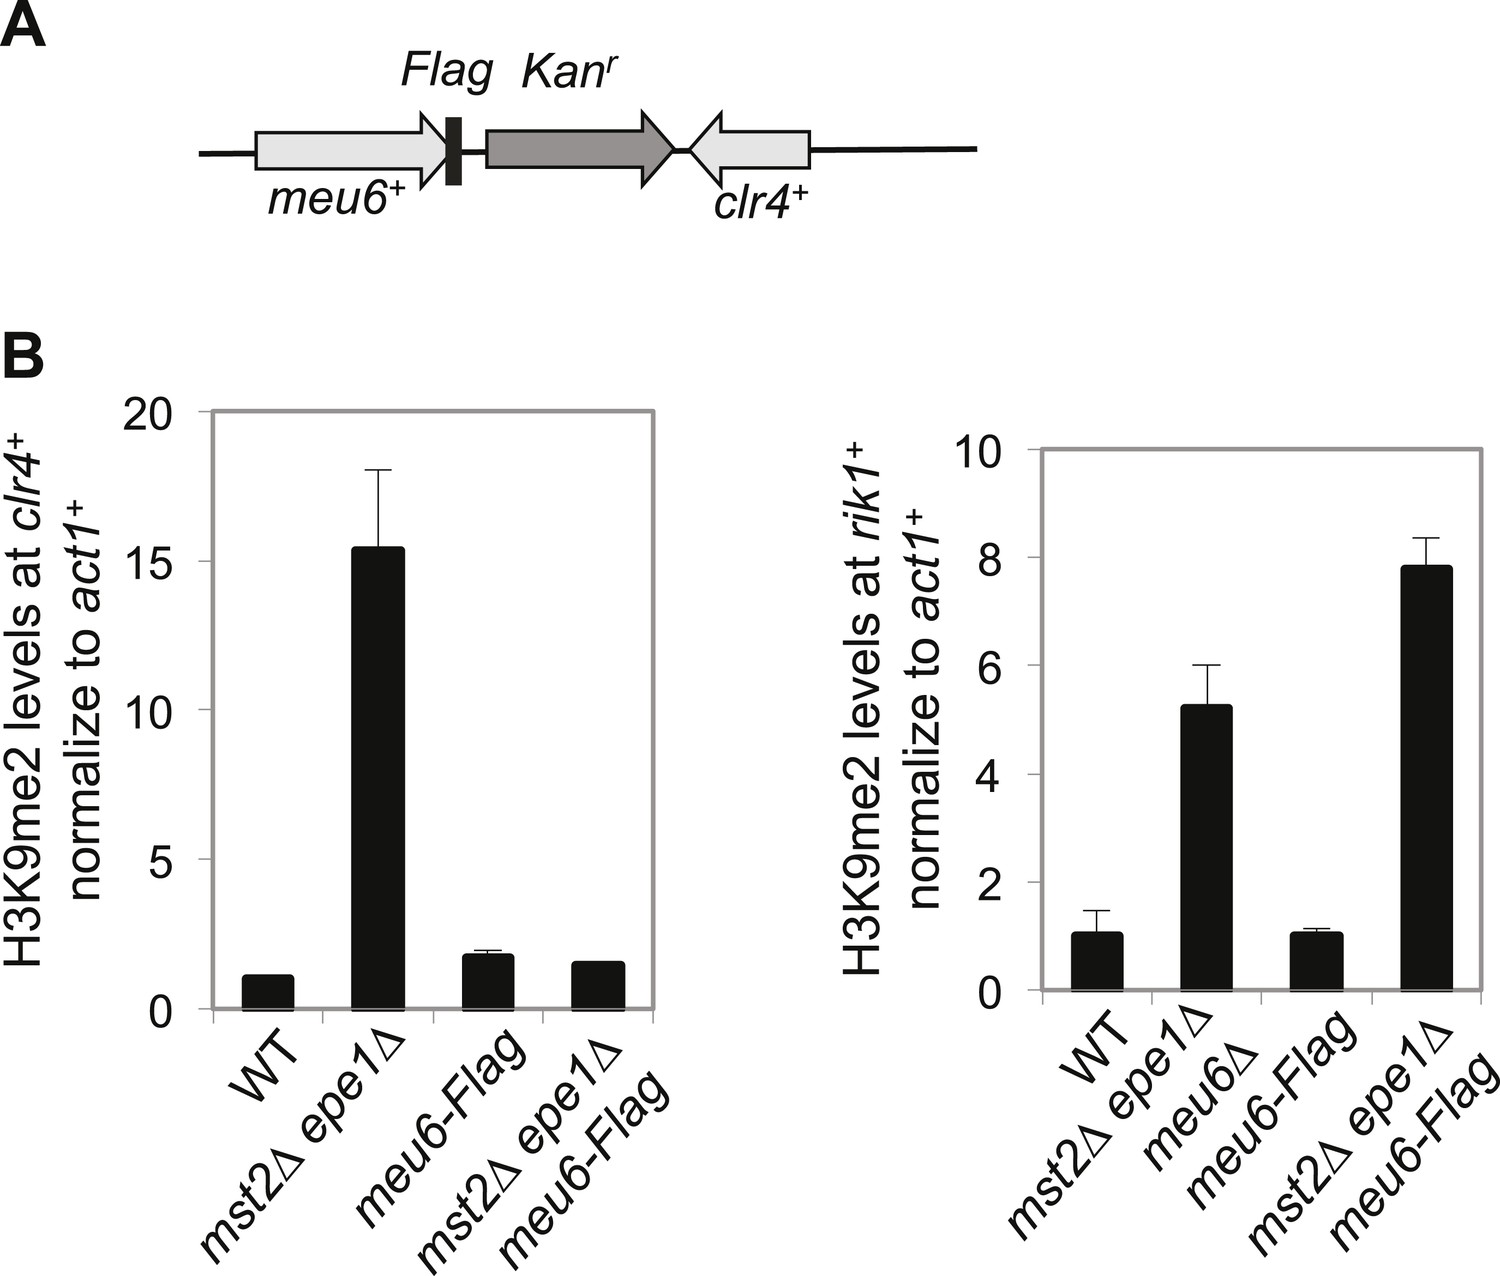
Meu6-Flag abolished H3K9me in mst2∆ epe1∆ cells.
(A) Schematic diagram of meu6-Flag. (B) ChIP-qPCR analysis of H3K9me2 levels at the clr4+ and rik1+ coding region, normalized against act1+. Error bars represent standard deviation of three experiments.
Figure 6 with 1 supplement
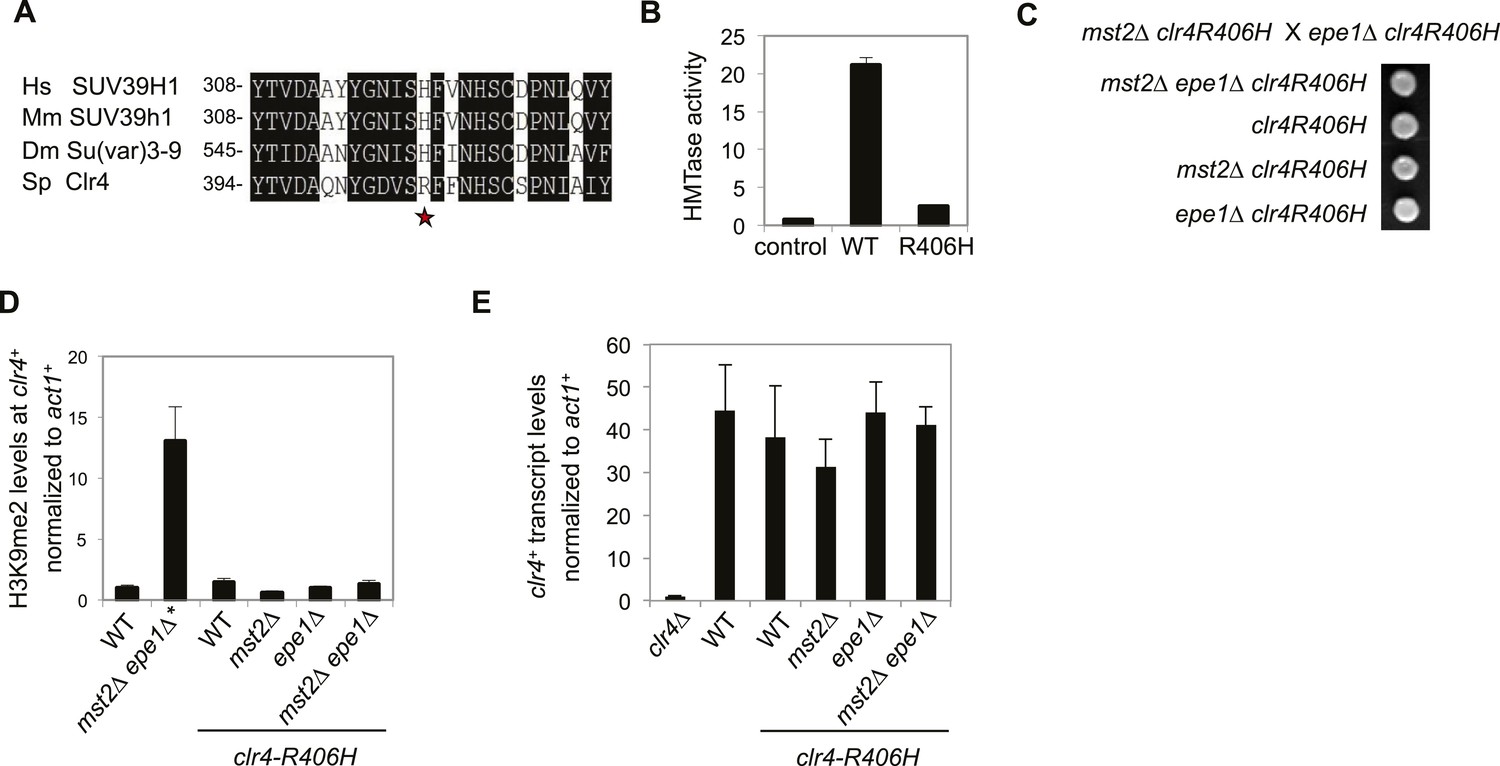
The high activity of Clr4 leads to growth defects of mst2∆ epe1∆ cells.
(A) Sequence alignment of part of Clr4 homologues. * indicates R406 of Clr4. (B) In vitro histone methyltransferase assays were performed with recombinant GST-Clr4 or GST-Clr4-R406H together with a histone H3 (1–21) peptide. For the control reaction, no Clr4 was added. (C) Tetrad dissection analysis of the indicated genetic cross. (D) ChIP-qPCR analysis of H3K9me2 levels at the clr4+ coding region, normalized against act1+. Error bars represent standard deviation of three experiments. (E) qRT-PCR analysis of clr4+ mRNA levels, normalized against act1+. Error bars represent standard deviation of three experiments.
Figure 6—figure supplement 1
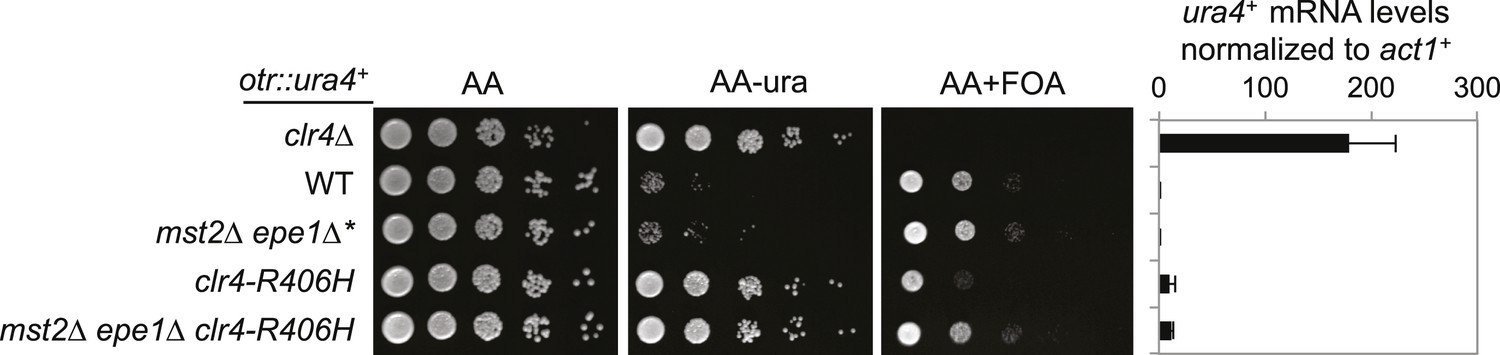
The effect of clr4-R406H on silencing of otr::ura4+.
Right, qRT-PCR analysis of ura4+ RNA levels, normalized against act1+. Error bars represent standard deviation of three experiments.
Figure 7
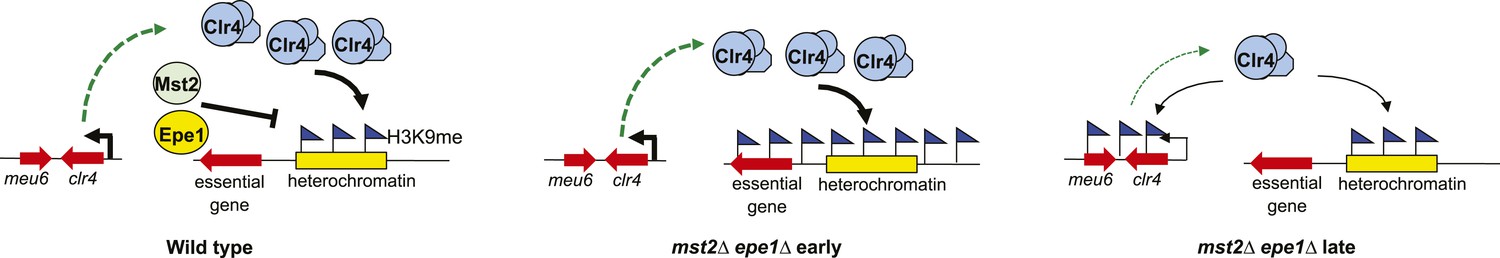
A model of the negative feedback of heterochromatin assembly.
https://doi.org/10.7554/eLife.06179.017Additional files
-
Supplementary file 1
List of heterochromatin peaks in different genetic background.
- https://doi.org/10.7554/eLife.06179.018
-
Supplementary file 2
List of mutations identified in SGA screen.
- https://doi.org/10.7554/eLife.06179.019
-
Supplementary file 3
Yeast strains used in this study.
- https://doi.org/10.7554/eLife.06179.020
-
Supplementary file 4
Primers used in this study.
- https://doi.org/10.7554/eLife.06179.021
Download links
A two-part list of links to download the article, or parts of the article, in various formats.
Downloads (link to download the article as PDF)
Open citations (links to open the citations from this article in various online reference manager services)
Cite this article (links to download the citations from this article in formats compatible with various reference manager tools)
Rapid epigenetic adaptation to uncontrolled heterochromatin spreading
eLife 4:e06179.
https://doi.org/10.7554/eLife.06179


