Asymmetric conformational maturation of HIV-1 reverse transcriptase
- National Institutes of Health, United States
Figures
Figure 1 with 3 supplements
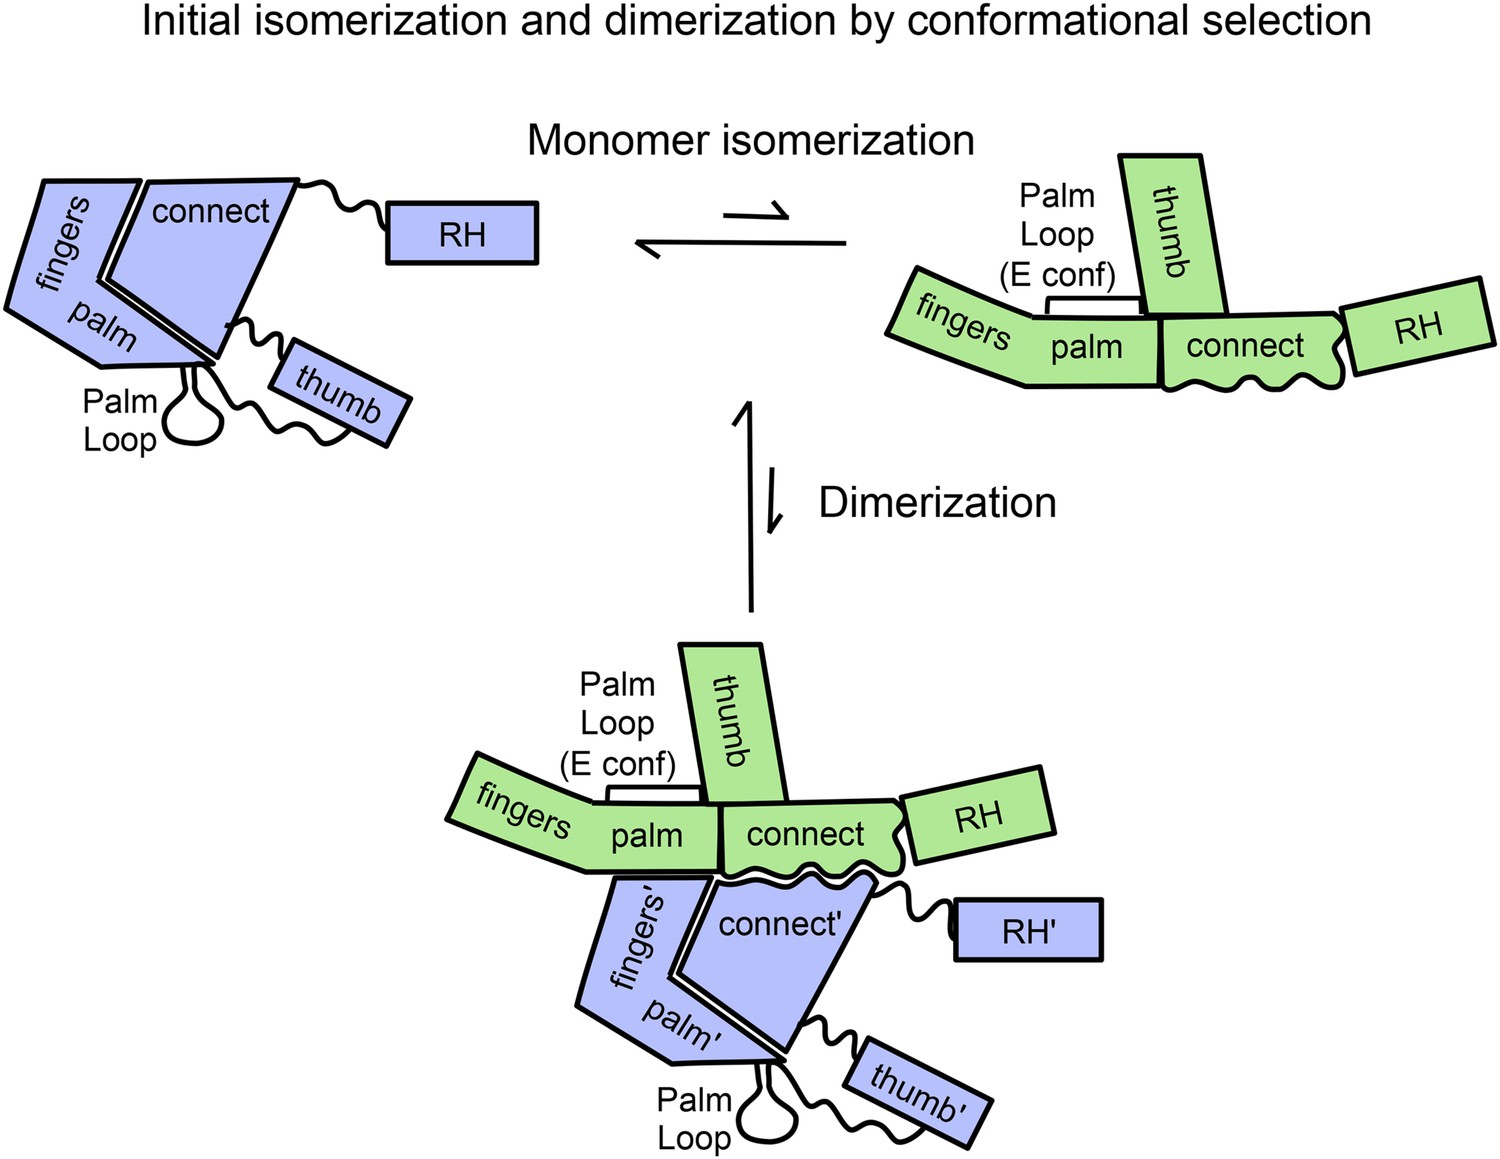
Schematic diagram showing proposed isomerization and initial p66 homodimer formation.
The subunit conformations are color coded (extended, green; compact, blue). Primes are introduced after homodimer formation to allow subunit identification and indicate the subunit destined to be proteolyzed. The palm loop E conformation becomes the primer grip.
Figure 1—figure supplement 1
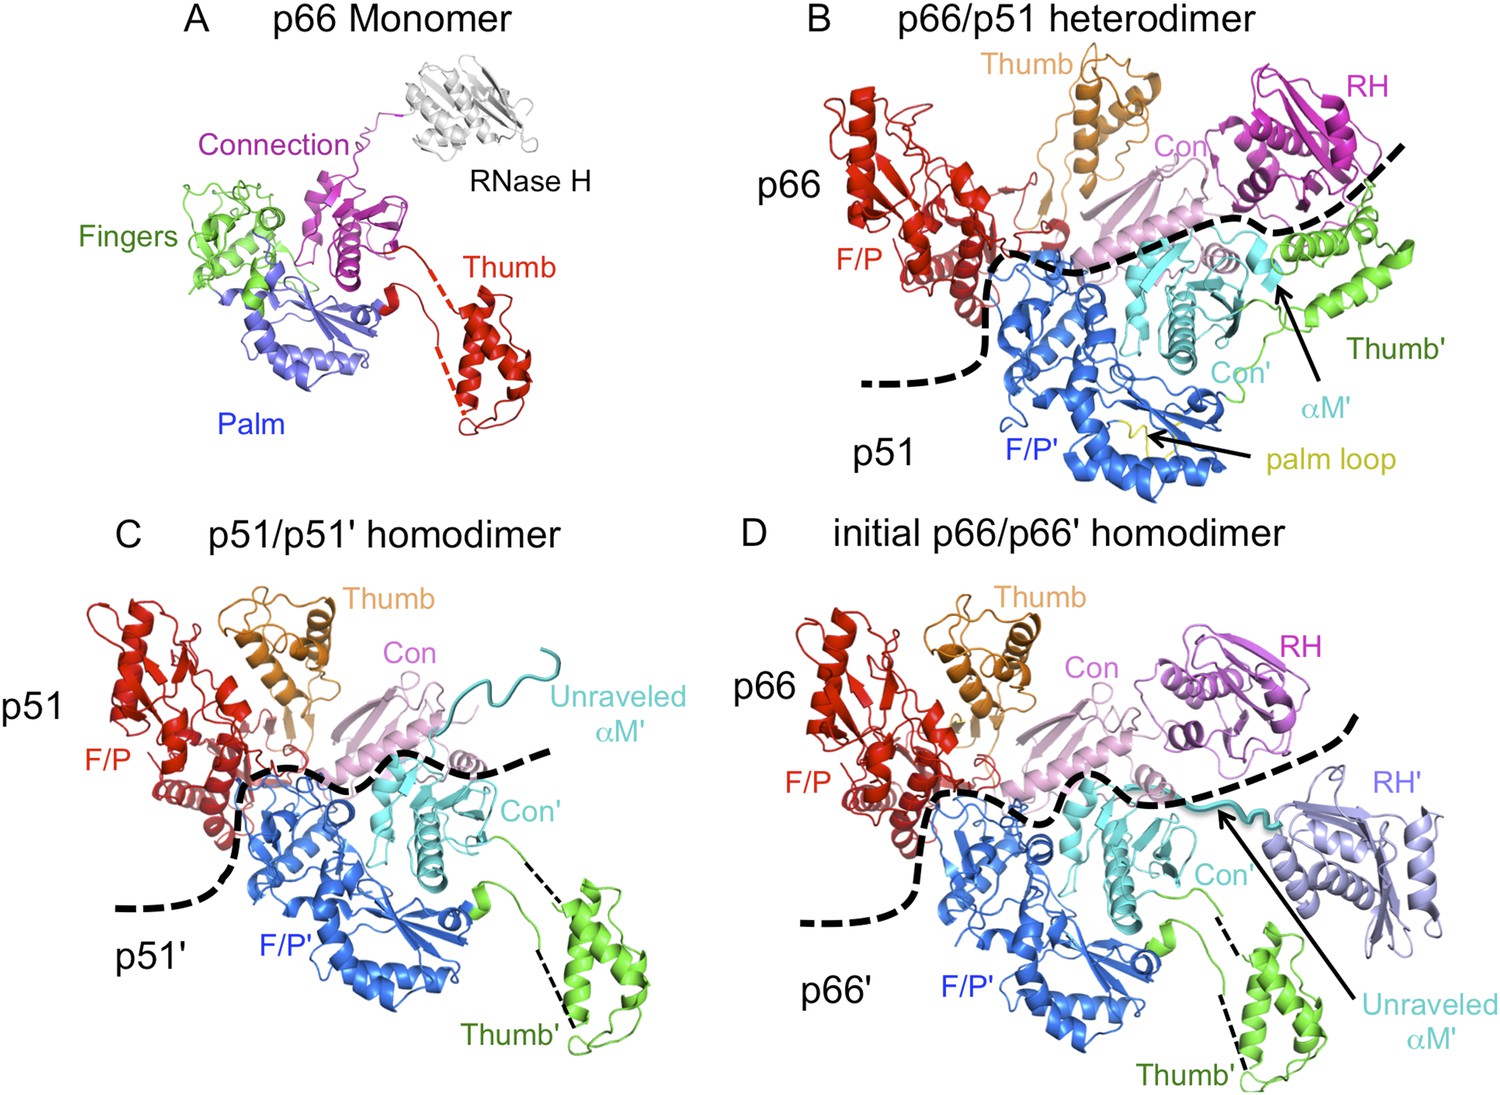
Ribbon diagram representations of reverse transcriptase (RT) monomer and dimer structures.
(A) The monomer structure of p66 is based on the crystal structure of p51∆PL (pdb: 4KSE) and NMR data showing that it also contains a folded ribonuclease H (RH) domain linked by residues derived from an unfolded α-helix M. Domains are identified as fingers (green), palm (blue), thumb (red), connection (magenta), and RH (gray). (B) Ribbon diagram of the RT heterodimer structure (pdb: 1S9E, Das et al., 2004). For this panel, we used an NNRTI complex containing the palm loop, so the position of the p66 thumb domain differs from that in panels C and D. Color coding: p66 subunit: fingers/palm (red), thumb (orange), connection (pink), RH (magenta); p51 subunit: fingers/palm (blue), thumb (green), connection (cyan), palm loop (yellow). (C) Ribbon representation of the p51/p51' homodimer derived from the p66/p51 heterodimer structure (pdb: 1DLO) by deletion of the p66 RH domain and replacement of the p51 subunit with the p51∆PL monomer. Color coding: p51 subunit: fingers/palm (red), thumb (orange), connection (pink); p51' subunit: fingers/palm (blue), thumb (green), connection (cyan). Note that α-helix M' is unfolded in the p51' subunit of the homodimer, as it is in the monomer. (D) Initial p66/p66' homodimer structure based on NMR results and modeled from the p66/p51 heterodimer by replacing the p51 subunit with the p51∆PL monomer, and adding an additional, folded RH' domain. The disordered helix M' residues (418'–430') observed in the crystal structure of p51∆PL have been moved to avoid structural conflict with the p66 subunit and are linked to the supernumerary RH' domain (purple).
Figure 1—figure supplement 2
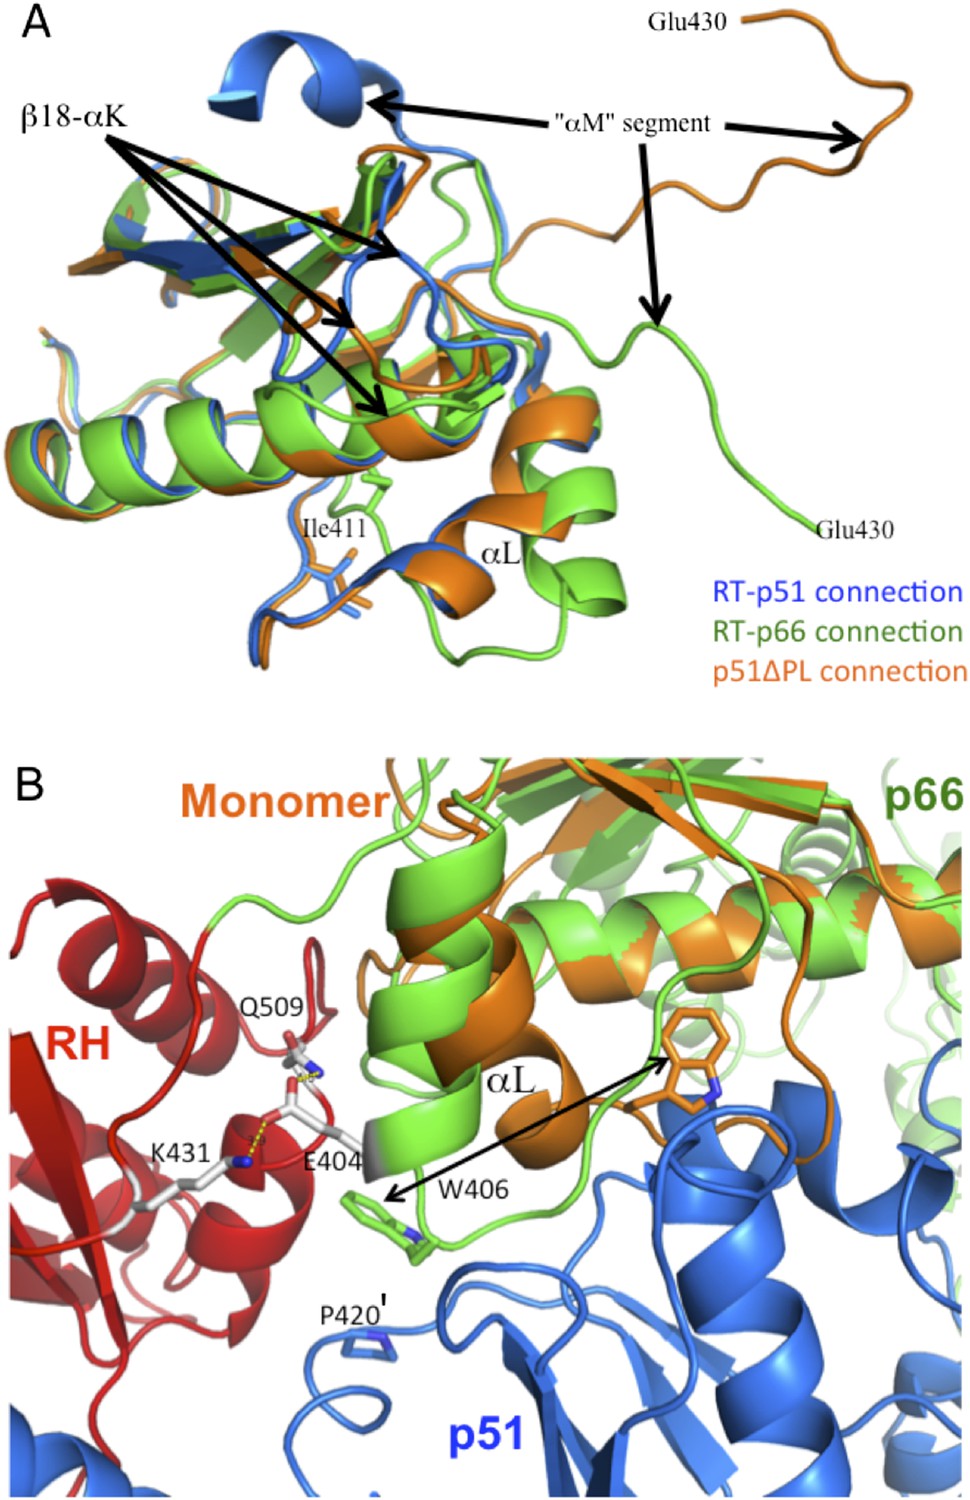
Structural comparison of connection domains.
(A) Overlay of the ribbon diagrams for the connection domains observed in the p66 subunit of RT (green), the p51 subunit of RT (blue), and the monomer (orange). Based on pdb files 1DLO and 4KSE. (B) Ribbon diagrams for the RT heterodimer (p66, green; RH domain, red; p51, blue), and the connection domain of the p51 monomer (orange) in which the p66 connection domain is overlayed with the connection domain of the monomer. As illustrated in B, although an initial domain repositioning of the p66 monomer domains could place the connection domain in position to interact with a second monomer, it would not be in the E conformation characteristic of the mature heterodimer. Formation of additional interfaces within the p66 subunit and with p51 may facilitate the straightening of helix αL. For example, interactions between Glu404 and Lys431 and/or Gln509 on the RH domain may facilitate this conformational change. Stacking of Trp406 with Pro420' can also facilitate the conformational change required for formation of the mature heterodimer.
Figure 1—figure supplement 3
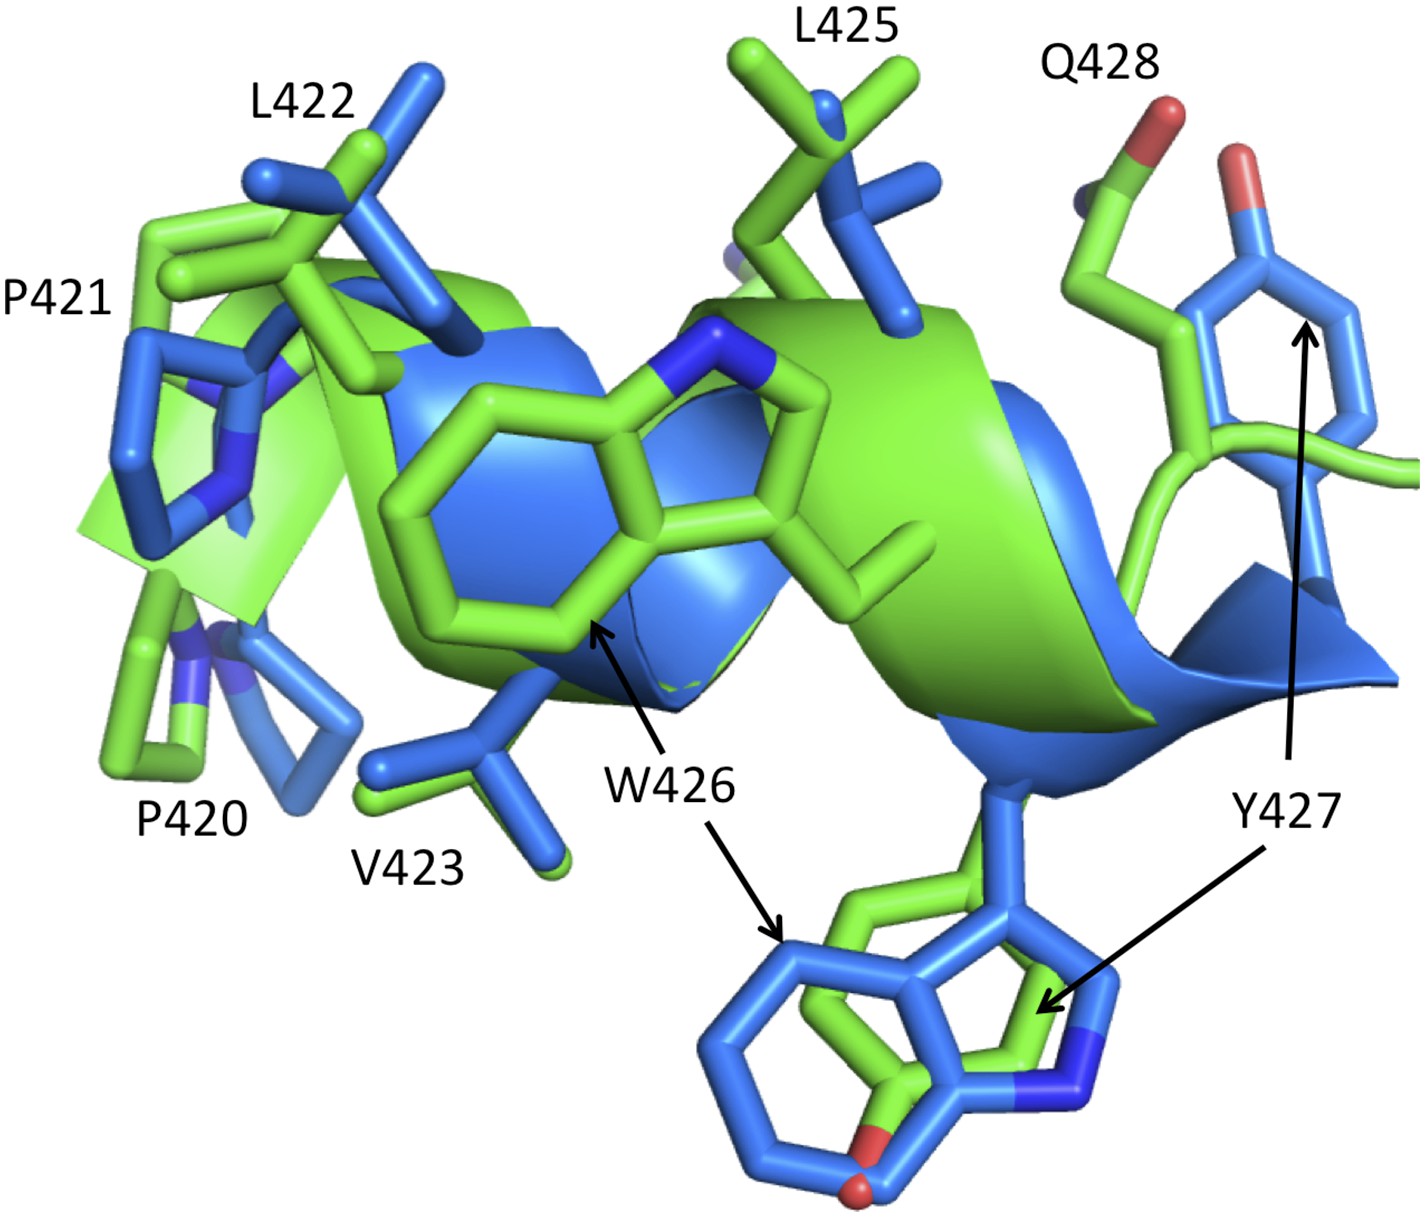
Alternate conformations of helix αM'.
The figure shows a ribbon representation of helix αM' from the p51 subunits of two RT structures: pdb: 3QIP (chain B, green) and 1SV5 (chain B, blue). Both structures correspond to NNRTI-RT complexes. In 3QIP, helix αM' adopts a more standard geometry, with five strong hydrogen bonds (≤3.2 Å), while the helix in 1SV5 has only one strong hydrogen bond and adopts a more extended conformation in which Tyr427 is at the position of Gln426 in the 3QIP structure. These alternate conformations correspond to an alternate set of interactions within the p51 subunit. A similar conclusion supporting a conformational mixture also results from re-analysis of the electron density for some individual structures (not shown). The ability of the helix to adopt alternate registrations results from the fact that nearly all of the residues are hydrophobic. The ability of αM' to adopt these conformations facilitates transfer of residues from the RH' domain, allowing recruitment of Tyr427' by the connection' domain when thermal fluctuations release it from RH'.
Figure 2
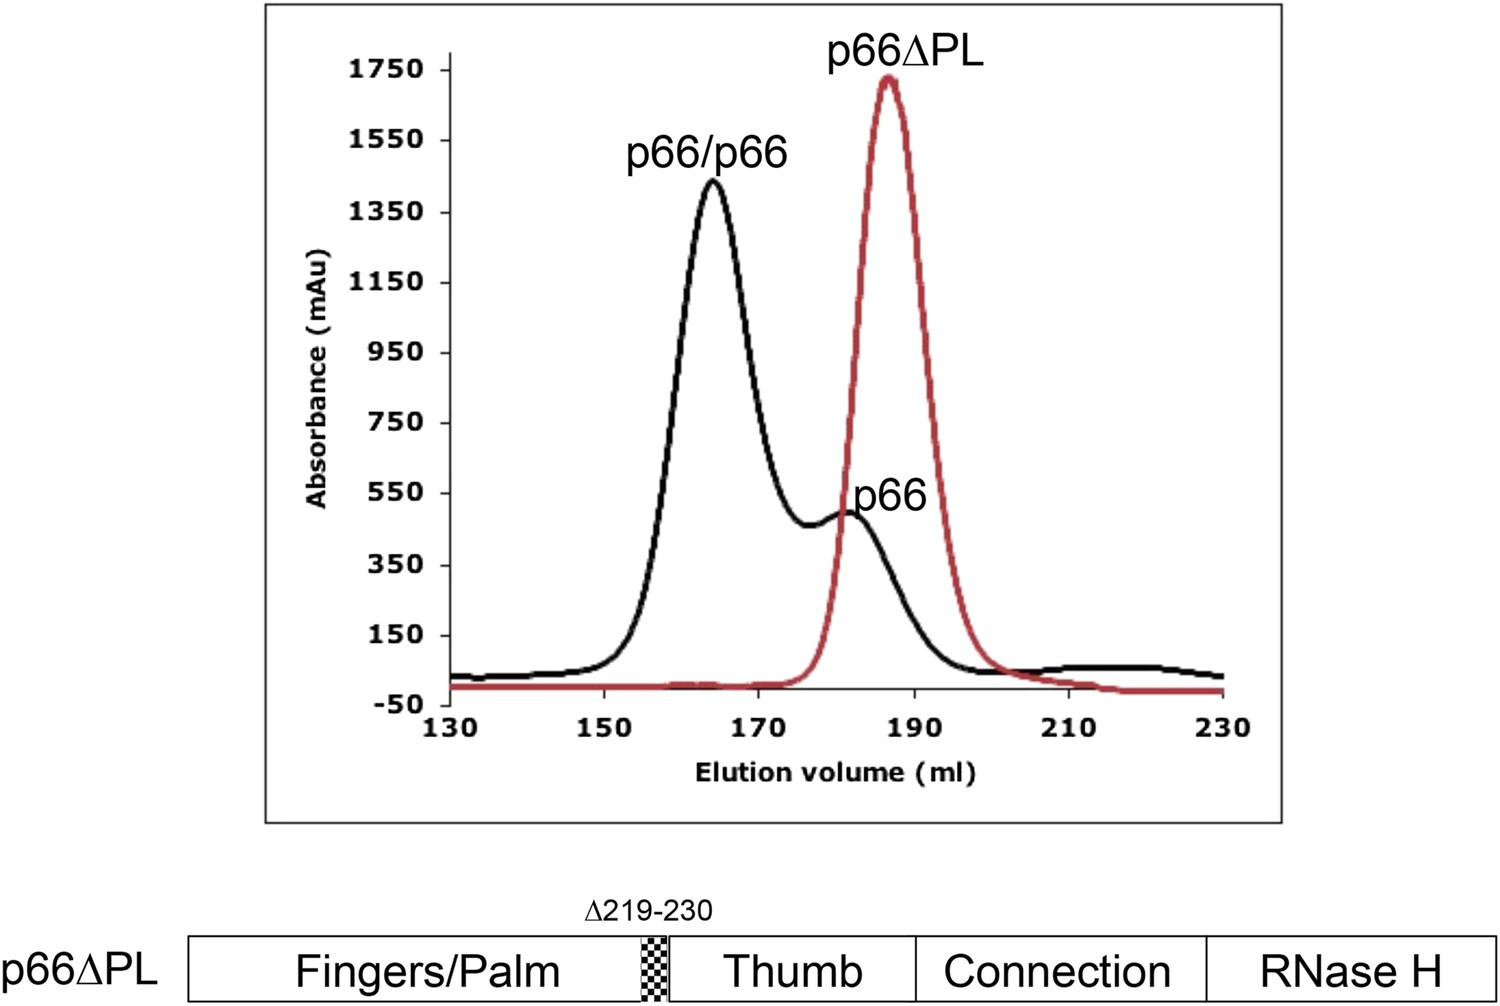
Effect of palm loop deletion on dimerization.
Gel filtration chromatograms comparing p66 and p66∆PL lacking palm loop residues 219–230. Chromatogram was obtained at 4°C on a HiLoad 26/60 superdex 200 column for p66 (black) and p66∆PL (red) eluted with 50 mM Tris–HCl, pH 8.0, 200 mM NaCl. The palm loop deletion, developed to block isomerization, also fails to dimerize. The position of the deleted sequence in p66 is indicated at the bottom of the figure.
Figure 3 with 1 supplement
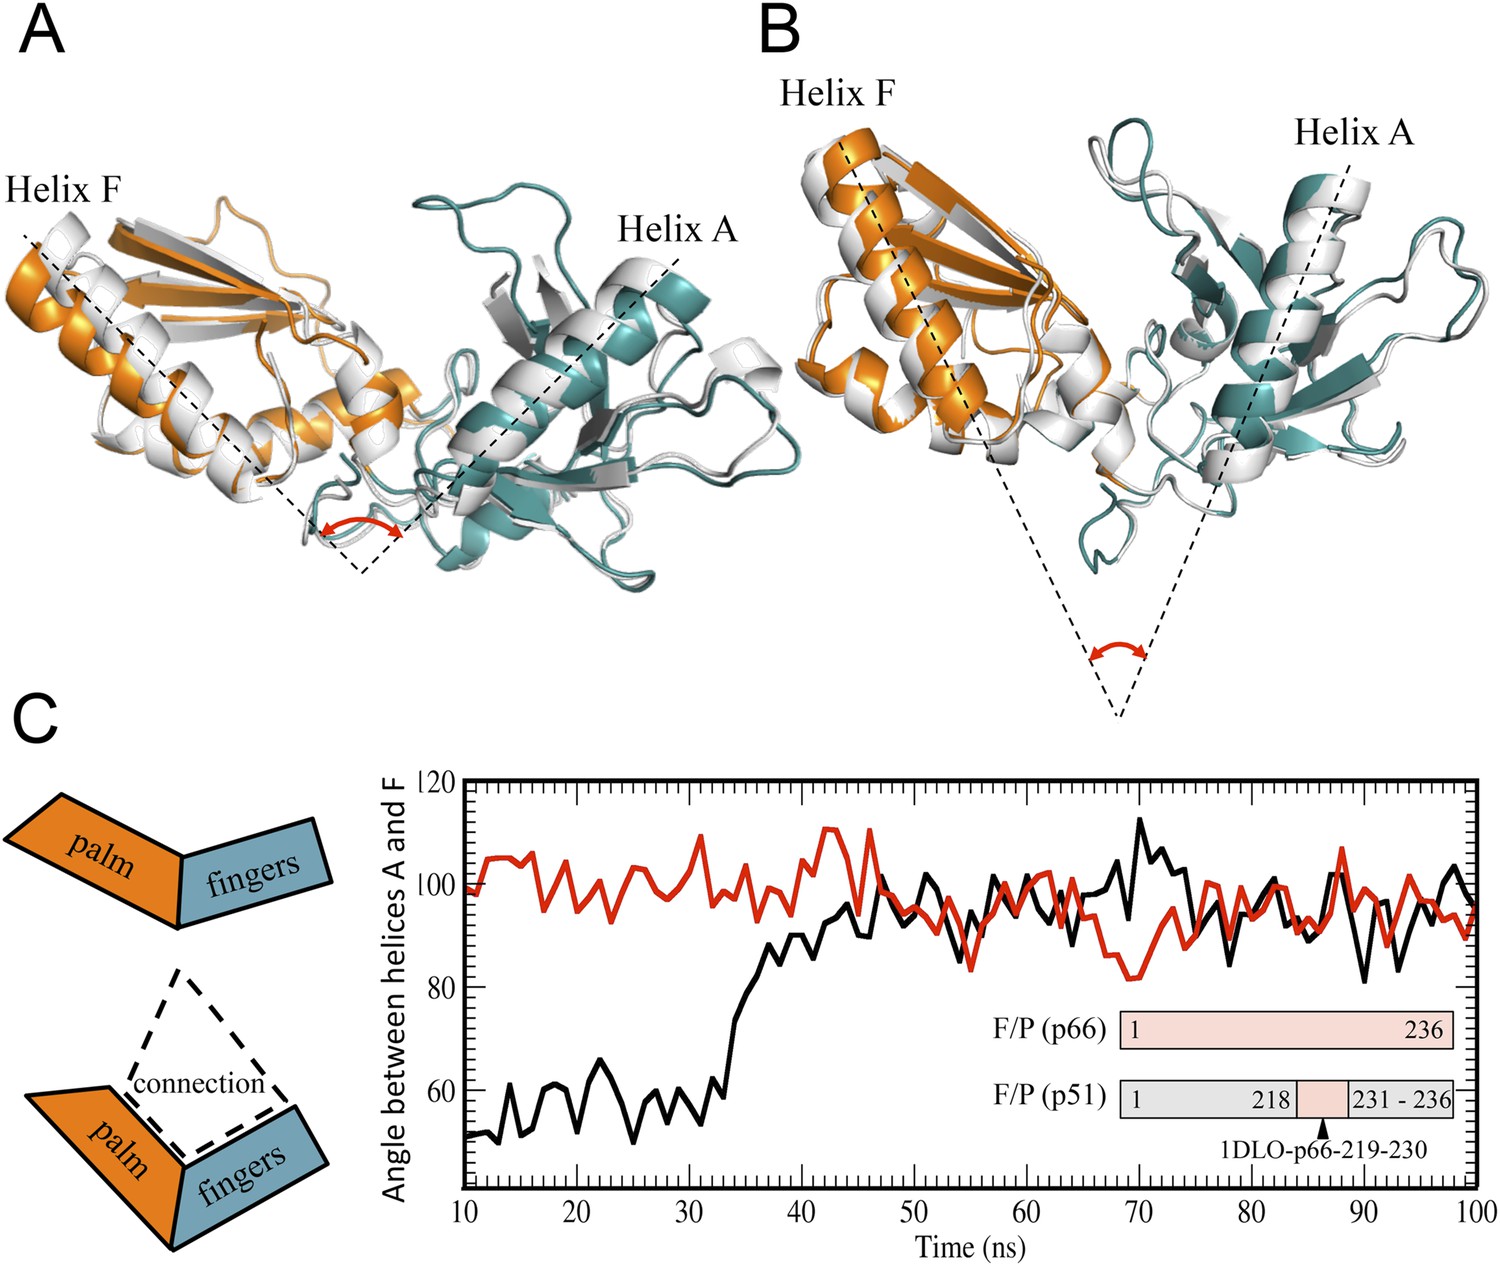
Alternative conformations and molecular dynamic simulations analysis of the fingers/palm subdomains.
(A) Overlay of ribbon diagrams for fingers/palm residues 1–216 RT216 (pdb: 1HAR, gray) and in the p66 subunit of RT (pdb: 1DLO, fingers, teal; palm, orange). (B) Overlay of ribbon diagrams for the fingers/palm in the p51∆PL monomer (pdb: 4KSE, gray) with the corresponding region of the p51 subunit of RT (pdb: 1DLO, fingers, teal; palm, orange). The fingers/palm angle defined by helices A and F is indicated, illustrating the more acute values for the monomer and the p51 subunit, compared with an isolated fingers/palm construct and the p66 subunit. (C) Time-dependent molecular dynamics simulations of the behavior of the αAF angle for the fingers/palm starting with the p66 conformation (red) or with the p51 conformation (black). The simulations utilized residues 1–236 in the p66 and p51 subunits of RT (pdb: 1DLO) after removing all other domains at t = 0, and the missing palm loop residues in the p51 starting structure were introduced as indicated in ‘Materials and methods’. Residues included in the simulations are defined in the inset. The cartoons on the left illustrate the starting fingers/palm conformations and the proposed role of the fingers/palm:connection interface in constraining the initial αAF angle in the monomer and p51 structures.
Figure 3—figure supplement 1
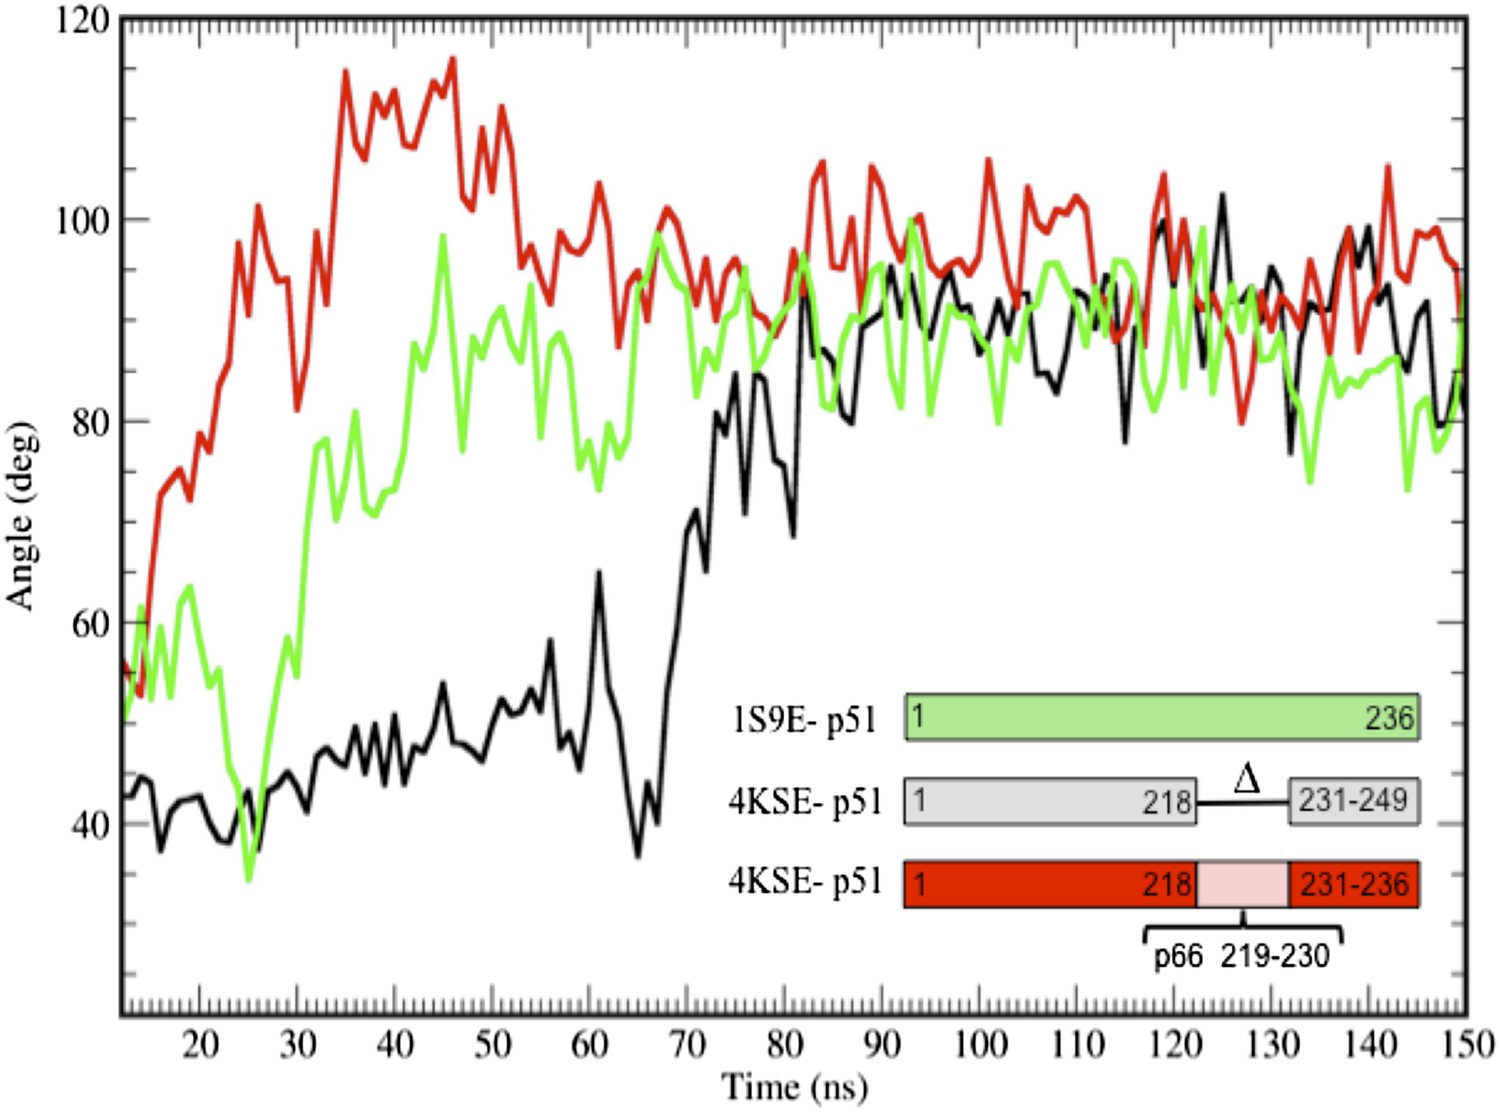
Additional simulations starting from the p51 monomer and from a structure that includes the p51 palm loop.
Additional time-dependent molecular dynamics simulations of the isolated fingers/palm domains starting from a structure that includes palm loop residues 219–230 (1S9E, green), the p51∆PL monomer in which palm loop residues from the 1DLO p66 subunit have been added back (4KSE, red), or the p51∆PL monomer taken to include the first 236 residues (corresponding to residues 1–249, since the construct is missing residues 219–230) (4KSE, black). In all cases, the palm loop moves from a structure with a more acute bend toward the more extended conformation characterized by an αA-αF angle of ∼ 90°, with the main differences related to the time at which this occurs. The transition took longer to occur with the deletion construct. We note, however, that the segment from 218 to 236 does not attain its conformation in the p66 subunit of RT in any of the simulations. Most probably, this results from the artificiality of terminating the sequence at Pro236 and the absence in the simulations of additional inter-domain interactions.
Figure 4
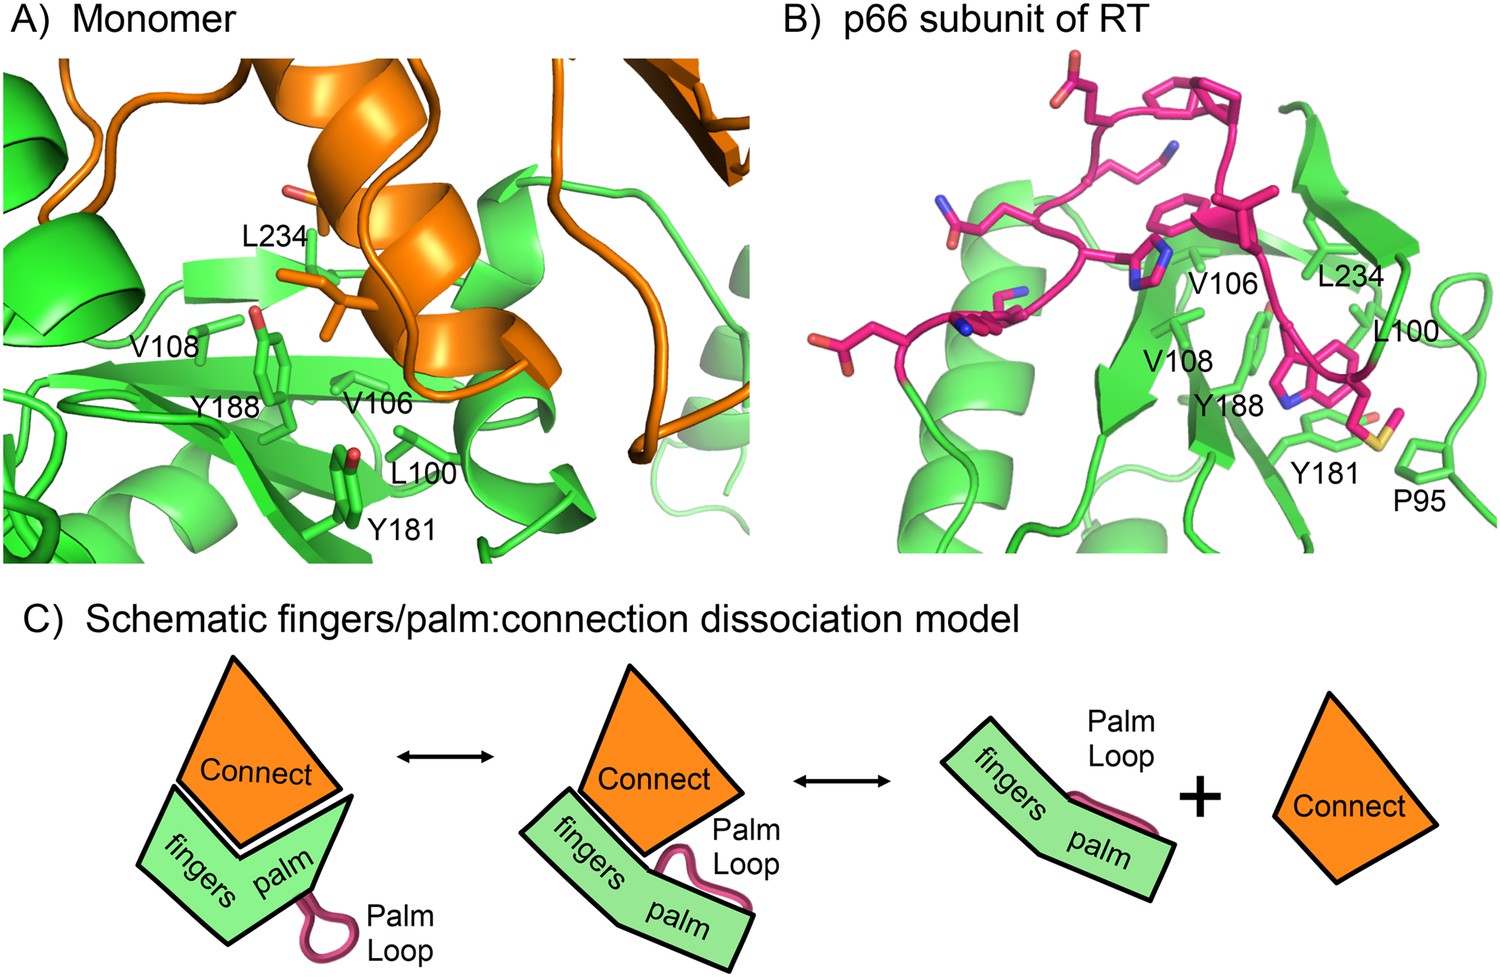
Role of the palm loop in isomerization of the polymerase domain.
(A) Ribbon diagram of the p51∆PL monomer (pdb: 4KSE, green) with the connection domain shown in orange. Several hydrophobic residues in the palm—Leu100, val106, Val108, Tyr181, Tyr188, and Leu234 that interact with the connection domain are annotated. (B) Ribbon diagram of the p66 subunit of RT (pdb: 1DLO) showing a portion of the fingers/palm domains (green) interacting with palm loop residues (219–230, magenta) of the palm domain. In the p66 subunit (E conformation), the palm loop becomes the primer grip and interacts with many of the same hydrophobic residues that interact with the connection domain in the monomer. (C) Schematic diagram illustrating how the intrinsic preference of the fingers palm for a more open conformation facilitates disruption of the fingers/palm:connection interface and repositioning of the palm loop.
Figure 5 with 15 supplements
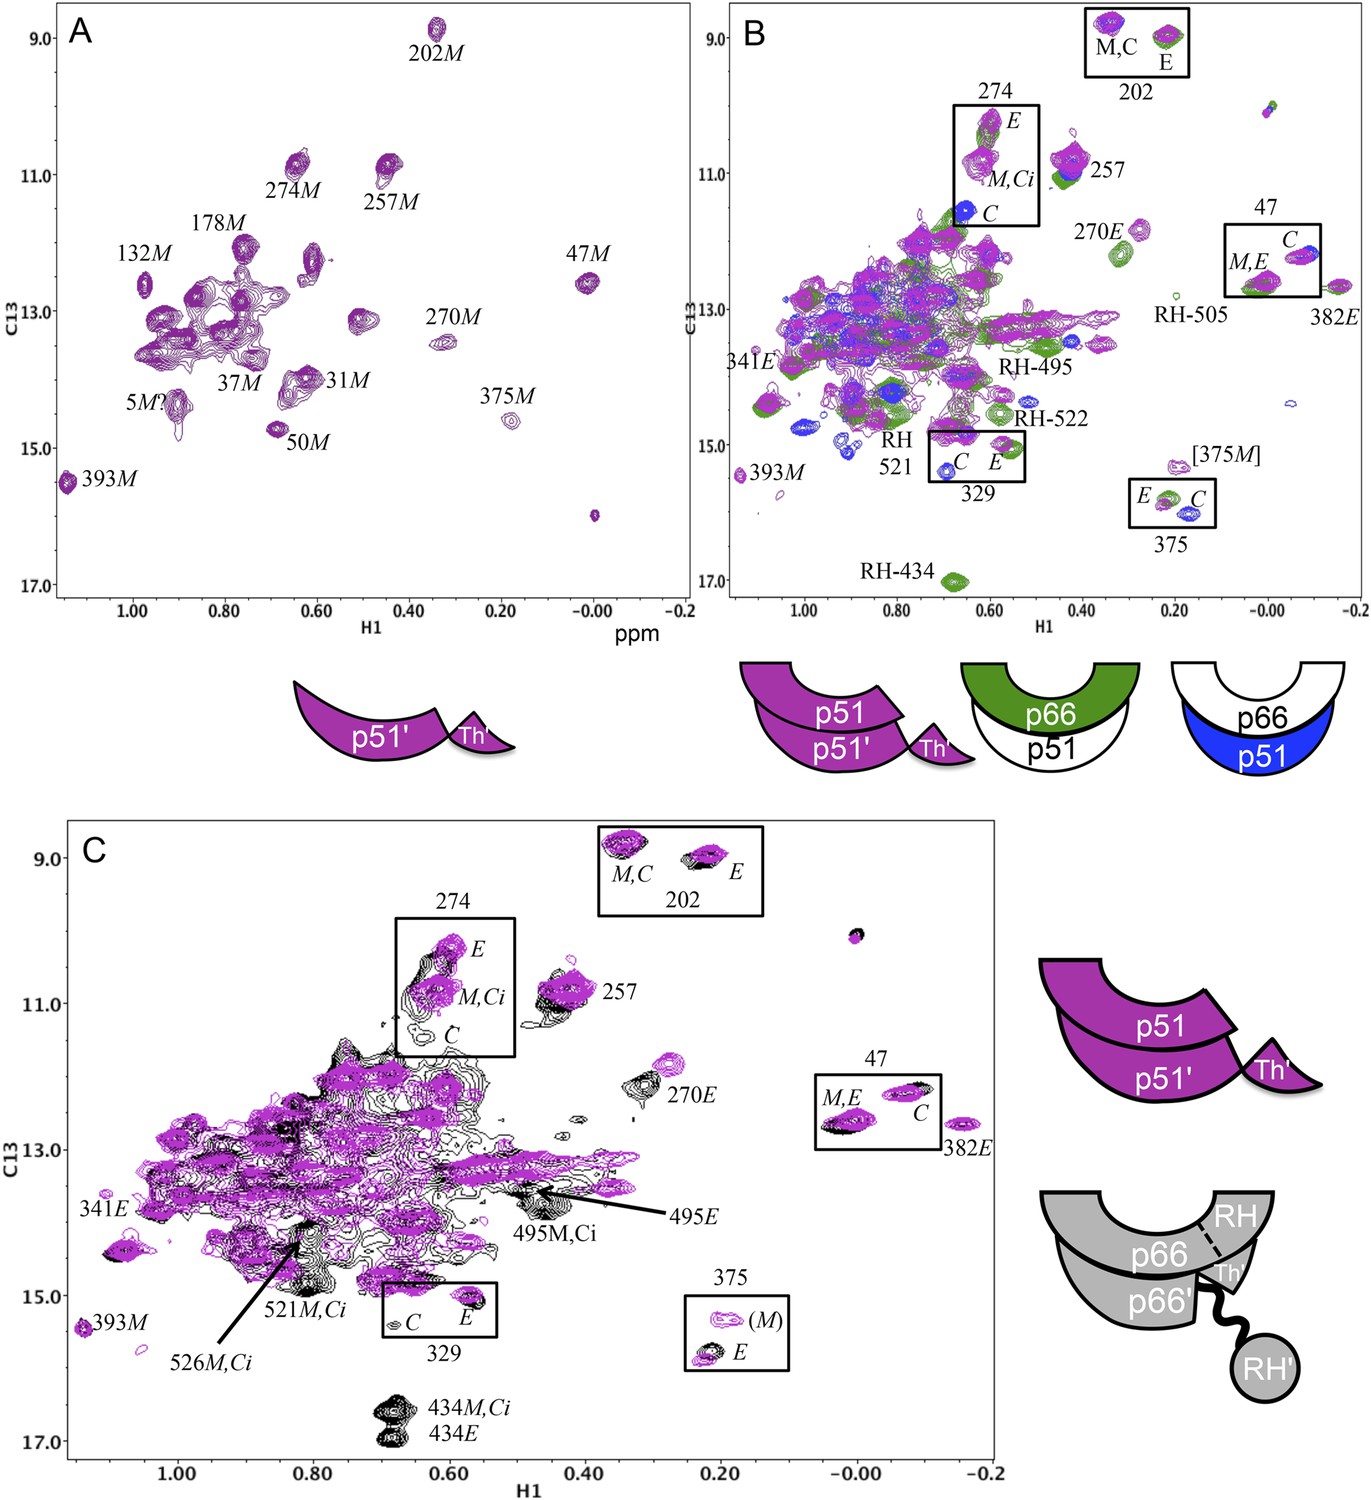
Spectral comparisons of p51/p51' and p66/p66' homodimers.
(A) 1H-13C heteronuclear multiple-quantum correlation (HMQC) spectrum of the [13CH3-Ile]p51 monomer. (B) Overlaid HMQC spectra of the [13CH3-Ile]p51/[13CH3-Ile]p51' homodimer with the spectra for [13CH3-Ile]p66/p51 (green) and p66/[13CH3-Ile]p51 (blue). We note the absence of homodimer resonances that overlay the resolved RH domain resonances in p66-labeled RT. (C) Overlaid HMQC spectra for the labeled p51 homodimer and the Ile-labeled p66/p66' homodimer obtained during the first 5.5-hr accumulation period after initiation of dimerization. The p66 homodimerization studies were performed in 25 mM Tris-HCl-d11 in D2O, pD = 7.51, 100 mM KCl, 0.02% NaN3. In order to stabilize the p51/p51' homodimer, it was necessary to use a high salt buffer containing 800 mM KCl and 20 mM MgCl2 in addition to the other components. The labeling pattern corresponds to the color coding in the cartoons near each spectrum, with white indicating an unlabeled subunit. The assignment in parenthesis is considered tentative. The RH, RH', and Th' labels in the cartoon indicate the RNase H domain in the p66 subunit, the RNase H domain in the p66' subunit, and the Thumb' domain in the p51' or p66' subunits.
Figure 5—figure supplement 1
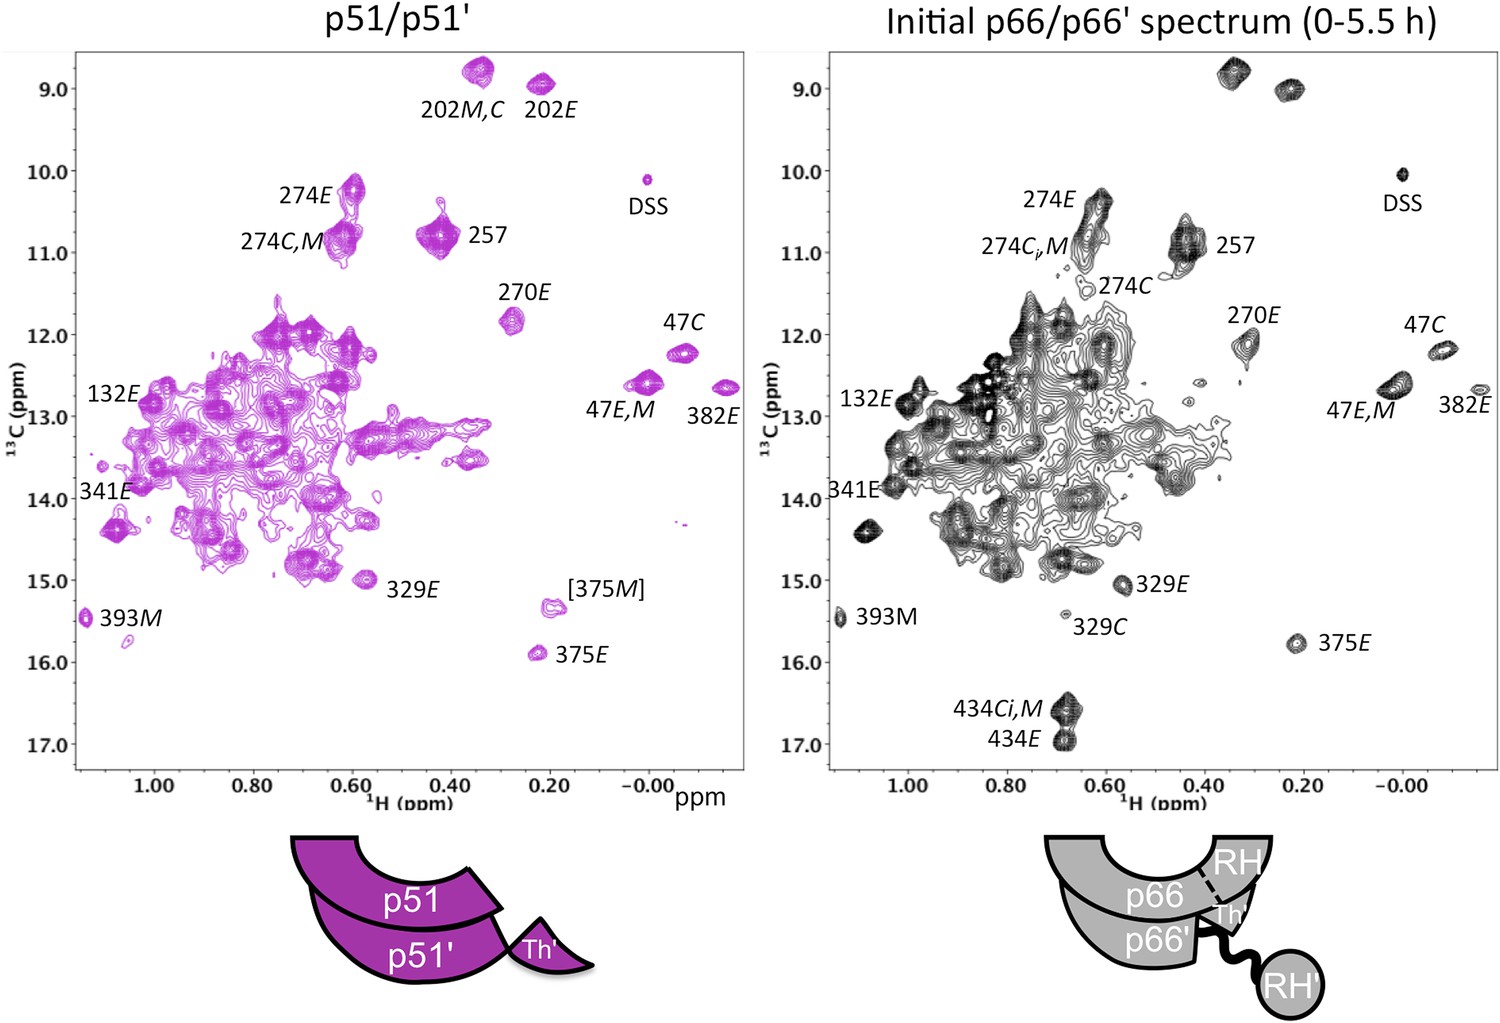
Spectral comparison of the p51/p51' and initial p66/p66' homodimers.
Direct comparison of the 1H-13C HMQC spectra of [13CH3-Ile]p51/[13CH3-Ile]p51' and [13CH3-Ile]p66/[13CH3-Ile]p66' obtained during the first 5.5-hr accumulation period after dimerization conditions were introduced. The p51 spectrum was obtained in D2O buffer, 25 mM Tris-d11, pD 7.5, 0.02 % NaN3 that also contained 800 mM KCl and 20 mM MgCl2 in order to convert most of the p51 to the dimeric form. Some monomer resonances are apparent in both spectra, however, in the p66/p66' sample, these resonances decay, while in the p51/p51' spectrum they are constant. A resonance labeled [375M] likely arises from Ile375 in the monomer, however, the shift at high salt differs from the shift observed in the monomer, so this assignment is only suggested. The spectra are color coded as indicated by the cartoons under each spectrum; RH, RH', and Th' refer to the RNase H domain in p66, the RNase H domain in p66', and the Thumb' domain in p66', respectively.
Figure 5—figure supplement 2
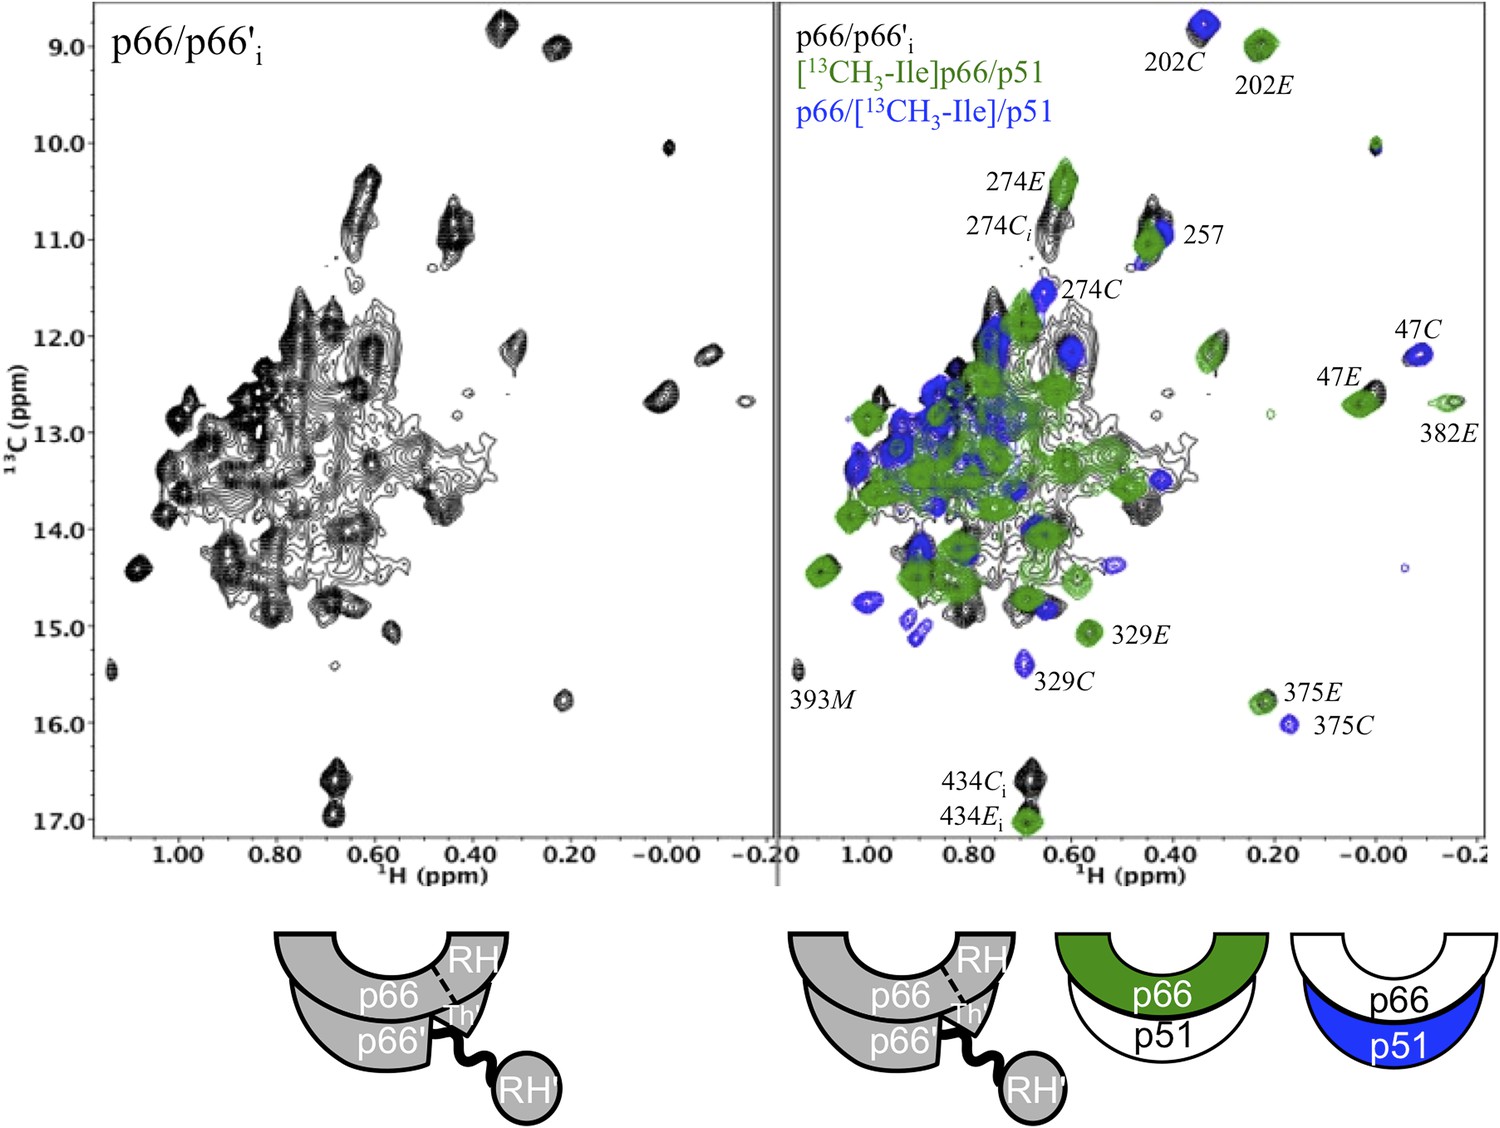
Spectral comparison of the initial p66/p66' homodimer with the selectively-labeled subunits of RT.
Comparison of the initial 1H-13C HMQC spectrum obtained for [13CH3-Ile]p66/[13CH3-Ile]p66' obtained during the first accumulation period after dimerization conditions are introduced, with the spectra of [13CH3-Ile]p66/p51 (green) and p66/[13CH3-Ile]p51 (blue). Note that in all cases, resonances in the initial homodimer spectrum agree with resonances in the p66-labeled RT. Alternatively, this is not the case for the p66' resonances, for which there is good overlap of some resonances, for example, Ile47C and Ile202C, but weak or missing resonances for other residues, for example, Ile274C, Ile329C, and Ile375C.
Figure 5—figure supplement 3
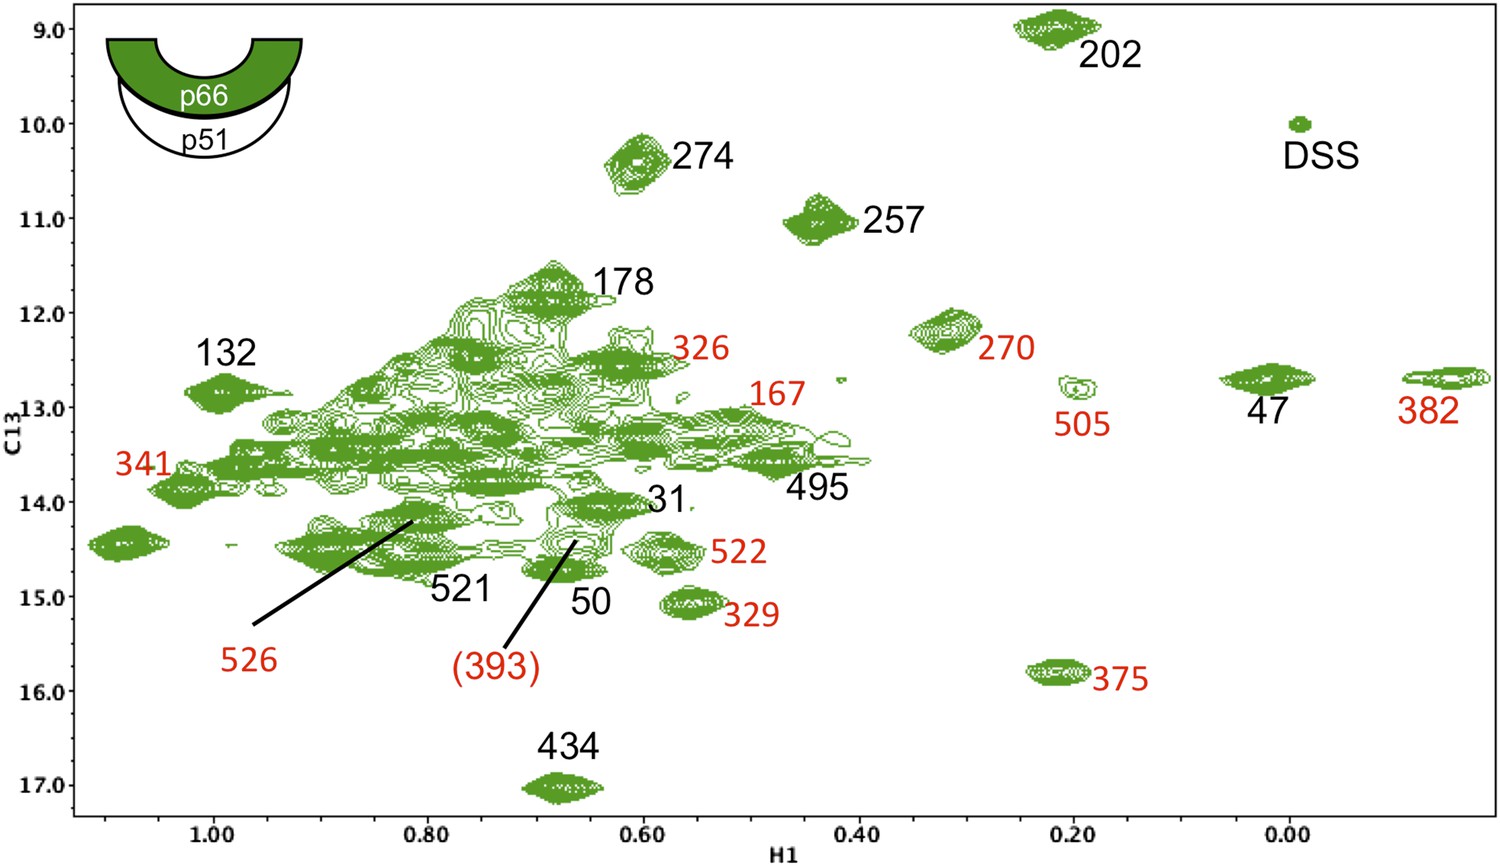
Assignments of connection domain resonances in the p66 subunit of RT.
1H-13C HMQC spectrum of [13CH3-Ile]p66/p51. Resonances with new assignments are indicated (in red). We have reassigned Ile375 (which had been mistakenly attributed to Ile329), Ile382 (which had been attributed to Ile411), and Ile522 (which had been attributed to Ile526). In each of these cases, the misassigned resonances corresponded to residues positioned very near the mutated residues. We were unable to identify spectral changes in the Ile411V mutant, possibly due to significant broadening. Resonances for Ile380 and Ile542 are either poorly resolved and/or subject to extreme broadening. The assignment of Ile393 is indicated in parenthesis, since the resonance is relatively weak and not well resolved and is thus considered tentative. As noted in the text, the additional assignments are useful for the studies reported here, but were not utilized in our previous analysis, and the reassignments do not alter any of the conclusions previously presented. A table of mutated residues and some of the spectra obtained for the individual mutations are shown in the following figures. The cartoon on the upper left indicates the labeled subunit.
Figure 5—figure supplement 4
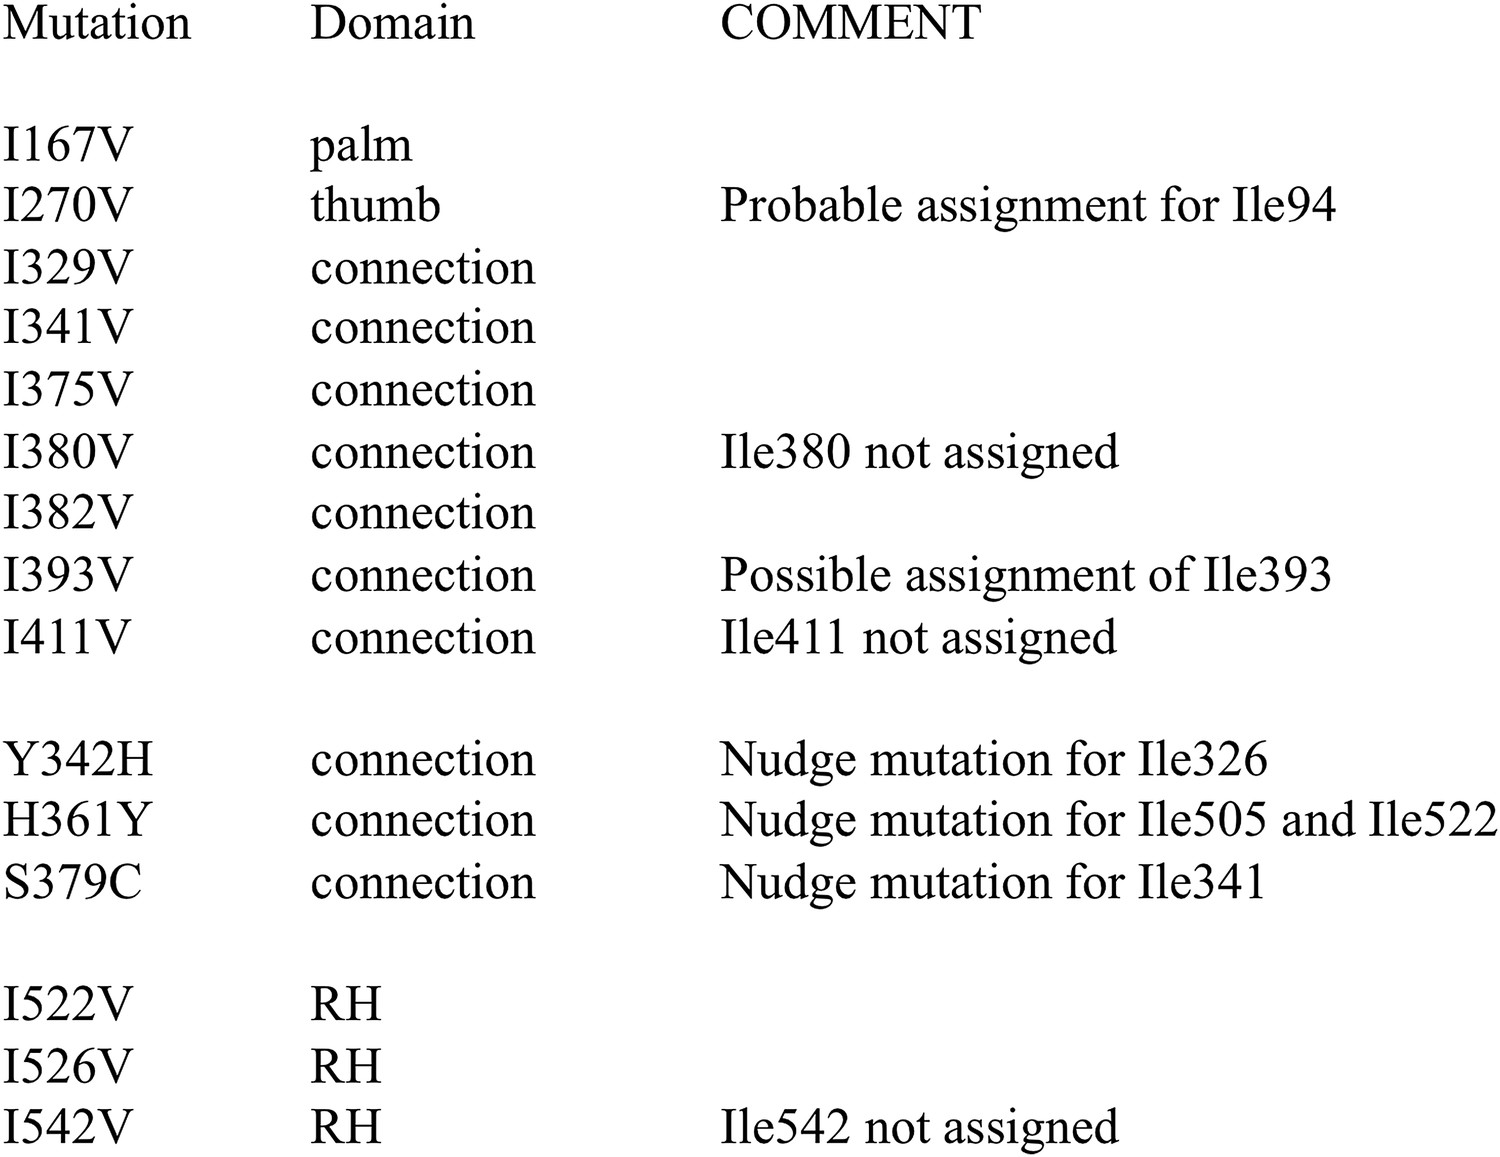
Table of mutated residues.
In contrast with the assignment procedures used for the isolated fingers/palm (RT216), thumb, and RH domains, we were unable to express a stable connection domain on which to perform NMR assignment studies. We thus utilized extensive site-directed mutagenesis as the basis for making these assignments in the p66 subunit of the RT heterodimer. Although this method provided a basis for many of the assignments, it also proved problematical for assigning some of the closely positioned methyl resonances such as those arising from Ile329 and Ile375. Overall, in addition to the Ile → Val mutants, we also utilized several ‘nudge’ mutations, which helped to resolve assignment ambiguities. These included S379C (to assign Ile341), Y342H (to assign Ile326), and H361Y (to assign RH domain resonances Ile522, Ile505, and Ile526 located near the connection:RH domain interface. Ultimately, the strategy used was aimed at obtaining a set of self-consistent assignments allowing us to overcome the limitations of individual substitutions, which in a few cases led to ambiguous results. The positions of the additional assigned resonances are indicated in Figure 5—figure supplement 3, corresponding to [13CH3-Ile]p66/p51. Some of the spectra obtained for the mutants in the table are shown in the following Figure 5 supplements.
Figure 5—figure supplement 5
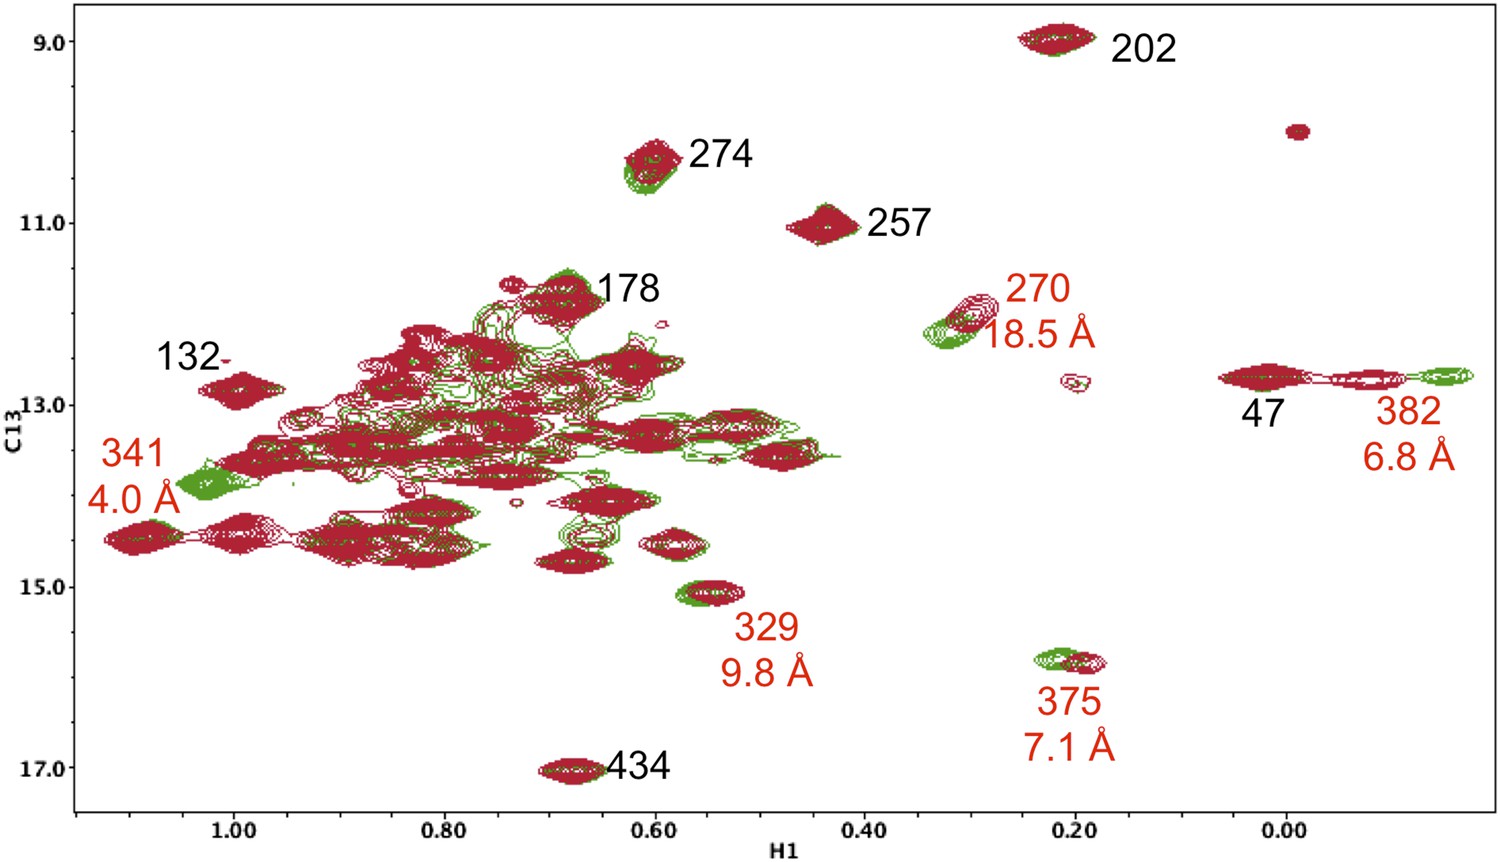
Resonance perturbations in [13CH3-Ile]p66(I341V)/p51.
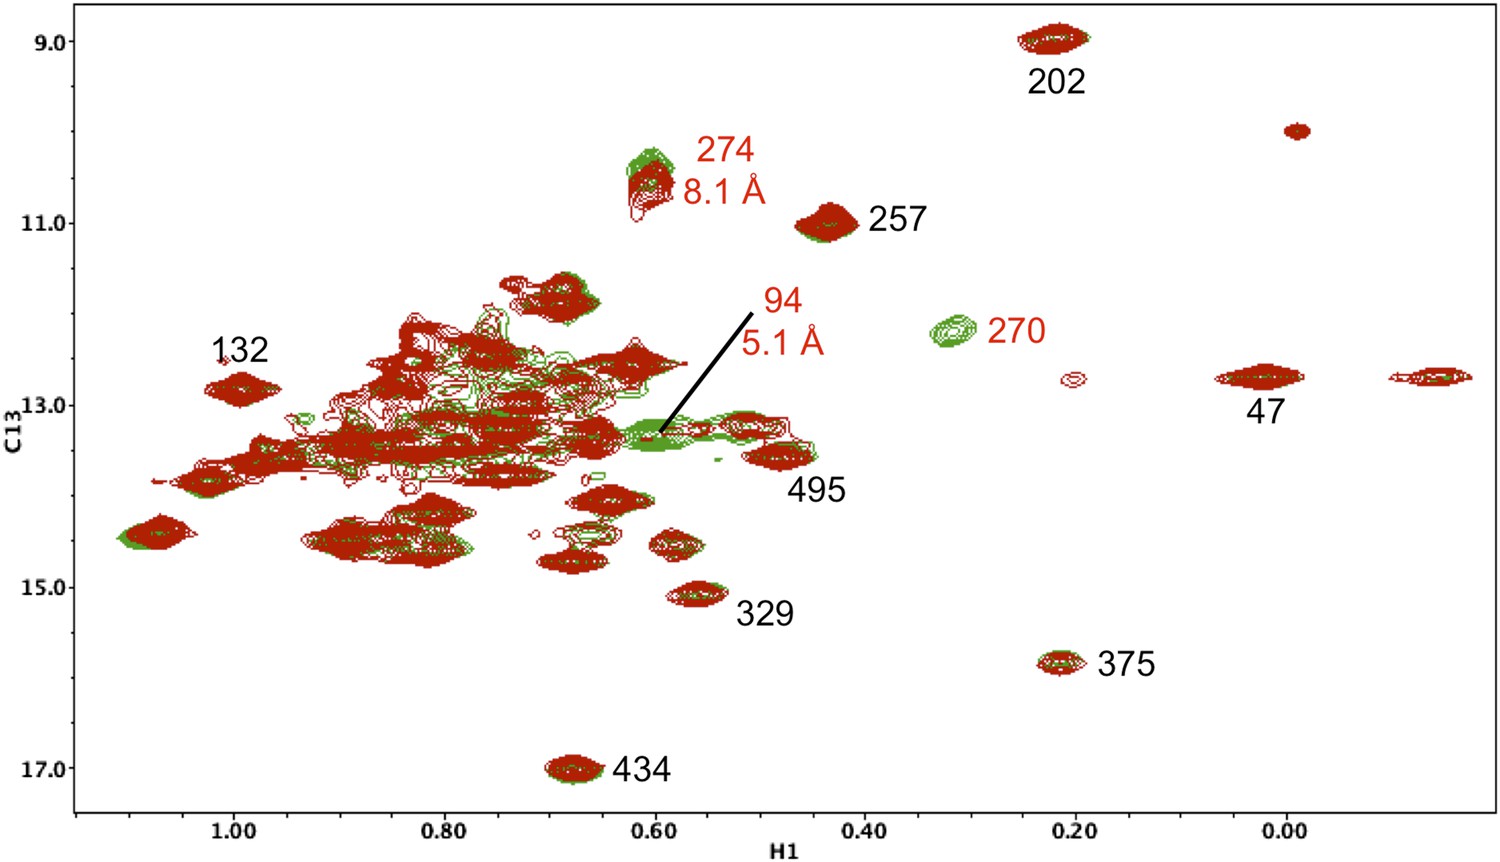
The 1H-13C HMQC spectrum of [13CH3-Ile]p66(I341V)/p51 (red) is overlayed with spectrum for [13CH3-Ile]p66/p51 (green). Perturbed resonances are annotated in red. The I341V substitution eliminates the Ile341 resonance and perturbs the shifts of Ile382 and Ile375. The δ-methyl-δ-methyl distances relative to the mutated residue based on structure 1DLO are also shown. The four most strongly perturbed resonances are the closest in the structure. Additional resonances annotated in black are included to facilitate spectral comparisons.
Figure 5—figure supplement 6
Resonance perturbations in [13CH3-Ile]p66(I382V)/p51.
Overlay of the 1H-13C HMQC spectra of [13CH3-Ile]p66(I382V)/p51 (red) and [13CH3-Ile]p66/p51 (green). The I382V substitution eliminates the Ile382 resonance and perturbs the shifts of the resonances indicated. The δ-methyl-δ-methyl distances of the perturbed residues relative to the mutated residue are also shown. The small magnitude of the Ile341 perturbation is surprising, but not necessarily unreasonable. If the mutated and observed residues are not in direct contact, the longer range perturbation will depend on the structural effect of the residue change. We note as well that resonances at the base of the thumb, such as Ile270, show extreme shift sensitivity to multiple mutations. This may result from the inherent structural flexibility of this region of the protein, also indicated by the binding of non-nucleoside reverse transcriptase inhibitors.
Figure 5—figure supplement 7
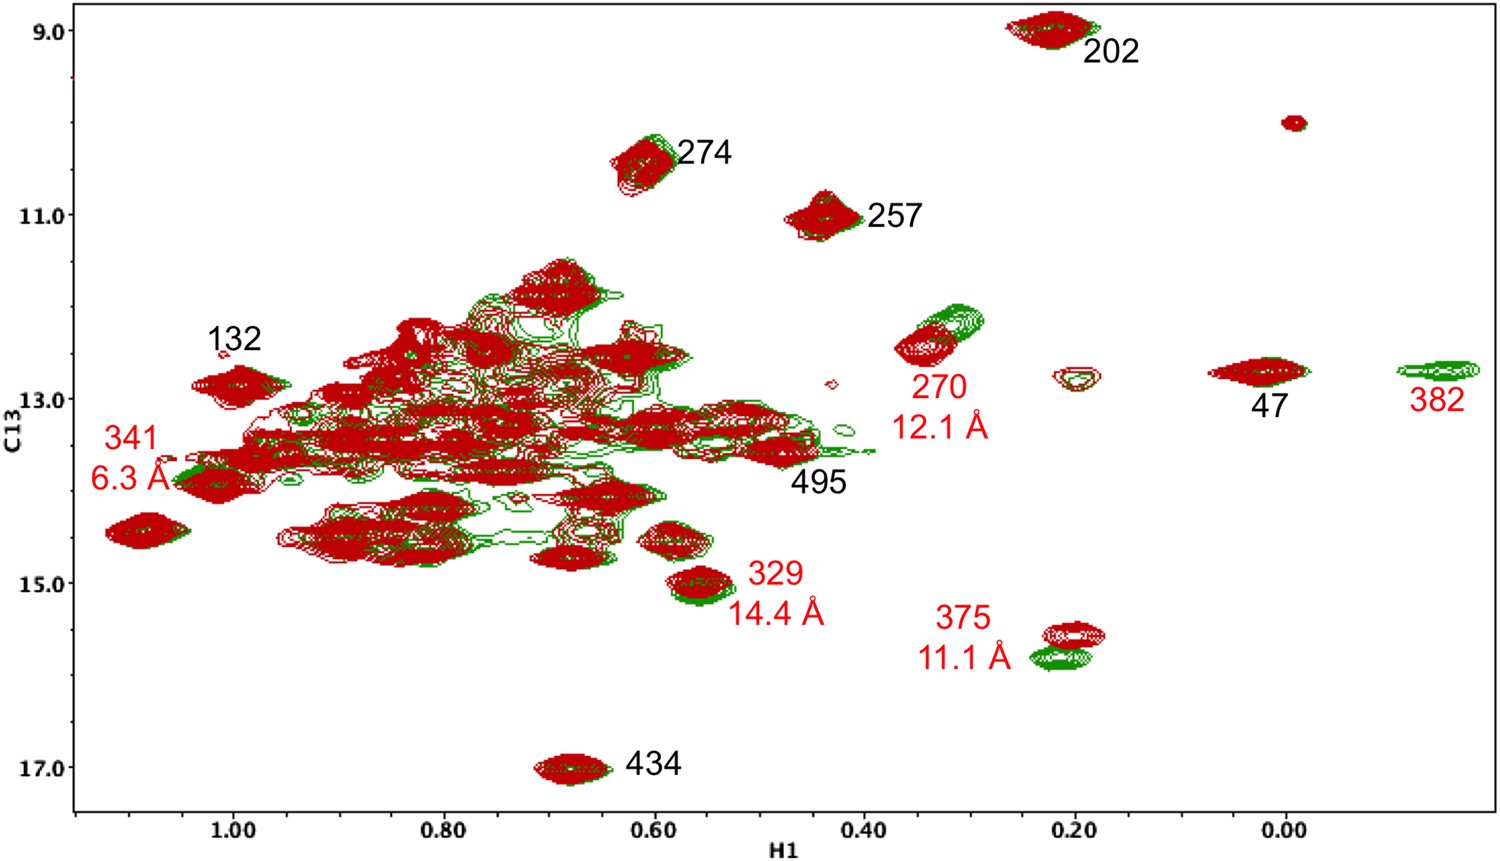
Resonance perturbations in [13CH3-Ile]p66(I270V)/p51.
Overlay of the 1H-13C HMQC spectra of [13CH3-Ile]p66(I270V)/p51 (red) and [13CH3-Ile]p66/p51 (green). In addition to the disappearance of the Ile270 resonance, the I270V substitution strongly perturbs Ile94 (5.1 Å) and weakly perturbs Ile274 (8.1 Å).
Figure 5—figure supplement 8
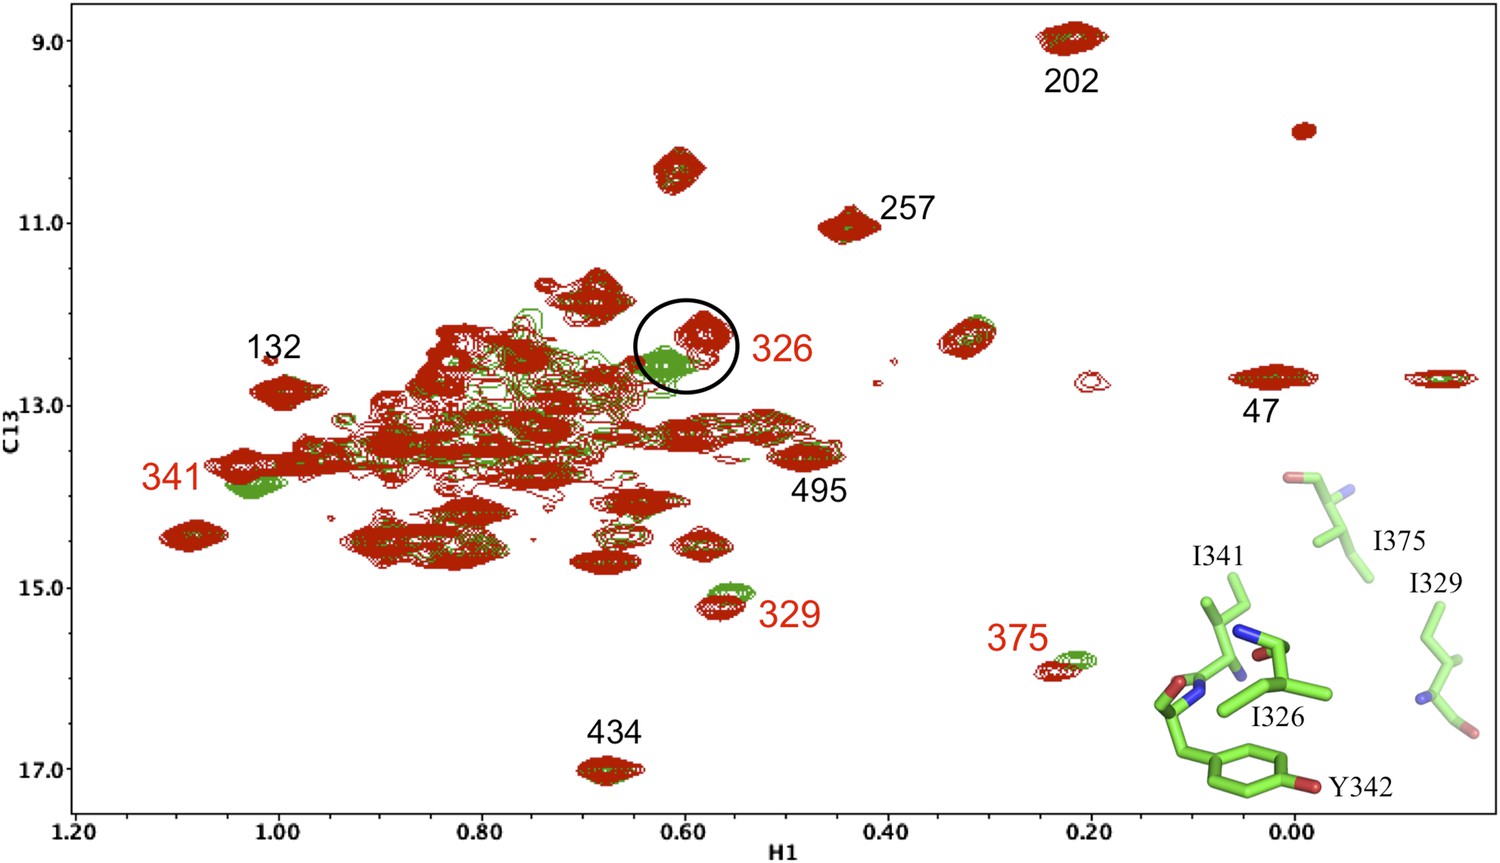
Resonance perturbations in [13CH3-Ile]p66(Y342H)/p51.
Overlay of the 1H-13C HMQC spectra of [13CH3-Ile]p66(Y342H)/p51 (red) and [13CH3-Ile]p66/p51 (green). The Y342H substitution was introduced following a nudge mutation strategy in order to assign Ile326 and perhaps other nearby residues (see structural inset). The perturbed residues are annotated (in red), and their position relative to residue Tyr342 is shown in the inset.
Figure 5—figure supplement 9
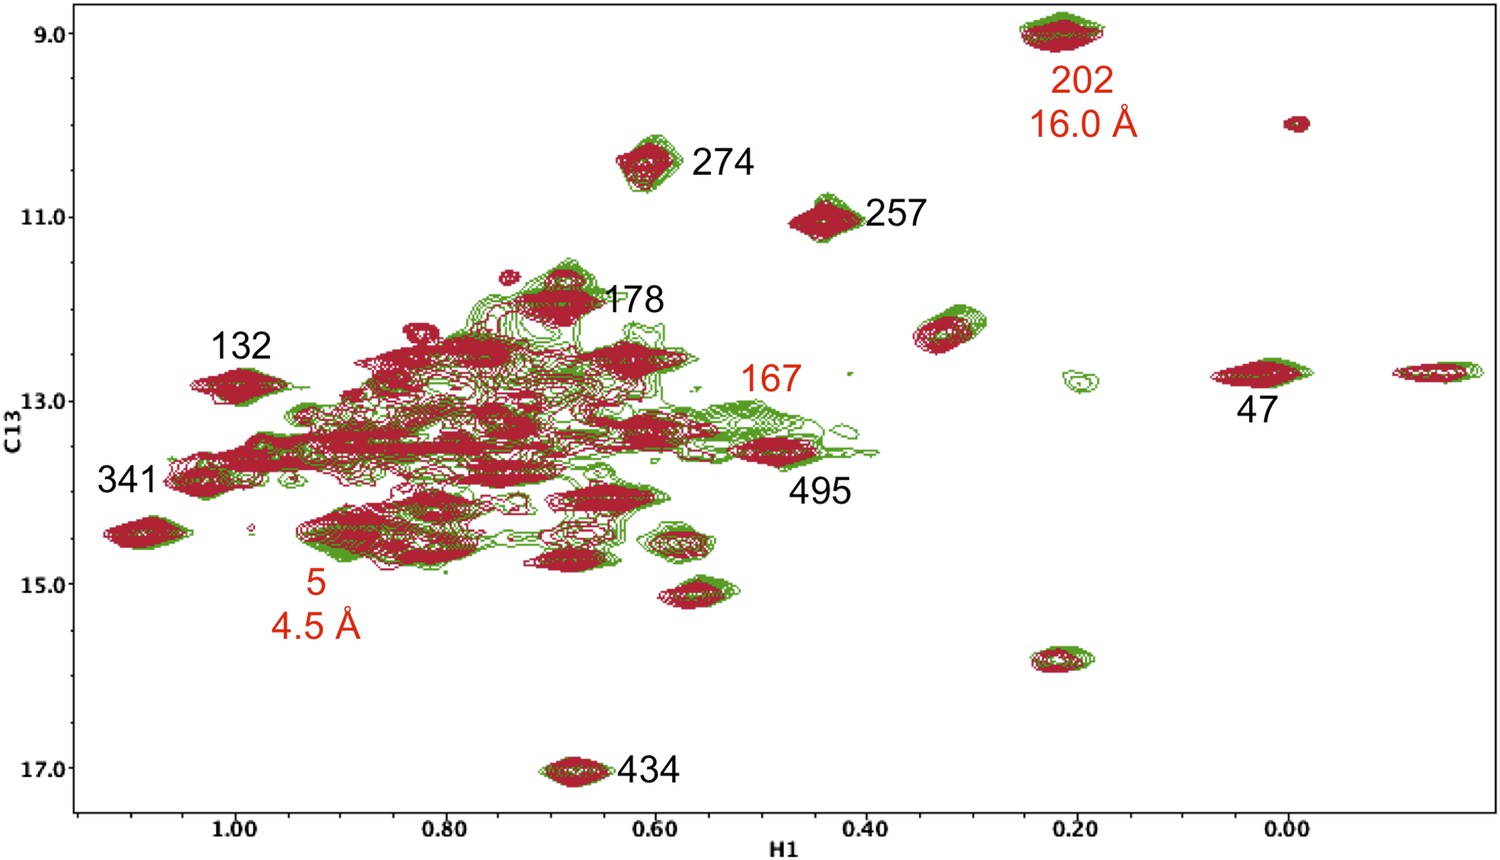
Resonance perturbations in [13CH3-Ile]p66(I167V)/p51.
Overlay of the 1H-13C HMQC spectra of [13CH3-Ile]p66(I167V)/p51 (red) and [13CH3-Ile]p66/p51 (green). The I167V substitution eliminates the Ile167 resonance and mildly perturbs Ile5.
Figure 5—figure supplement 10
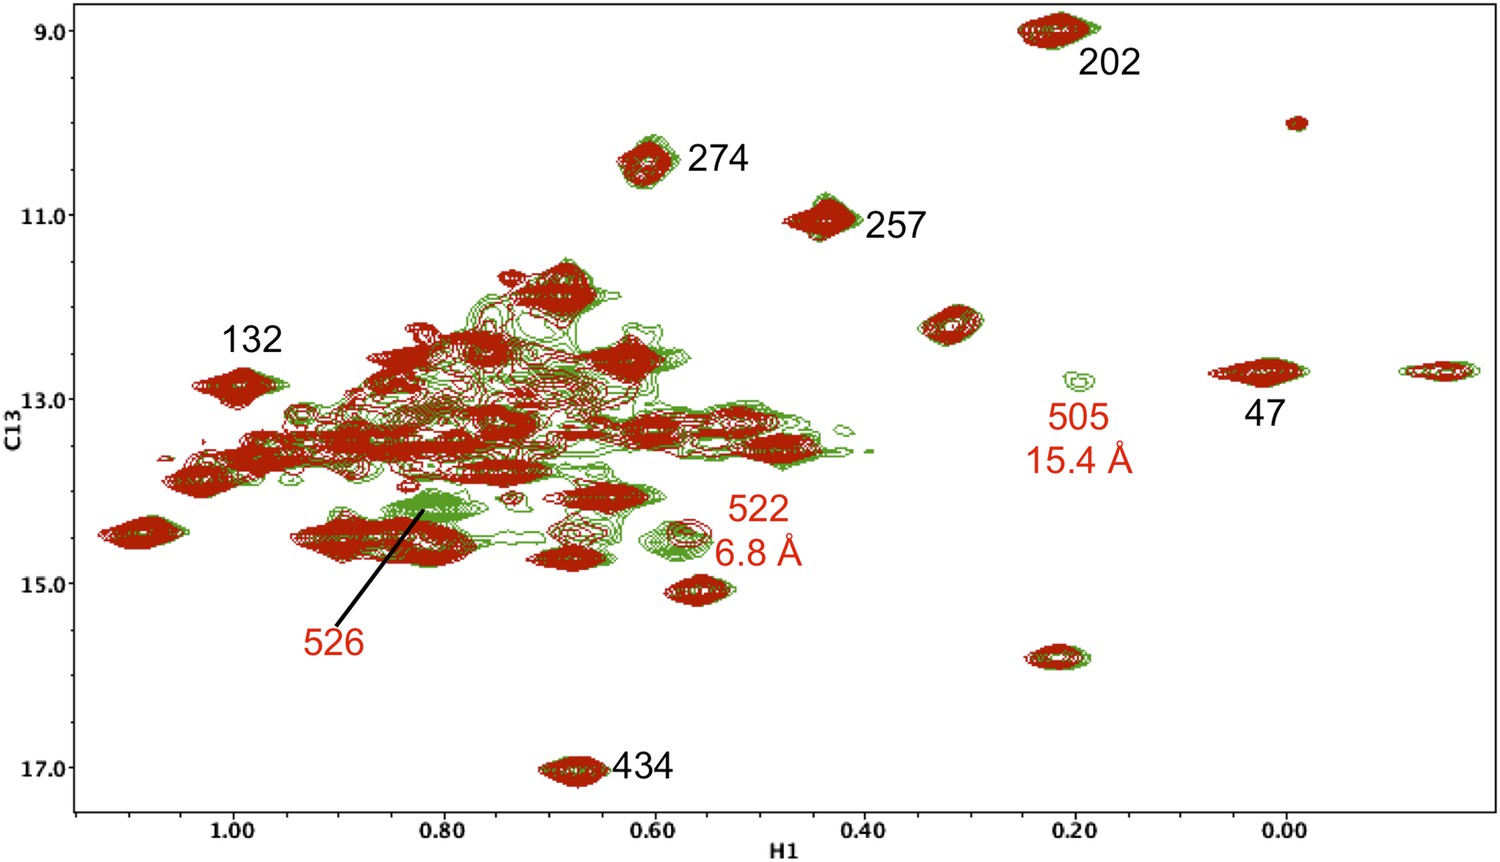
Resonance perturbations in [13CH3-Ile]p66(I526V)/p51.
Overlay of the 1H-13C HMQC spectra of [13CH3-Ile]p66(I526V)/p51 (red) and [13CH3-Ile]p66/p51 (green). The I526V substitution eliminates the Ile526 resonance and also significantly broadens the resonances of nearby Ile 522 (6.8 Å) and Ile505 (15.4 Å). This effect may be due to destabilization of the connection:RH interface, since these residues are located near this interface.
Figure 5—figure supplement 11
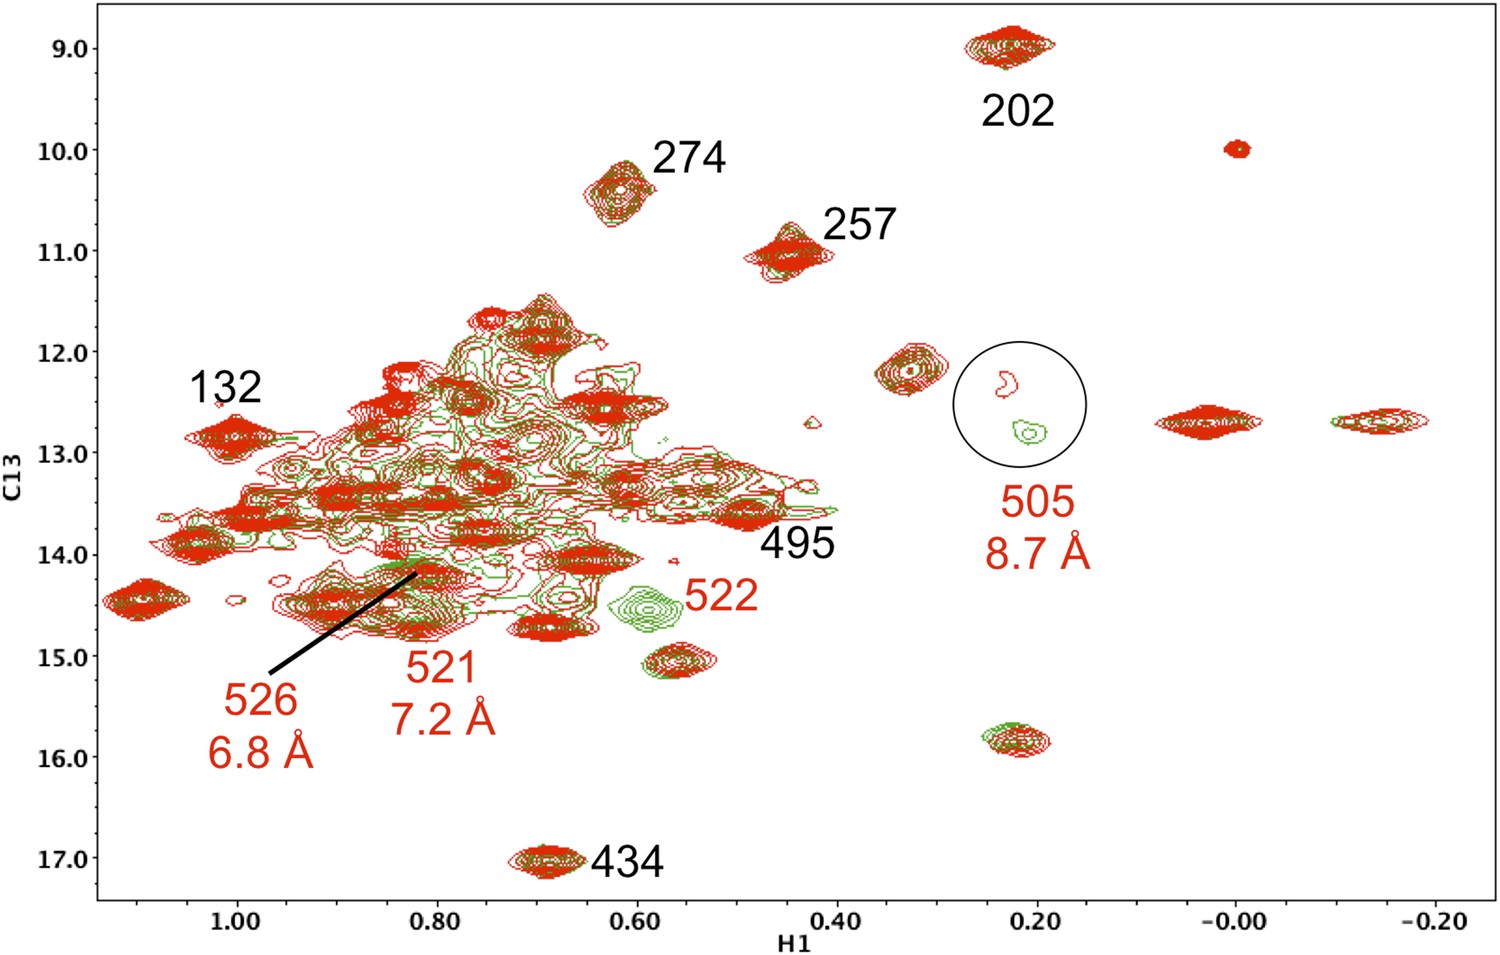
Resonance perturbations in [13CH3-Ile]p66(I522V)/p51.
Overlay of the 1H-13C HMQC spectra of [13CH3-Ile]p66(I522V)/p51 (red) and [13CH3-Ile]p66/p51 (green). The I522V substitution eliminates the Ile522 resonance and selectively shifts Ile526 (6.8 Å), Ile521 (7.2 Å), and Ile505 (8.7 Å). This effect may result in part from destabilization of the connection:RH interface, since these residues are located near this interface.
Figure 5—figure supplement 12
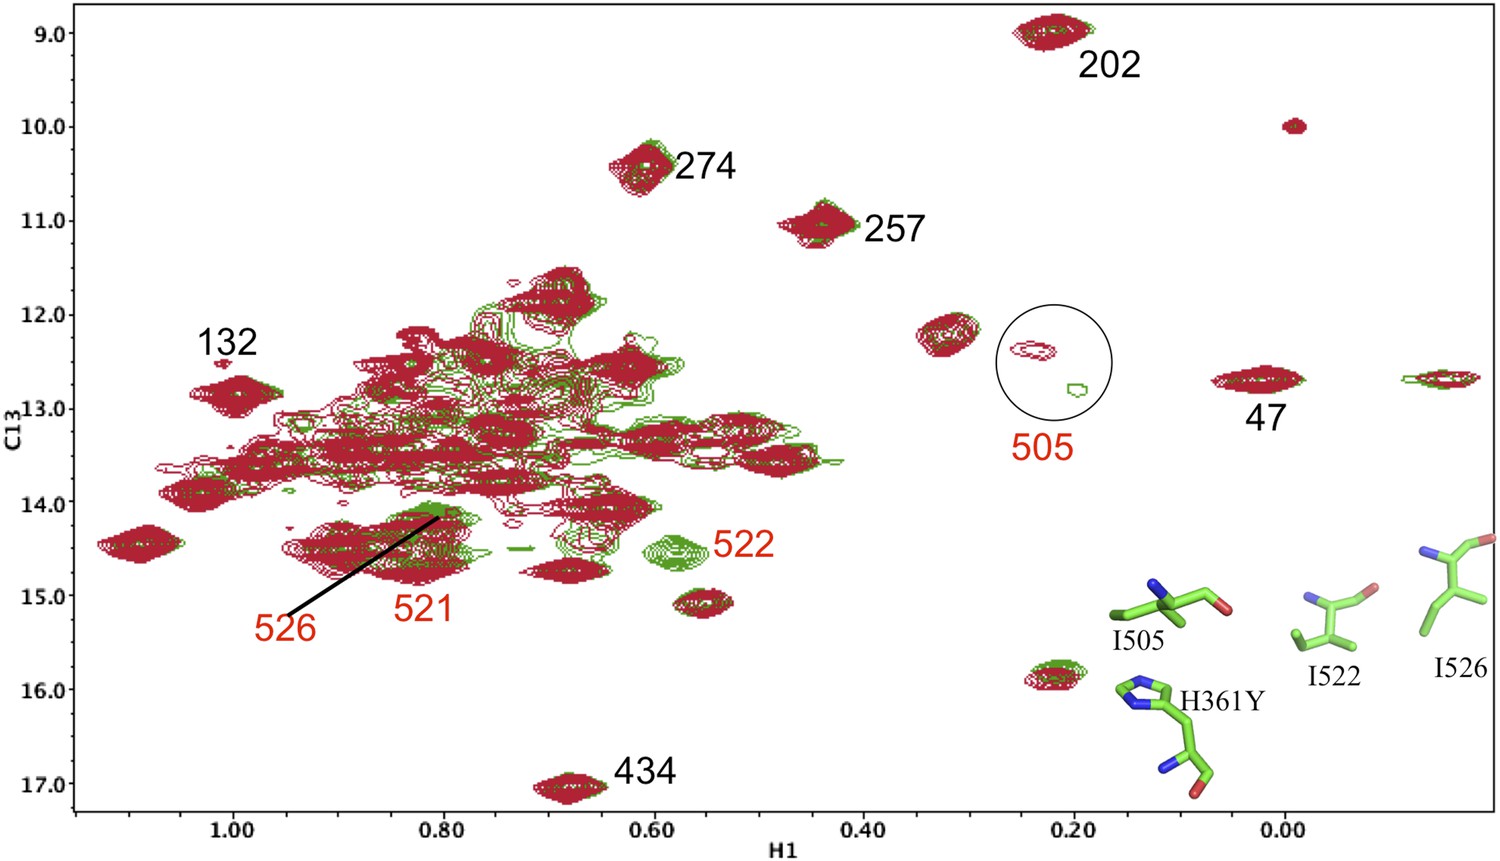
Resonance perturbations in [13CH3-Ile]p66(H361Y)/p51.
Overlay of the 1H-13C HMQC spectra of [13CH3-Ile]p66(H361Y)/p51 (red) and [13CH3-Ile]p66/p51 (green). The connection domain H361Y nudge mutation allows further assignment of residues located at the RH interface. A schematic figure showing the relative positions of H361, Ile505, Ile522, and Ile526 is shown in the lower right hand corner of the spectrum. Ile522, located 3.5 Å from His361 imidazole C1 and N2, is not observed, due either to broadening or to a shift to the densely populated spectral region, and Ile526 and Ile521 exhibit small shift perturbations. We note further that the assignment of Ile505 is consistent with the perturbation of this resonance observed previously in the presence of an active site RH domain ligand (see Figure 4b of Zheng et al., 2012), and its relative proximity to the RH active site, as well as with the upfield shift of this resonance predicted by SHIFTX analysis. Not unexpectedly, the resonance perturbations resulting from the H361Y mutation are very similar (although not identical) to the perturbations resulting from the I522V mutation, shown in the previous supplemental figure.
Figure 5—figure supplement 13
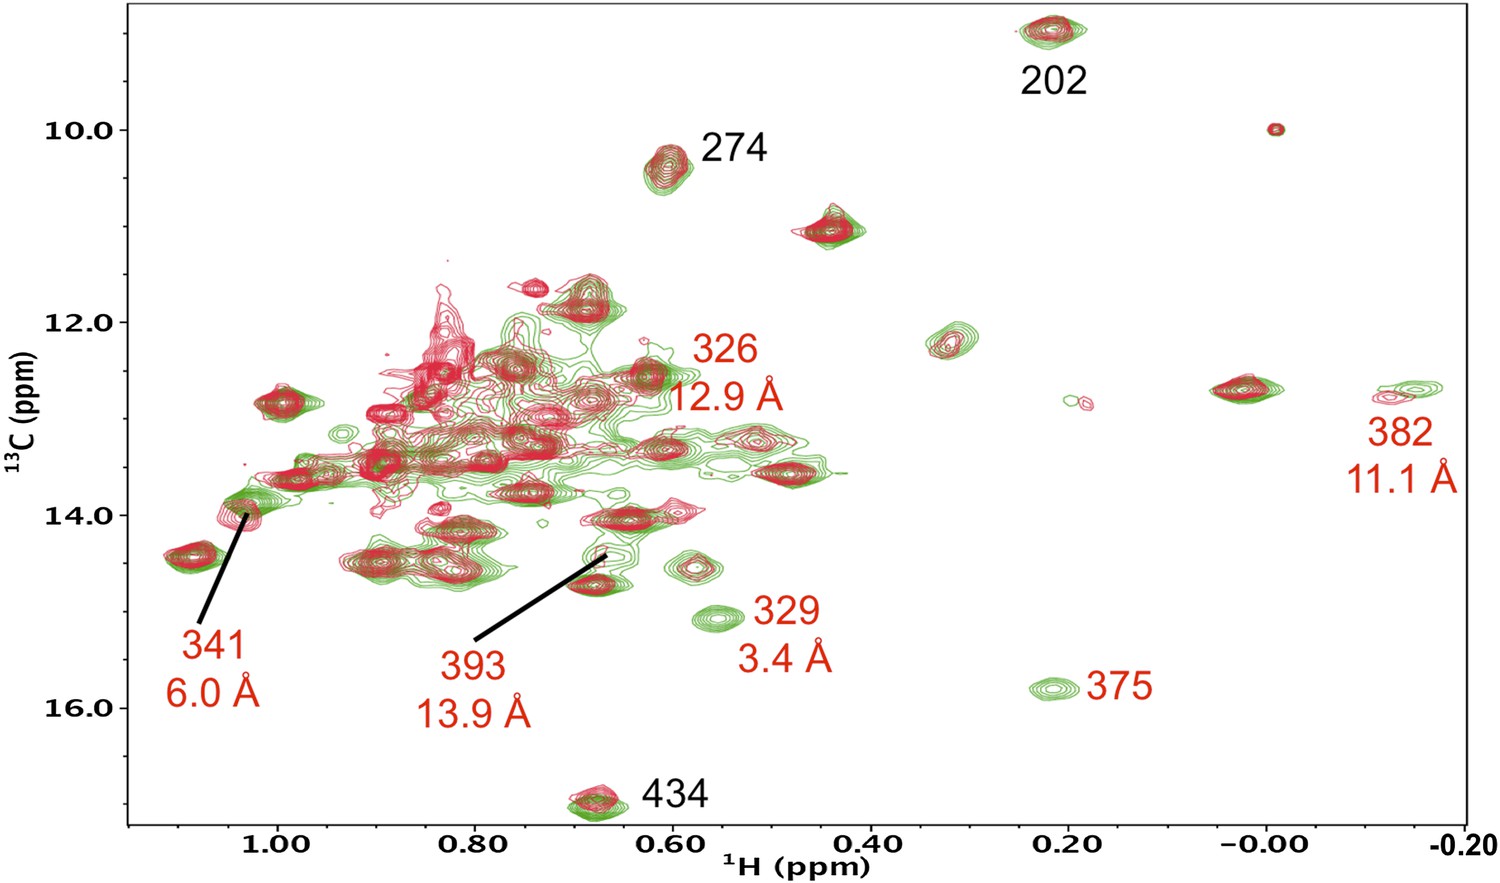
Resonance perturbations in [13CH3-Ile]p66(S379C)/p51.
Overlay of the 1H-13C HMQC spectra of [13CH3-Ile]p66(S379C)/p51 (red) and [13CH3-Ile]p66/p51 (green). The connection domain S379C nudge mutation helps to resolve the assignments of Ile375 and Ile329 and also supports assignments of Ile341 and Ile382. The distances, calculated using structure 1DLO, correspond to the oxygen sidechain in Ser379 and the δ-CH3 carbon in each Ile residue. The perturbation of the Ile270 resonance is most probably due to a conformational effect.
Figure 5—figure supplement 14
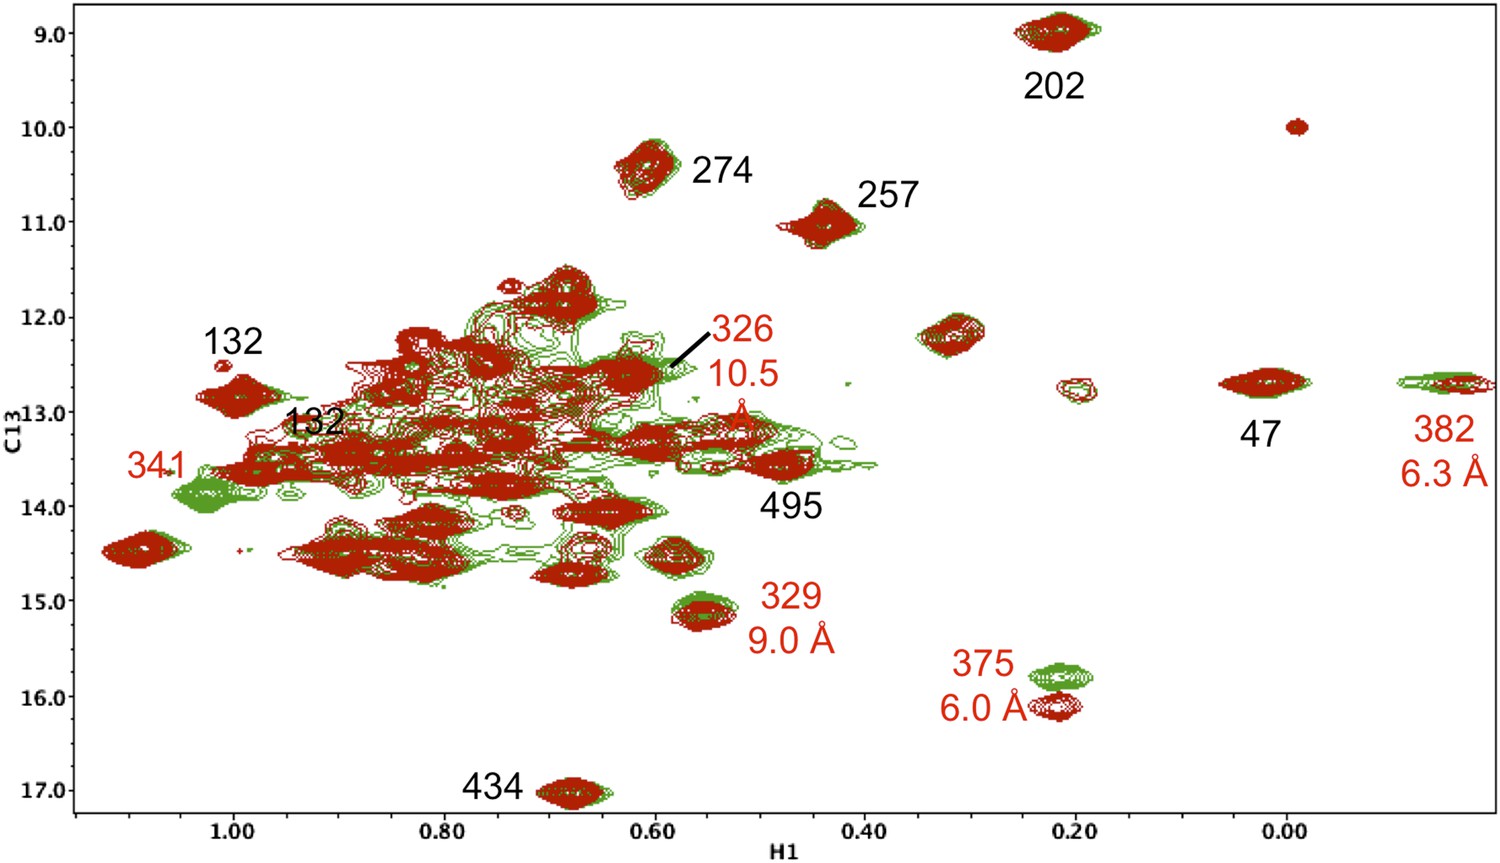
Resonance perturbations in [13CH3-Ile]p66(I375V)/p51.
Overlay of the 1H-13C HMQC spectra of [13CH3-Ile]p66(I375V)/p51 (red) and [13CH3-Ile]p66/p51 (green). The I375V mutation eliminated two connection domain resonances, consistent with the 3.4 Å separation of the δ-methyl groups of Ile375 and Ile329, indicating that Ile329 also experiences a major shift perturbation. We have now been able to make more specific assignments to Ile375 and Ile329 based on the effects of other nearby mutations, particularly I341V (Figure 5—figure supplement 5), which perturbs the closer Ile375 resonance without affecting the Ile329 resonance, as well as the relative perturbations produced by S379C (Figure 5—figure supplement 13). This corrects the previous incorrect assignment of Ile375.
Figure 5—figure supplement 15
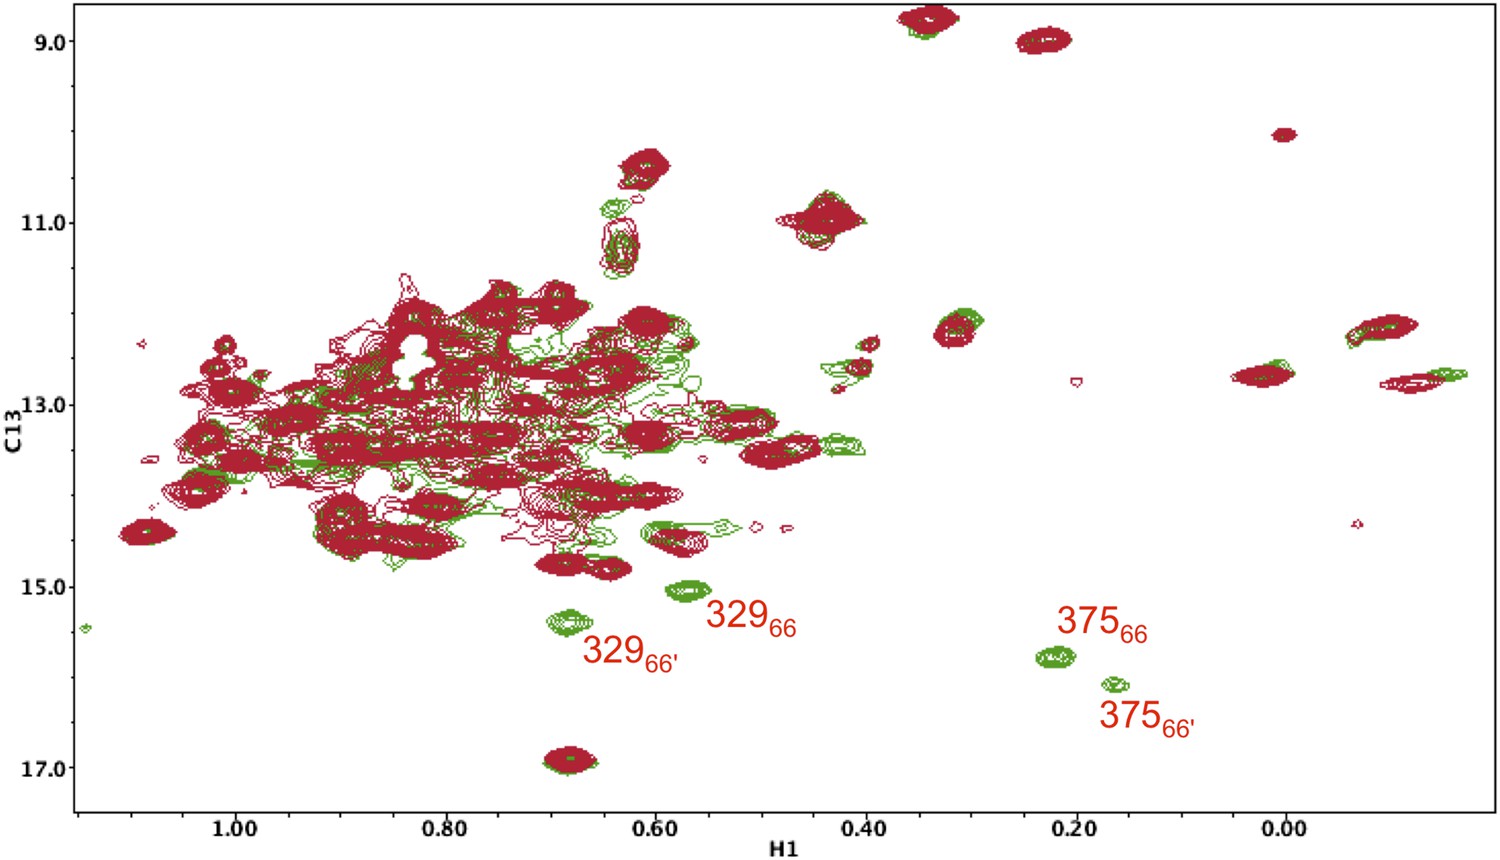
1H-13C HMQC spectrum of [13CH3-Ile]p66(I375V)/ [13CH3-Ile]p66(I375V)' mature homodimer.
In the study shown above, the labeled p66(I375V) mutant, observed as a heterodimer in Figure 5—figure supplement 14, was converted into a labeled p66(I375V)/p66(I375V)' homodimer, rather than a heterodimer, and allowed sufficient time to mature (red spectrum). The spectrum was then overlayed with that of the mature, Ile-labeled wt p66/p66' homodimer (green). As is apparent from the figure, two new sets of resonances become evident in the wt homodimer that are absent from the mutant homodimer, which then can be assigned to the same Ile375 and Ile329 residues in the p66' subunit. Analysis of these residues is particularly useful based on their isolation and ease of identification.
Figure 6
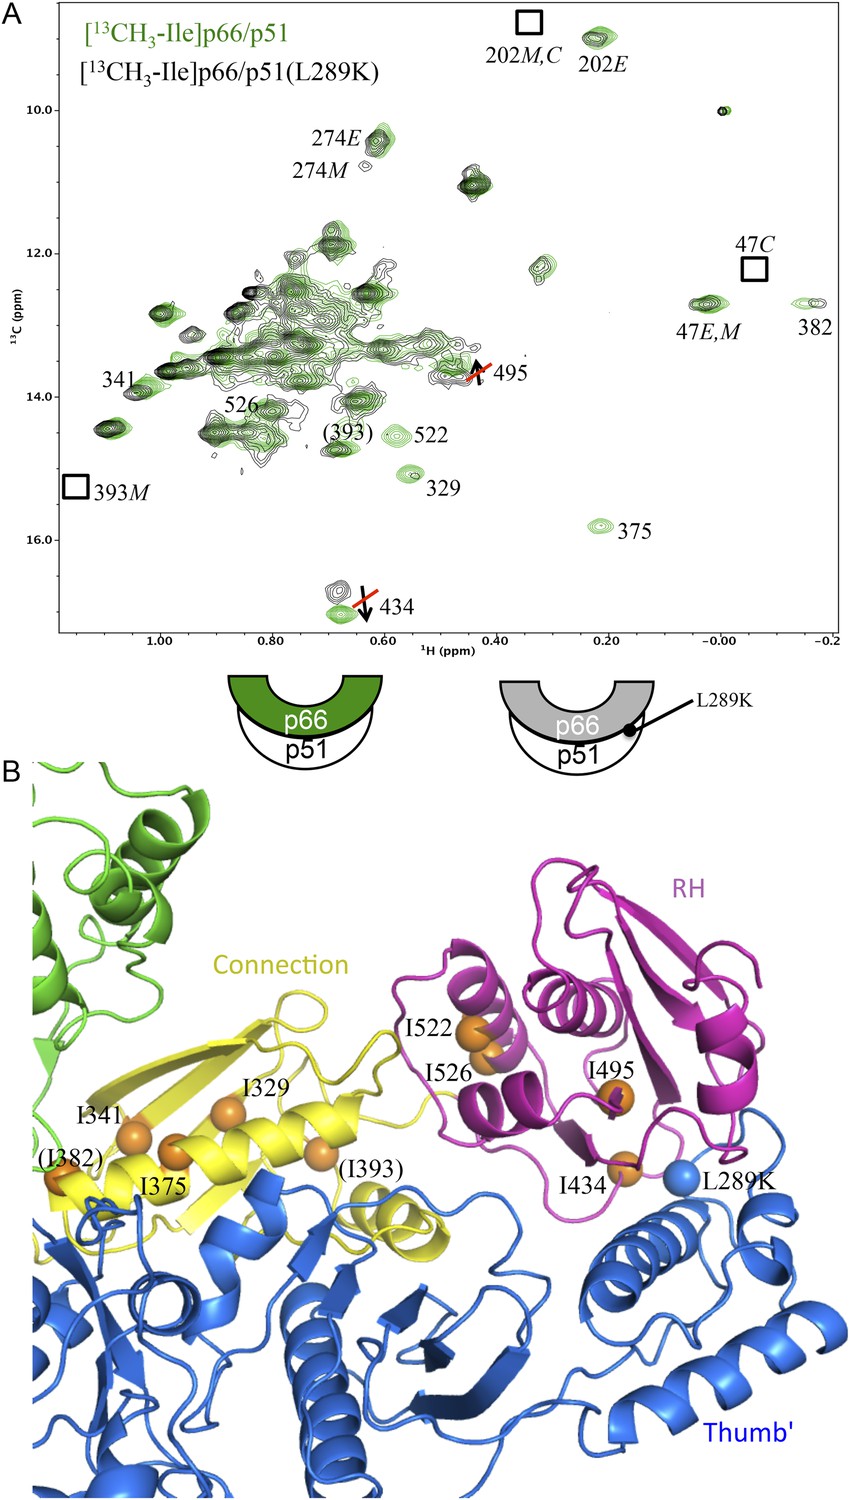
Effect of a p51 thumb' domain mutation on the Ile methyl resonances in the p66 subunit of RT.
(A) Overlay of the 1H-13C HMQC spectrum of [13CH3-Ile]p66/p51 (green) and [13CH3-Ile]p66/p51(L289K) (black). Most of the features of the spectrum are preserved, consistent with the formation of a stable heterodimer. The labeling pattern corresponds to the color-coding in the cartoons below the spectrum. (B) Ribbon diagram illustrating the relative position of the mutated residue (blue sphere) and perturbed resonances in the RH and connection domains of p66 (orange spheres). Color coding: p51 (blue); p66 RH domain (magenta); p66 connection domain (yellow), p66 fingers/palm and thumb domains (green).
Figure 7 with 1 supplement
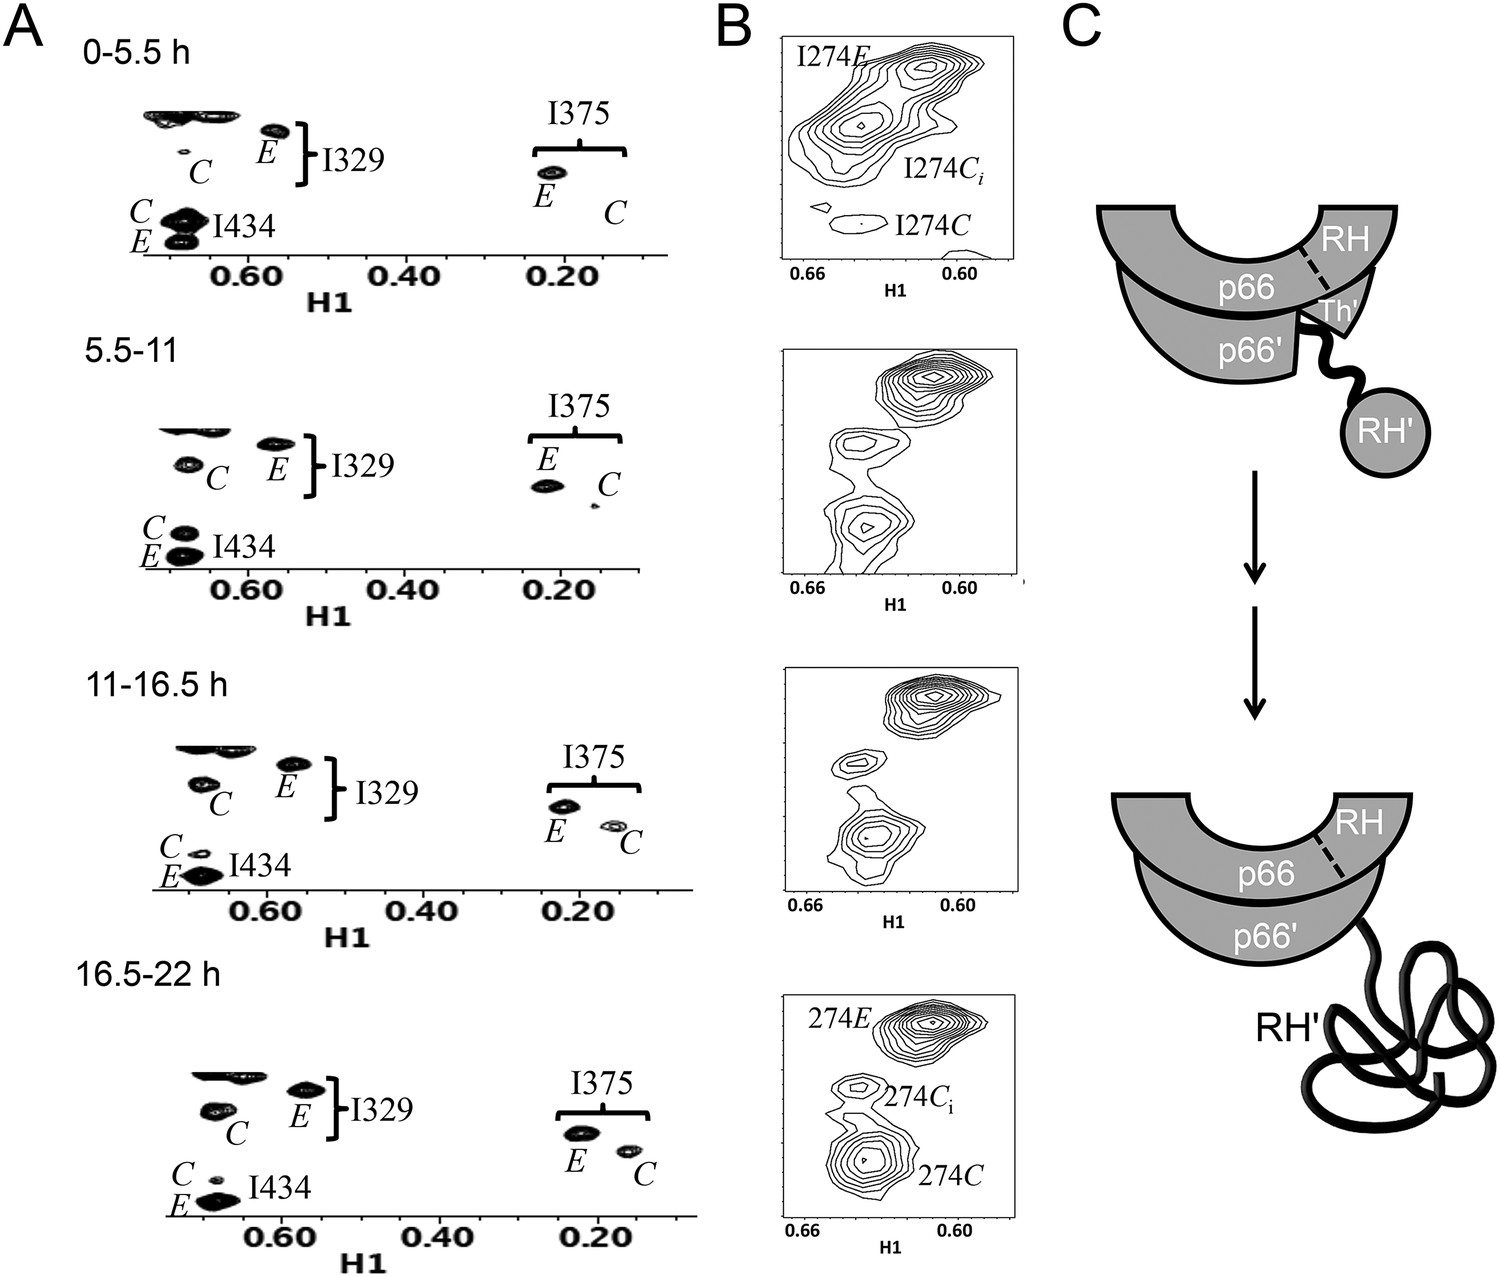
Slow time-dependent changes of connection and RH domain resonances.
(A) An expanded spectral region of the [13CH3-Ile]p66/[13CH3-Ile]p66' homodimer obtained at successive time intervals after introduction of conditions favoring dimerization. The selected region includes connection and connection' Ile329 and Ile375 resonances as well as RH and RH' Ile434 resonances. (B) The time-dependent changes of the Ile274 resonances during the same time period. (C) A schematic diagram illustrating the conformational changes in the connection' and RH' domains that are related to the observed resonance changes. The labeled subunits are indicated in gray. The RH, RH', and Th' labels in the cartoon indicate the RNase H domain in the p66 subunit, the RNase H domain in the p66' subunit, and the Thumb' domain in the p66' subunit. Data supporting the assignments of the connection and connection' domain Ile329 and Ile375 resonances are presented in Figure 5—figure supplements 4, 13, 14, and 15. Dimerization was initiated at t = 0, and the spectra were obtained at 35°C.
Figure 7—figure supplement 1
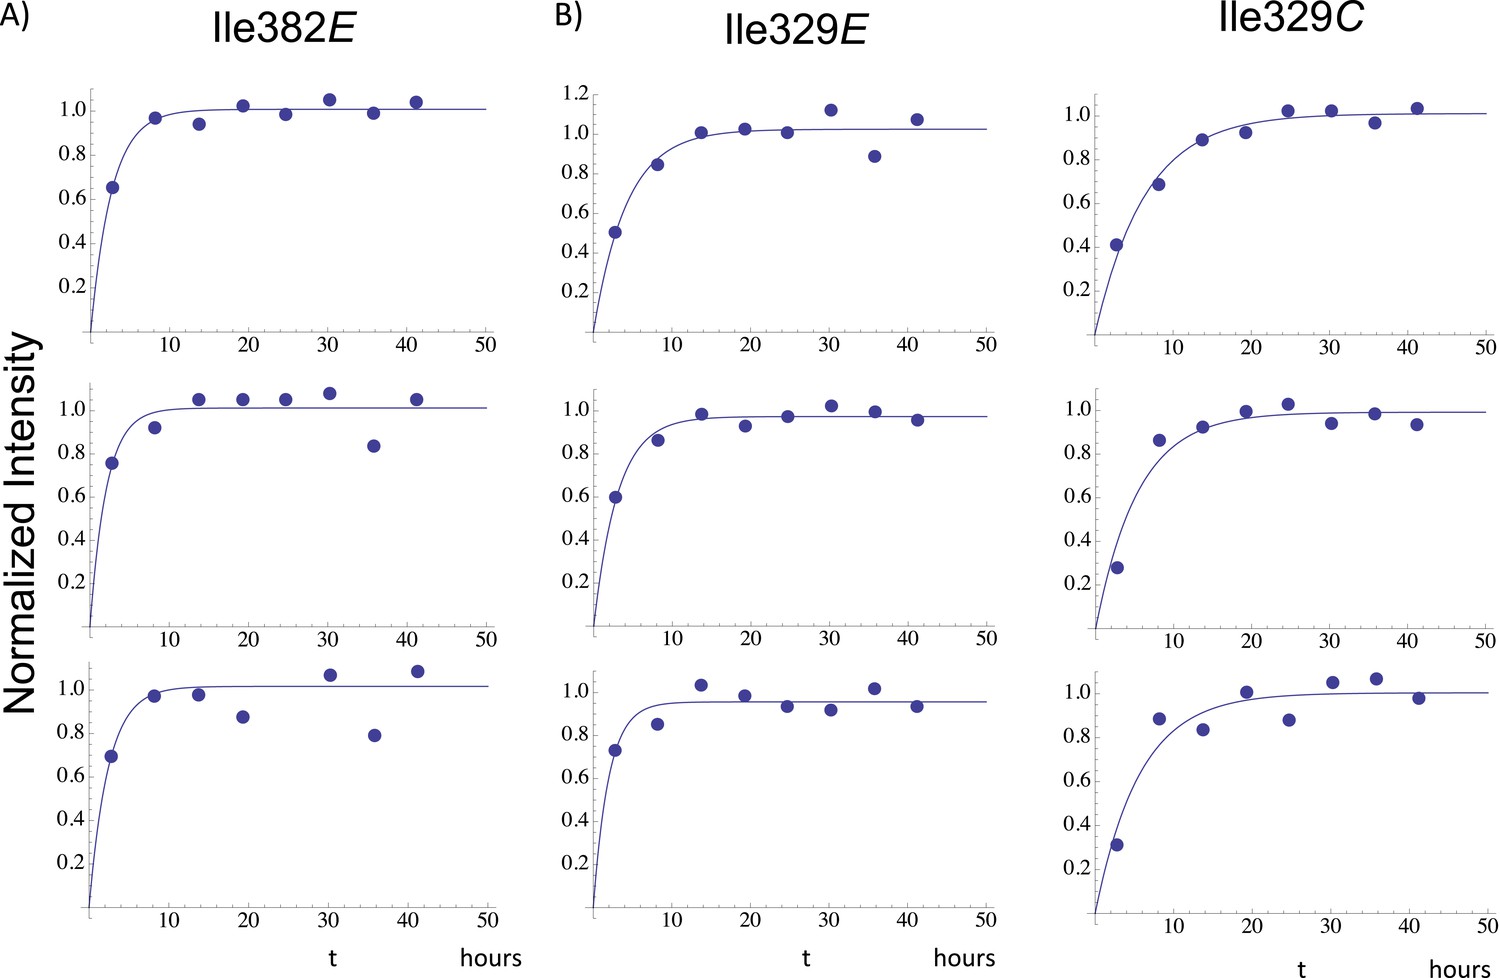
Illustrative fits of time-dependent intensity data.
Illustrative fits of the time-dependent intensities of Ile382E (panel A) and Ile329E and Ile329C (panel B) in the homodimerization study are shown. Since we have observed no stable monomer in the extended (E) conformation, the time-dependent intensity of the Ile382E resonance arises from the active (extended) p66 subunit of the dimer and is indicative of time-dependent dimerization. The Ile382 time constant of 2.4 hr appears to be the earliest dimerization event that can be monitored by NMR. Since this value is significantly below the time required for accumulation of the NMR spectrum, the value is subject to substantial error, and presumably represents an upper limit for the actual time constant describing interface formation. As in the example of Ile382E, the Ile329E intensity also builds up on a short time scale (Table 1), corresponding to time constants that are shorter than the NMR accumulation period. Thus, the connection domain in the p66E subunit appears to become conformationally defined at a relatively early time after dimerization. The intensity of the Ile329C resonance builds up on a slower time scale, with mean time constant of ∼ 5.9 hr (Table 1) similar to the monomer-corrected value of 6.5 hr for RH' unfolding previously reported.
Figure 8 with 4 supplements

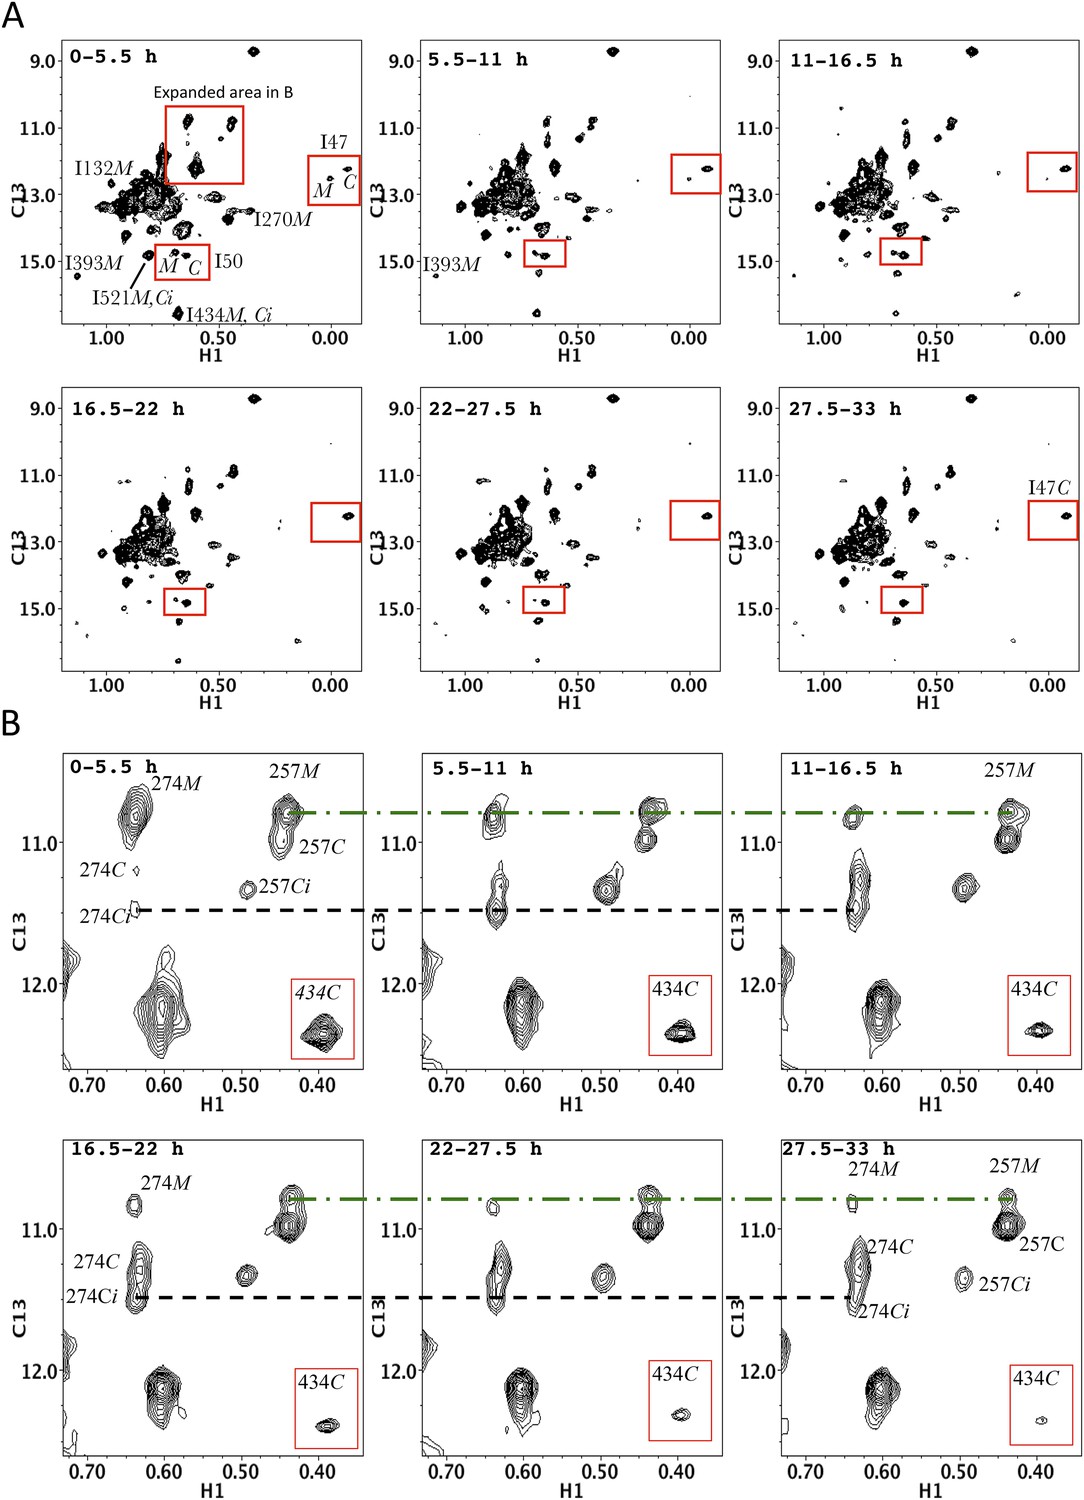
Dimerization of [13CH3-Ile]p66∆PL with unlabeled p66.
Time-dependent changes are shown for a region of the 1H-13C HMQC spectrum covering a similar spectral region to that shown in Figure 7. All resonances are attributed to the M or C species; the labeled Ile50M resonance as well as the Ile434C and 521C resonances arising from the labeled RH' decrease as the RH' domain unfolds, while the connection' 329C and 375C resonances increase as the connection' domain matures. The schematic diagram at the bottom illustrates the subunit-selective labeling pattern and the proposed conformational changes that are inferred from the behavior of the resonances. The labeled subunit is indicated in gray. Each spectrum corresponds to a 5.5-hr accumulation period at the time periods indicated. Dimerization was initiated at t = 0, and the spectra were obtained at 35°C.
Figure 8—figure supplement 1
Time-dependent HMQC spectra for dimerization of p66∆PL with excess, unlabeled p66 showing all Ile δ-methyl resonances.
(A) Time-dependent spectra for [13CH3-Ile]p66∆PL with a twofold excess of unlabeled p66 after dimerization conditions were initiated. The D2O buffer contained 25 mM Tris-DCl-d11, pD 7.5, 100 mM KCl, 0.02% NaN3. Spectra were obtained on an INOVA 800 at 35 °C. Monomer resonances attributed to Ile50M and to Ile132M that cannot be unequivocally assigned in the homodimerization study can be identified in this study. (B) Expanded region 1 showing the details of the labeled thumb' resonances. The inset illustrates the simultaneous decay of the RH' resonance arising from Ile434.
Figure 8—figure supplement 2
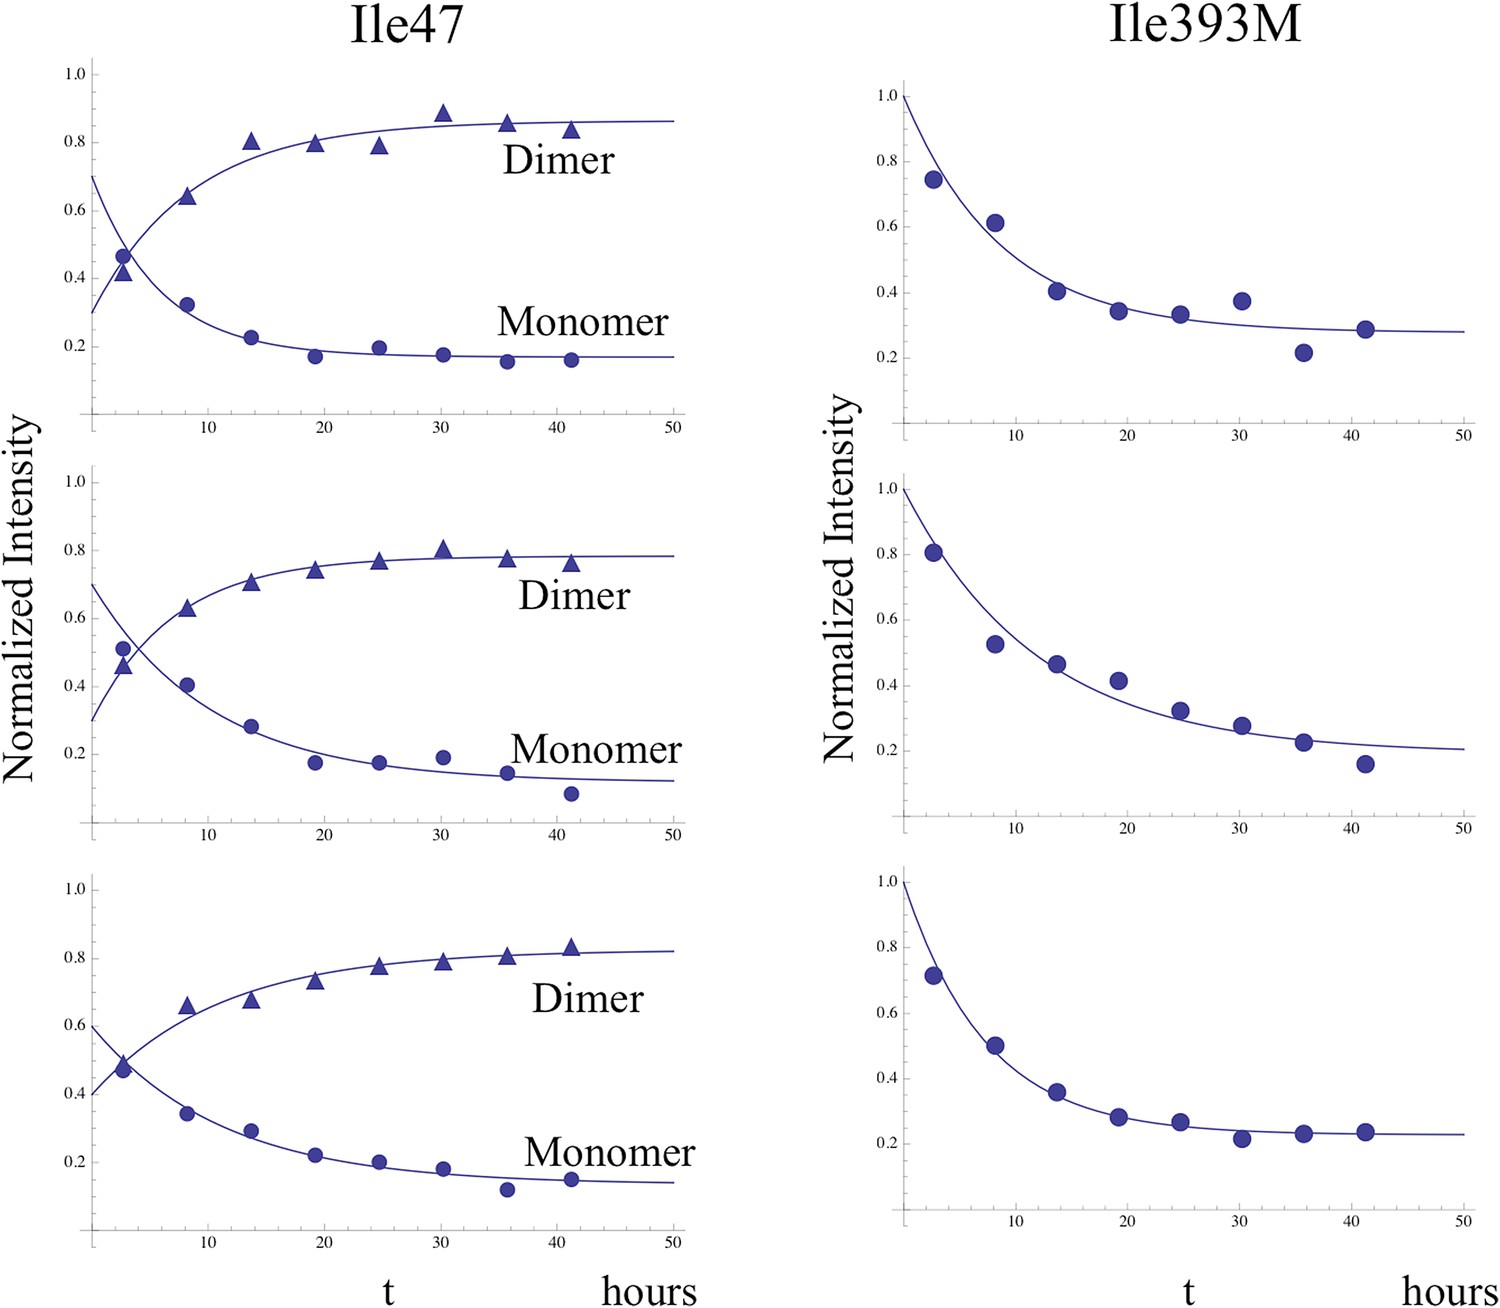
Time-dependent intensity data for monomer decay.
Illustrative examples showing the analysis of the time-dependent monomer decay for the Ile47 and Ile393 resonances for the dimerization study illustrated in Figure 8 and two similar studies. In the case of Ile47, decay of the monomer resonance was accompanied by growth of the dimer peak, corresponding to the C conformation, and the sum of the initial Ile47M and Ile47C resonance intensities was normalized to 1.0. The behavior of the Ile47 resonances indicates that an initial, more rapid dimerization process was followed by a slower process with time constant ∼ 9 hr (see Table 2).
Figure 8—figure supplement 3
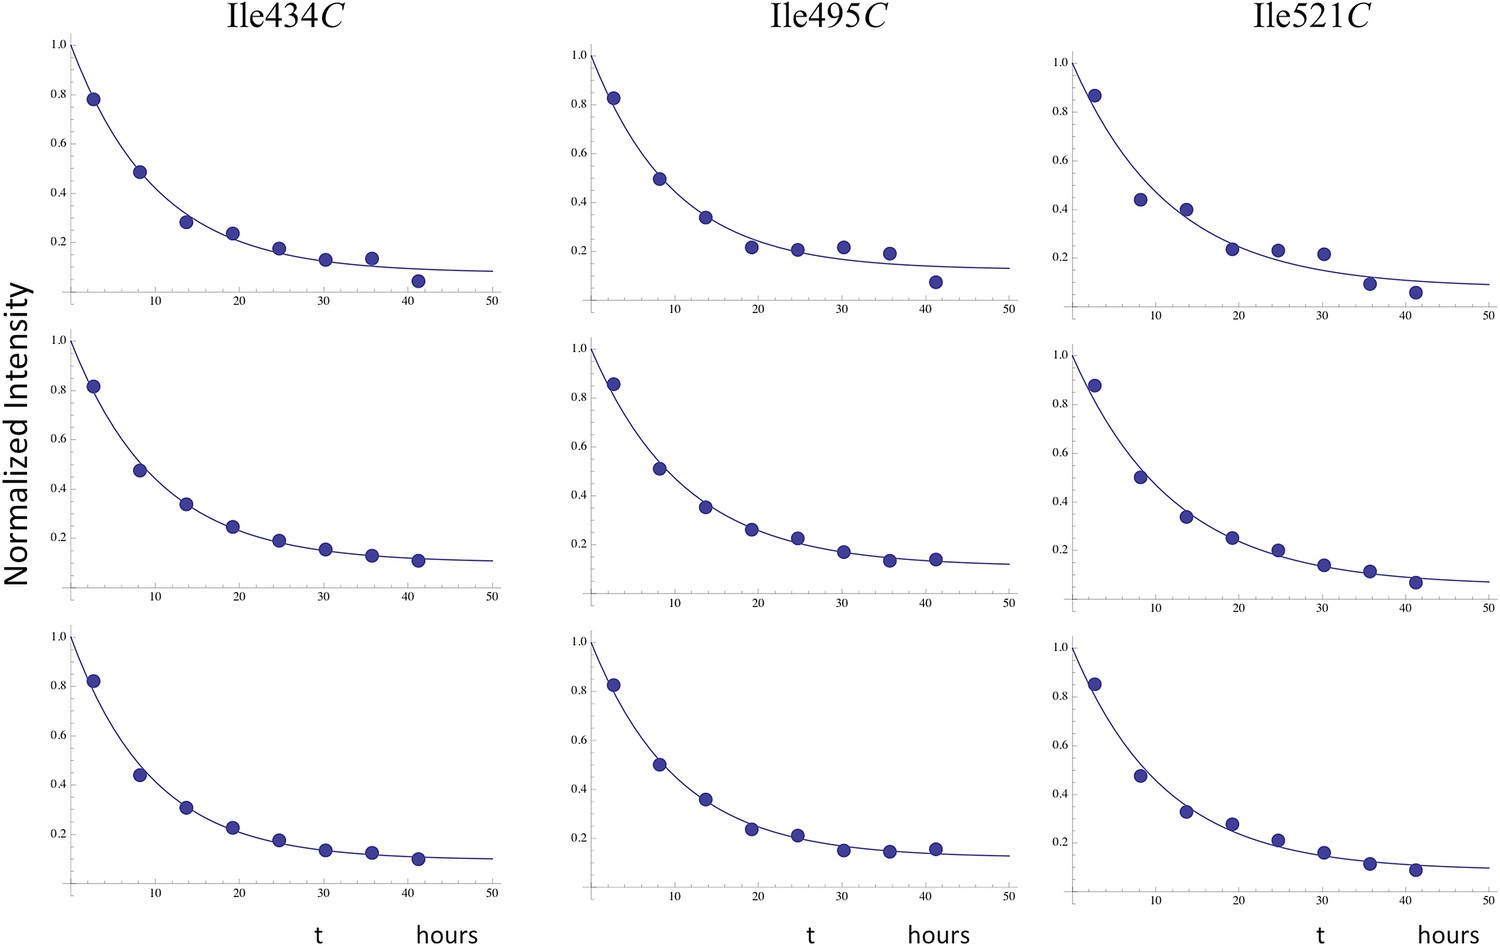
Time-dependent decay of RH' resonances.
Illustrative fits of the time-dependent intensity data for the resolved RH' resonances assigned to Ile434C, Ile495C, and Ile521C. The fits allowed for asymptotic monomer resonance intensities greater than 0, and the observed decay generally corresponded to ∼ 90% of the total intensity. The time constants were all in close agreement with a mean value of 10.7 hr (Table 2).
Figure 8—figure supplement 4
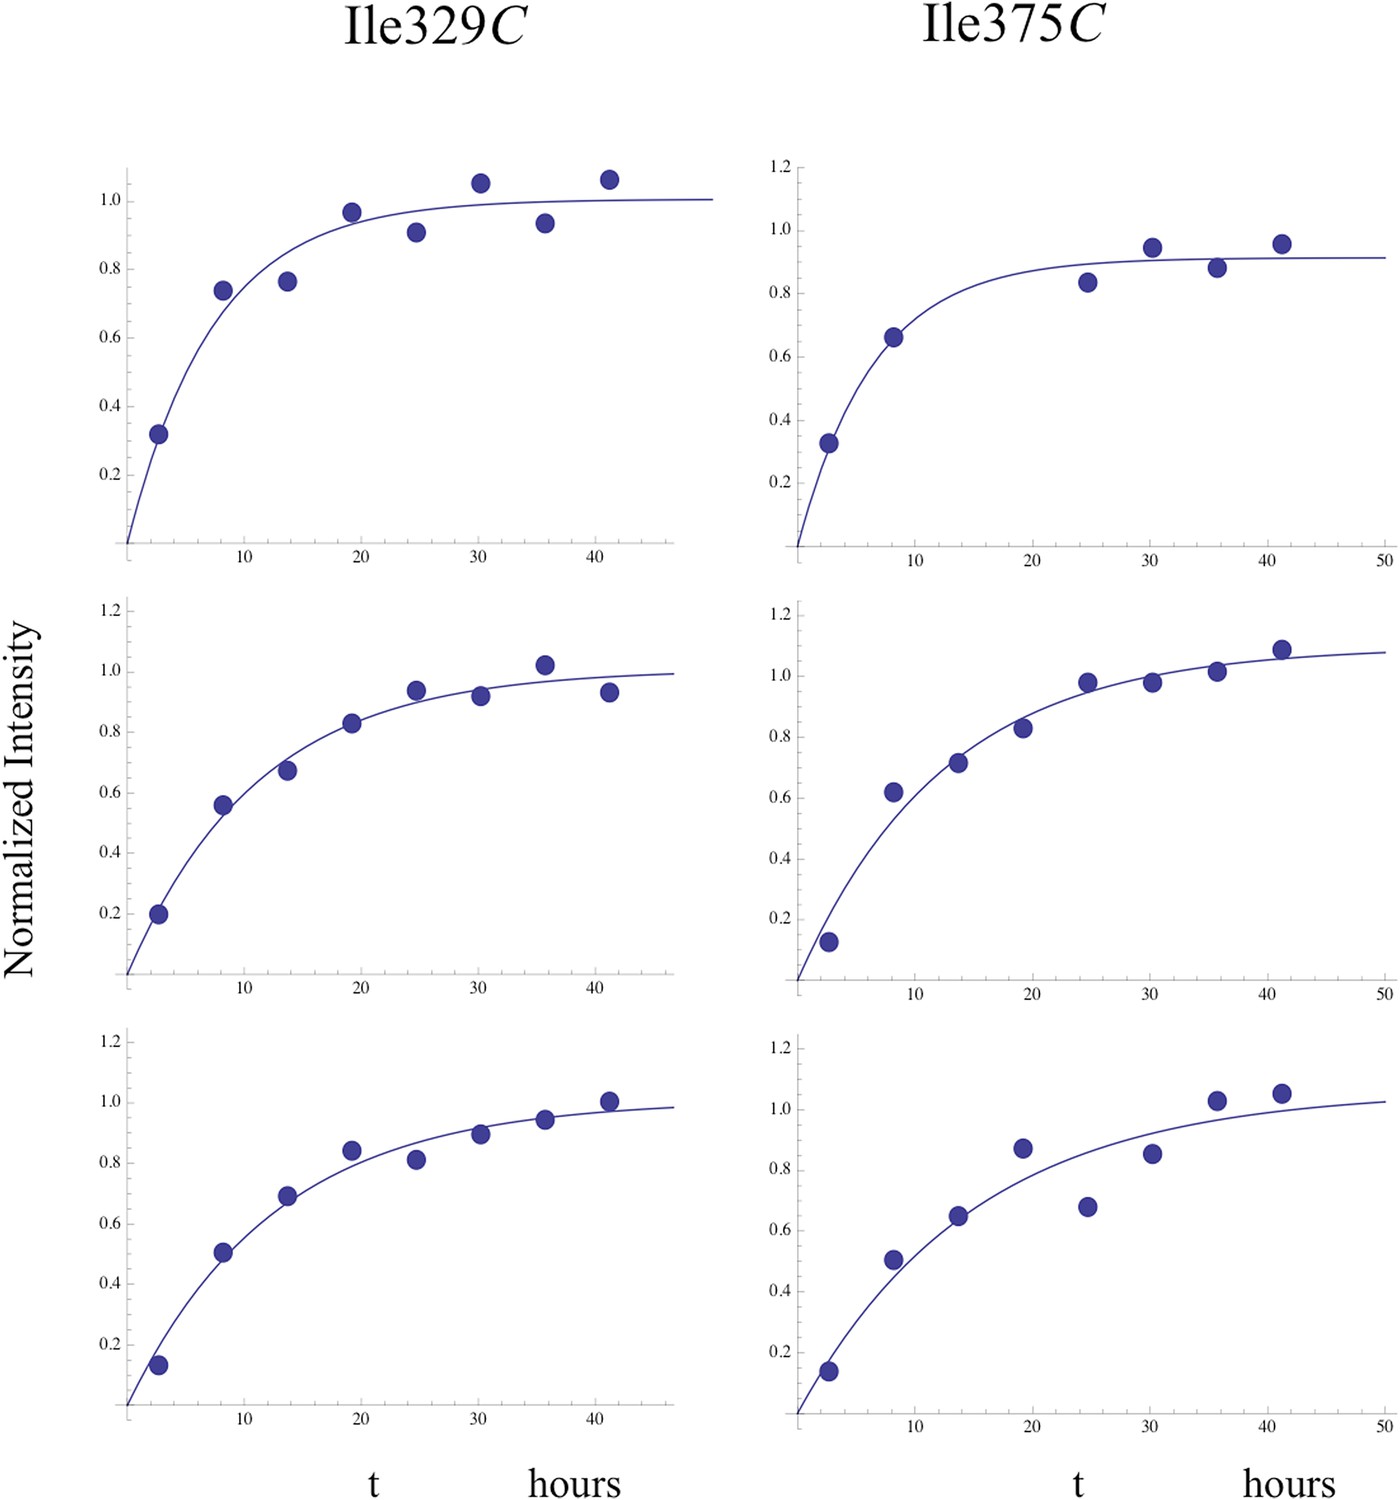
Time-dependent growth of connection' resonances.
Fits of the time-dependent intensity data for the resolved Ile329C and Ile375C resonances in the study of the dimerization of [13CH3-Ile]p66∆PL with a twofold excess of unlabeled p66. The Ile375C resonance is significantly weaker than Ile329, so that the sample to sample variation was generally greater.
Figure 9
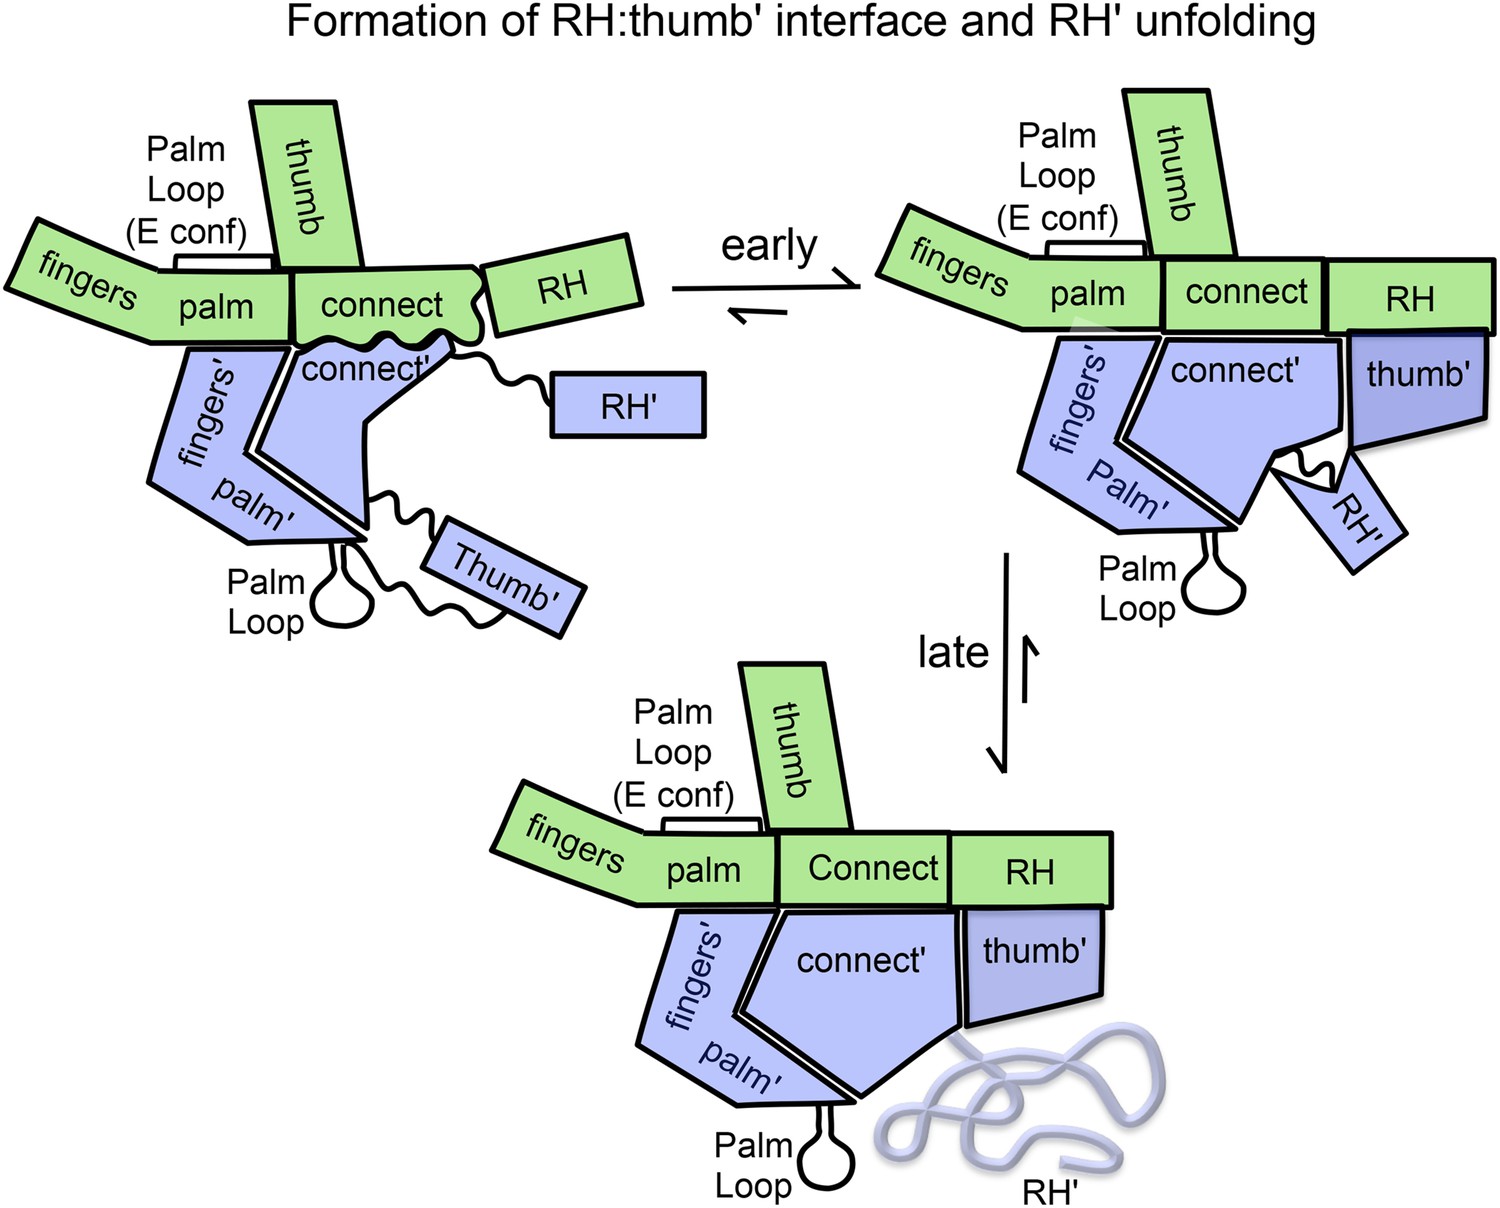
Schematic illustration of the maturation of the p66/p66' homodimer.
This figure illustrates the more rapid and the slower time-dependent changes occurring subsequent to initial isomerization/dimerization. The subunit conformations are color coded as in Figure 1.
Tables
Table 1
Apparent time constants—homodimerization study
| Residue | Mean ± S.E.* |
|---|---|
| 329E | 3.3 ± 0.5 |
| 375E | 2.6 ± 0.7 |
| 382E | 2.4 ± 0.2 |
| 329C | 5.8 ± 0.3 |
| 375Cb | 5.9 |
| 274C | 8.9 ± 0.6 |
-
*
Fitted parameters are averages ±standard error for three separate studies. bFor Ile375C, one data set was obscured by a spectral artifact, so the tabulated value is the average of two measurements. Illustrative data fits of individual data sets are shown in Figure 7—figure supplement 1.
Table 2
Apparent time constants—p66 + [13CH3-Ile]p66∆PL
| Residue | Mean ± S.E.* |
|---|---|
| 393M | 9.3 ± 1.4 |
| 274M/Ci | 8.4 ± 0.5 |
| 47M | 9.1 ± 1.7 |
| Mean monomer decay TC | 9.0 ± 0.6 |
| 47C | 8.8 ± 1.2 |
| 434C† | 10.0 ± 0.2 |
| 495C† | 10.4 ± 0.4 |
| 521C† | 11.6 ± 0.3 |
| Mean RH resonance decay TC | 10.7 ± 0.3 |
| 329C | 10.3 ± 1.6 |
| 375C | 11.2 ± 2.5 |
| Mean connection' growth TC | 10.8 ± 1.3 |
-
*
Errors determined as in Table 1. Each value represents the mean of three separate studies.
-
†
Resonances 434C, 495C, and 521C also contain contributions from overlapping monomer peaks, and no attempt has been made to correct for this overlap. Similarly, the resonance labeled 274M/Ci contains contributions from both the monomer and the initially formed dimer, so that the decay results from both dimerization and conformational maturation of the dimer. Illustrative data fits are shown in Figure 8—figure supplements 2–4.
-
RH: ribonuclease H; TC = time constant.
Download links
A two-part list of links to download the article, or parts of the article, in various formats.
Downloads (link to download the article as PDF)
Open citations (links to open the citations from this article in various online reference manager services)
Cite this article (links to download the citations from this article in formats compatible with various reference manager tools)
Asymmetric conformational maturation of HIV-1 reverse transcriptase
eLife 4:e06359.
https://doi.org/10.7554/eLife.06359


