Nur77 prevents excessive osteoclastogenesis by inducing ubiquitin ligase Cbl-b to mediate NFATc1 self-limitation
- University of Texas Southwestern Medical Center, United States
Figures
Figure 1
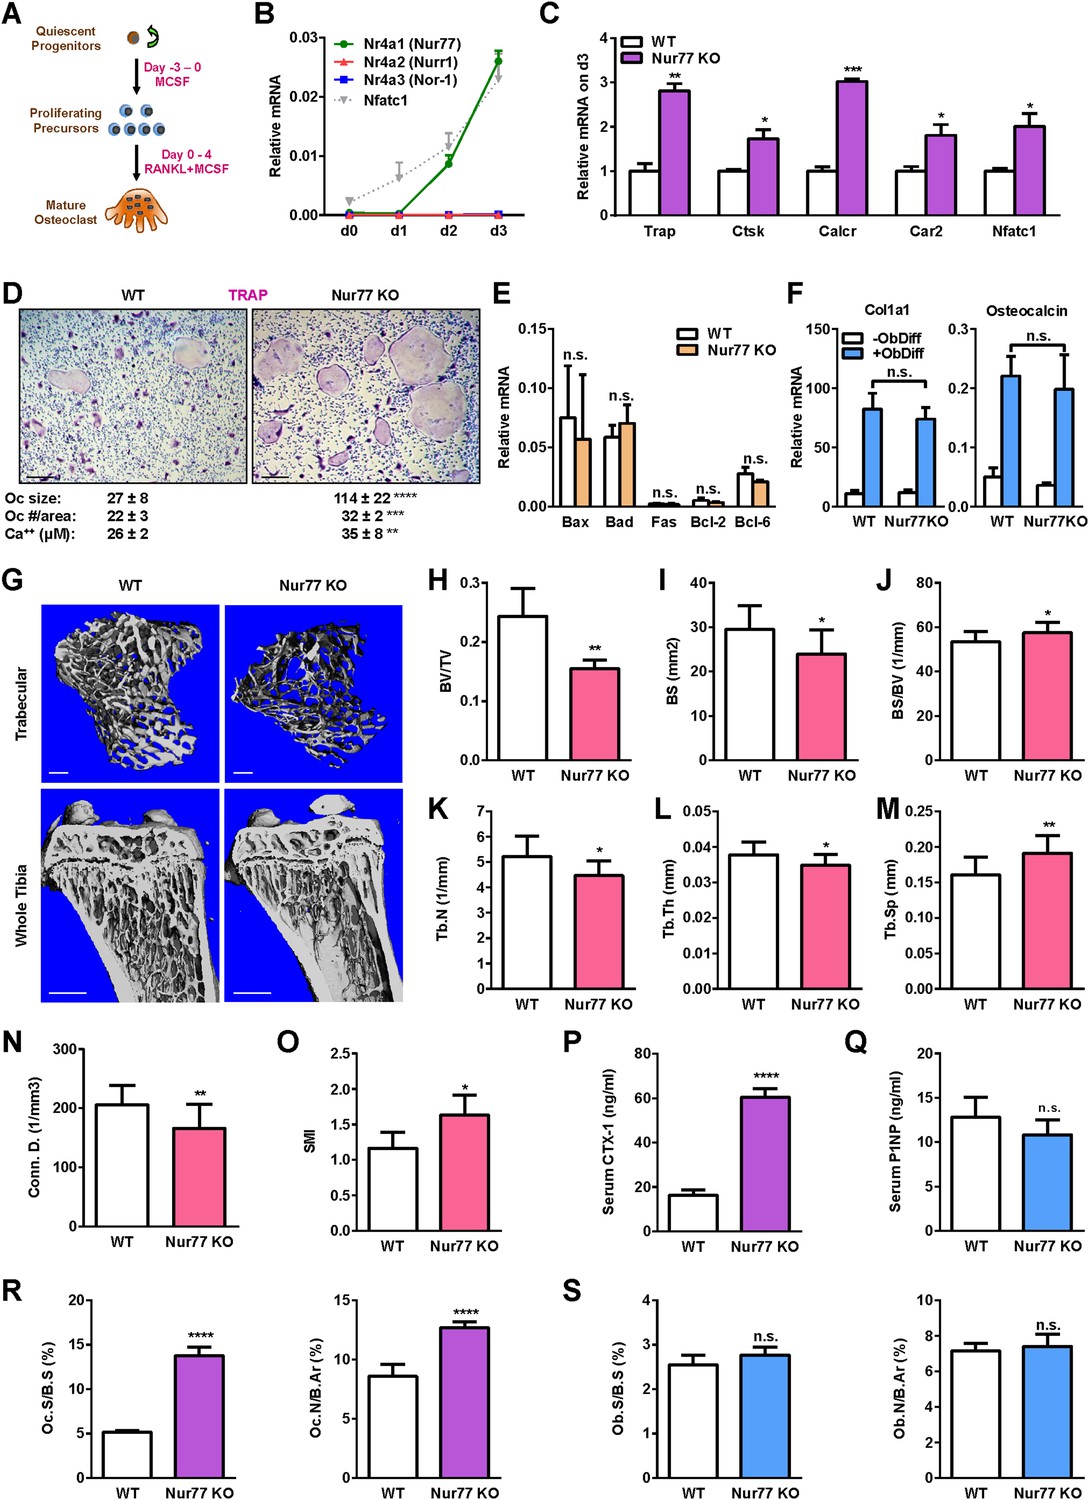
Nur77 deletion increases osteoclastogenesis and bone resorption.
(A) A schematic diagram of ex vivo bone marrow osteoclast differentiation. (B) Expression of Nur77, Nurr1, and Nor-1 encoding genes (Nr4a1, Nr4a1, Nr4a3) during a time course of RANKL-induced osteoclast differentiation (n = 3 mice). Nfatc1 mRNA level was similar to Nr4a1 mRNA level on day 2–3. (C–D) Osteoclast differentiation was enhanced in Nur77 KO cultures compared to WT control cultures. (C) Expression of osteoclast differentiation markers on day 3 (n = 4 mice). (D) Representative images of the TRAP-stained osteoclast differentiation cultures. Mature osteoclasts were identified as multinucleated TRAP+ (purple) cells on day 9. Scale bar, 25 μm. Quantification of osteoclast size, osteoclast number per area, and osteoclast-resorptive activity by calcium release from bone plate to culture medium is shown (n = 4 mice in triplicate cultures). Oc, osteoclast. (E) Osteoclast apoptosis was unaltered, quantified by the expression of apoptosis genes on day 9 of osteoclast differentiation cultures (n = 4). (F) Osteoblast differentiation was unaltered in Nur77 KO cultures, measured by the expression of osteoblast markers (n = 4). (G–O) Nur77 KO mice exhibited bone loss. Tibiae from Nur77 KO mice or WT littermate controls (3 month old, male, n = 6) were analyzed by μCT. (G) Representative images of the trabecular bone of the tibial metaphysis (top) (scale bar, 10 μm) and the entire proximal tibia (bottom) (scale bar, 1 mm). (H–O) Quantification of trabecular bone volume and architecture. (H) BV/TV, bone volume/tissue volume ratio. (I) BS, bone surface. (J) BS/BV, bone surface/bone volume ratio. (K) Tb.N, trabecular number. (L) Tb.Th, trabecular thickness. (M) Tb.Sp, trabecular separation. (N) Conn.D., connectivity density. (O) SMI, structure model index. (P) Serum CTX-1 bone resorption marker was increased (3 month old, male, n = 6). (Q) Serum P1NP bone formation marker was unaltered (3 month old, male, n = 6). (R–S) Bone histomorphometry (3-month-old, male, n = 6). (R) Quantification of osteoclast surface (Oc.S/B.S) and osteoclast number (Oc.N/B.Ar). (S) Quantification of osteoblast surface (Ob.S/B.S) and osteoblast number (Ob.N/B.Ar). B.S, bone surface; B.Ar, bone area. Error bars, SD.
Figure 2
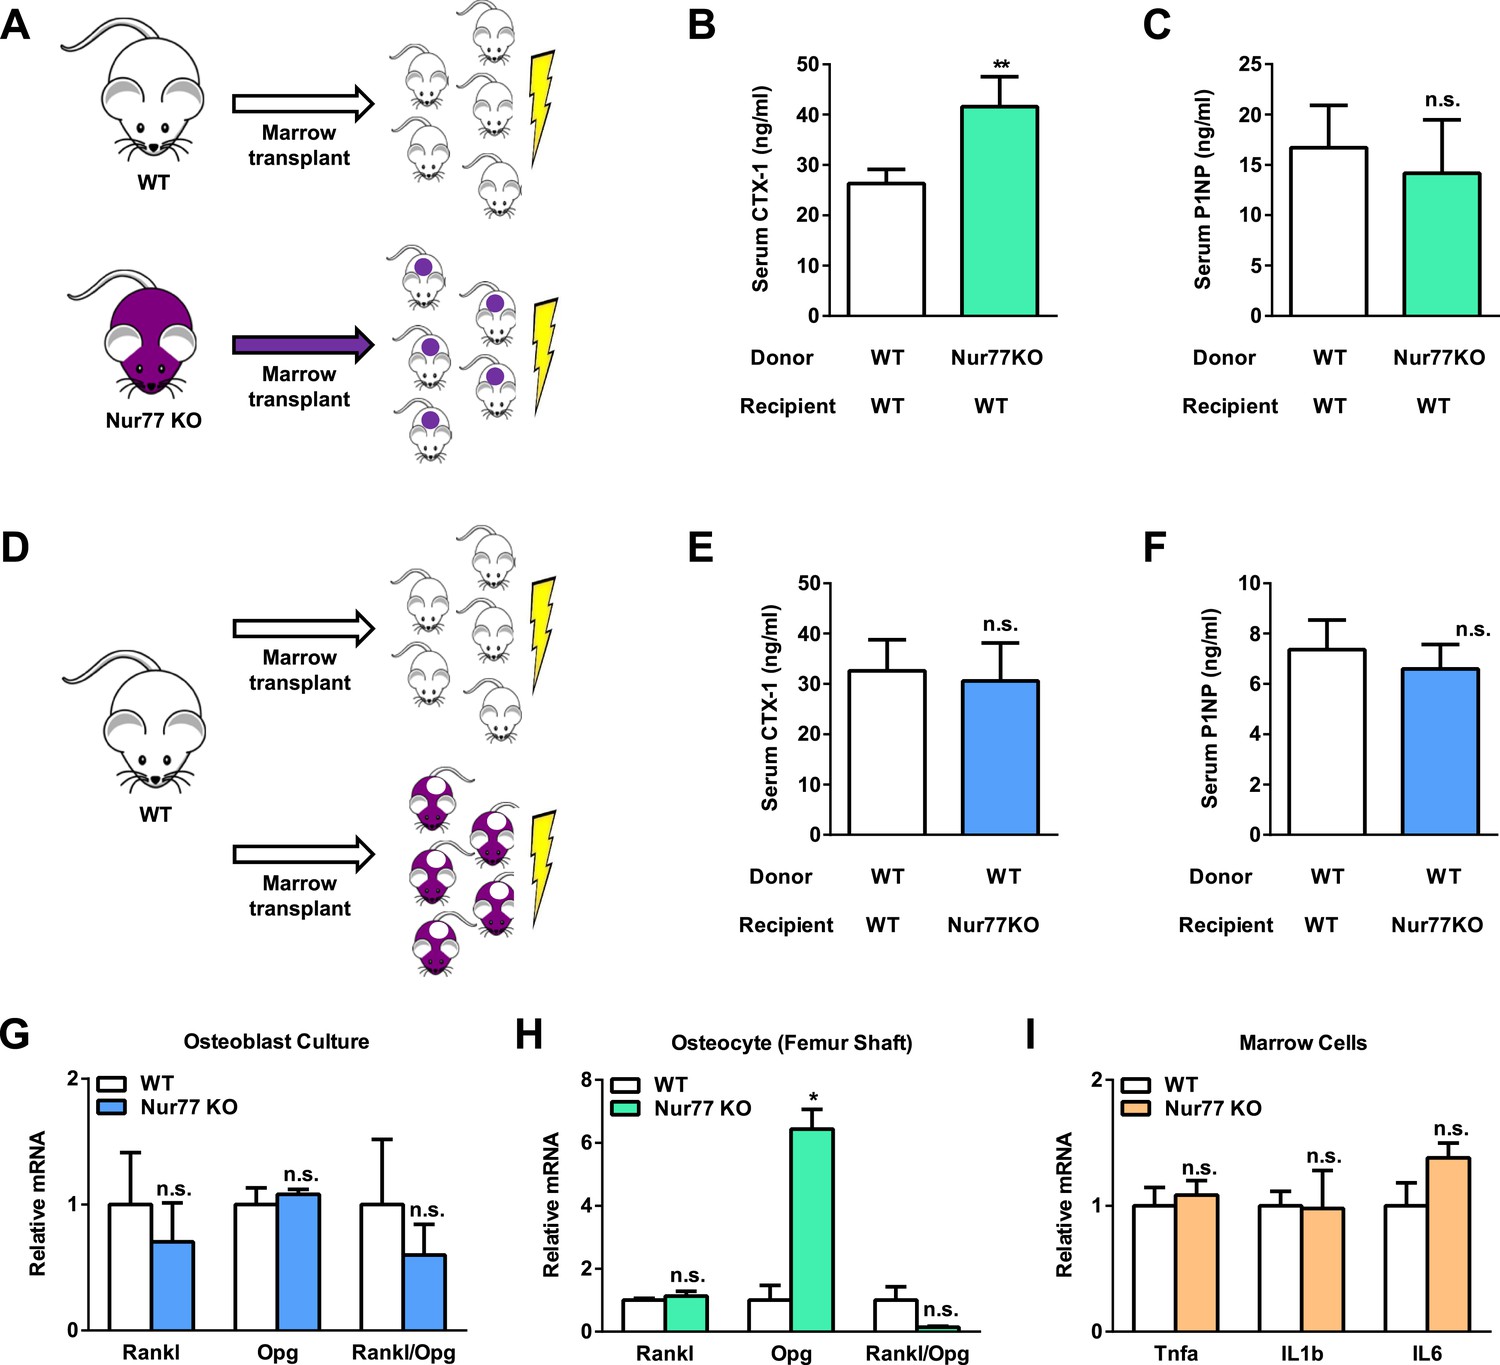
Nur77 regulation of bone resorption is intrinsic to the hematopoietic lineage.
(A–F) Bone marrow transplantation. Bone marrow cells from 2-month-old male donor mice were transplanted into 2-month-old irradiated male recipient male mice (n = 5) and analyzed 3 months later at 5 month old. (A–C) Transplantation of Nur77 KO donor bone marrow cells into WT recipients conferred elevated bone resorption compared to WT control donor bone marrow cells. (A) A schematic diagram. (B) Serum CTX-1. (C) Serum P1NP. (D–F) Transplantation of WT donor bone marrow cells into Nur77 KO recipients rescued the bone resorption to a level similar to the WT control recipients. (D) A schematic diagram. (E) Serum CTX-1. (F) Serum P1NP. (G) Expression of RANKL and OPG, as well as RANKL/OPG ratio, in Nur77 KO ex vivo osteoblast differentiation cultures compared to WT control cultures (n = 3). (H) Expression of Rankl and Opg, as well as Rankl/Opg ratio, in osteocytes from femur shaft in Nur77 KO mice compared to WT control mice (n = 3). (I) Expression of pro-osteoclastogenic cytokines in bone marrow cells from Nur77 KO mice compared to WT control mice (n = 3). Error bars, SD.
Figure 3
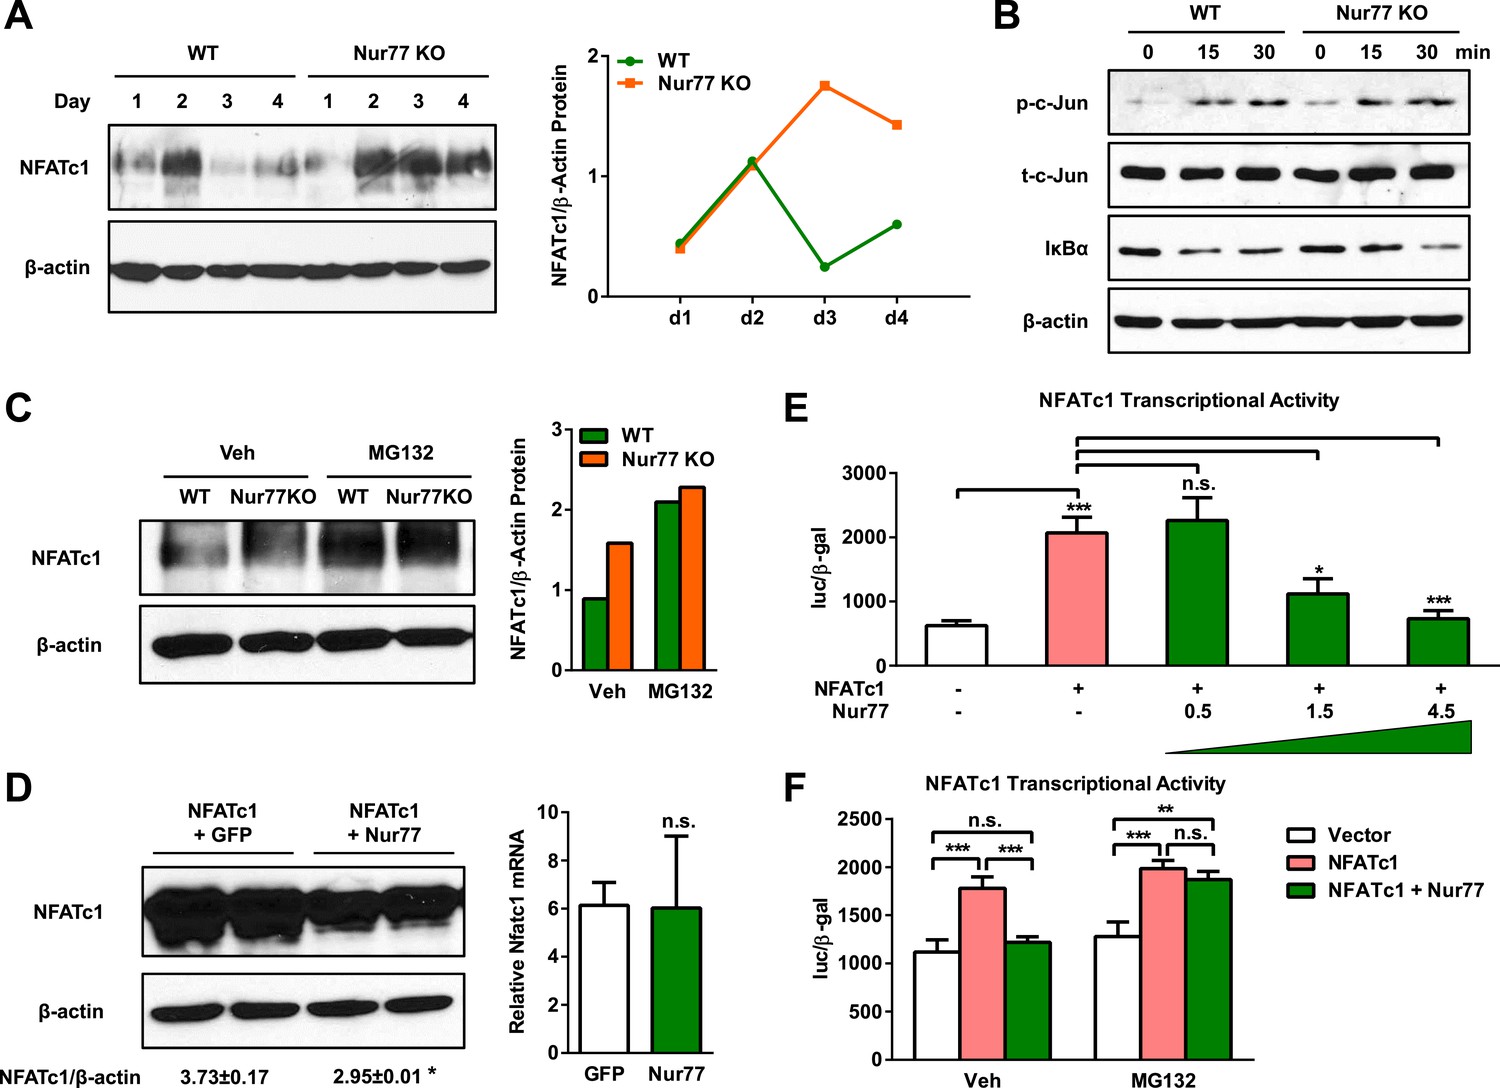
Nur77 inhibits osteoclast differentiation by promoting NFATc1 degradation.
(A) NFATc1 protein levels during a time course of osteoclast differentiation from the bone marrow cells of Nur77 KO mice or WT control mice. Left, representative western blot image. Right, quantification of NFATc1/β-actin ratio. (B) c-Jun phosphorylation and IκBα degradation post RANKL treatment in osteoclast differentiation cultures from the bone marrow cells of Nur77 KO mice or WT control mice. P-c-Jun, phosphorylated c-Jun; t-c-Jun, total-c-Jun. (C) Effects of MG132 on NFATc1 protein levels in Nur77 KO or WT bone marrow osteoclast differentiation cultures. Cells were treated with 25 μM MG132 for 6 hr 3 days after RANKL stimulation. Left, representative western blot image. Right, quantification of NFATc1/β-actin ratio. (D) Effects of Nur77 over-expression on NFATc1 protein and mRNA levels. HEK293 cells were transfected with NFATc1, together with either Flag-Nur77 or GFP control. Left, representative western blot image with quantification of NFATc1/β-actin ratio. Right, relative Nfatc1 mRNA. (E) Effects of Nur77 over-expression on NFATc1 transcriptional output (n = 3). HEK293 cells were transfected with NFATc1 and its luciferase reporter, together with increasing amount of Nur77. (F) MG132 abolished the effects of Nur77 over-expression on NFATc1 transcriptional output (n = 3). HEK293 cells were treated with MG132 (25 μM) 1 day after transfection for 6 hr before harvesting. All data are representative of at least three experiments. Error bars, SD.
Figure 4
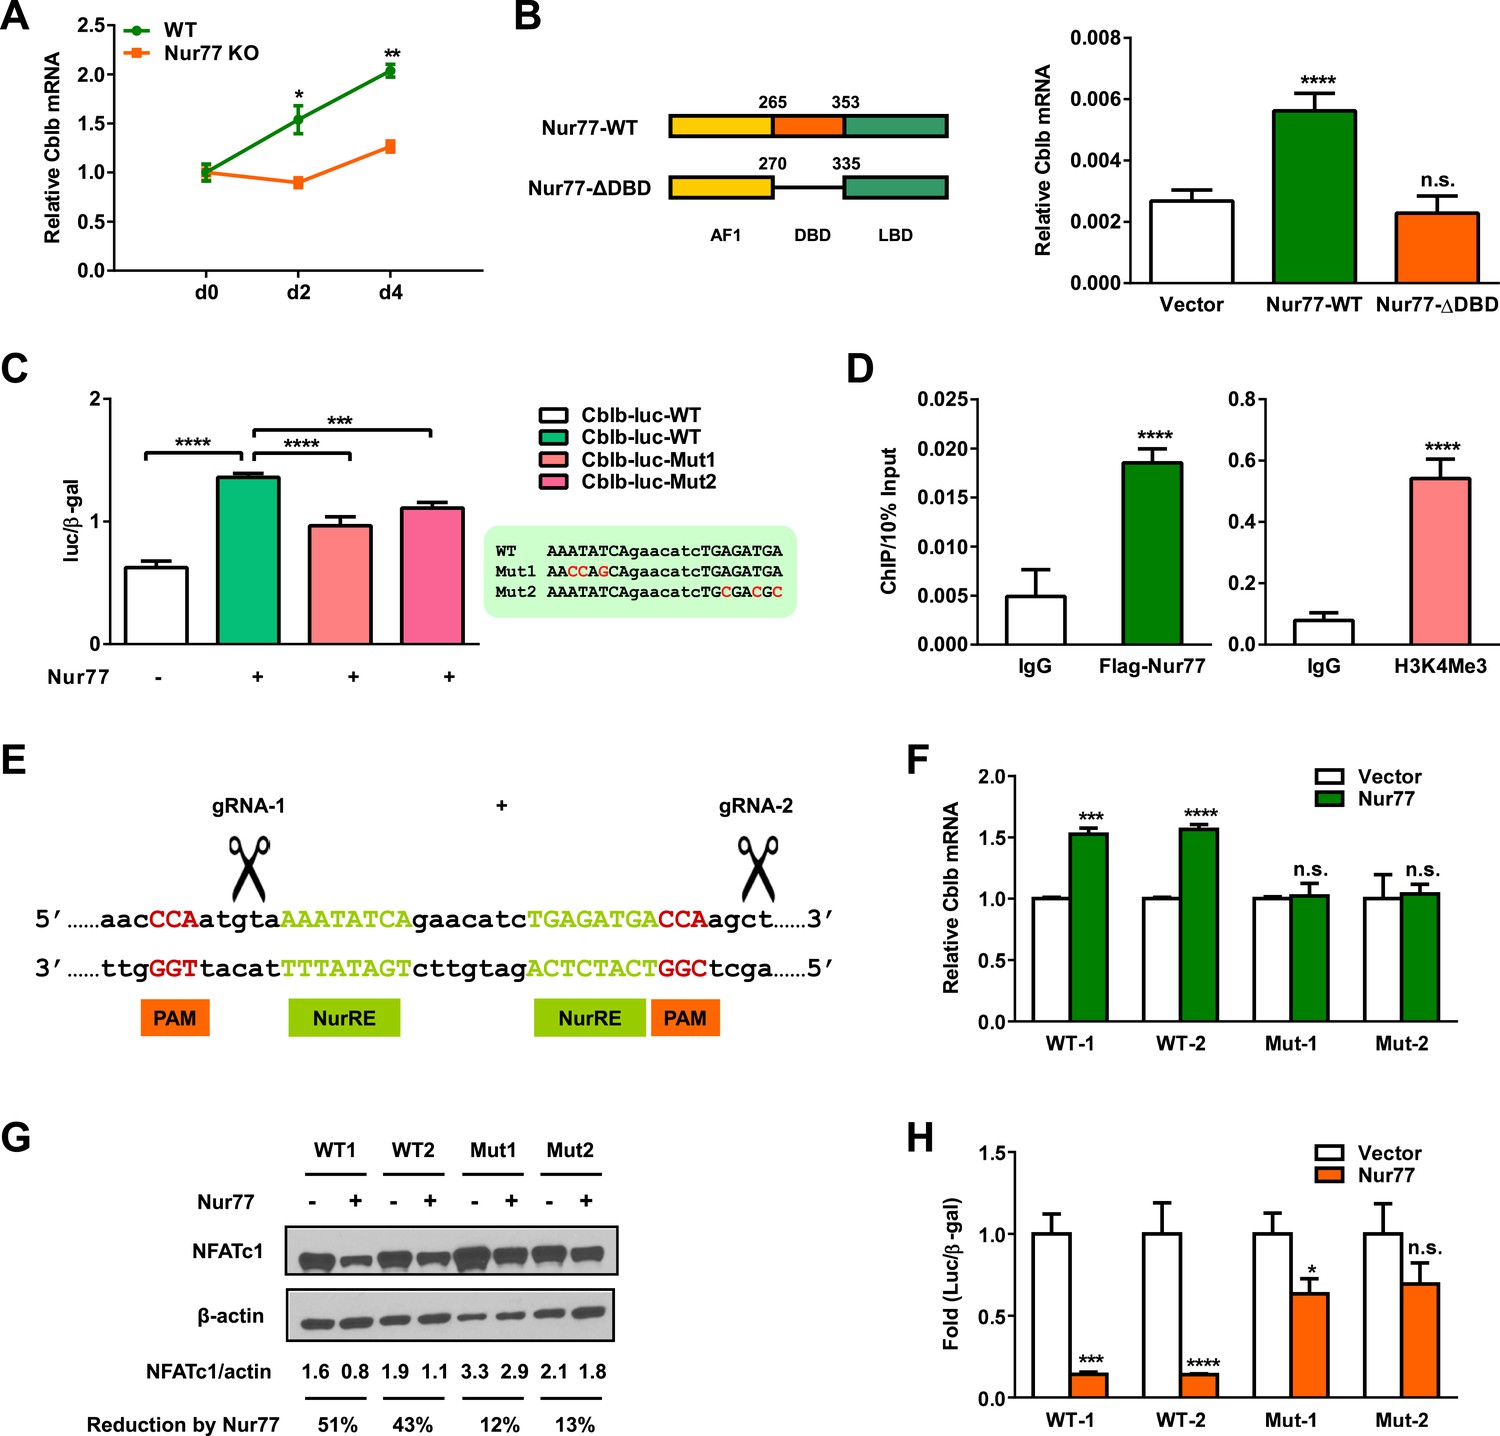
Nur77 transcriptionally up-regulates E3 ligase Cbl-b.
(A) Cblb expression during a time course of osteoclast differentiation from the bone marrow cells of Nur77 KO mice or WT control mice (n = 3). (B) Nur77 over-expression increased Cblb mRNA in a DNA-binding-dependent manner. HEK293 cells were transfected with vector control, WT Nur77, or a mutant Nur77 with a deletion of the DNA binding domain (DBD) (n = 3). (C) Nur77 activated Cbl-b promoter via NurRE. HEK293 cells were transfected with Nur77, together with a luciferase vector control or a luciferase reporter driven by 1 Kb Cbl-b promoter containing either a WT NurRE or a mutant NurRE (n = 3). Inset shows the mutations in the two mutant reporters. (D) ChIP assay of Nur77 binding and H3K4me3 levels at the endogenous Cbl-b promoter. HEK293 cells were transfected with Flag-Nur77, Nur77 binding were detected with anti-Flag antibody and compared with IgG control antibody (n = 3). (E–H) CRISPR/Cas9 deletion of NurRE in the endogenous Cbl-b promoter abolished Nur77 regulation of Cbl-b and NFATc1. (E) A schematic representation of CRISPR/Cas9 gRNAs and their target locus in the Cbl-b promoter. (F–H) Effects of Nur77 over-expression on Cbl-b mRNA (F) (n = 4), NFATc1 protein (G), and NFATc1 transcriptional output (H) (n = 3) in two independent HEK293 CRISPR mutant clones and WT controls. Error bars, SD.
Figure 5
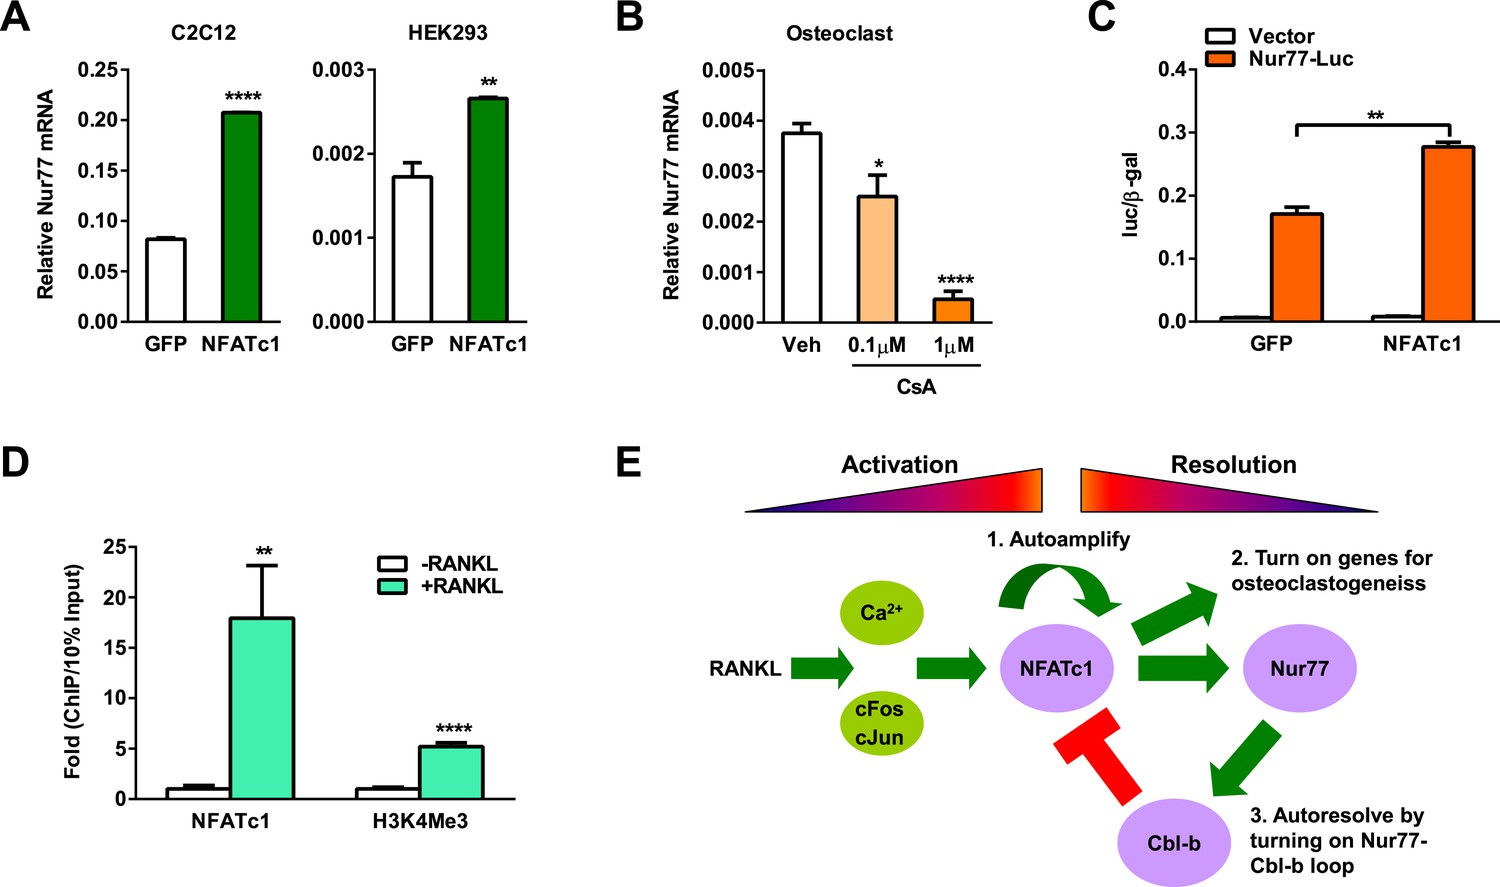
NFATc1 induces Nur77 transcription to elicit a self-limiting loop.
(A) NFATc1 over-expression increased Nur77 mRNA. Mouse myoblast cell line C2C12 or human embryonic kidney cell line HEK293 were transfected with NFATc1 or GFP control. (B) NFATc1 inhibition by Cyclosporin A dosage-dependently decreased Nur77 mRNA. Osteoclast differentiation cultures were treated with Cyclosporin A on day 2 for 24 hr (n = 4). (C) NFATc1 over-expression enhances Nur77 promoter activity. HEK293 cells were transfected with a luciferase vector control or a luciferase reporter driven by a 0.8 Kb Nur77 promoter, together with NFATc1 or GFP control (n = 3). (D) ChIP assay of NFATc1 binding and H3K4me3 level at the endogenous Nur77 promoter in RAW264.7 mouse macrophage cell line with or without 2 day RANKL stimulation. (E) A working model of an NFATc1 self-limiting loop in which NFATc1 elicits its own degradation by inducing Nur77 and consequently Cbl-b to resolve NFATc1 signaling. Error bars, SD.
Figure 6
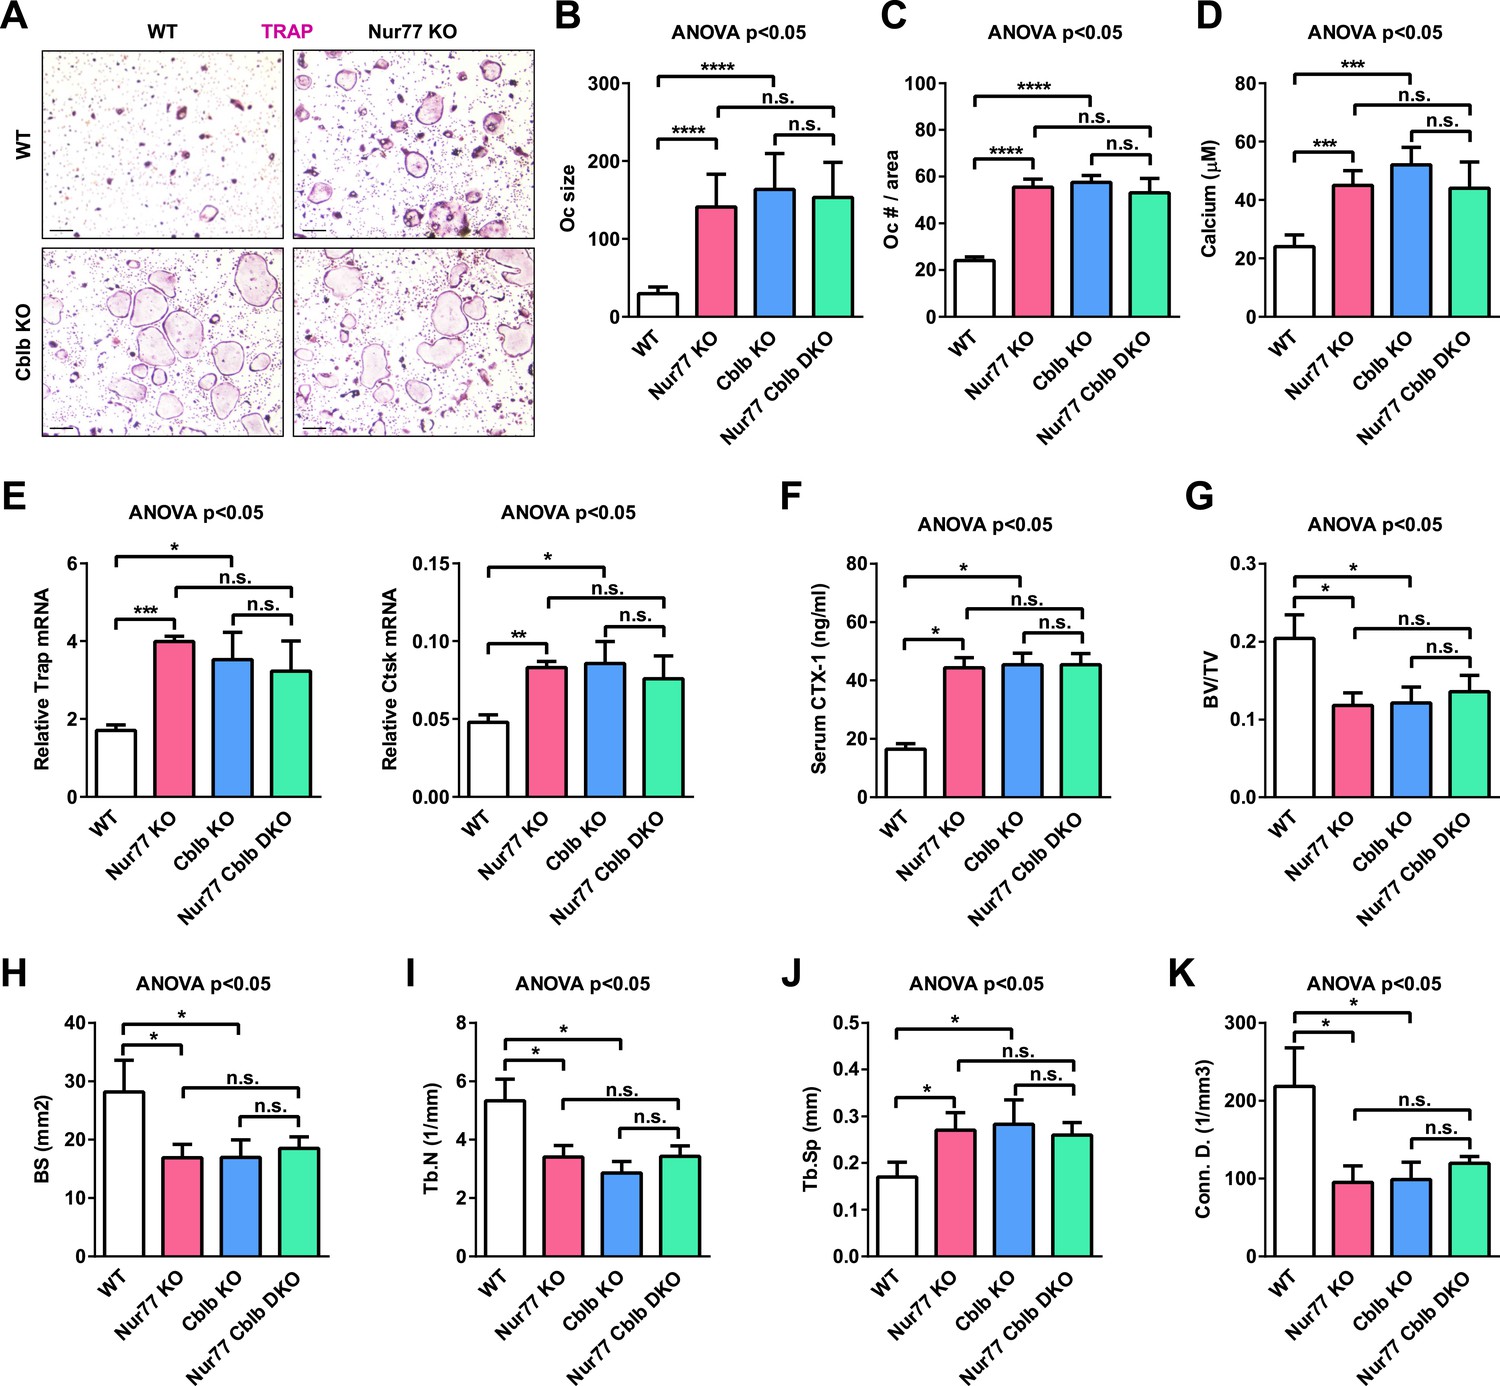
Cbl-b deletion abolishes Nur77 regulation of osteoclastogenesis and bone resorption.
Nur77 Cblb DKO mice were compared with Nur77 KO mice, Cblb KO mice, and WT littermate control mice (3 month old, male, n = 4). (A–E) Ex vivo bone marrow osteoclast differentiation (n = 4 mice in triplicate cultures). (A) Representative images of the TRAP-stained osteoclast differentiation cultures. Mature osteoclasts were identified as multinucleated TRAP+ (purple) cells on day 9. Scale bar, 25 μm. (B) Osteoclast size. (C) Osteoclast number per area. (D) Osteoclast-resorptive activity by calcium release from bone plate to culture medium. (E) Expression of osteoclast differentiation markers on day 3. (F) ELISA analysis of serum CTX-1 bone resorption marker (n = 4). (G–K) μCT analysis of trabecular bone parameters (n = 4). (G) BV/TV, bone volume/tissue volume ratio. (H) BS, bone surface. (I) Tb.N, trabecular number. (J) Tb.Sp, trabecular separation. (K) Conn.D., connectivity density. Statistical analyses were performed with ANOVA followed by the post-hoc Tukey pairwise comparisons. Error bars, SD.
Download links
A two-part list of links to download the article, or parts of the article, in various formats.
Downloads (link to download the article as PDF)
Open citations (links to open the citations from this article in various online reference manager services)
Cite this article (links to download the citations from this article in formats compatible with various reference manager tools)
Nur77 prevents excessive osteoclastogenesis by inducing ubiquitin ligase Cbl-b to mediate NFATc1 self-limitation
eLife 4:e07217.
https://doi.org/10.7554/eLife.07217


