Distinct transcriptional responses elicited by unfolded nuclear or cytoplasmic protein in mammalian cells
- Stanford University, United States
Figures
Figure 1 with 1 supplement
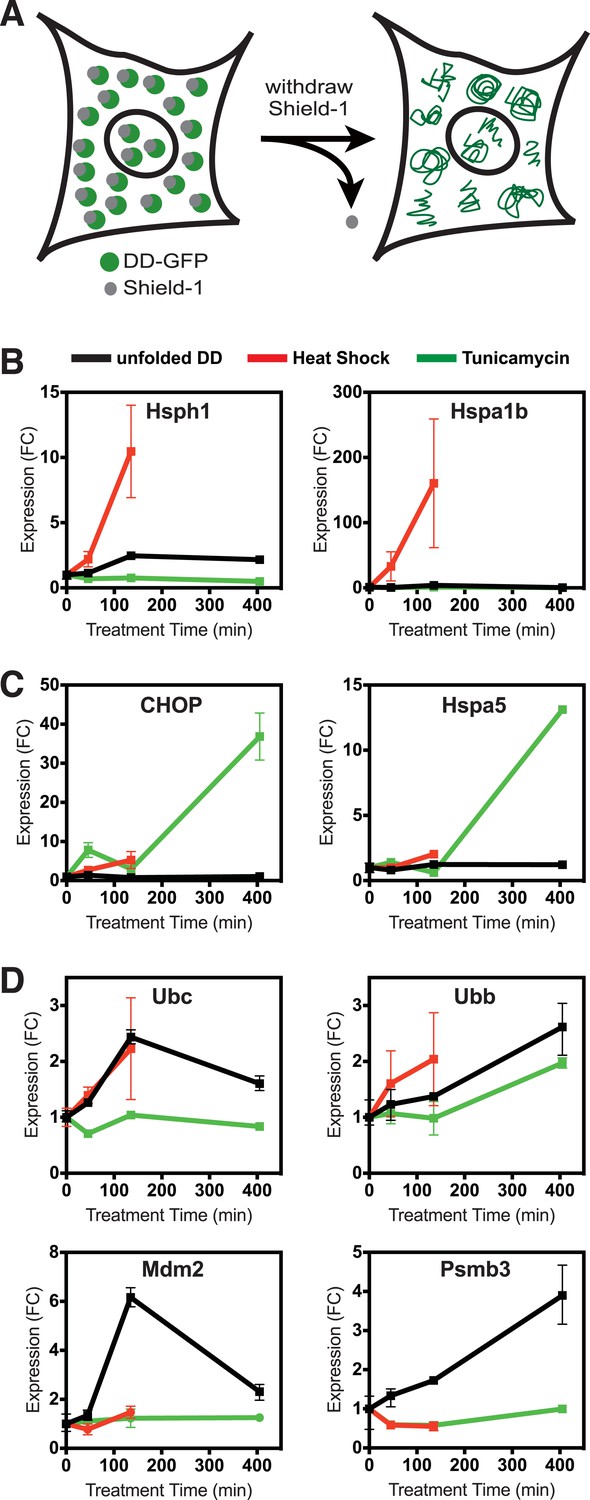
Unfolded DD induces transcriptional response.
(A) Schematic representation of the strategy used to create a unfolded protein in cells using the destabilizing domain (DD). (B–D) Changes in transcript levels measured by mRNA-seq are shown for genes that respond strongly to heat shock (HS) (panel B), tunicamycin (panel C), and the appearance of the unfolded DD (panel D). Transcript levels are shown relative to unperturbed cells. FC = fold-change.
Figure 1—figure supplement 1
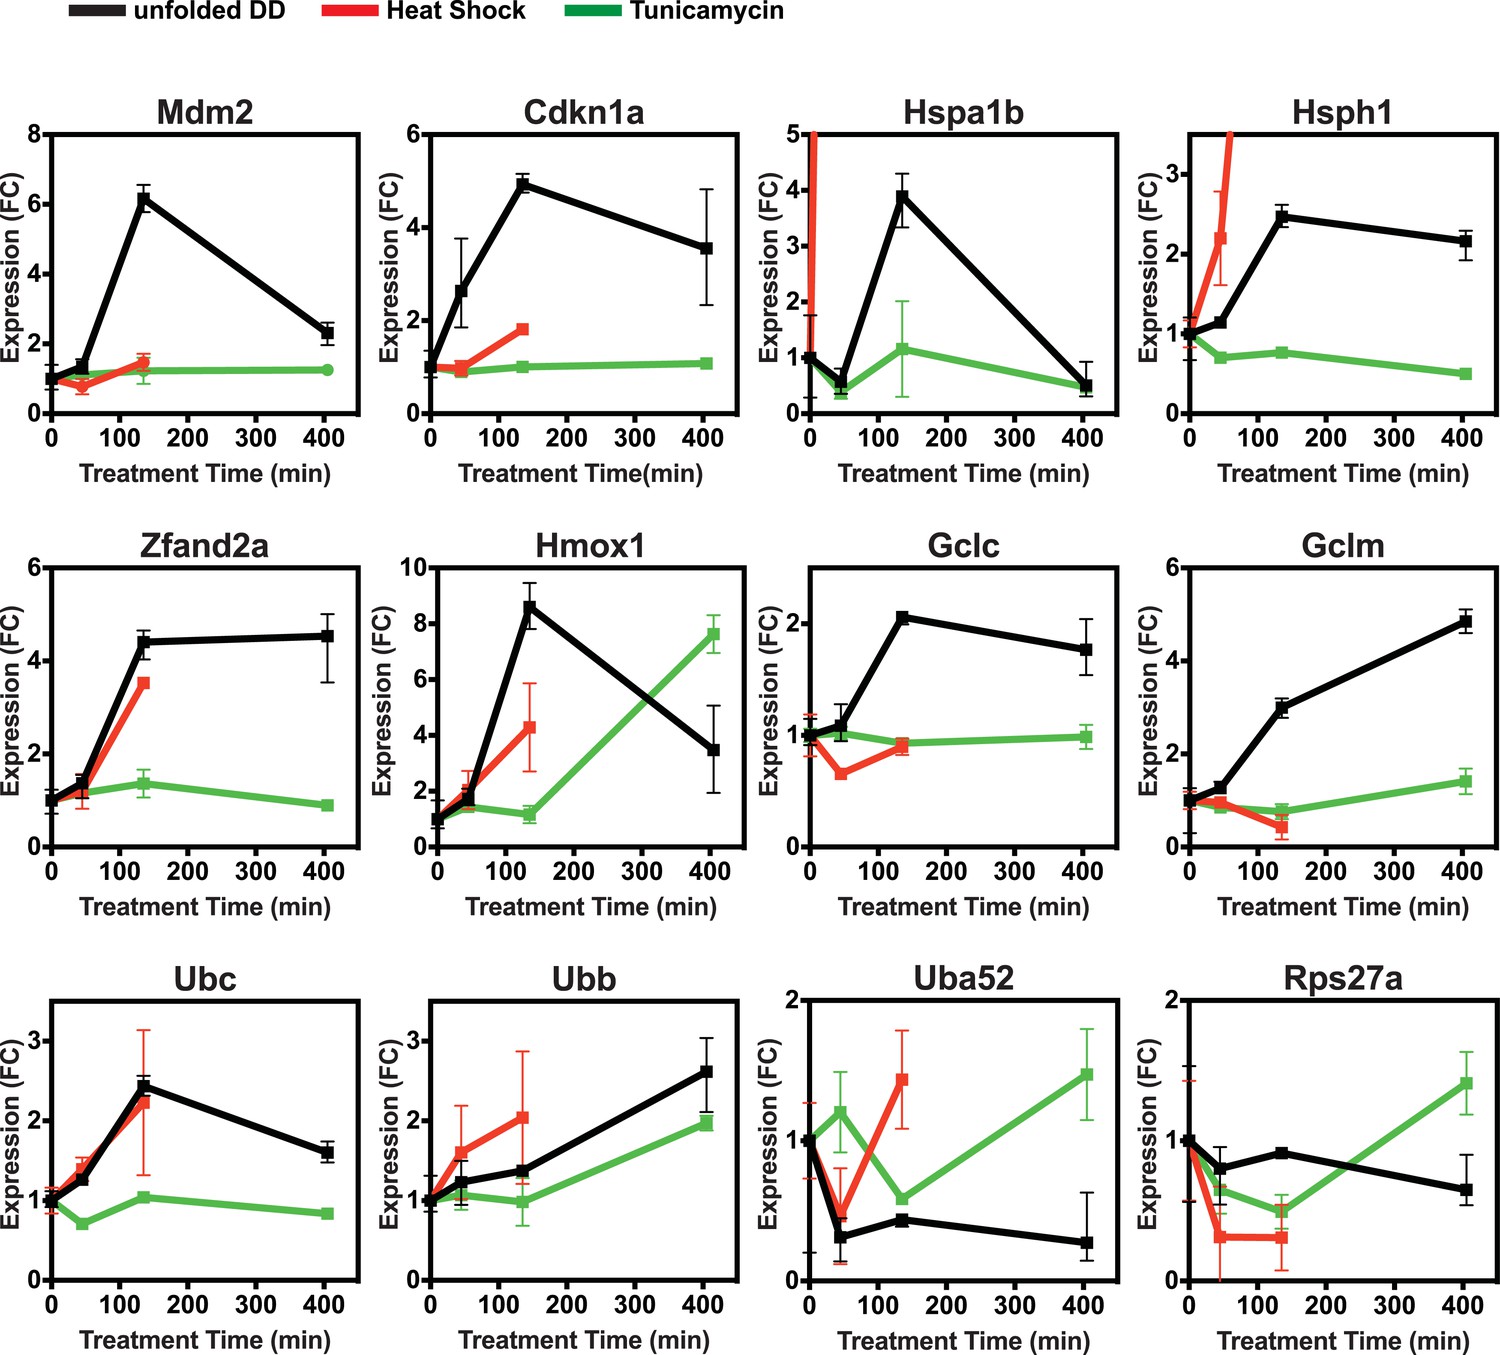
Unfolded DD responsive genes from mRNA-seq.
Changes in transcript levels measured by mRNA-seq are shown for genes that respond strongly to HS (red), tunicamycin (green), and the appearance of the unfolded DD (black). Transcript levels are shown relative to unperturbed cells. FC = fold-change.
Figure 2 with 1 supplement
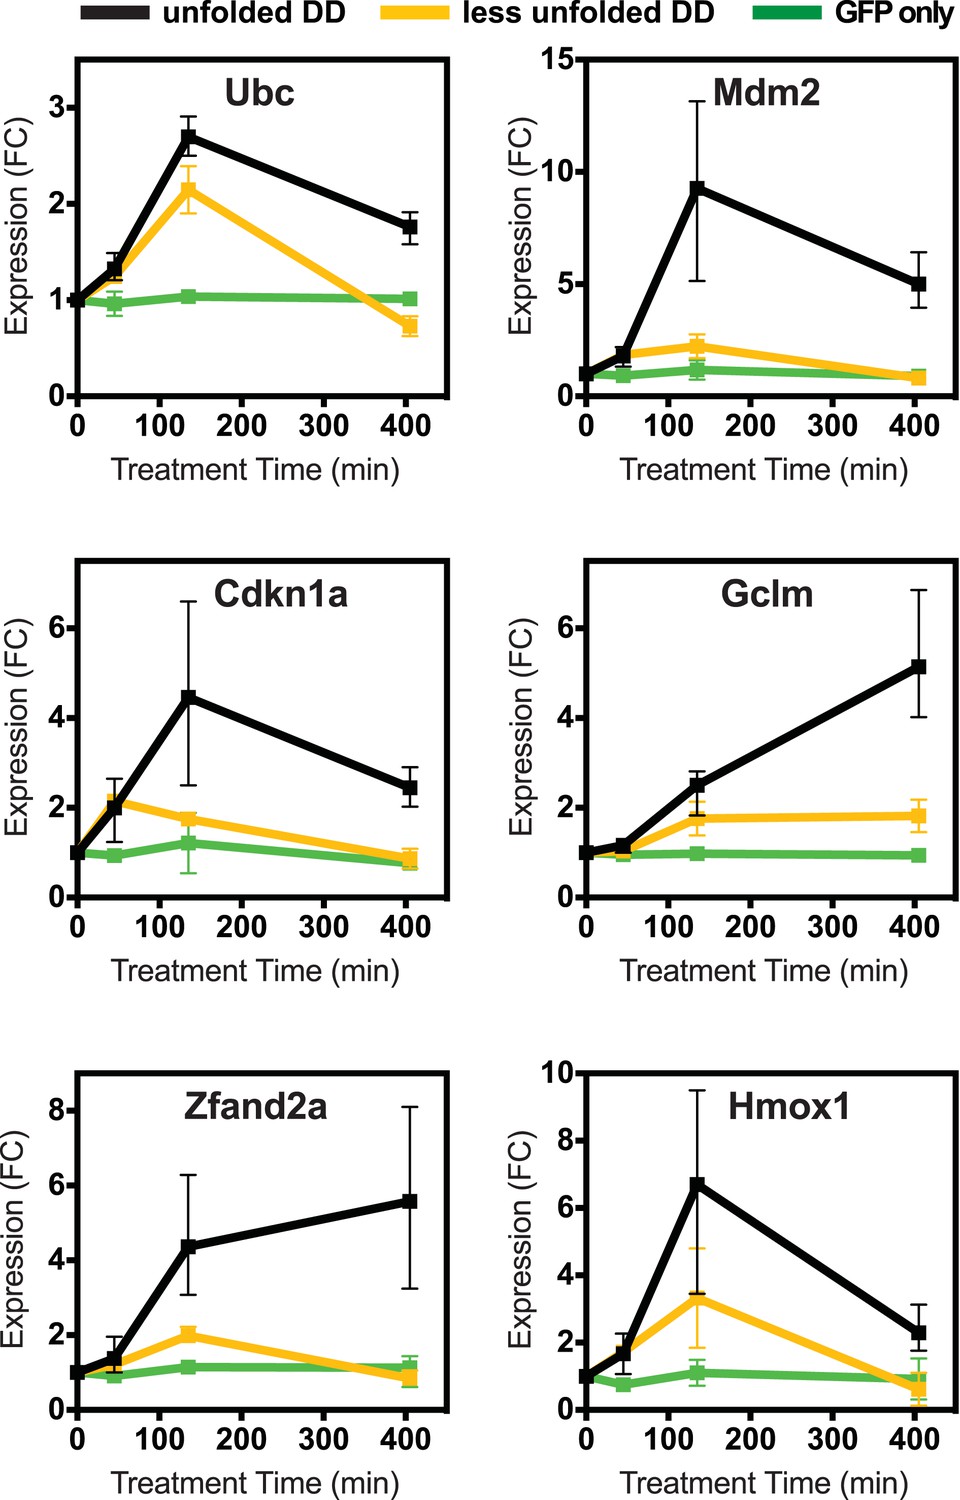
Cellular transcriptional response is dose-dependent.
Unfolded DD was created in two cell lines, which express DD-GFP levels that differ by a factor of three (Figure 2B). Cells were harvested at the indicated times following withdrawal of Shield-1 (S1), and transcript levels were quantified using real-time PCR (RT-qPCR). Transcript levels were normalized to GAPDH and expressed relative to unperturbed samples.
Figure 2—figure supplement 1
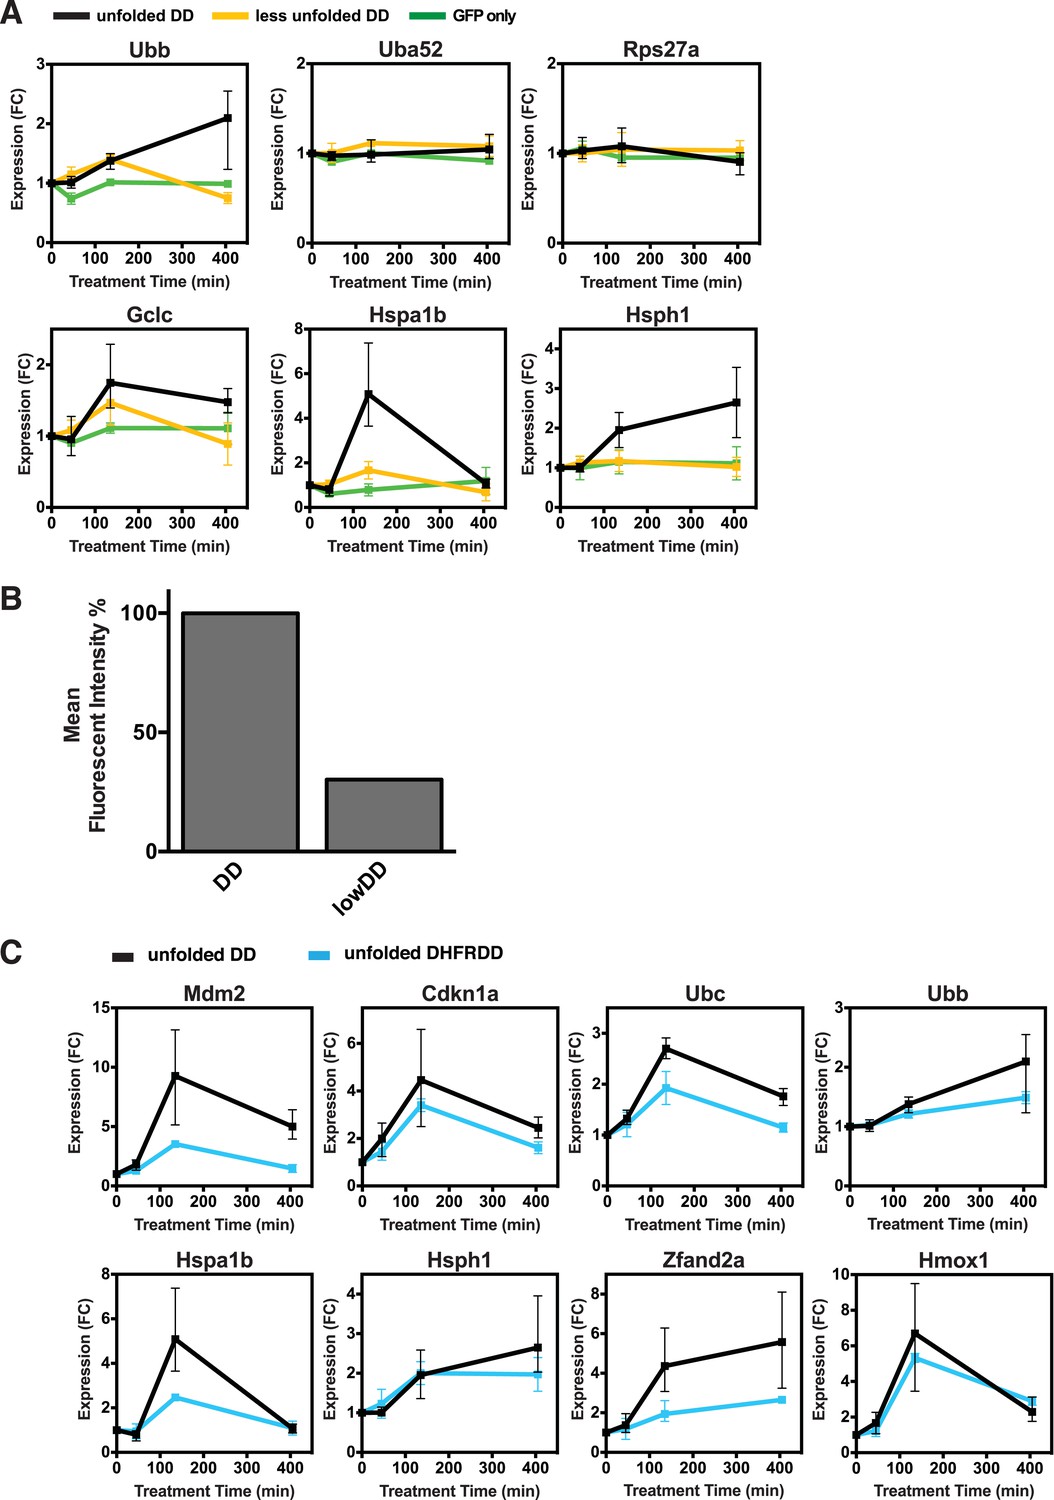
Lower levels of unfolded DD do not induce the stress response, but a different unfolded protein does.
(A) Unfolded DD was created in two NIH3T3 cell lines, which express DD-GFP levels that differ by a factor of three (Figure 2B). Cells were harvested 45, 135, and 405 min following withdrawal of S1, and transcript levels were quantified using RT-qPCR. Transcript levels were normalized to GAPDH and expressed relative to unperturbed samples. (B) Comparison of fluorescent level between DD-GFP cells that were used for the mRNA-seq analysis in Figure 1 and a cell line expressing lower levels of DD-GFP as quantified by analytical flow cytometry. (C) An NIH3T3 cell line was made expressing the DD derived from Escherichia coli DHFR. Unfolded DD was induced by withdrawal of trimethoprim, and transcript levels were quantified using RT-qPCR. Transcript levels were normalized to GAPDH and expressed relative to unperturbed samples.
Figure 3
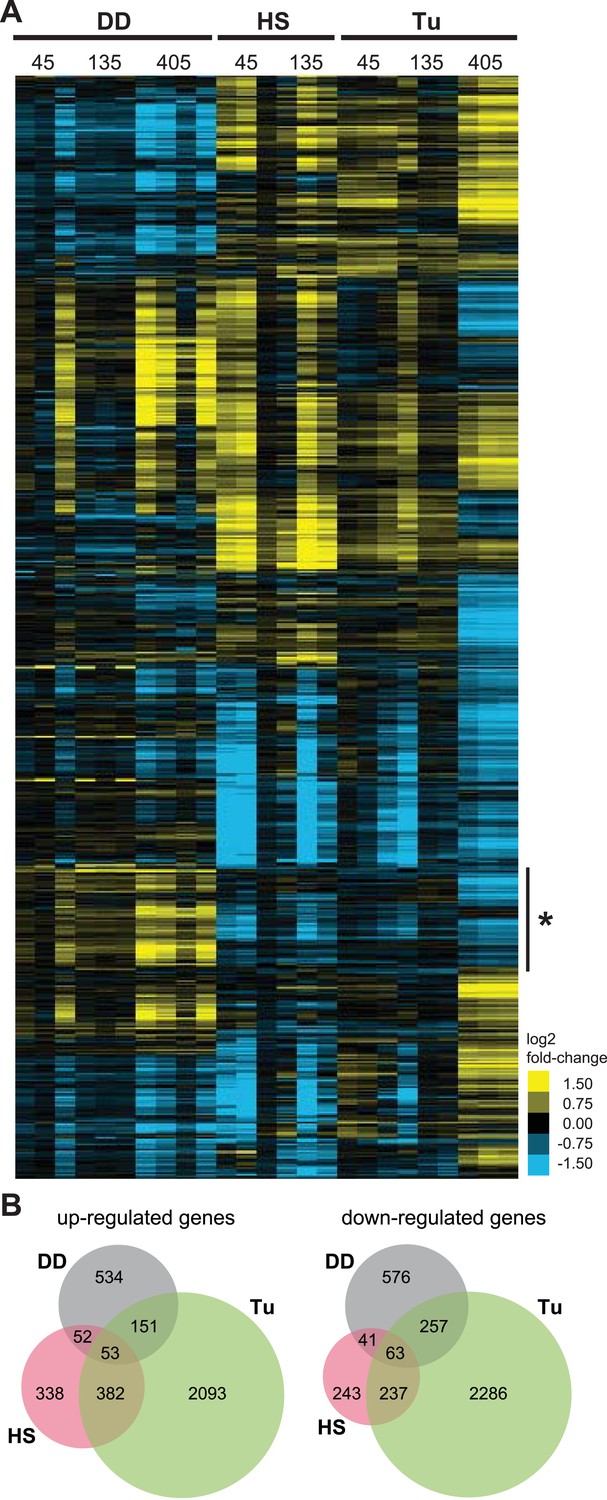
Transcriptome profiles of unfolded DD compared to HS and ER stress.
(A) NIH3T3 cells expressing DD-GFP in the presence of S1 were perturbed by HS (42°C), treatment with 5 μM tunicamycin, or by withdrawal of S1 to create unfolded DD. Cells were harvested 45, 135, and 405 min following these perturbations, and transcript levels were quantified using mRNA-seq. Genes responding to any of the three perturbations (false discovery rate [FDR] <0.05) were hierarchically clustered to examine the relationships between the expression patterns. Each row represents a gene and each column is an experimental replicate. Transcript changes are represented as log2 fold-changes relative to unperturbed samples. (B) Venn diagram depicting significantly induced and repressed genes (FDR <0.05) from each of the three treatments: unfolded DD, HS, and tunicamycin treatment (Tu).
Figure 4 with 1 supplement
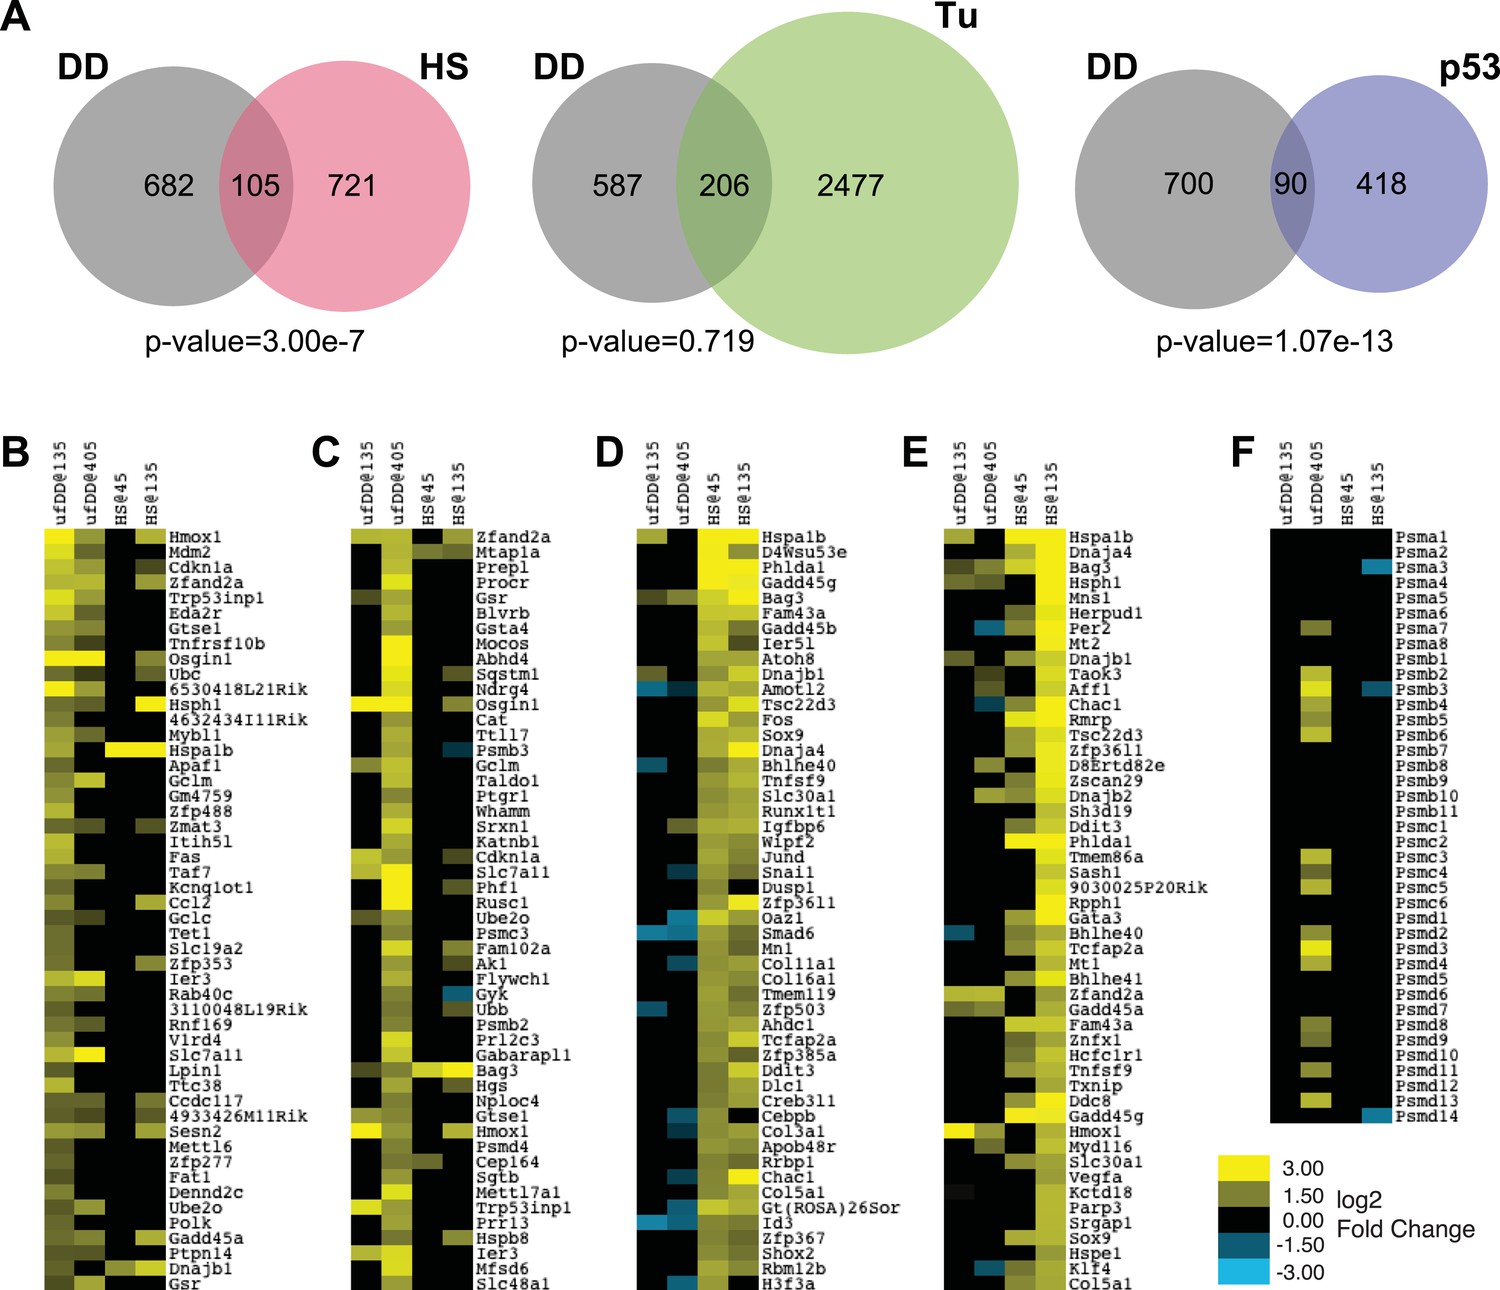
Comparison of unfolded DD stress with known stress responses.
(A) Venn diagram showing pairwise comparisons of the genes induced by unfolded DD (gray) with the genes induced by the HS response (HSR) (red), the erUPR (green), and the p53-mediated response to DNA damage (blue). The list of p53-induced genes is from Kenzelmann Broz et al. (2013). The p-values are calculated by hypergeometric test. (B–E) Heatmap representations of genes responding to unfolded DD or HS. The 50 most significantly induced genes are shown for each condition to facilitate comparison with the other perturbations and timepoints. The genes are sorted by statistical significance for the unfolded DD at 135 min (panel B) and 405 min (panel C) and for HS at 45 min (panel D) and 135 min (panel E). (F) Heatmap showing how 39 genes encoding proteasome subunits respond to either unfolded DD or HS. For panels B–F, black indicates no significant changes in transcript levels.
Figure 4—figure supplement 1
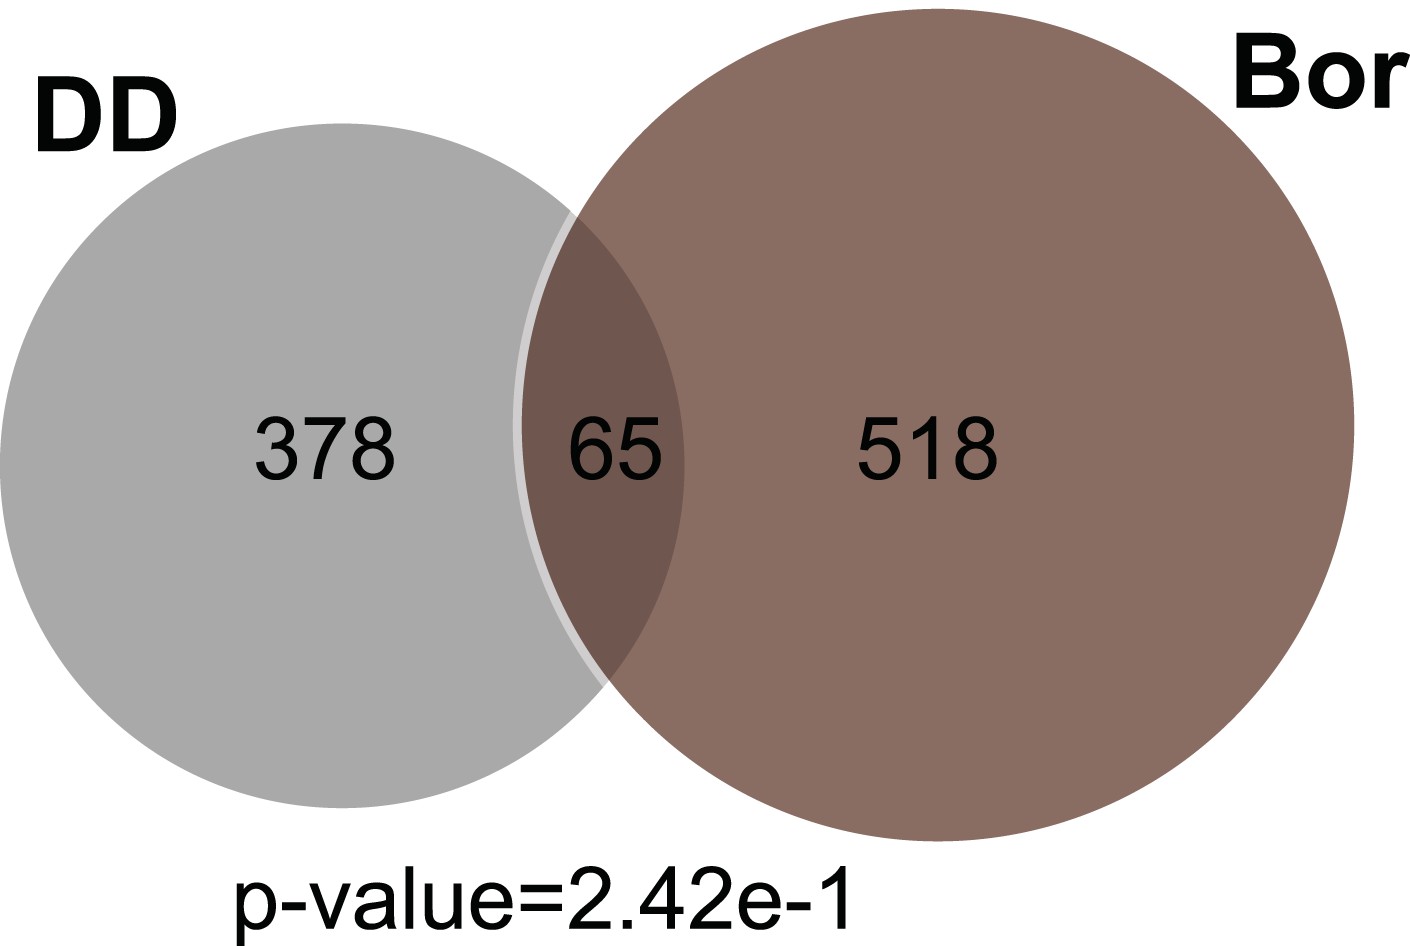
Comparison of the unfolded DD stress with proteasome inhibition.
Venn diagram showing pairwise comparisons of the genes induced by unfolded DD (gray) with the genes induced by proteasome inhibition using bortezomib (brown) The p-values are calculated by hypergeometric test.
Figure 5 with 2 supplements
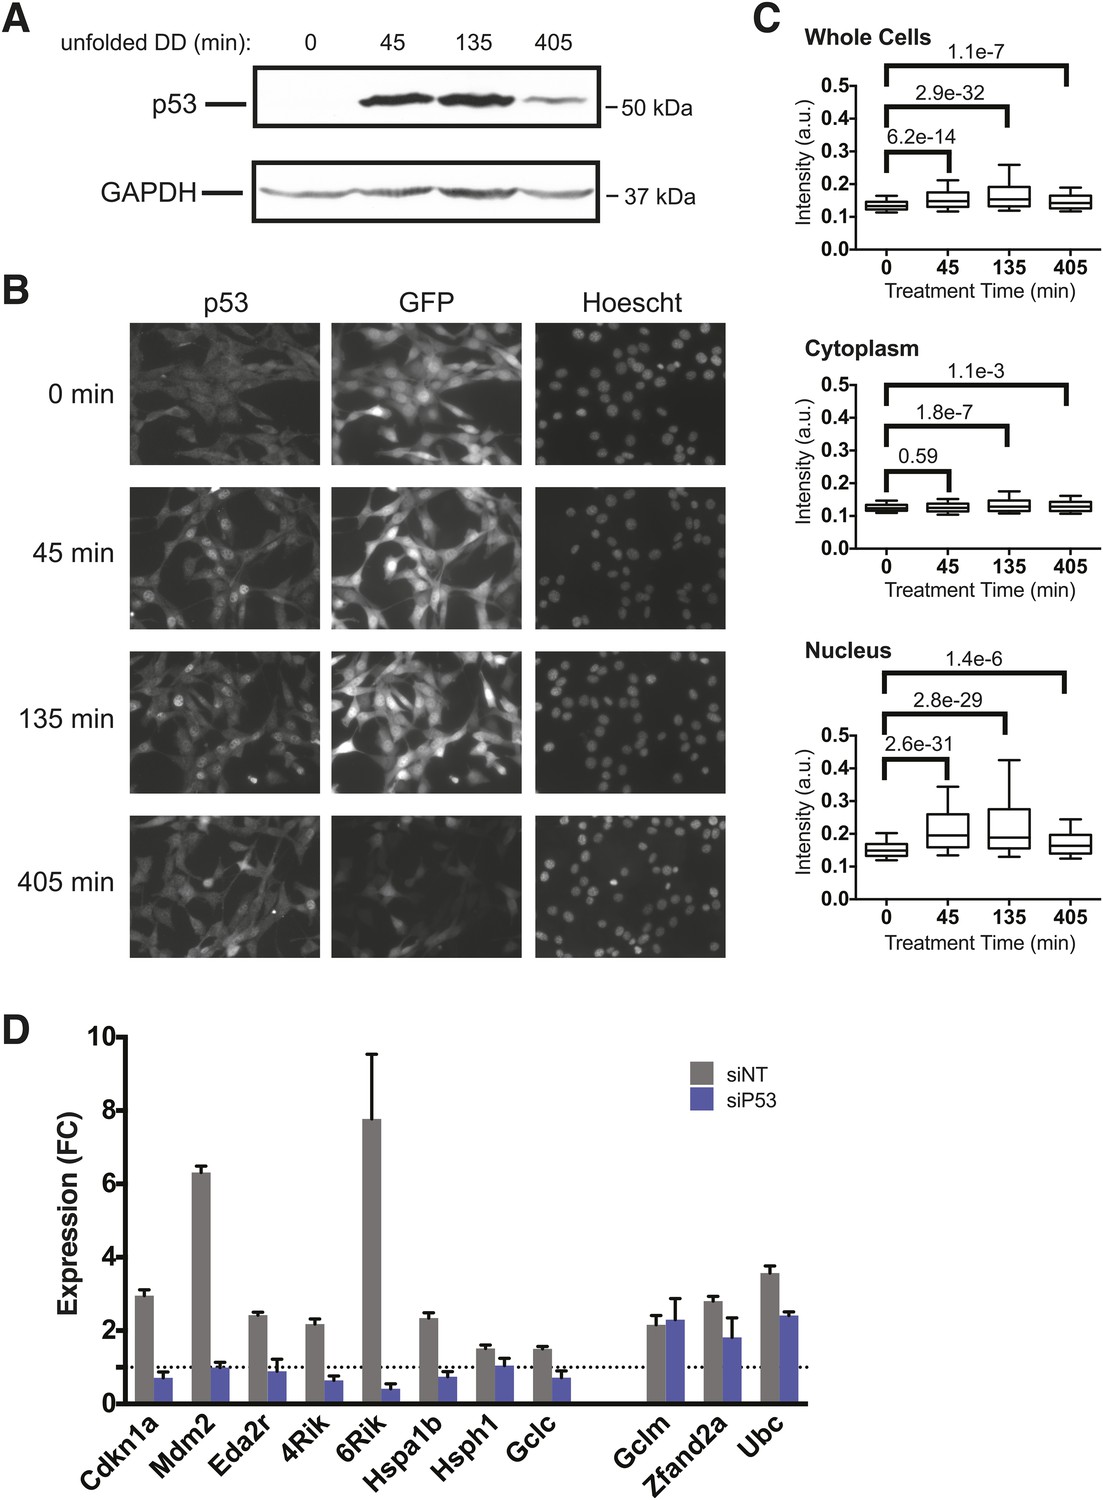
p53 protein accumulates upon appearance of the unfolded DD.
(A) S1 was withdrawn from NIH3T3 cells expressing the DD-GFP fusion protein for the indicated times, and equal amounts of total protein were immunoblotted with antibodies against p53 or GAPDH. (B) S1 was withdrawn from cells expressing DD-GFP, and the cells were fixed at the indicated times. The levels of p53 and GFP were quantified using indirect immunofluorescence, and Hoechst 33,342 was used to image nuclei. (C) Quantification of the p53 signal observed in whole cells, cytoplasm, or nuclei from immunofluorescence data. The Welch test was used to calculate p-values. (D) Cells expressing DD-GFP stabilized by S1 were treated with siRNA pools against p53, cultured for 2 days, then RNA was harvested for RT-qPCR analysis 135 min following withdrawal of S1. Transcript levels for the indicated genes were normalized to GAPDH and expressed as fold-change relative to unperturbed cells. siNT = non-targeting control.
Figure 5—figure supplement 1
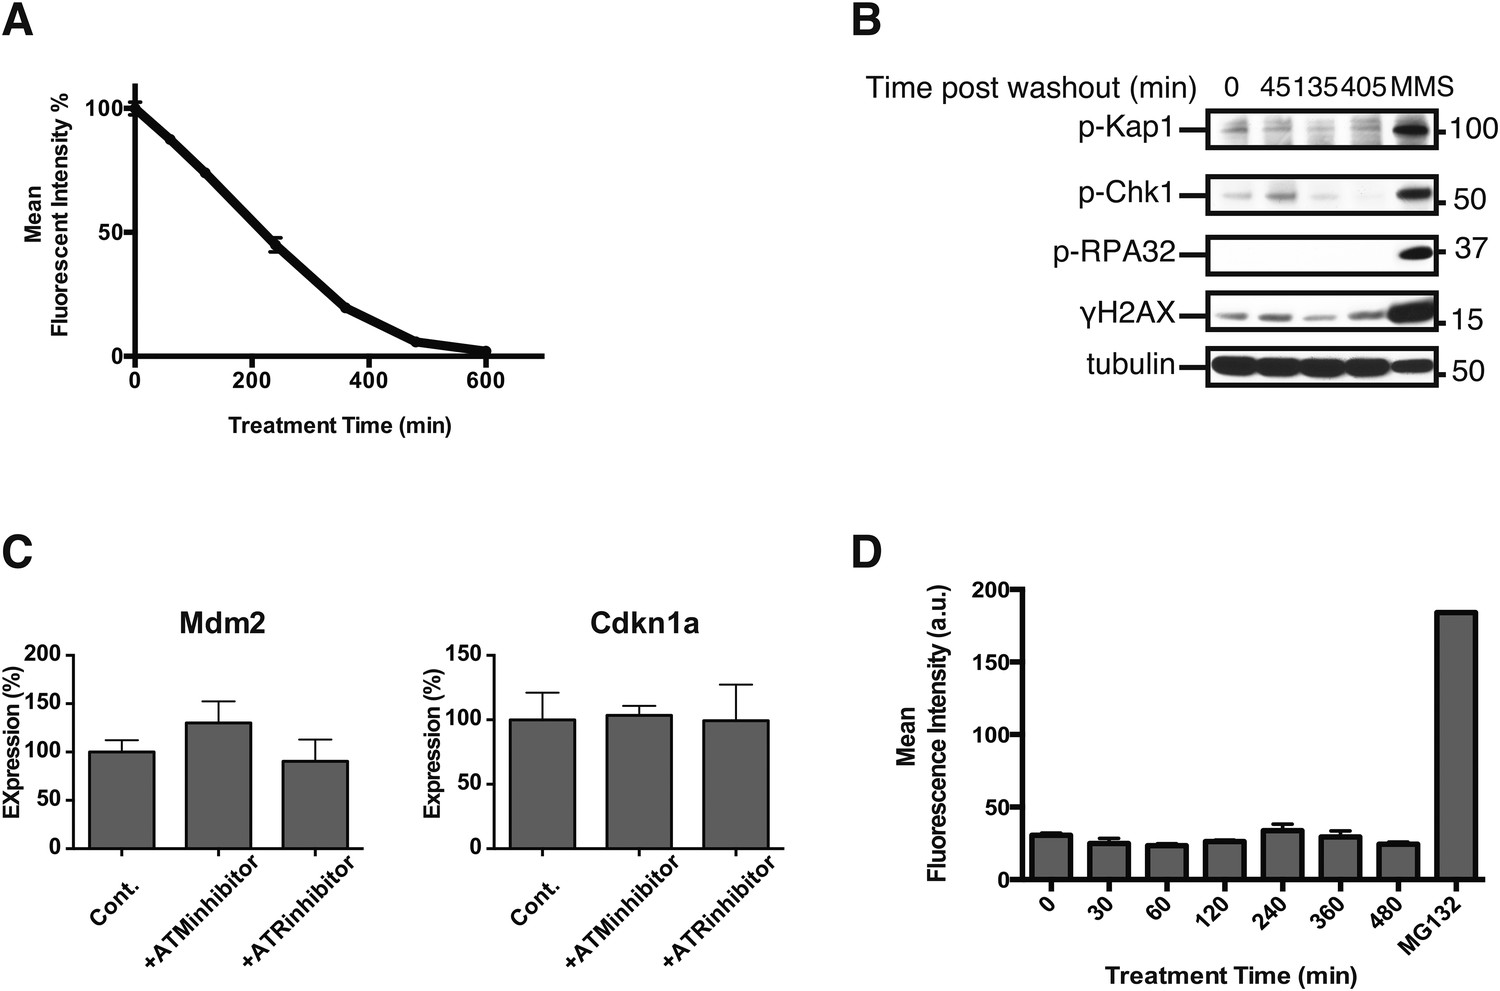
Investigating potential sources of p53 activation.
(A) S1 was withdrawn from cultures of NIH3T3 cells stably transduced with the DD-GFP fusion protein, and the rate of DD-GFP degradation was quantified using analytical flow cytometry. (B) Unfolded DD was induced in cells expressing DD-GFP by S1 withdrawal, and cells were harvested at the indicated times. Lysates were resolved by SDS-PAGE and immunoblotted with the indicated antibodies. Tubulin is the loading control. Methyl methanesulfonate (MMS) was used as the positive control for DNA damage. (C) Unfolded DD was induced in NIH3T3 cells that were treated with vehicle or with inhibitors of the ATM or ATR kinases. RNA was harvested at 135 min and analyzed using RT-qPCR. ATM inhibitor: 3 μM KU-55933 and the ATR inhibitor: 2 μM 4-{4-[(3R)-3-methylmorpholin-4-yl]-6-[4-(methylsulfonyl)piperidin-4-yl]-pyrimidin-2-yl}-1H-indole. (D) Unfolded DD was induced in NIH3T3 cells stably expressing DD-mCherry that were treated with vehicle or CM-H2DCFDA. 2 hr of treatment with 10 μM MG132 was the positive control.
Figure 5—figure supplement 2

Involvement of other transcription factors.
(A) Cells expressing DD-GFP stabilized by S1 were treated with siRNA pools against HSF1, cultured for 2 days, then RNA was harvested for RT-qPCR analysis 135 min following withdrawal of S1. Transcript levels for the indicated genes were normalized to GAPDH and expressed as fold-change relative to unperturbed cells. siNT = non-targeting control. (B) Cells expressing DD-GFP stabilized by S1 were treated with siRNA pools against NRF2, cultured for 2 days, then RNA was harvested for RT-qPCR analysis 135 min following withdrawal of S1. Transcript levels for the indicated genes were normalized to GAPDH and expressed as fold-change relative to unperturbed cells. siNT = non-targeting control. (C) Cells expressing DD-GFP stabilized by S1 were treated with siRNA pools against p53, cultured for 2 days, then RNA was harvested for RT-qPCR analysis to quantify the RNA level of p53. (D) Cells expressing DD-GFP stabilized by S1 were treated with siRNA pools against HSF1, cultured for 2 days, then RNA was harvested for RT-qPCR analysis to quantify the RNA level of HSF1. (E) Cells expressing DD-GFP stabilized by S1 were treated with siRNA pools against NRF2, cultured for 2 days, then RNA was harvested for RT-qPCR analysis to quantify the RNA level of NRF2.
Figure 6 with 1 supplement
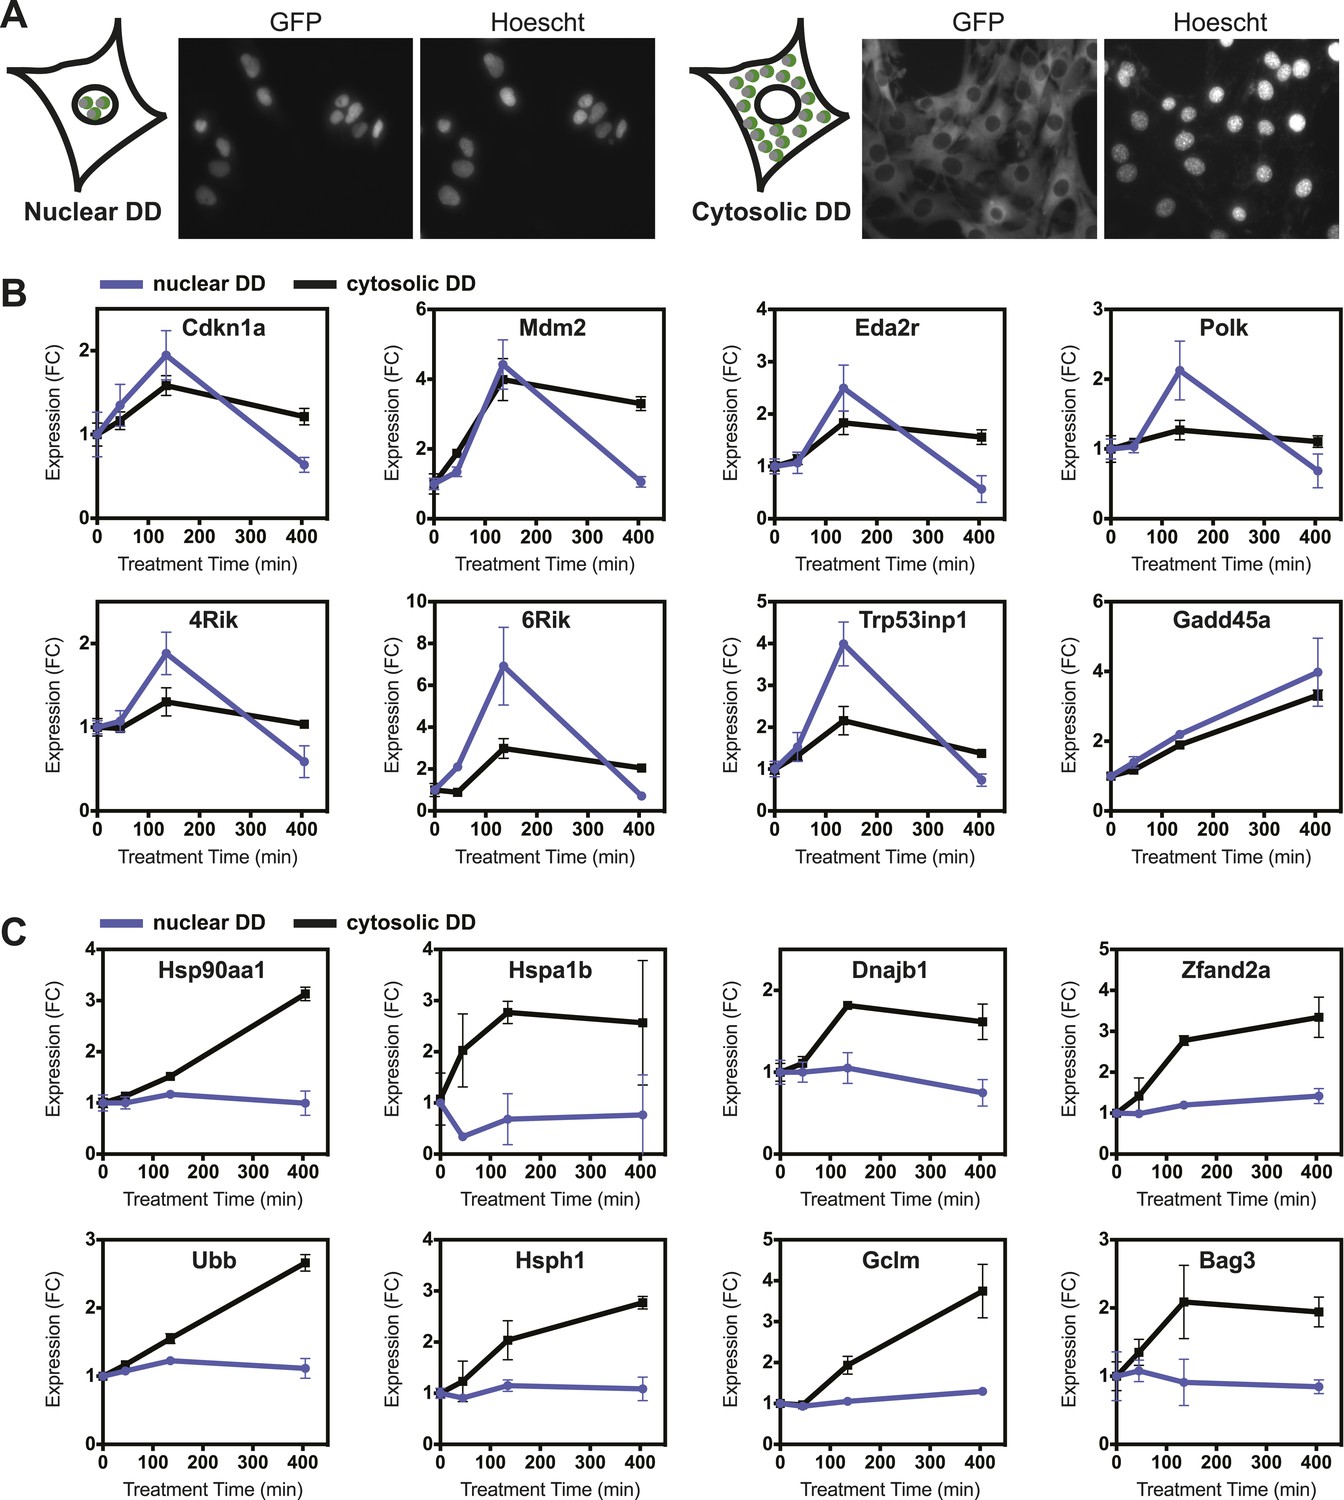
Nuclear or cytosolic unfolded proteins elicit distinct responses.
(A) Images of live NIH3T3 cells stably expressing nuclear DD-GFP or cytosolic DD-GFP. Hoechst 33,342 was used to image nuclei. (B, C) Unfolded DD was induced by withdrawal of S1, and transcript levels of specific genes were quantified using RT-qPCR at the indicated times. Genes that respond more strongly to nuclear unfolded DD are shown in panel B, and genes that are induced by cytosolic unfolded DD are shown in panel C. Transcript levels were normalized to GAPDH and expressed relative to unperturbed samples.
Figure 6—figure supplement 1
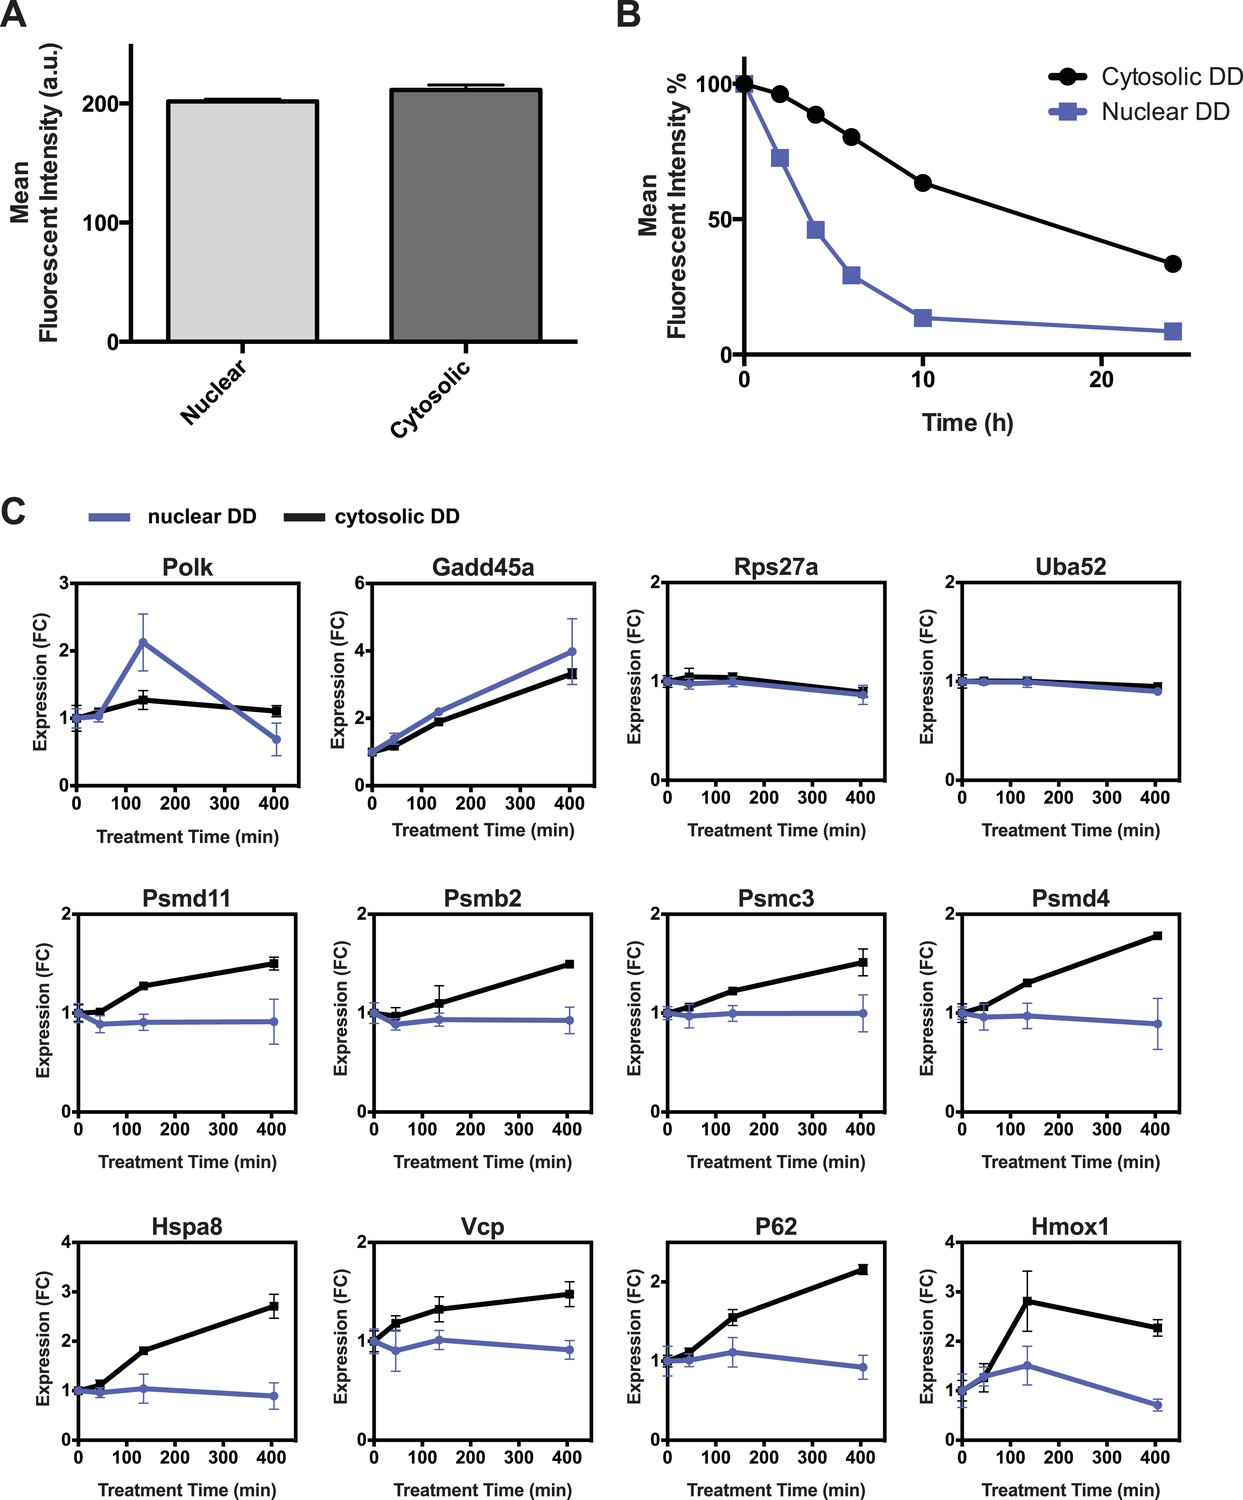
Additional comparisons of nuclear vs cytosolic unfolded protein stress.
(A) Comparison of fluorescent level between nuclear DD cells and cytosolic DD cells by analytical flow cytometry. (B) Flow cytometry data of the kinetics of nuclear DD-GFP and cytosolic DD-GFP degradation. NIH3T3 cells stably transduced with the DD-GFP fusions were cultured with S1 1 μM. The S1 was withdrawn and the decrease in fluorescence was monitored. (C) S1 was withdrawn from cultures of NIH3T3 cells stably expressing the nuclear or the cytosolic DD-GFP fusion protein, and transcript levels of the designated genes were quantified using RT-qPCR. Transcript levels were normalized to GAPDH and expressed relative to unperturbed samples.
Figure 7 with 1 supplement
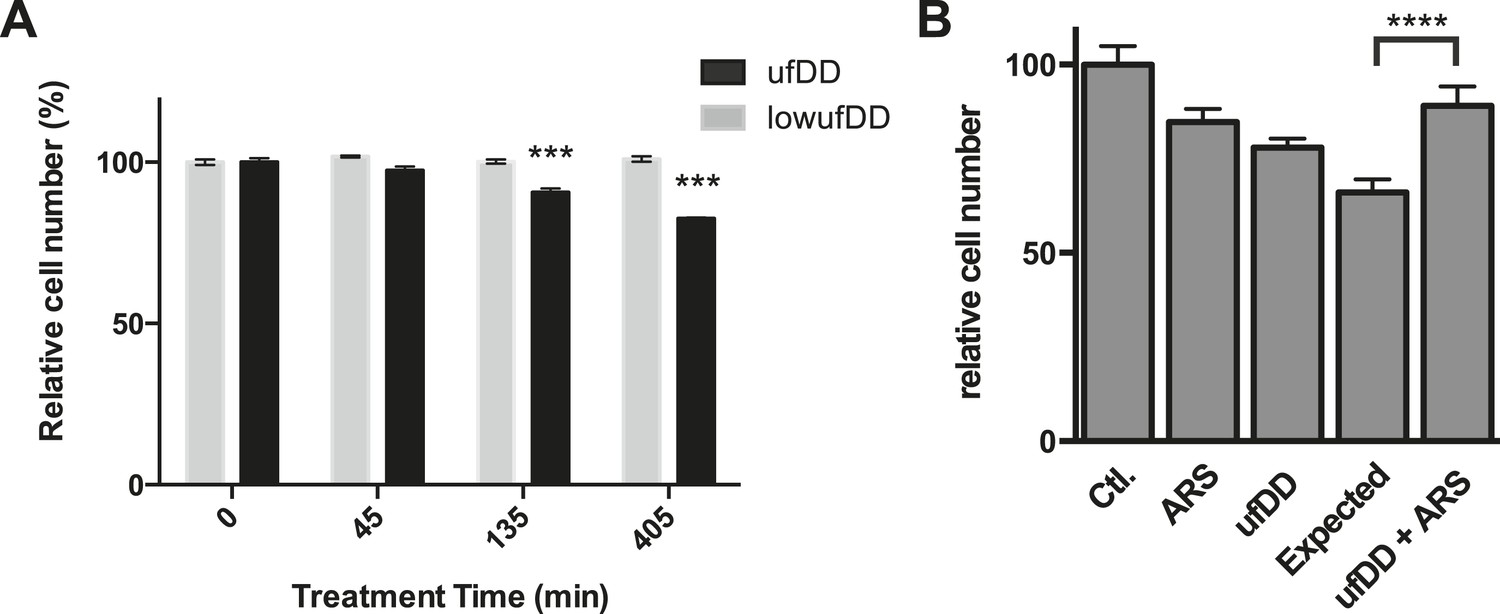
The cUPR provides protection against subsequent proteotoxic stress.
(A) NIH3T3 cells expressing DD-GFP were co-cultured with unmodified 3T3 cells in the presence of 1 μM S1. The stabilizing S1 was withdrawn for 45, 135, or 405 min and then re-administered to the cells for an additional 17 hr. Analytical flow cytometry was used to quantify the relative populations of each cell type. The experiment was performed in triplicate for populations of cells expressing high levels of DD-GFP that induce the unfolded DD stress response (ufDD, black) as well as the cell line expressing threefold lower levels of DD-GFP (low ufDD, gray) as shown in Figure 2B. (B) Cells expressing DD-GFP were co-cultured with unmodified 3T3 cells in a 24-well plate. One group of cells was not exposed to stress from either the unfolded DD or 30 μM aqueous sodium arsenite (Ctl). The second group was exposed to arsenite only (ARS). The third group experienced the unfolded DD by withdrawal of S1 (shown as ufDD), and the fourth group was exposed to the unfolded DD followed by arsenite stress (ufDD + ARS). The relative populations of each cell type were quantified using analytical flow cytometry, with the control sample as the reference point for cells expressing DD-GFP. Expected = predicted fraction of DD-GFP cells assuming the unfolded DD and arsenite are additive. *** p-value < 0.001 by Welch's test, **** p-value < 0.0001 by Welch's test.
Figure 7—figure supplement 1
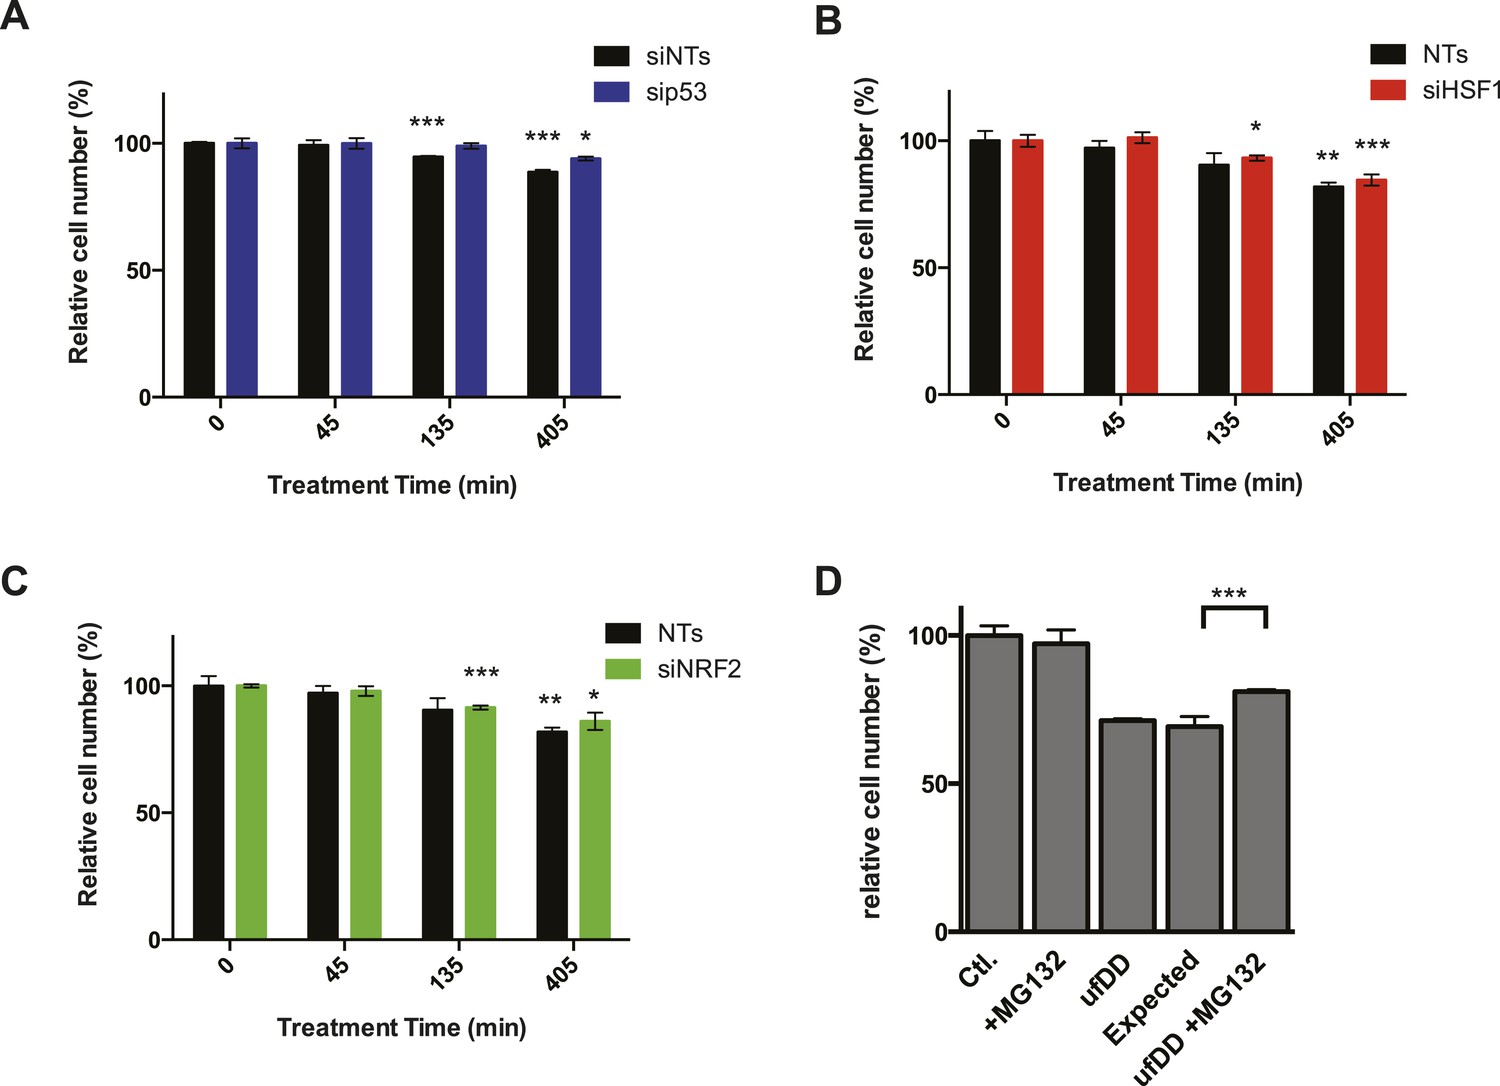
The effect of transcription factors on cell growth.
(A) NIH3T3 cells expressing DD-GFP were co-cultured with unmodified 3T3 cells in the presence of 1 μM S1. The stabilizing S1 was withdrawn for 45, 135, or 405 min and then re-administered to the cells for an additional 17 hr. Analytical flow cytometry was used to quantify the relative populations of each cell type. The experiment was performed in triplicate for populations of cells expressing high levels of DD-GFP experiencing siRNA of p53 (blue) as well as the cell line experiencing non-target siRNA (siNT, black). (B) NIH3T3 cells expressing DD-GFP were co-cultured with unmodified 3T3 cells in the presence of 1 μM S1. The stabilizing S1 was withdrawn for 45, 135, or 405 min and then re-administered to the cells for an additional 17 hr. Analytical flow cytometry was used to quantify the relative populations of each cell type. The experiment was performed in triplicate for populations of cells expressing high levels of DD-GFP experiencing siRNA of HSF1 (red) as well as the cell line experiencing non-target siRNA (siNT, black). (C) NIH3T3 cells expressing DD-GFP were co-cultured with unmodified 3T3 cells in the presence of 1 μM S1. The stabilizing S1 was withdrawn for 45, 135, or 405 min and then re-administered to the cells for an additional 17 hr. Analytical flow cytometry was used to quantify the relative populations of each cell type. The experiment was performed in triplicate for populations of cells expressing high levels of DD-GFP experiencing siRNA of NRF2 (green) as well as the cell line experiencing non-target siRNA (siNT, black). (D) Cells expressing DD-GFP were co-cultured with unmodified 3T3 cells in a 24-well plate. One group of cells was not exposed to stress from either the unfolded DD or 10 μM MG132 (Ctl). The second group was exposed to MG132 only (MG132). The third group experienced the unfolded DD by withdrawal of S1 (shown as ufDD), and the fourth group was exposed to the unfolded DD stress followed by proteotoxic stress (ufDD + MG132). The relative populations of each cell type were quantified using analytical flow cytometry, with the control sample as the reference point for cells expressing DD-GFP. Expected = predicted fraction of DD-GFP cells assuming unfolded DD and MG132 are additive. ** p-value < 0.05 by Welch's test, ** p-value < 0.01 by Welch's test, *** p-value < 0.001 by Welch's test.
Additional files
-
Supplementary file 1
List of genes significantly up- or down-regulated by the three stress conditions (false discovery rate [FDR] <0.05).
- https://doi.org/10.7554/eLife.07687.017
-
Supplementary file 2
mRNA-seq data from all three perturbations.
- https://doi.org/10.7554/eLife.07687.018
-
Supplementary file 3
Gene ontology analysis for genes responding to unfolded destabilizing domain (DD) stress.
- https://doi.org/10.7554/eLife.07687.019
-
Supplementary file 4
Gene ontology analysis for genes responding to unfolded destabilizing domain (DD) stress in different timepoints.
- https://doi.org/10.7554/eLife.07687.020
-
Supplementary file 5
mRNA-seq data from bortezomib perturbations.
- https://doi.org/10.7554/eLife.07687.021
-
Supplementary file 6
List of primers used in RT-qPCR experiments in this paper.
- https://doi.org/10.7554/eLife.07687.022
Download links
A two-part list of links to download the article, or parts of the article, in various formats.
Downloads (link to download the article as PDF)
Open citations (links to open the citations from this article in various online reference manager services)
Cite this article (links to download the citations from this article in formats compatible with various reference manager tools)
Distinct transcriptional responses elicited by unfolded nuclear or cytoplasmic protein in mammalian cells
eLife 4:e07687.
https://doi.org/10.7554/eLife.07687


